


方案详情
文
不同环境条件下向日葵基因型×环境相互作用的研究Investigation of Genotype × Environment Interaction in Some Sunflower (Helianthus annuus L.) Genotypes in Different Environmental Conditions
方案详情

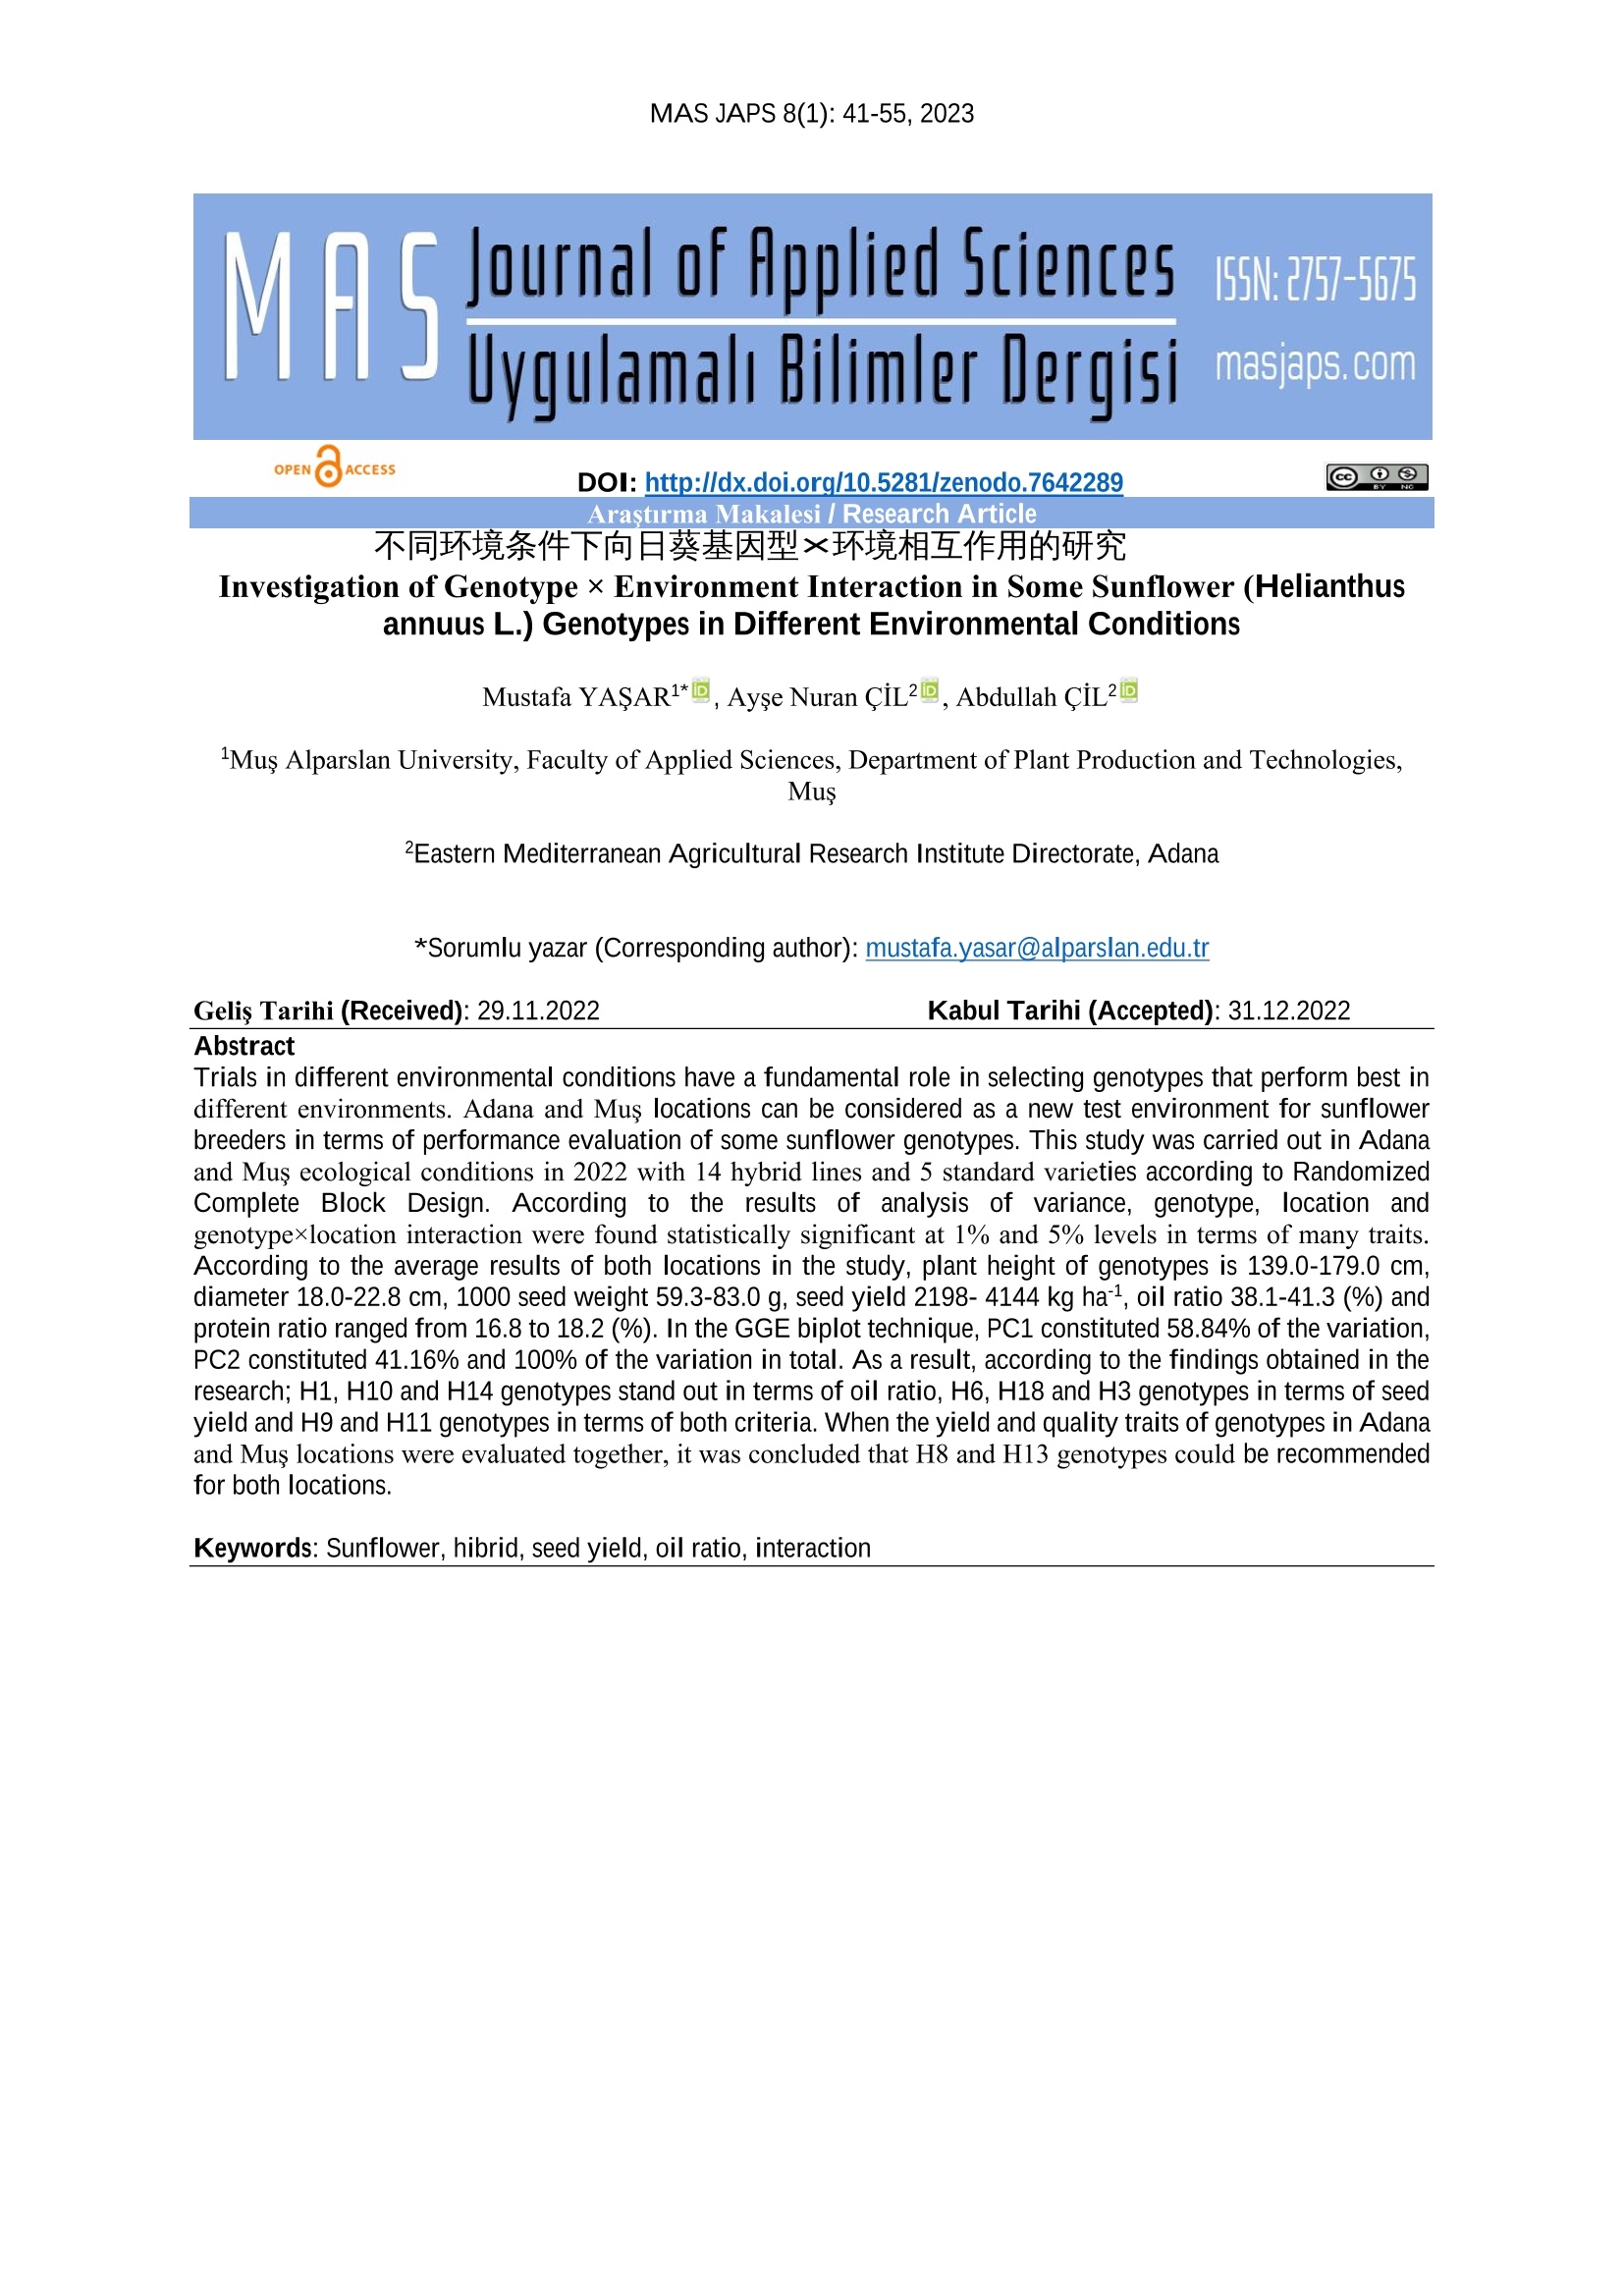
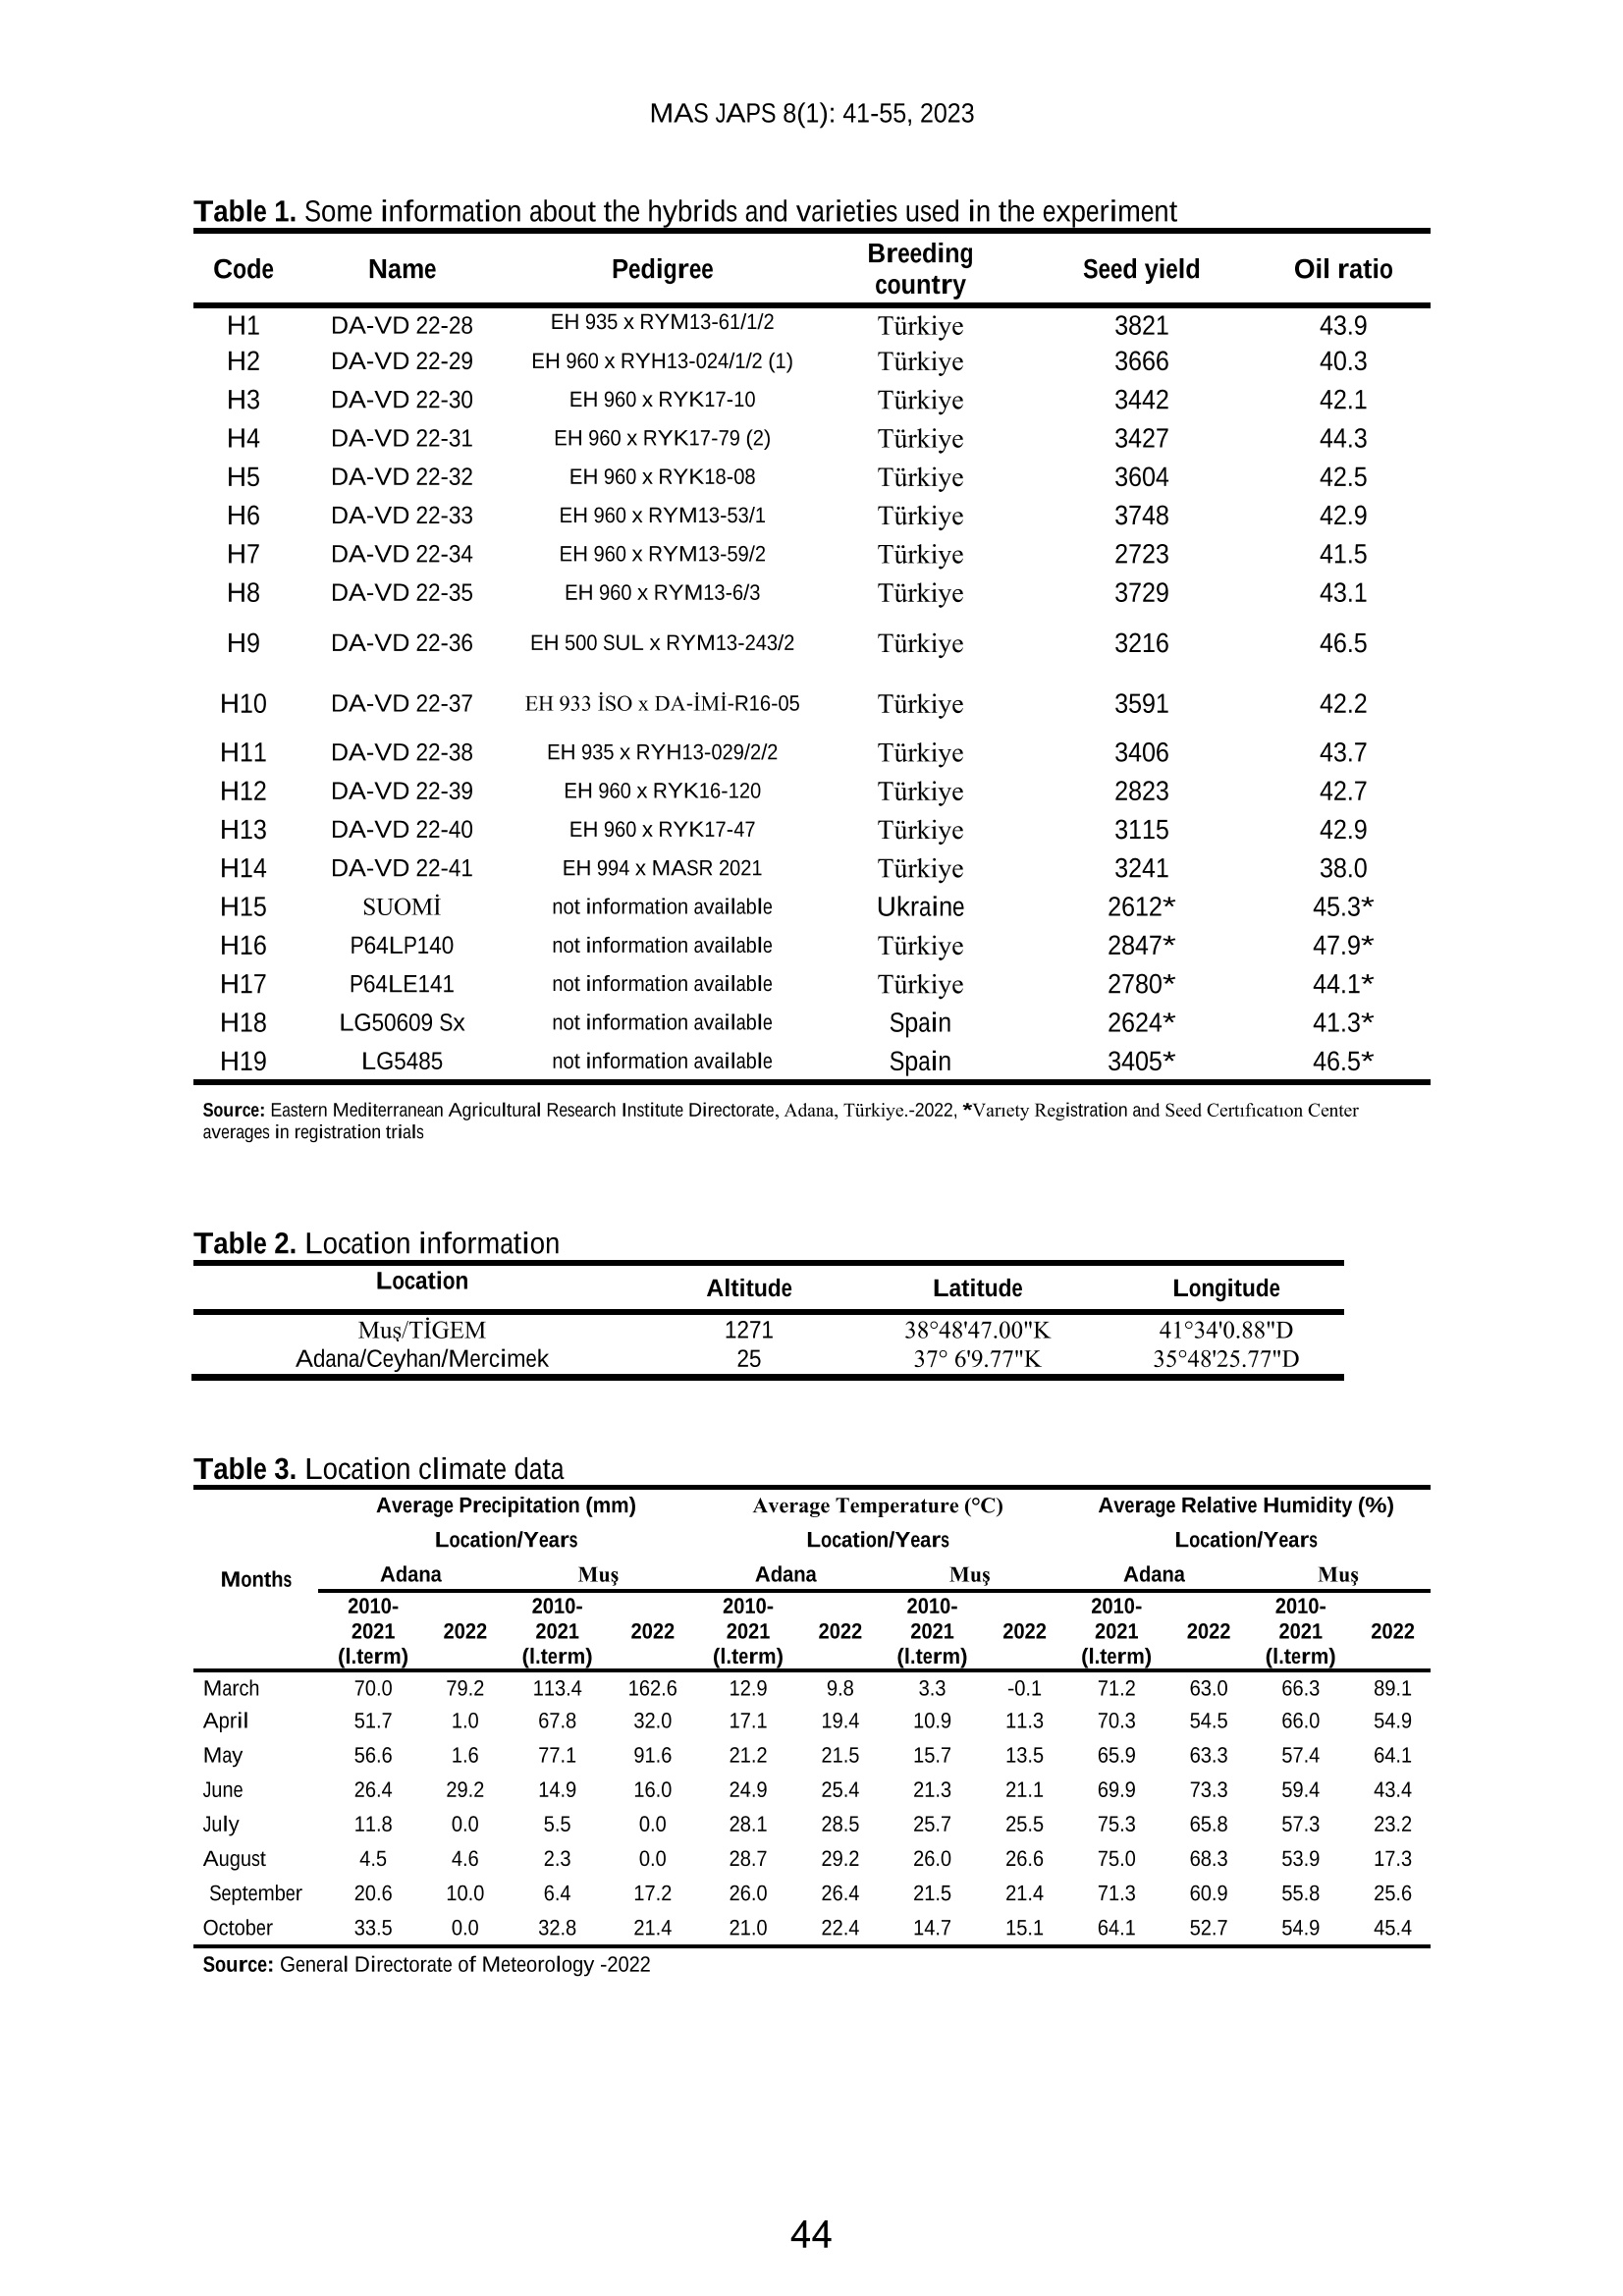
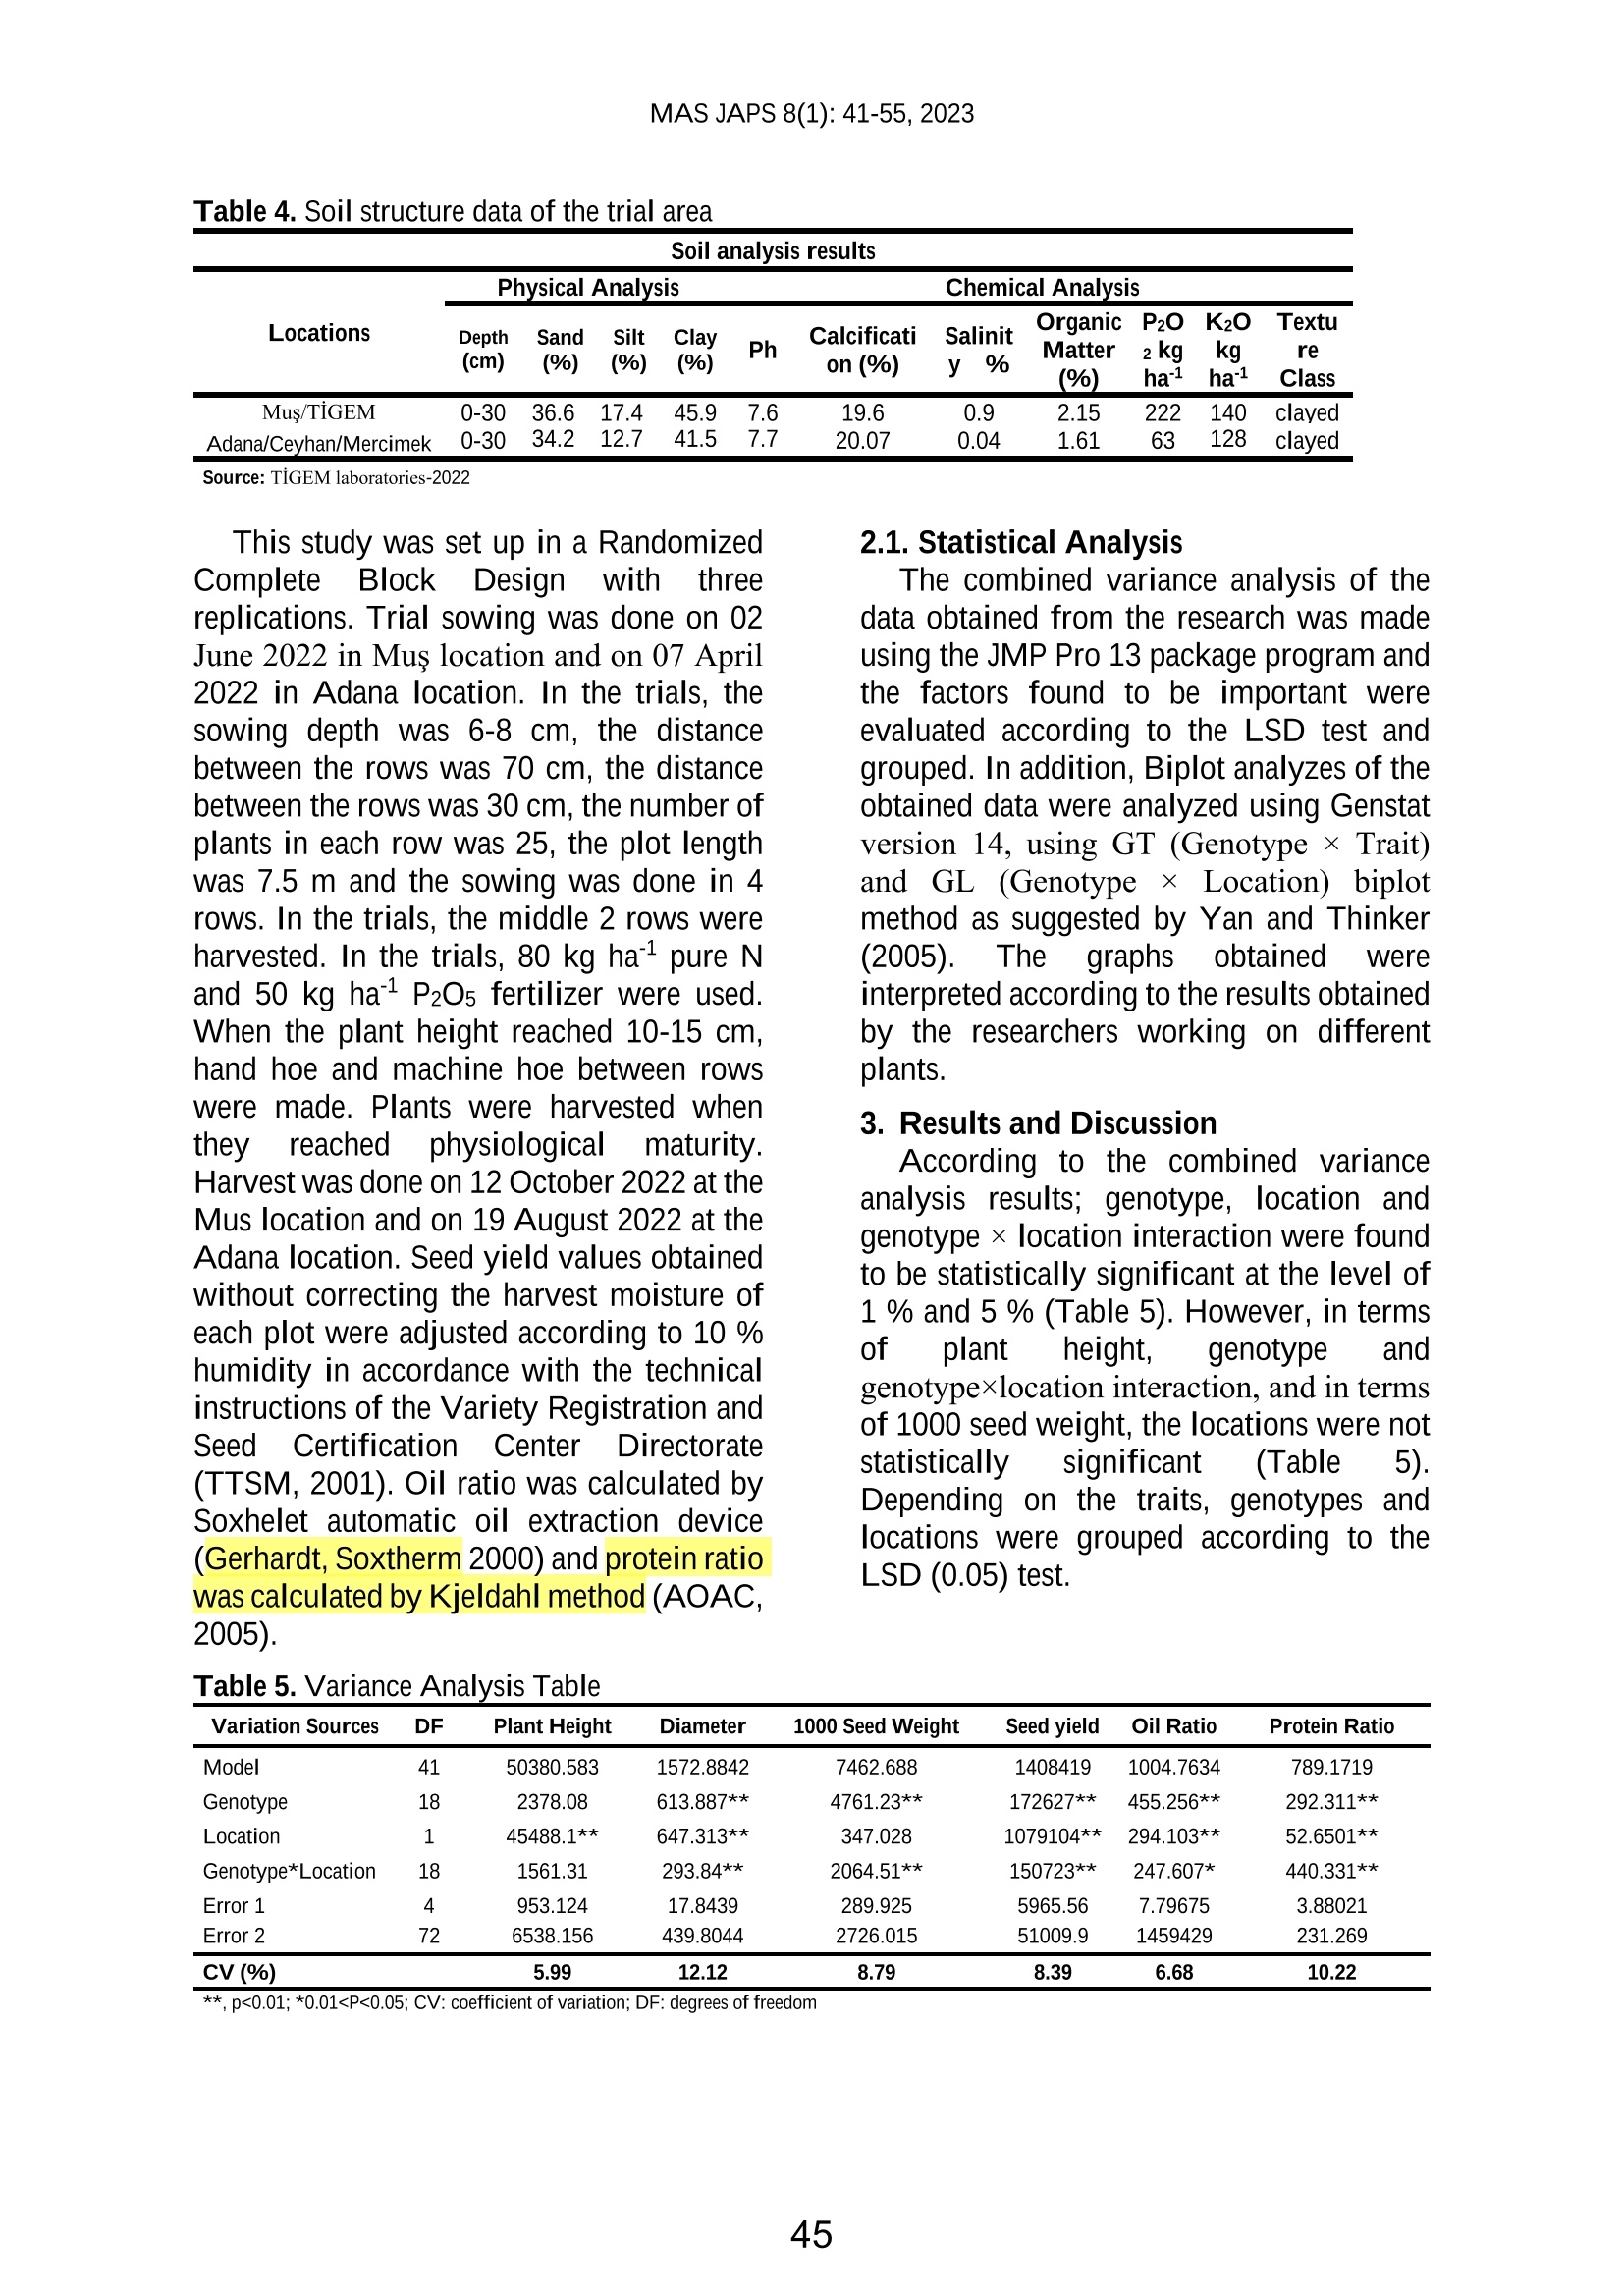
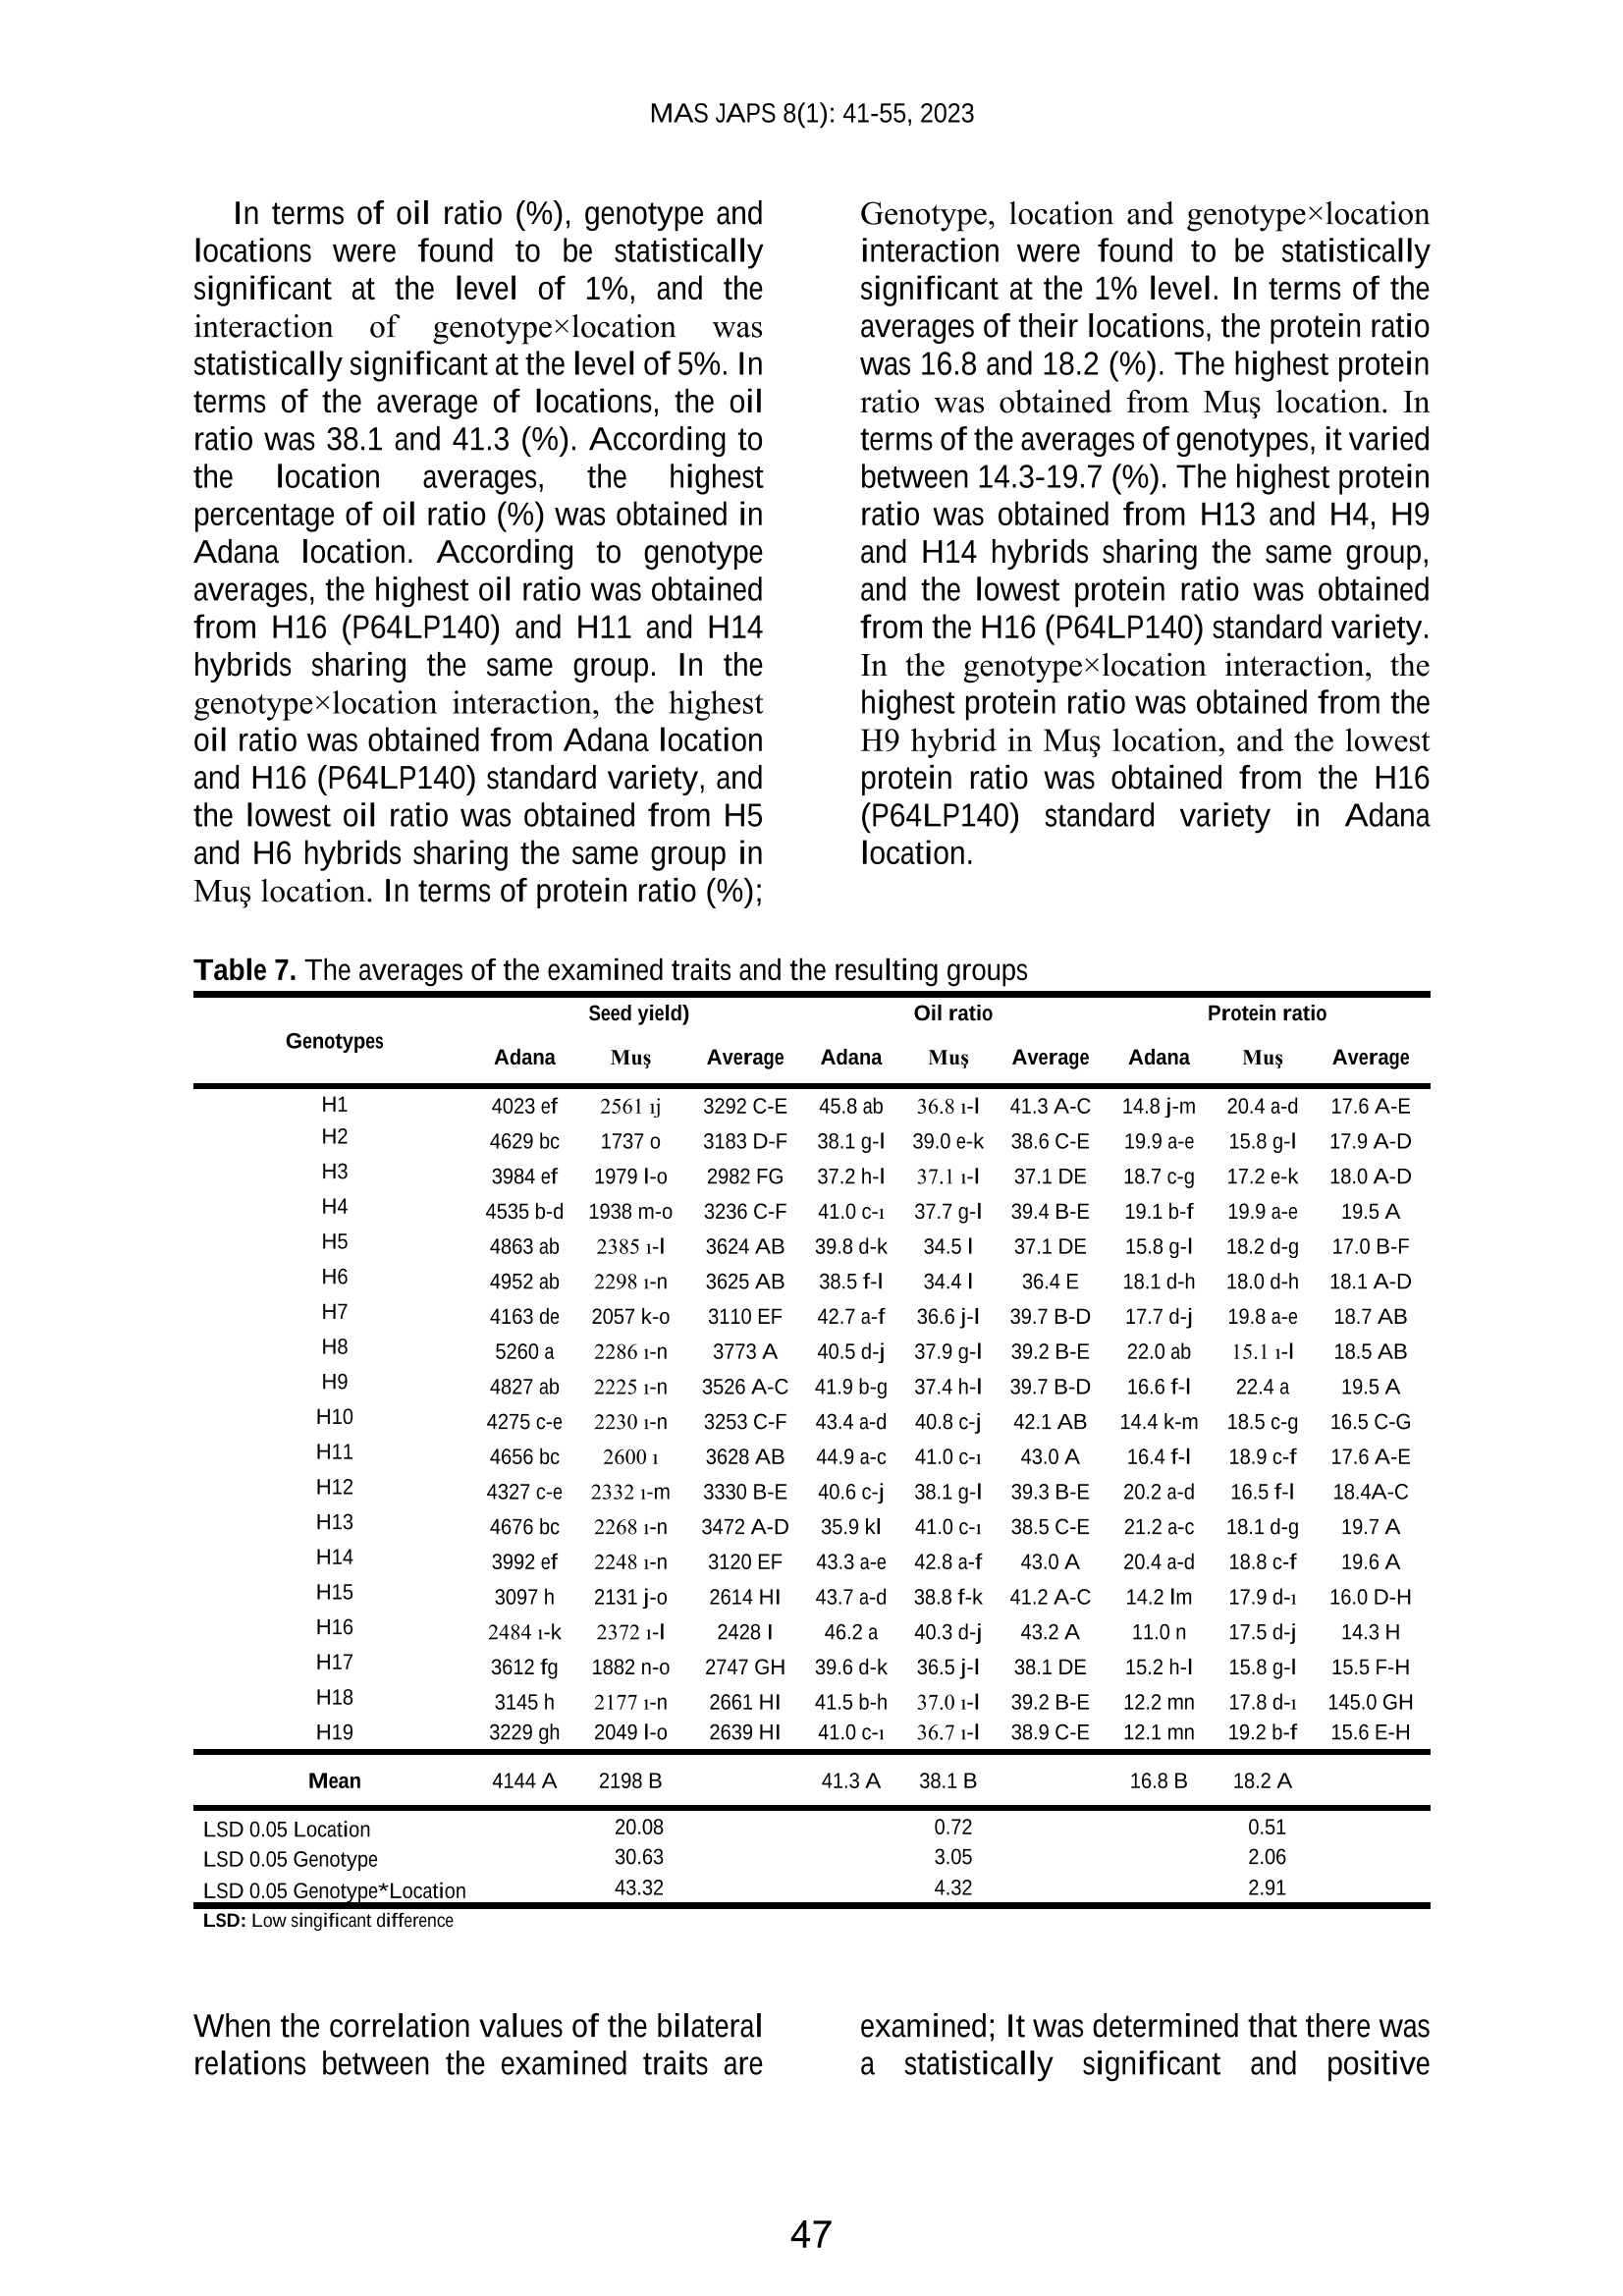
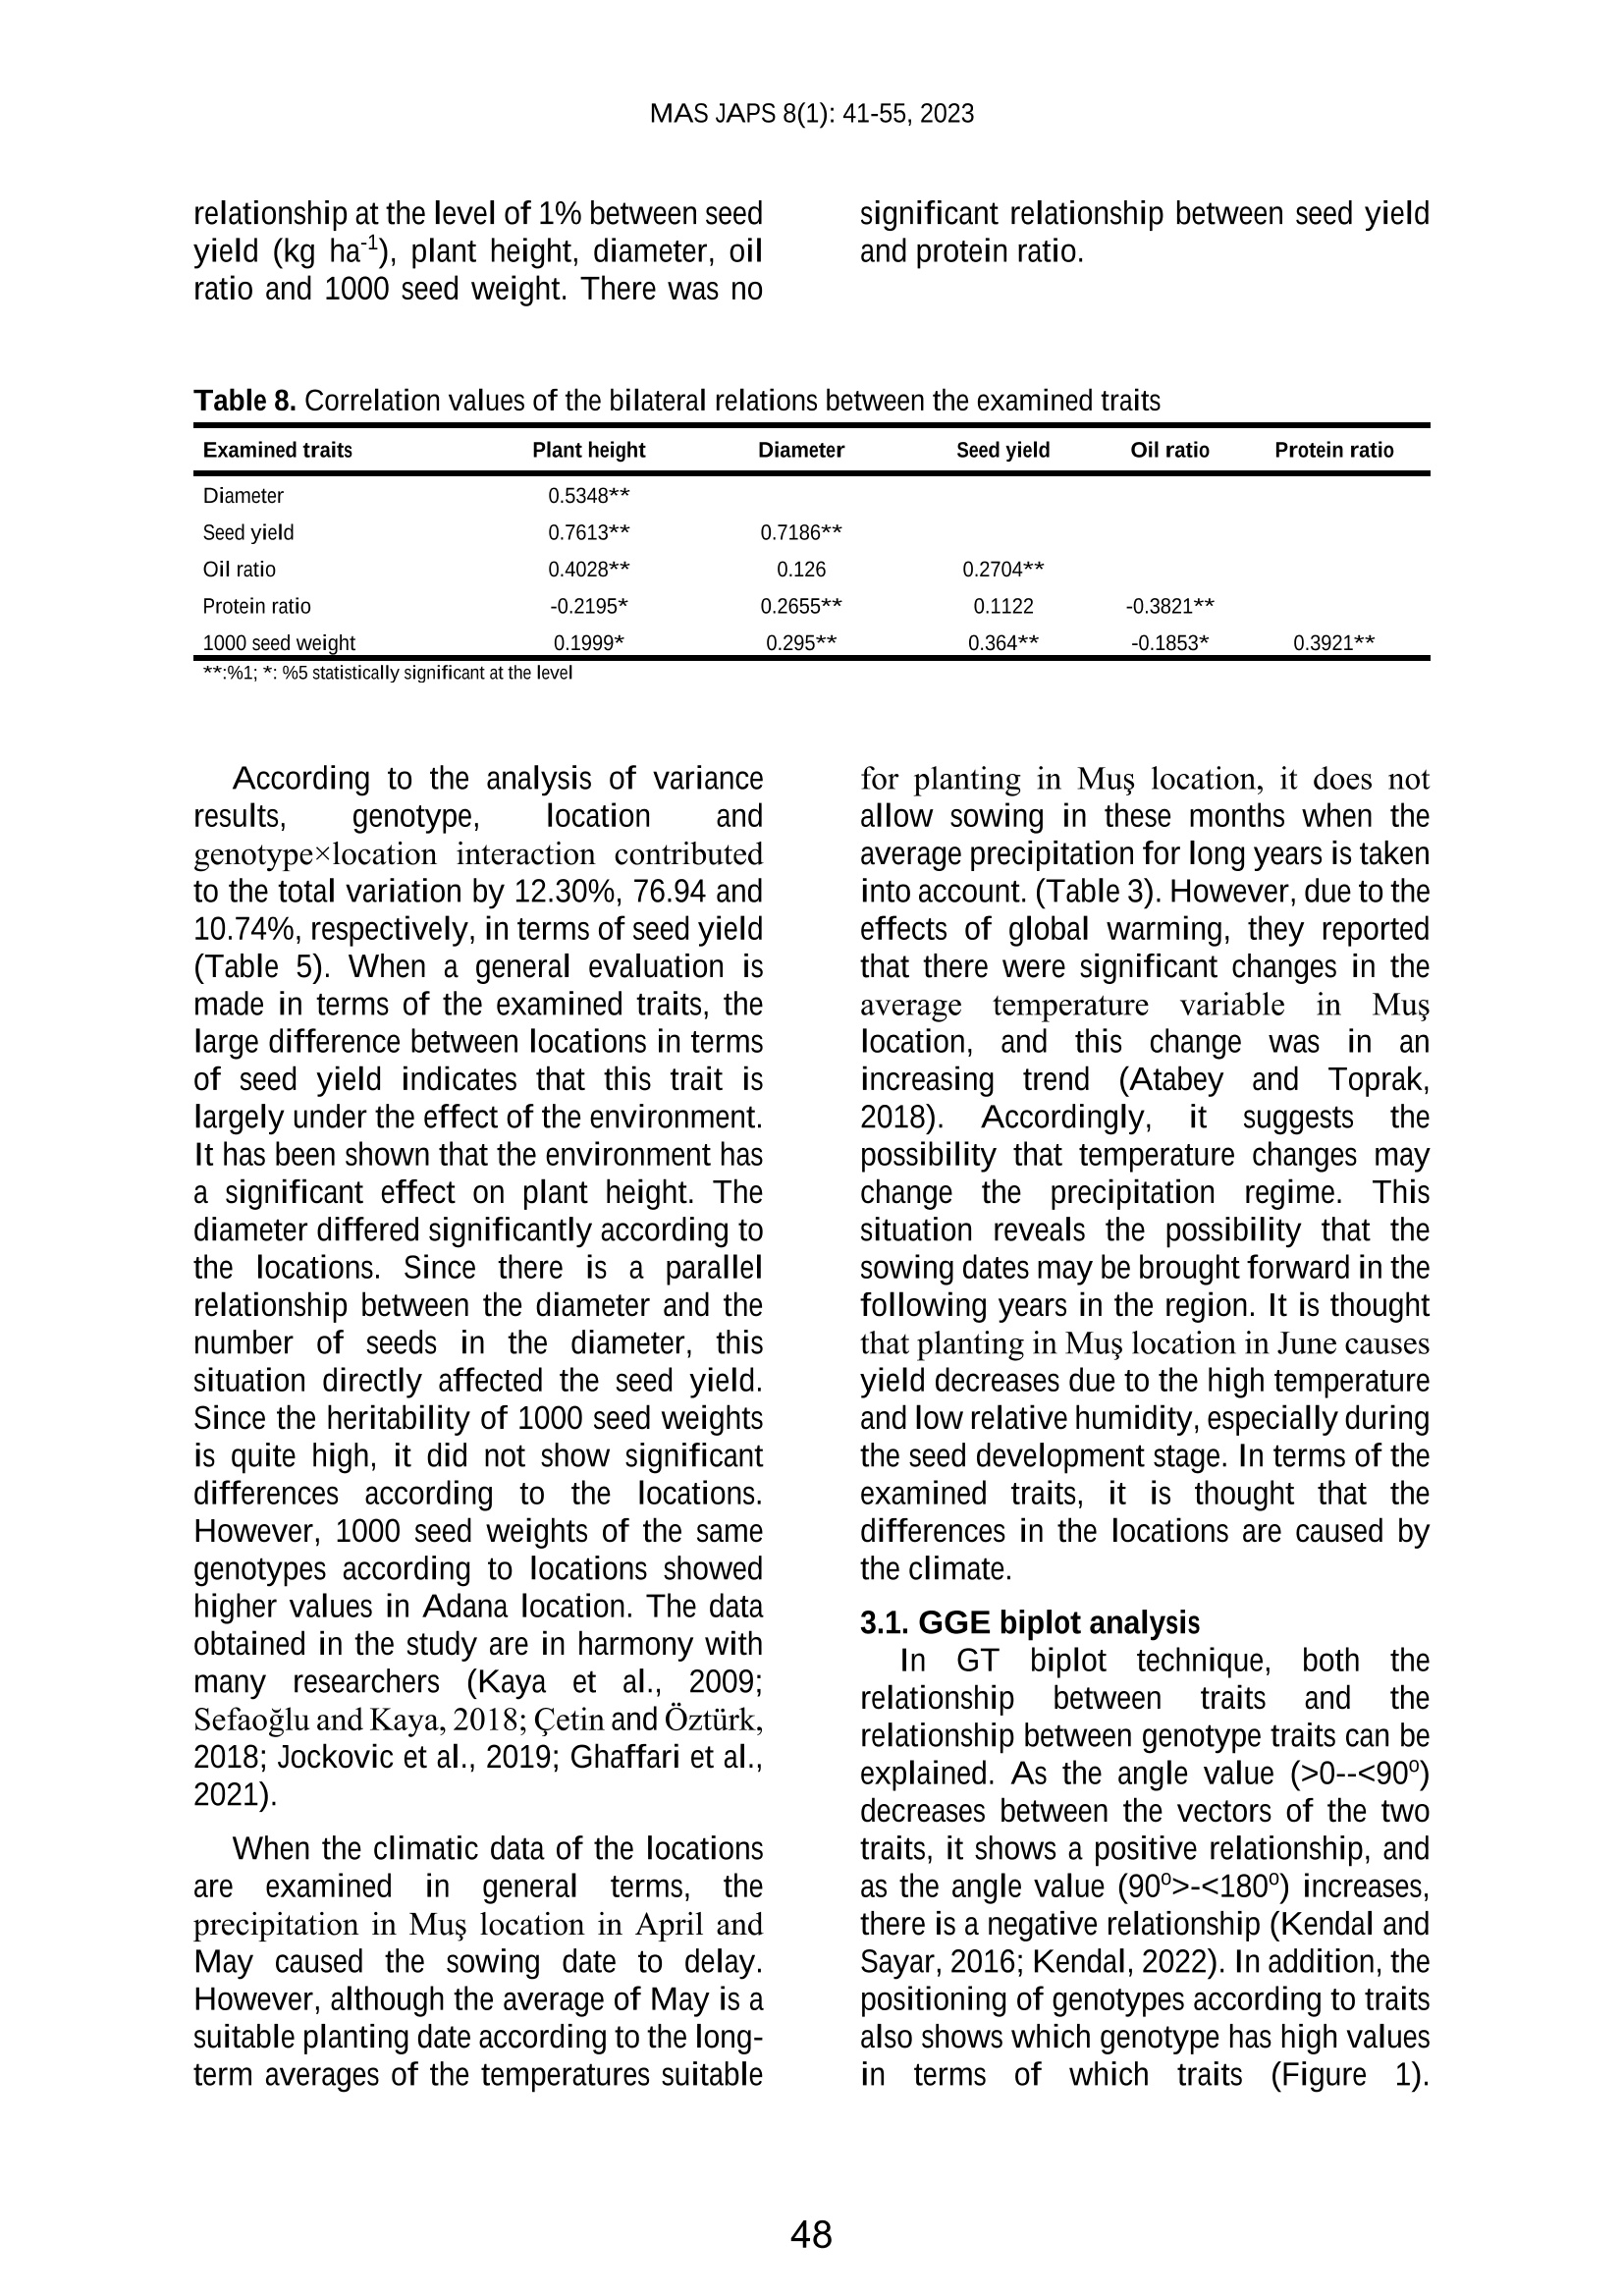
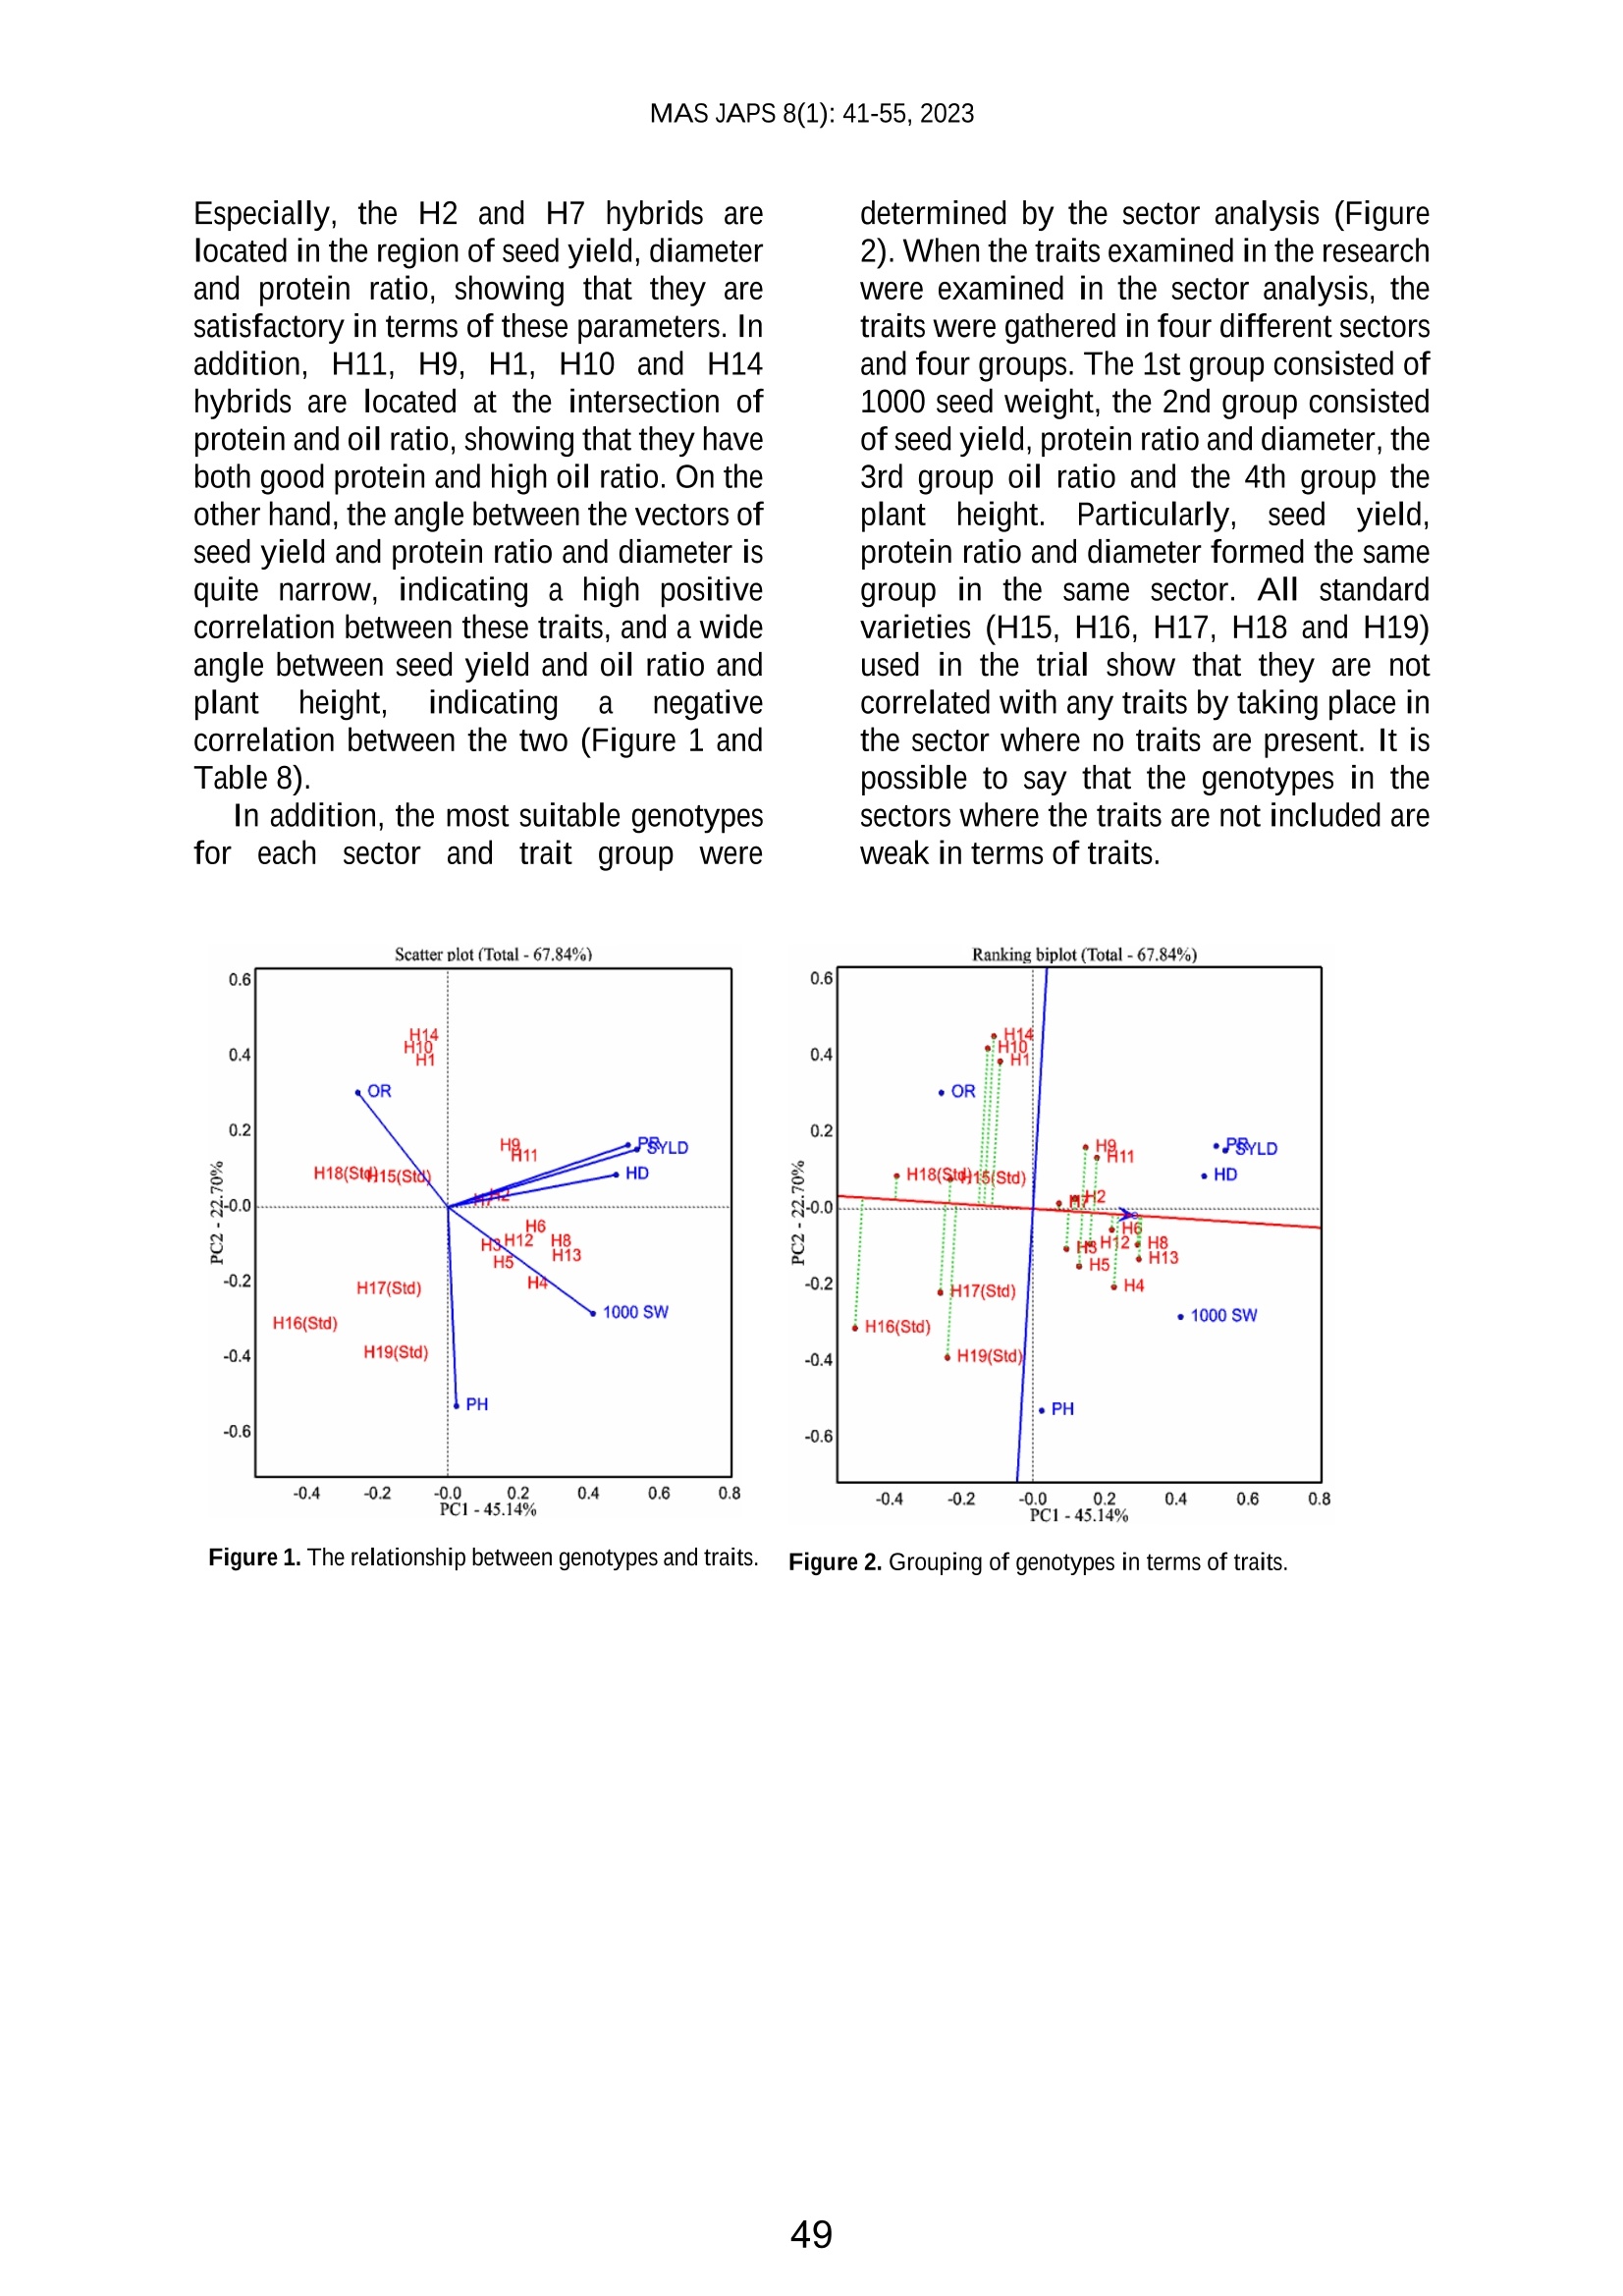
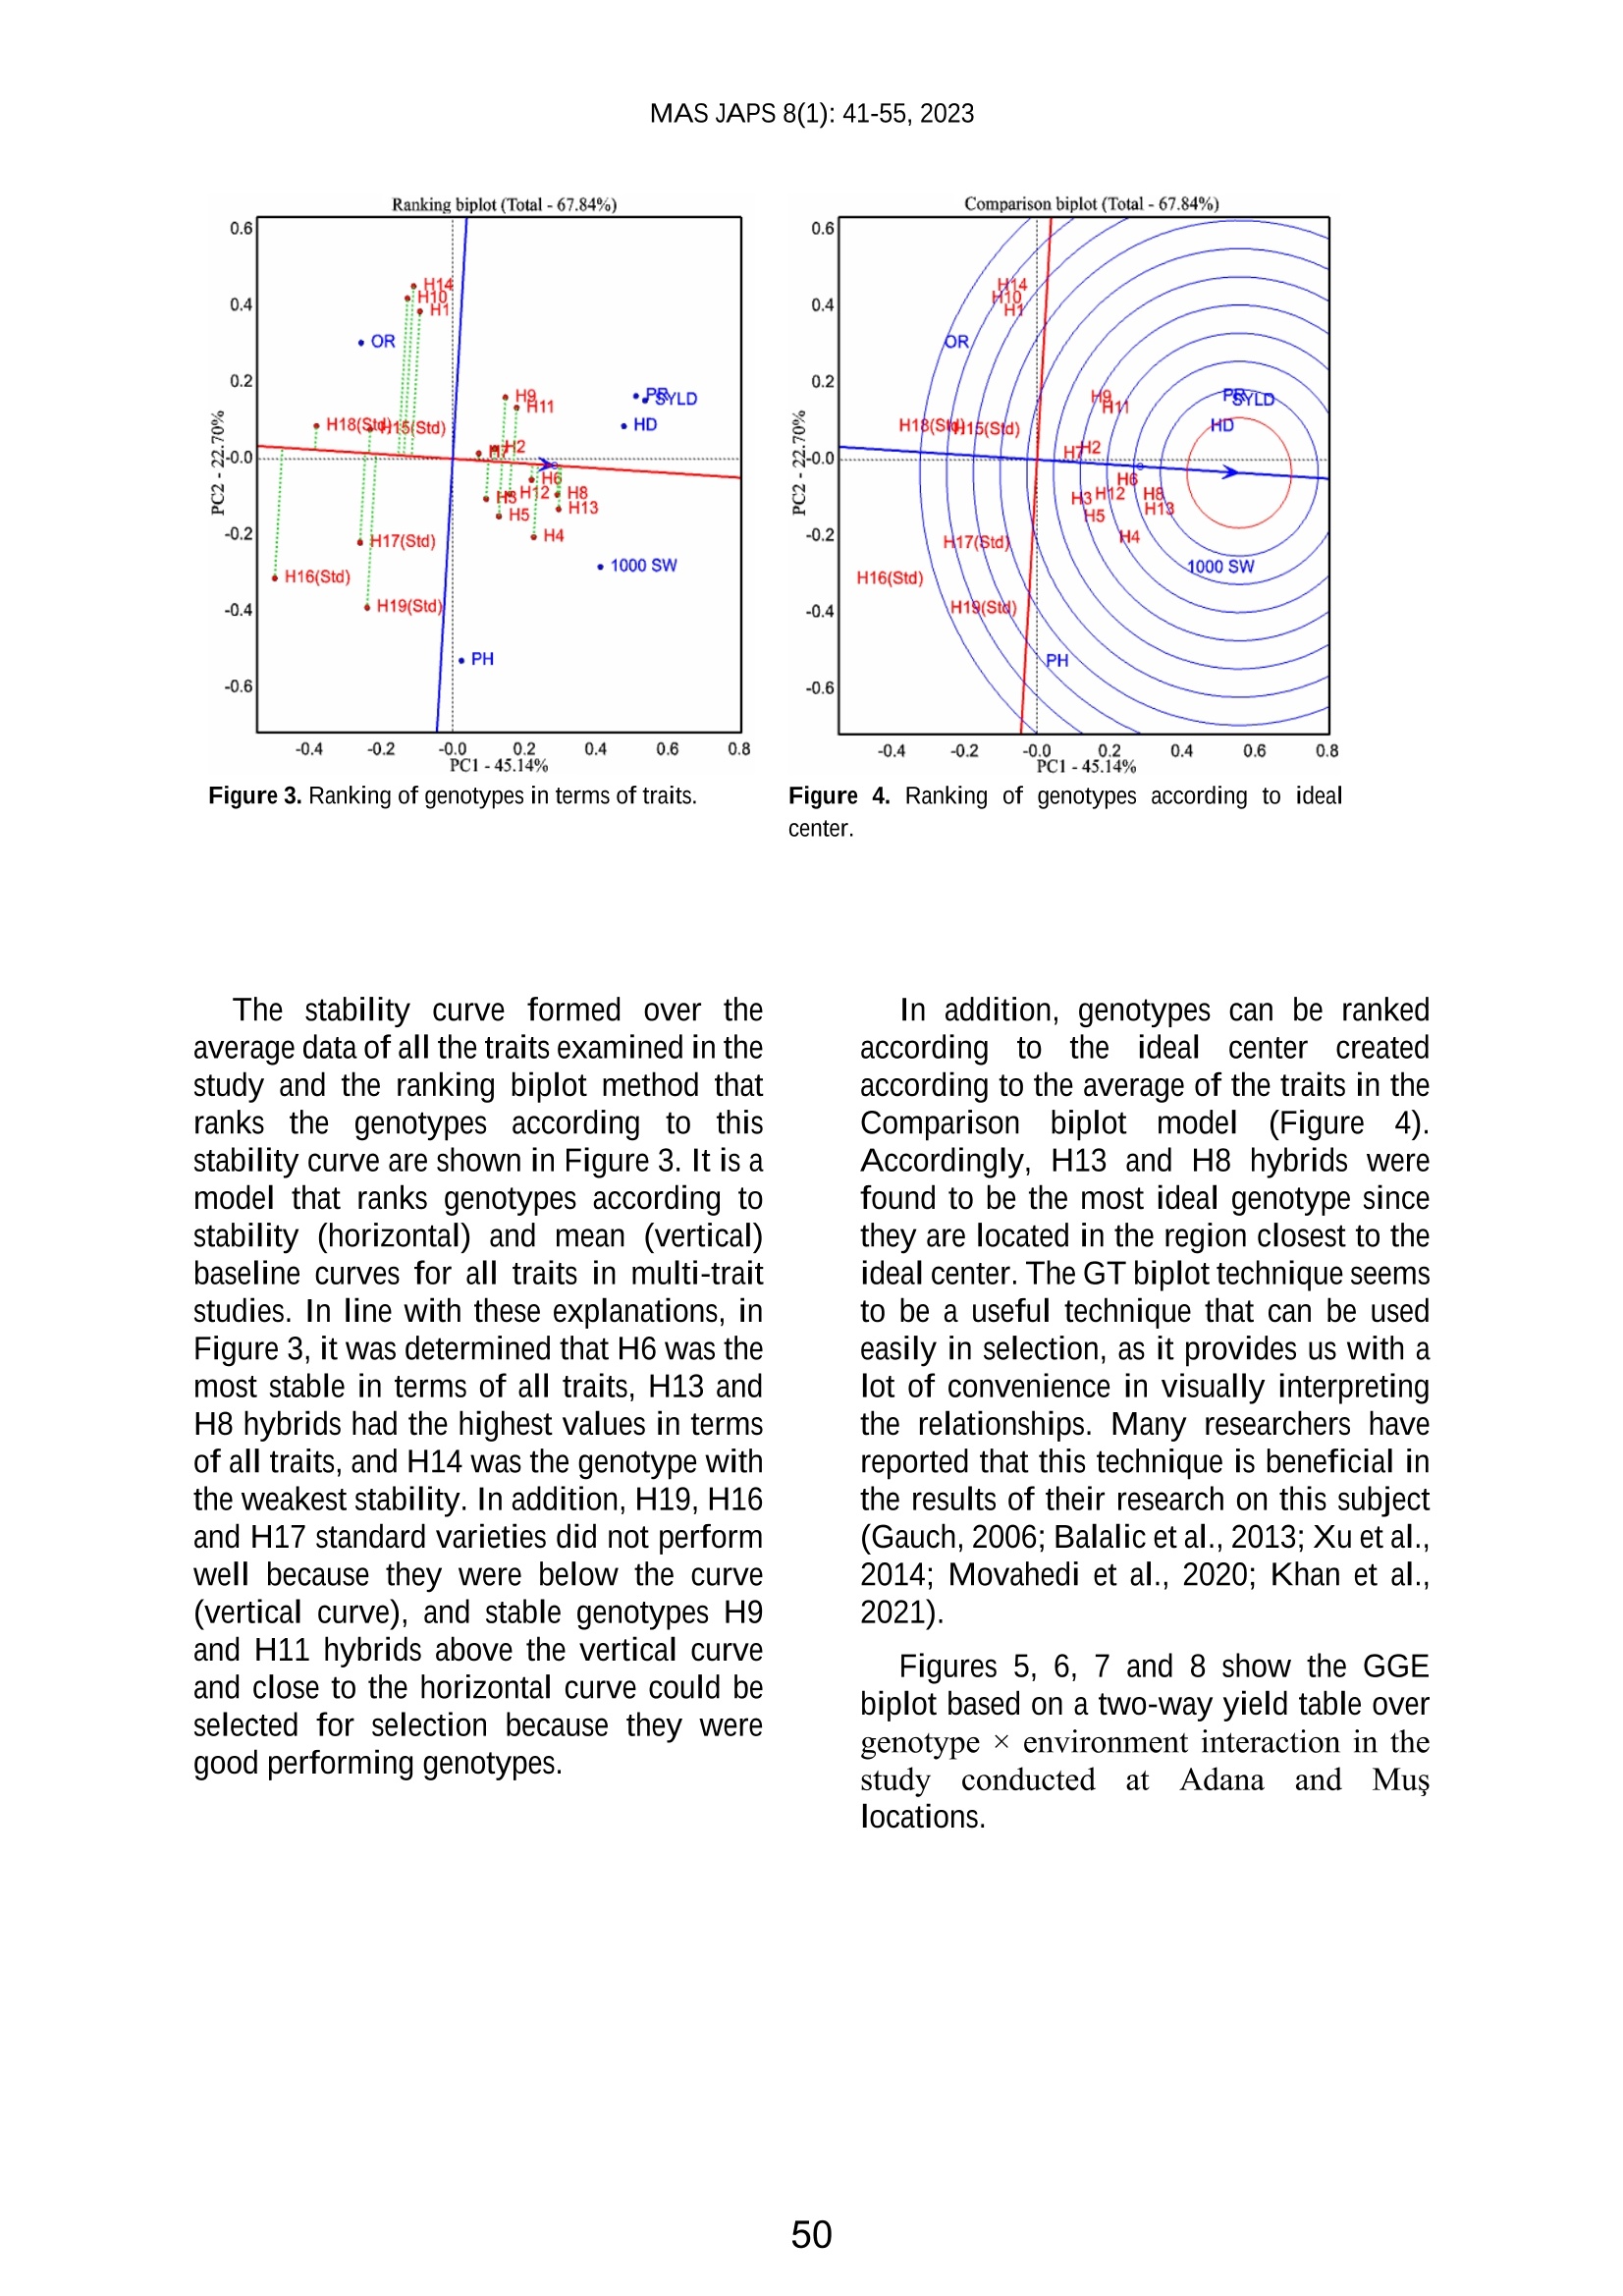
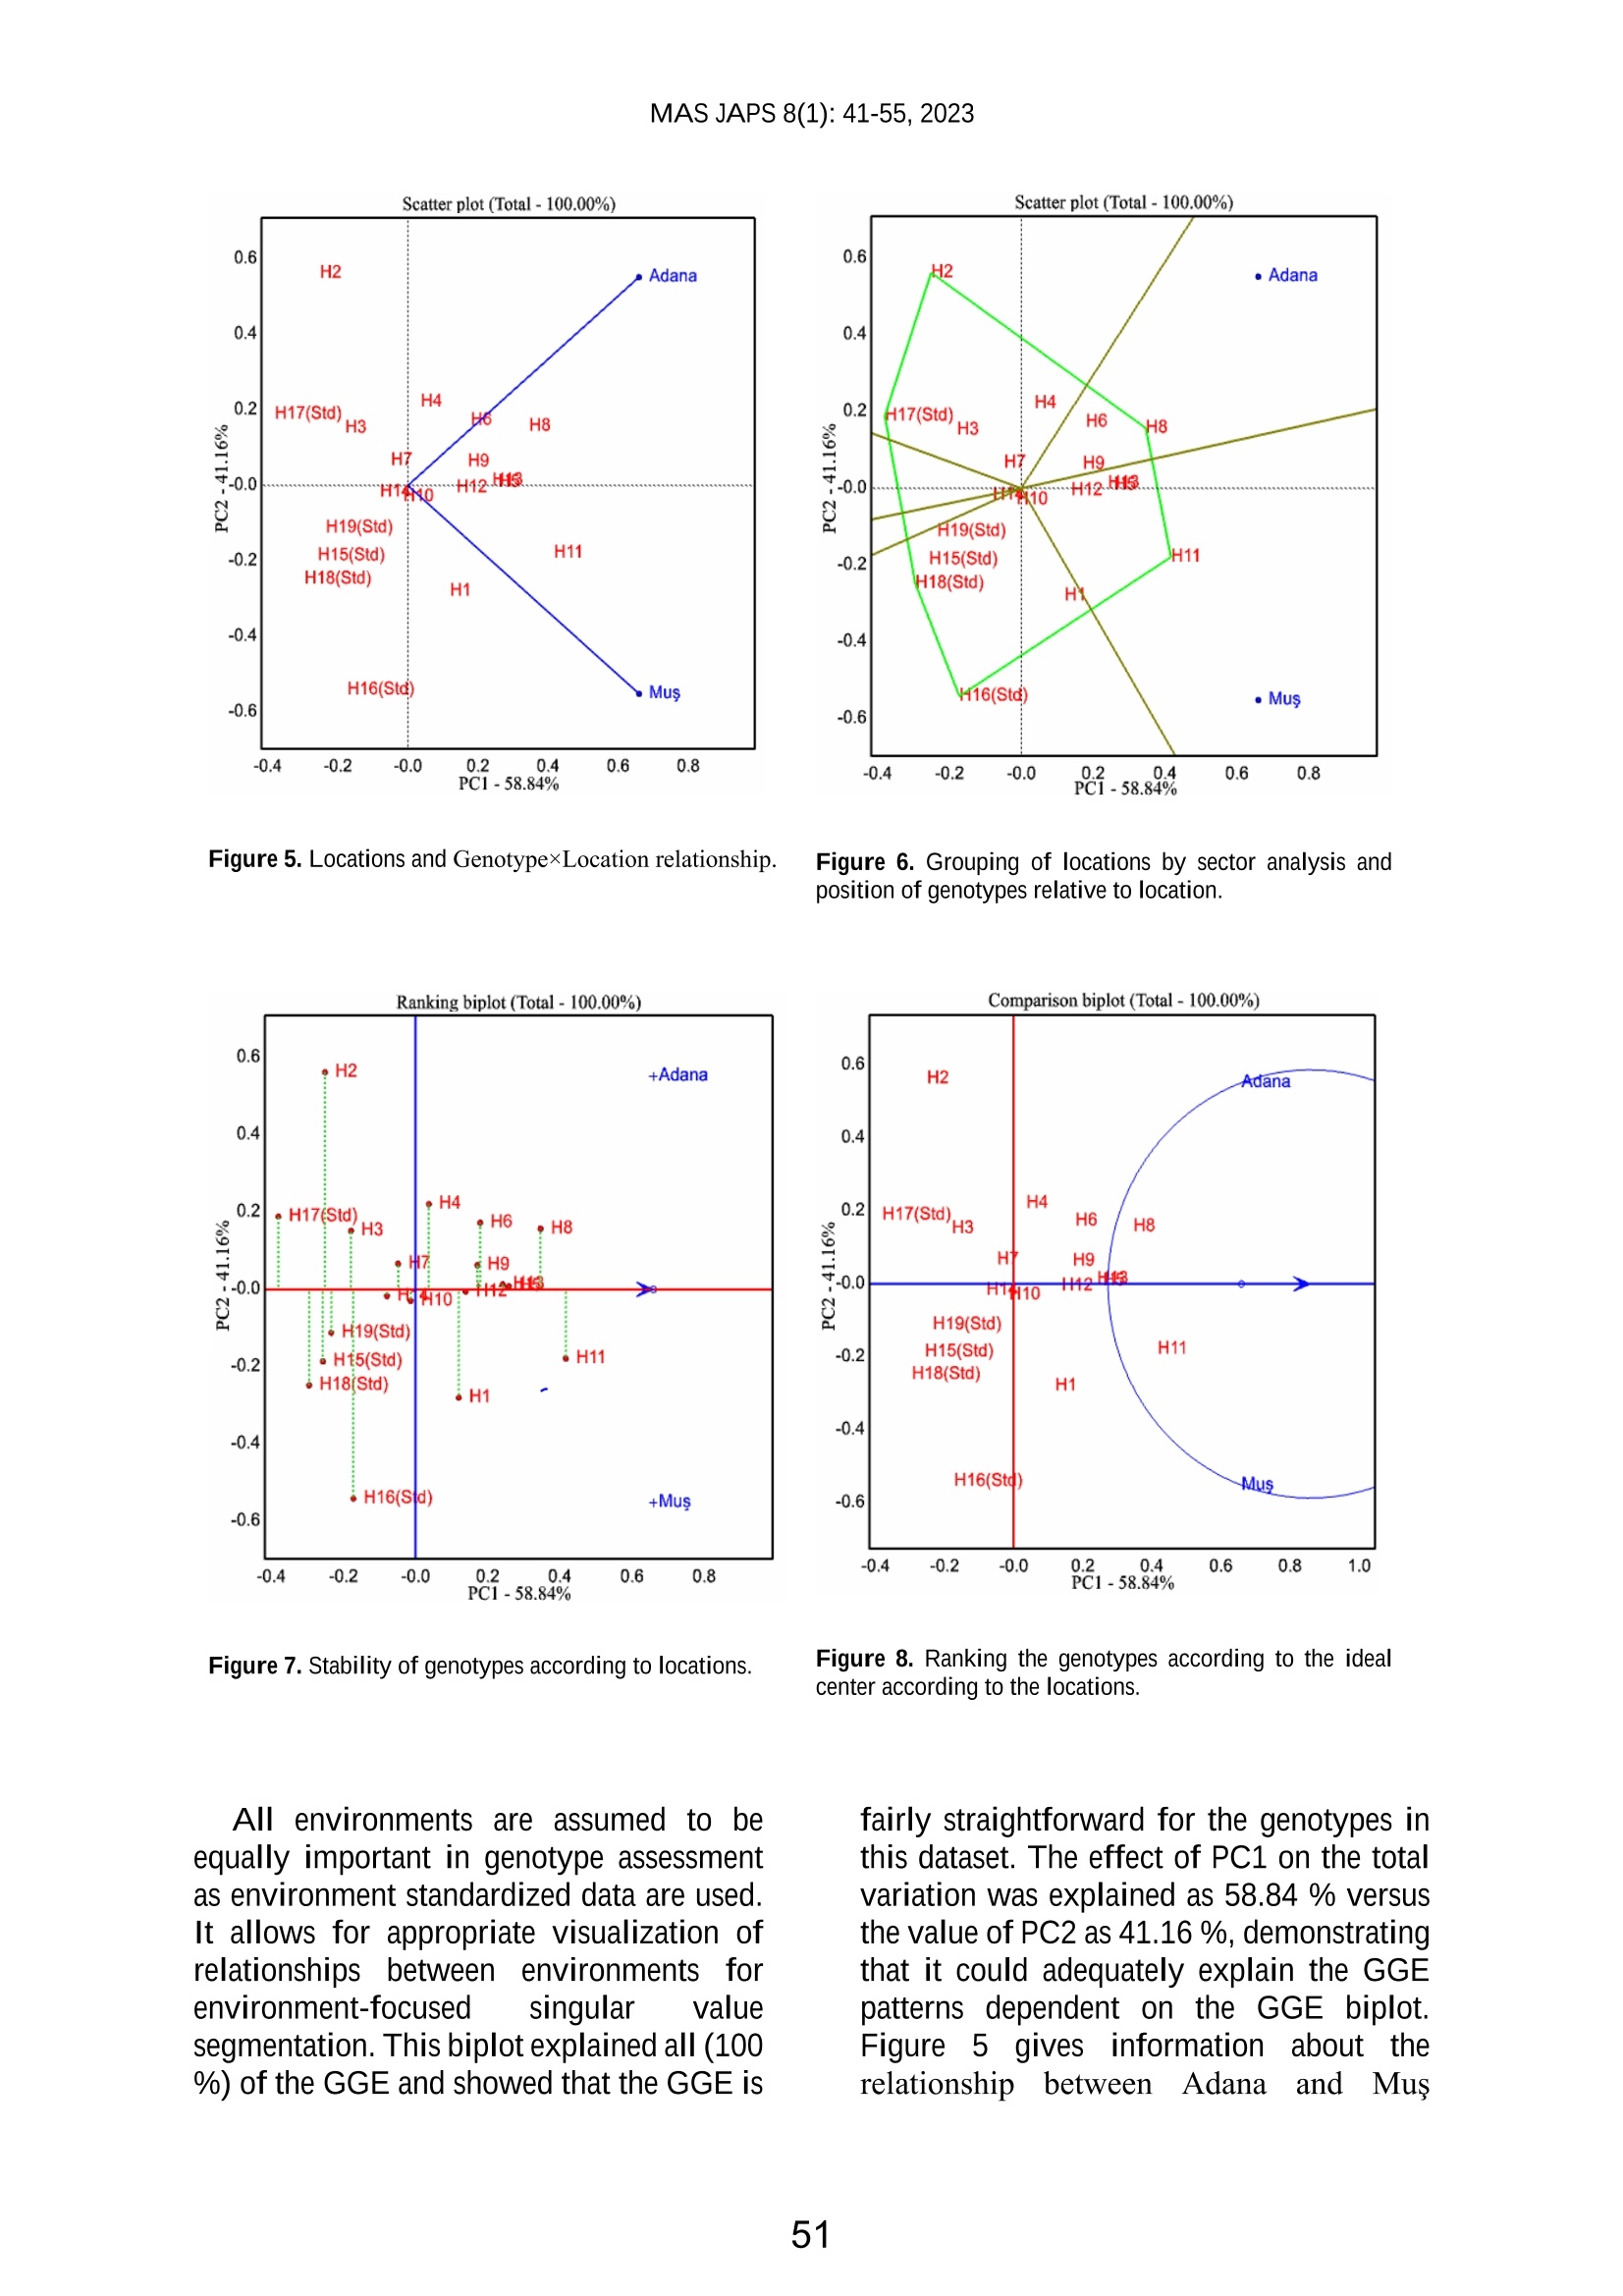
不同环境条件下向日葵基因型×环境相互作用的研究Investigation of Genotype × Environment Interaction in Some Sunflower (Helianthus annuus L.) Genotypes in Different Environmental ConditionsMAS JAPS 8(1): 41-55,2023 OPEN ACCESS DOI : h t t p://dx.do i .org/10.5281/ze n odo.7642289 Arastirma Makalesi /Research Article 不同环境条件下向日葵基因型×环境相互作用的研究 Investigation of Genotype xEnvironment Interaction in Some Sunflower (Helianthus annuus L.) Genotypes in Different Environmental Conditions Mustafa YASAR1*回 ,,Ayse Nuran CiL2回 ,Abdullah CIL2D Mus Alparslan University, Faculty of Applied Sciences, Department of Plant Production and Technologies,Mus Eastern Mediterranean Agricultura l Research Institute Directorate, Adana *Sorumlu yazar (Corresponding author): mustafa.yasar@alparslan.edu.t r Gelis Tarihi (Received): 29.11.2022 Kabul Tarihi (Accepted): 31.12.2022 Abstract Trials in different environmental conditions have a fundamenta l role i n selecting genotypes that perform best i n different environments. Adana and Mus locations can be considered as a new test environment for sunflower breeders in t erms of performance evaluation of some sunflower genotypes. This study was carried out i n Adanaa nd Mus ecological conditions i n 2022 with 14 hybrid lines and 5 standard variet i es according to Randomized Complete Block Design. According to the results of analysis of var i ance, genotype, location and genotypexlocation interaction were found statistically signi f icant at 1% and 5% levels i n terms of many traits.According to the average results of both locations in the study, plant height of genotypes is 139.0-179.0 cm,diameter 18.0-22.8 cm, 1000 seed weight 59.3-83.0 g, seed yield 2198- 4144 kg ha , oi l ratio 38.1-41.3(%) and protein ratio ranged from 16.8 to 18.2 (%). In the GGE biplot technique, PC1 constituted 58.84% of the variation,PC2 constituted 41.16% and 100% of the variation in total. As a result , according to the f indings obtained in the research; H1, H10 and H14 genotypes stand out in terms of oil ratio, H6, H18 and H3 genotypes in terms of seed yield and H9 and H11 genotypes in terms of both criteria. When the yield and quality traits of genotypes in Adana and Mus locations were evaluated together, it was concluded that H8 and H13 genotypes could be recommended for both locations. Keywords: Sunflower, hibrid, seed yield , oil ratio, interaction 1. Introduction Sunflower (Helianthus annuus L.) is the most important oil crop worldwide.generally used for oil production. With the Covid-191pandemic, the need for oil production has gained more importance,especially in today’s world where global food crises have come to 1thefore.S unflower (Helianthus annuus L.) i s grown in 72 countries in temperate and subtropical climates (Seiler et al.,2017). Sunflower is one of the most planted oilseed crops in the world after soybean, rapeseed and peanuts.While there are both oi l and snack varieties of sunflower , cultivation of oil varieties for oil production has gained more importance.Sunflower has a higher oil content (48%)than both rapeseed and soy, with about 70% linoleic and 20% oleic acid content of its oil content (Andrianasolo et al., 2016).According 1to FAOSTAT2021 data.sunflower production is made in the world with a production of 58.2 million tons and a yield of 1.9 tons per hectare, while Turkey ranks 6th in sunflower production after Russia, Ukraine, Argentina, Romania and China. In 2021, the amount of oil sunflower production in Turkey increased by 16.5%c ompared to the previous season and reached 2.2 mil l ion tons. In Turkey's 2021productionseason.the provinces of Tekirdag (399 thousand tons), Konya (324thousand tons), Edirne (285 thousand tons ),Kirklareli (226 thousand tons) and Adana (201 thousand tons)i in oil sunflower production account for approximately 65 %of the total production (Anonim, 2022). Due to t he economic importance of sunflower, the determination of superior and effective hybrids in terms of qual i ty characteristics to increase oil yield in sunflower breeding is one of the ultimate goals (Ghaffari et al., 2021). The ultimate goal of plant breeders is the development of new commercial genotypes that can adapt to different environmental conditions.Genotypes that are both stable and high yielding are considered to be the use of a wide range of genotype sets that can adapt to different environmental conditions (Lu'quez et al ., 2002; Alizadeh et al., 2021;(LU Ghaffari et al., 2021). For this reason, i t is extremely important that the seed yield of the desired genotypes does not fluctuate much under different environmental conditions. G × E (Genotype X env i ronment) interaction is defined as the performance of the cultivars developed as a result of many years of hard work, which differs according to changing environmental conditions. For this reason,the use of genotypes most suitable for the environment in order to achieve the desired yield and quality increases the chance of success. Sunflower studies should be given m ore importance both in Turkey and in the world, especially in order to combat the drought that emerged with global warming and to eliminate the vegetable oil deficit.which became more important in the food crisis. Varieties that adapt more easily to cl i matic conditions and show higher seed yield and oil yield performance are more preferred by producers in different regions.However, the main purpose of setting up yield t rials is to predict the performance of the best variety in the future using available data. A genotype with stable yields in different environments contributes little to the GxE interaction 1..Modeling of the GxE interaction in multimedia trials (METs) is required to ident i fy genotypes with general and specific adaptations (Aarthi et al.,2020). Recently, GGE (genotype, genotypex environment) or GT (genotype t rait)biplot methods have been used in order to evaluate genotypes both in terms of their stability and in a versatile way. A GGE biplot (Yan et al., 2000), showing the genotype main effect (G) and the GE of a two-way table of a genotype environment simultaneously, can addressrelatively many questions to assess visual genotypes and environments (Yan, 2015;Kendal et al .,2022). The GGE biplot can be explained by a "which-where-won" model of MET (Mega x Environment ×Trait) data for identification and variety recommendations important to each mega-environment . Furthermore, a genotype xtrait biplot (Yan and Rajcan, 2002) graphically approaches the genotype × trait interaction in two directions. The yield for each genotype in a genotype group is always affected by the interaction of genotypes, environme nt and GxE (Yan and Kang 2002; Gholizadeh et al., 2021). GEI (genotypexenvironment interaction) affects yield and production as it often prevents a genotypef from maintaining its activity in n different environments and identifying and selecting stable genotypes (Khomari et al., 2017;Ansarifard et al ., 2020). If this interaction does Snot Cchange the yield order of genotypes in different environments.,2variety recommendation can be made (Kaya and Atakisi, 2002). The GxE interaction effect can cause yield variability that is often unexplained by the effect tof genotypes and the environment, which is extremely important for breeders (Yan and Hunt, 2001). Such a biplot can be used to visualize genetic correlations between traits (breeding targets), making genotypes easier to understand by breeders. Understandingtrait relationships also mak es it easier to identify traits that can be used in indirect selection for a target trait and that can be extra-measured. A genotype x t rait biplot can also be used to visualize t he advantages and shortcomings of individual genotypes,which are important 1for both 1variety assessment and parent selection (Yan and Tinker, 2006; Kendal,2022). Many researchers used the GGE biplot (genotype main effect plus GxE interaction)graphical stable method for modeling the GxE interaction in different plant groups and multi-media experiments (Yan et al.,2000; Gauch 2006; Yan and Tinker 2006;Malla et al., 2010; Rakshit et al., 2012;Mohammadi and Amri 2013; Gholizadeh and Dehgani 2016; Sserumaga et al., 2016;Omoigui et al., 2017; Hassani et al., 2018;Dallo et al ., 2019; Da Cruz et al., 2020;A nsari f ad et al., 2020; Olanrewaju, 2021;Ghaffari, 2021;Kendal, 2022). Sunflower is an important oil plant in Turkey and has half a century of cultivation history. Many researchers focused on the production of stable hybrids with higher oil vield in different environmental conditions in sunflower breeding studies. Therefore, in this study, the adaptability of hybrid sunflower lines with different characteristics in Adana and Mus locations Wastested, and the interaction of GT (genotype ×t rait) and GL (genotype x location) was tried to be explained with graphics using the biplot technique. 2. Materials and Methods The study was carried out t with 14hybrids (variety candidate) and 5 varieties in Adana and Mus locations i n 2022. Some information about the hybrids and cultivars used in the study are given in Table 1,location information in Table 2, climate data in Table 3, and trial area soil structure data in Table 4. Table 1. Some information about the hybrids and varieties used in the experiment Code Name Pedigree Breeding country Seed yield Oil ratio H1 DA-VD 22-28 EH 935xRYM13-61/1/2 Turkiye 3821 43.9 H2 DA-VD 22-29 EH 960 x RYH13-024/1/2(1) Turkiye 3666 40.3 H3 DA-VD 22-30 EH 960 xRYK17-10 Turkiye 3442 42.1 H4 DA-VD 22-31 EH 960xRYK17-79 (2) Turkiye 3427 44.3 H5 DA-VD 22-32 EH 960x RYK18-08 Turkiye 3604 42.5 H6 DA-VD 22-33 EH 960 x RYM13-53/1 Turkiye 3748 42.9 H7 DA-VD 22-34 EH 960 xRYM13-59/2 Turkiye 2723 41.5 H8 DA-VD 22-35 EH 960 x RYM13-6/3 Turkiye 3729 43.1 H9 DA-VD 22-36 EH 500 SUL xRYM13-243/2 Turkiye 3216 46.5 H10 DA-VD 22-37 EH 933 iSO x DA-iMi-R16-05 Turkiye 3591 42.2 H11 DA-VD 22-38 EH 935 x RYH13-029/2/2 Turkiye 3406 43.7 H12 DA-VD 22-39 EH 960x RYK16-120 Turkiye 2823 42.7 H13 DA-VD 22-40 EH 960 x RYK17-47 Turkiye 3115 42.9 H14 DA-VD 22-41 EH 994 x MASR 2021 Turkiye 3241 38.0 H15 SUOMI not information available Ukraine 2612* 45.3* H16 P64LP140 not information available Turkiye 2847* 47.9* H17 P64LE141 not information available Turkiye 2780* 44.1* H18 LG50609 Sx not information available Spain 2624* 41.3* H19 LG5485 not information available Spain 3405* 46.5* Source: Eastern Mediterranean Agricultural Research Institute Directorate, Adana, Turkiye.-2022, *Variety Registration and Seed Certi f ication Center averages i n registration trials Table 2. Location information Location Altitude Latitude Longitude Mus/TIGEM 1271 38°48'47.00"K 41°34'0.88"D Adana/Ceyhan/Mercimek 25 37°6'9.77"K 35°48'25.77"D Table 3. Location climate data Average Precipitation (mm) Average Temperature (°C) Average Relative Humidity (%) Months Location/Years Location/Years Location/Years Adana Mus Adana Mus Adana Mus 2010- 2010- 2010- 2010- 2010- 2010- 2021 2022 2021 2022 2021 2022 2021 2022 2021 2022 2021 2022 (l.term) (l.term) (l.term) (l.term) (l.term) (l.term) March 70.0 79.2 113.4 162.6 12.9 9.8 3.3 -0.1 71.2 63.0 66.3 89.1 April 51.7 1.0 67.8 32.0 17.1 19.4 10.9 11.3 70.3 54.5 66.0 54.9 May 56.6 1.6 77.1 91.6 21.2 21.5 15.7 13.5 65.9 63.3 57.4 64.1 June 26.4 29.2 14.9 16.0 24.9 25.4 21.3 21.1 69.9 73.3 59.4 43.4 July 11.8 0.0 5.5 0.0 28.1 28.5 25.7 25.5 75.3 65.8 57.3 23.2 August 4.5 4.6 2.3 0.0 28.7 29.2 26.0 26.6 75.0 68.3 53.9 17.3 September 20.6 10.0 6.4 17.2 26.0 26.4 21.5 21.4 71.3 60.9 55.8 25.6 October 33.5 0.0 32.8 21.4 21.0 22.4 14.7 15.1 64.1 52.7 54.9 45.4 Source: General Directorate of Meteorology -2022 Table 4. Soil structure data of the trial area Physical Analysis Chemical Analysis Locations Depth Sand Silt Clay C a lc i fi c at i1SalinitPh Organic P2O K20 TextuMatter 2kg kg re (cm) (%) (%) (%) on(%) y%(%) ha-l ha Class Mus/TiGEM 0-30 36.6 17.4 45.9 7.6 19.6 0.9 2.15 222 140 clayed Adana/Ceyhan/Mercimek 0-30 34.2 12.7 41.5 7.7 20.07 0.04 1.61 63 128 clayed 2.1. Statistical Analysis The combined variance analysis of the data obtained from the research was made using the JMP Pro 13 package program and the factors found to be important were evaluated according to the LSD test and grouped. In addition, Biplot analyzes of the obtained data were analyzed using Genstat version 14, using GT (Genotype x Trait)and GL (Genotype ×Location) biplot method as suggested by Yan and Thinker (2005).The graphs obtained were interpreted according to the results obtained by the researchers working on different plants. 3. Results and Discussion According to the combined variance analysis results; genotype, location and genotype × location interaction were found to be statistically signi f icant at the level of 1% and 5 % (Table 5). However, in terms of plant height, genotype and genotypexlocation interaction, and in terms of 1000 seed weight, the locations were notstatistically significant (Table 5).Depending on the traits, genotypes and locations were grouped according to the LSD (0.05) test. Table 5. Variance Analysis Table Variation Sources S DF Plant Height Diameter 1000 Seed Weight Seed yield Oil Ratio Protein Ratio Model 41 50380.583 1572.8842 7462.688 1408419 1004.7634 789.1719 Genotype 18 2378.08 613.887** 4761.23** 172627** 455.256** 292.311** Location 1 45488.1** 647.313** 347.028 1079104** 294.103** 52.6501** Genotype*Location 18 1561.31 293.84** 2064.51** 150723** 247.607* 440.331** Error 1 4 953.124 17.8439 289.925 5965.56 7.79675 3.88021 Error 2 72 6538.156 439.8044 2726.015 51009.9 1459429 231.269 CV(%) 5.99 12.12 8.79 8.39 6.68 10.22 According to 01the variance e analysis results, in terms of plant height; whi l e locations were statistically significant at the 1% level, the interaction of genotype and genotypexlocation was not signi f icant. The average plant height of the locations varied between 139.0-179.0 cm. The longest plant height was obtained from Adana location.In n terms of diameter (cm); Genotype,location and genotypexlocation interaction were found to be statistically significant at the 1% level. The diameters of the locations were 18.0 and 22.8 cm. The largest diameter Was obtained from Adana location.Genotype averages varied between 15.7-23.9 cm. The widest diameter was obtained from the H2 hybrid, and the narrowest diameter was obtained from the H19 (LG 5485) standard variety. In the genotypexlocation interaction, the largest diameter was obtained in Adana location and from H2 and H3 hybrids sharing the same group. The narrowest diameter was obtained from the standard variety G19 (LG 5485) from Mus location. In terms of 1000seed 1V weight(g)trait,genotype e 2and genotypexlocation interaction Was statistically significant at the level of 1%,while it was found to be insigni f icant in terms of locations. In terms of 1000 seed weight (g), the average of genotypes varied between 59.3-83.0 g. In genotypexlocation interaction, maximum 1000 seed weight was obtained from H13 hybrid in Adanalocation, and at least from H18 (LG 50609SX) standard variety in Adana location.According to the variance analysis results,in terms of seed yield; Genotype, location and genotypexlocation interactions were found to be statistically significant at the 1%level. In terms of the average of the locations, the seed yield was 2198 and 4144kg ha. The highest seed yield was obtained from Adana location. According to the genotype averages, the highest seed yield was obtained from the H8 hybrid, and the lowest seed yield was obtained from the standard variety H16 (P64LE141). In the genotypexlocation interaction, the highest seed yield was obtained from the H8 hybrid in Adana location, and the lowest seed yield was obtained from the H2 hybrid in Mus location. Table 6. The averages of the examined traits and the resulting groups Genotypes Plant Height Diameter 1000 seed weight Adana Mus Average Adana Mus Average Adana Mus Average H1 169.7 135.1 152.4 22.3c-h 17.51-m 19.9 E-J 60.01-0 63.3j-n 61.7 GH H2 178.7 139.3 159.0 29.7a 18.11-1 23.9 A 76.3 b-g 58.9 m-o 67.6 D-G H3 178.2 142.9 160.5 28.7a 18.11-m 23.4A-C 70.7 e-k 64.31-n 67.5 D-G H4 182.8 141.3 162.1 23.5c-e17.41-m 20.4D-H 86.3 ab 79.7 a-e 83.0A H5 178.3 142.7 160.5 22.5c-h 18.11-m 20.7E-I 75.3 c-h 69.2 f-1 72.3 B-D H6 183.7 130.6 157.1 23.3 c-f 18.7g-1 21.0 B-G 75.2c-h 72.6c-i 73.9 B-E H7 176.3 142.1 159.2 22.7c-g 19.7 e-k 21.2 A-F 72.3c-k 69.3 f-1 70.8 C-E H8 181.0 141.5 161.2 24.6 b-d 19.1g-1 21.9 A-E 81.8 a-c 76.1c-h 79.0 AB H9 176.3 136.7 156.5 22.5c-h 17.31-m 19.9 E-J 66.7 g-n 74.2c-1 70.4 C-F H10 166.5 135.3 150.9 21.2d-1 20.4 e-j 20.8 C-G 62.5k-n 64.31-n 63.4F-H H11 186.8 132.5 159.7 26.2 a-c 21.2d-1 23.7 AB 78.7 a-f 72.3 c-k 75.5 A-C H12 188.5 138.3 163.4 27.7 a-c 18.6h-1 23.1A-D 72.8c-j 68.0 g-m 70.4 C-F H13 177.5 147.7 162.6 25.8d-1 19.3 f-1 22.5 A-E 86.5a 66.5 g-n 76.5 A-C H14 170.2 135.6 152.9 21.1d-1 15.3lm 18.2G-K 66.3 g-n 59.0m-o 62.7 GH H15 176.3 131.4 153.9 18.31-1 19.0 g-1 18.6F-J 71.7 d-k 73.2c-j 72.4 B-D H16 196.2 144.3 170.2 17.0j-m 17.81-m 17.4 JK 57.2no 66.3 h-n 61.7 GH H17 180.0 143.4 161.7 19.1 g-1 16.5j-m 17.8 H-K 70.5 e-k 58.7m-o 64.6 E-H H18 170.8 138.8 154.8 19.2g-1 15.9k-m 17.6I-K 51.20 67.4 g-m 59.3 H H19 182.7 142.1 162.4 17.21-m 14.1m 15.7K 81.0a-d 73.5 c-1 77.3A-C Mean 179.0 A 139.0 B 22.8A 18.0 B 71.7 68.2 LSD 0.05 Location 8.02 1.09 LSD 0.05 Genotype 2.84 7.08 LSD 0.05 Genotvpe*Location LSD: Low singi f icant dif f erence In terms of oil ratio (%), genotype and locations were found to be statistically significant at the level of 1%, a an nc d the interaction of genotypexlocation Was statistically significant at the level of 5%. In terms of the average of locations, the oil ratio was 38.1 and 41.3 (%). According to the location averag es,the highest percentage of oil ratio (%) was obtained in Adana location. According to genotype averages, t he highest oil ratio was obtained from H16 (P64LP140) and H11 and H14hybrids sharing the same group. In the g enotypexlocation interaction, the highest oi l ratio was obtained from Adana location and H16 (P64LP140) standard variety, and the lowest oil ratio was obtained from H5and H6 hybrids sharing the same group in Mus location. In terms of protein ratio (%); Genotype, location and genotypexlocation interaction were found to be statistically significant at the 1% level . In terms of the averages of their locations, the protein ratio was 16.8 and 18.2 (%). The highest protein ratio was obtained from Mus location. In t erms of the averages of genotypes, it varied between 14.3-19.7 (%). The highest protein ratio was obtained from H13 and H4, H9and H14 hybrids sharing the same group,and the lowest protein ratio was obtained from the H16 (P64LP140) standard variety.In the genotypexlocation interaction, the highest protein ratio was obtained from the H9 hybrid i n Mus location, and the lowest protein ratio was obtained from the H16(P64LP140)standard variety in Adana location. Table 7. The averages of the examined traits and the result i ng groups Genotypes Seed yield) Oil ratio Protein ratio Adana Mus Average Adana Mus Average Adana Mus Average H1 4023 ef 25611j 3292 C-E 45.8 ab 36.81-1 41.3 A-C 14.8j-m 20.4 a-d 17.6 A-E H2 4629 bc 17370 3183 D-F 38.1g-1 39.0 e-k 38.6 C-E 19.9 a-e 15.8 g-1 17.9 A-D H3 3984 ef 19791-0 2982 FG 37.2h-1 37.11-1 37.1 DE 18.7c-g 17.2 e-k 18.0 A-D H4 4535 b-d 1938 m-o 3236 C-F 41.0c-1 37.7g-1 39.4 B-E 19.1 b-f 19.9 a-e 19.5A H5 4863 ab 23851-1 3624 AB 39.8d-k 34.51 37.1 DE 15.8 g-1 18.2d-g 17.0 B-F H6 4952 ab 22981-n 3625 AB 38.5f-1 34.41 36.4E 18.1 d-h 18.0 d-h 18.1 A-D H7 4163 de 2057k-0 3110 EF 42.7 a-f 36.6j-1 39.7 B-D 17.7d-j 19.8 a-e 18.7 AB H8 5260a 22861-n 3773 A 40.5 d-j 37.9 g-1 39.2 B-E 22.0ab 15.11-1 18.5 AB H9 4827 ab 22251-n 3526 A-C 41.9b-g 37.4 h-1 39.7B-D 16.6f-1 22.4a 19.5A H10 4275 c-e 22301-n 3253 C-F 43.4a-d 40.8c-j 42.1 AB 14.4k-m 18.5c-g 16.5 C-G H11 4656 bc 26001 3628 AB 44.9 a-c 41.0c-1 43.0A 16.4f-1 18.9 c-f 17.6 A-E H12 4327 c-e 23321-m 3330 B-E 40.6c-j 38.1 g-1 39.3 B-E 20.2a-d 16.5 f-1 18.4A-C H13 4676 bc 22681-n 3472 A-D 35.9kl 41.0c-1 38.5 C-E 21.2 a-c 18.1d-g 19.7A H14 3992 ef 22481-n 3120 EF 43.3 a-e 42.8 a-f 43.0 A 20.4a-d 18.8c-f 19.6A H15 3097 h 2131j-o 2614HI 43.7a-d 38.8 f-k 41.2A-C 14.21m 17.9 d-1 16.0 D-H H16 2484 1-k 23721-1 2428I 46.2a 40.3 d-j 43.2A 11.0n 17.5 d-i 14.3H H17 3612 fg 1882n-o 2747 GH 39.6 d-k 36.5j-1 38.1 DE 15.2 h-1 15.8g-1 15.5F-H H18 3145h 21771-n 2661 HI 41.5 b-h 37.01-1 39.2 B-E 12.2mn 17.8d-1 145.0 GH H19 3229 gh 20491-0 2639 HI 41.0c-1 36.71-1 38.9 C-E 12.1mn 19.2 b-f 15.6 E-H Mean 4144A 2198 B 41.3 A 38.1B 16.8B 18.2A LSD 0.05 Location 20.08 0.72 0.51 LSD 0.05 Genotype 30.63 3.05 2.06 LSD 0.05 Genotype*Location 43.32 4.32 2.91 LSD: Low singi f icant difference When the correlation values of the bilateral relations between the examined traits are examined; It was determined that there was astatistically significant and I positive relationship at the level of 1% between seed yield (kg ha’), plant height, diameter, oil ratio and 1000 seed weight. There was no significant relationship between seed yield and protein ratio. Table 8. Correlation values of the bilateral relations between the examined traits Examined traits Plant height Diameter Seed yield Oil ratio Protein ratio Diameter 0.5348** Seed yield 0.7613** 0.7186** Oil ratio 0.4028** 0.126 0.2704** Protein ratio -0.2195* 0.2655** 0.1122 -0.3821** 1000 seed weight 0.1999* 0.295** 0.364** -0.1853* 0.3921** **:%1;*: %5 statistically signi f icant at the level According to the analysis of variance results. genotype,location and genotypexlocation interaction contributed to the total variation by 12.30%, 76.94 and 10.74%, respectively, in terms of seed yield (Table 5). When a general evaluation is made in terms of the examined traits, the large difference between locations in terms of seed yield indicates that this trait is largely under the effect of the environment.It has been shown that the environment has a signi f icant effect on plant height. The diameter differed significantly according to the locations. Since there is aparallelr elationship between the diameter and the number of seeds in the diameter, this situation directly affected the seed yield.Since the heritabil i ty of 1000 seed weights is quite high, it did not show signi f icant differences according to the locations.However, 1000 seed weights of the same genotypes according to locations showed higher values in Adana location. The data obtained in the study are in harmony with many researchers (Kaya et al.,2009;Sefaoglu and Kaya, 2018; Cet i n and Oztiirk,2018; Jockovic et al., 2019; Ghaffari et al.,2021). When the climatic data of the locations are e examined in 19general terms,the precipitation in Mus location in April and May caused the sowing date to delay.However, although the average of May is a suitable planting date according to the long-term averages of the temperatures suitable for planting in Mus location, it does not allow sowing in these months when the average precipitation for long years is taken into account. (Table 3). However, due to the effects of global warming, they reported that there were significant changes in the average temperature V variable in Mus location, and t this changeWas 1in 2an increasing trend (Atabey y and dToprak,2018).Accordingly,1tsuggests S the possibi l ity that temperature changes may change the precipitation regime.This situation reveals the possibility that the sowing dates may be brought forward in the following years in the region. It is thought that planting in Mus location i n June causes yield decreases due to the high temperature and low relative humidity, especially during the seed development stage. In terms of the examined traits, i t is thought that the differences in the locations are caused by the climate. 3.1. GGE biplot analysis In GT biplot technique, both the relationship b between traits S and the relationship between genotype traits can be explained. As the angle value (>0--<90°)decreases between the vectors of the two traits, i t shows a positive relationship, and as the angle value (90>-<180°) increases,there is a negative relationship (Kendal and Sayar, 2016; Kendal, 2022). In addition, the positioning of genotypes according to traits also shows which genotype has high values in terms off which traits (Figure 1). Especially, the H2 and H7 hybrids are located in the region of seed yield, diameter and protein ratio, showing that they are satisfactory in terms of these parameters. In addition, H11, H9, H1, H10 and H14hybrids are located at the intersection of protein and oil ratio, showing that they have both good protein and high oi l ratio. On the other hand, the angle between the vectors of seed yield and protein ratio and diameter is quite narrow, indicating a high positive correlation between these traits, and a wide angle between seed yield and oi l ratio and plant height, indicatinga negative correlation between the two (Figure 1 and Table 8). In addition, the most suitable genotypes for each sector and d t traitgroup were determined by the sector analysis (Figure 2). When the traits examined in the research were examined in the sector analysis, the traits were gathered in four different sectors and four groups. The 1st group consisted of 1000 seed weight, the 2nd group consisted of seed yield, protein ratio and diameter, the 3rd group oil ratio and the 4th group the plant height. Particularly, seed yield,protein ratio and diameter formed the same group in the same sector. All standard varieties (H15, H16, H17, H18 and H19)used in the trial show that they are not correlated with any traits by taking place in the sector where no traits are present. It is possible to say that the genotypes in the sectors where the traits are not included are weak in terms of traits. Figure 1. The relationship between genotypes and traits. Figure 2. Grouping of genotypes in terms of traits. Figure 3. Ranking of genotypes i n terms of traits. Figure 4. Ranking of genotypes according t o ideal center. The stabil i ty curve formed over the average data of al l the t raits examined in the study and the ranking biplot method that ranks the genotypes according to thiss tabil i ty curve are shown i n Figure 3. It i s a model that ranks genotypes according to stability (horizontal) and mean (vertical)baseline curves for all traits in multi-trait studies. In line with these explanations, in Figure 3, it was determined that H6 was the most stable in terms of all traits, H13 and H8 hybrids had the highest values in terms of all traits, and H14 was the genotype with the weakest stability. In addition, H19, H16and H17 standard varieties did not perform wel l because they were below the curve (vertical curve), and stable genotypes H9and H11 hybrids above the vertical curve and close to the horizontal curve could be selected for selection because they were good performing genotypes. In addition, genotypes can be ranked accordingttOothe ideal center created according to the average of the traits in t heComparison biplot model (Figure 4).Accordingly, H13 and H8 hybrids w ere found to be the most ideal genotype since they are located in the region closest to the ideal center . The GT biplot technique seems to be a useful technique that can be used easily in selection, as it provides us with a lot of convenience in visually interpreting the relationships. Many researchers have reported that this technique is beneficial in the results of their research on this subject (Gauch, 2006; Balalic et a l ., 2013; Xu et al.,2014; Movahedi et al., 2020; Khan et al.,2021). Figures 5, 6, 7 and 8 show the GGE biplot based on a two-way yield table over genotype x environment i nteraction in the study conducted at Adanaand Mus locations. Scatter plot (Total -100.00%) Figure 5. Locations and GenotypexLocation relationship. Figure 6. Grouping of locations by sector analysis and position of genotypes relative to location. Figure 7. Stabil i ty of genotypes according to locations. Figure 8. Ranking the genotypes according to the idea center according to the locations. All environmentss are assumed to be equally important in genotype assessment as environment standardized data are used.It allows for appropriate visualization of relationships between environments for environment-focused singular V value segmentation. This biplot explained all (100%) of the GGE and showed that the GGE is fairly straightforward for the genotypes in this dataset. The effect of PC1 on the total variation was explained as 58.84 % versus the value of PC2 as 41.16%, demonstrating that it could adequately explain the GGE patterns dependent on the GGE biplot.Figure 5 gives i information about the relationship between Adana and Mus location the relationship between genotype location. Visually, it shows that both locations are not very closely related and differ from each other and can be considered as separate environments in the selection of genotypes. When we evaluate the genotypes according to both locations in terms of the average of al l characteristics;H1 hybrid especially for Mus location, H4hybrid has better results for Adana location and can be recommended in years and locations with similar ecological conditions and can be selected in selection, while H15,H16, H17, H18 and H19 standard varieties do not have suitable results for locations,but more It is thought t hat the experiment should be repeated in the following years in order to make decisive decisions (Figure 5).The determination of mega-environments according to the averages of genotypes reveals that similar environments should be excluded in future studies. and environments that increase operating costs and do not create differences should not be used unnecessarily (Figure 6). In the sector analysis made in this sense, 6 sectors were formed1and d the circles defining eachlocation were included in different sectors and mega-groups, revealing the differences of the circles. H8, H6 and H9 hybrids of the genotypes in the same sector with the environments have good results in Adana location, and the H11, H13, H5 and H12hibrids in Mus location, while the H2, H17,H18 and H19 hybrids of the genotypes in different sectors from the environments have good results in Adana and 1Mus locations.The ranking biplot method,which creates the stability curve over the average data of al l the traits examined i n the study and ranks the genotypes according to this stabi l ity curve, is shown in Figure 7.According to this model, which ranks genotypes according to stabi l ity (horizontal) and mean (vertical) baselines in terms of al l traits in multi-feature studies, it shows that H8 and H11 hybrids have both stable and good results i n terms of al l traits in Adana and Mus locations. These genotypes were followed by the H13, H5, H0 and H12 hybrids. However, H2 hybrid and H16 standard variety, which are above average but unstable H1 and H4 hybrids and which are unstable but below average, can be eliminated for Adana and Mus locations.Genotypes can be ranked according to the ideal center formed according to ) the average of the traits (Figure 9).Accordingly, it has been determined that H 8and H11 hybrids are quite ideal genotypes by being located in the ideal center, and H13, H5, H12 and H9 hybrids can be preferred after these genotypes because they are located in the region close to the ideal center. In addition, itt has S been determined that it is very convenient for us to determine the genotypes to be selected and eliminated by easily observing the genotypes above and below the average vertical curve. These results are confirmed by the results of many researchers (Mousavi et al., 2016; Jockovic et al., 2019; Saremi-Rad et al., 2020; Ghaffari et al., 2021;Gholizadeh et al .,2022). 4. Conclusion In this study, which was carried out in Adana and Mus locations i n 2022 and tested 14hybrids sunflower and :5standard sunflower V varieties;According to )the results of the research, it was concluded that the hybrids used in the research w were superior in terms of both yield ve yield components and quality traits when compared with the standards. A COm ccording to the research results; H6, H18 and H3showed high performance in terms of yield and yield components, H1, H10 and H14hybrids showed high performance in terms of oil ratio, while H9 and H11 showed high performance in terms of both yield and yield componentsand oil ratio. In addition.according to the biplot results, i t was determined that H6 was the most stable genotype in terms of al l traits, while H8 and H13 were the genotypes with high values.In the genotype location evaluation made with biplot analysis technique, it was shown that the locations were in different groups and H8 and H11 had good results. As a result, i t was concluded t hat Biplot analysis technique visually faci l itated the work of breeders in selection, and H1, H10 and H14hybrids in terms of oil ratio, H6, H18 and H3 genotypes in terms of seed yield, and H9and H11 hybrids for both criteria and H8and H13 in all parameters hybrids S;are recommended. It has been concluded that different genotypes can be candidates for registration in terms of oil production, y i eld and quality traits, or all parameters. Declaration of Author Contributions The authors declare that they have contributed equally to the article. All authors declare that they have seen/read and approved the f inal version of the article ready for publication. Declaration of Conflicts of Interest All authors declare that there i I s S no conflict of interest related to this article. References Aarthi, S., Suresh, J ., Leela, N. K., Prasath,D., 2020. Mult i i environment testing reveals genotype-environment interaction for curcuminoids in turmeric (Curcuma longa L.). Industrial Crops and Products, 145:112090. Alizadeh, B., Rezaizad, A., Hamedani,M.Y., Shiresmaeili, G., Nasserghadimi,F., Khademhamzeh, H.R., Gholizadeh,A ., 2022. Genotype ×environment interactions and simultaneous selection for high seed yield and stability in Winter Rapeseed (Brassica napus L.)multi-environment t rials. Agricultural Research, 11(2):185-196. Andrianasolo,F.N.,Casadebaig,P..Langlade, N., Debaeke, P., Maury, P.,2016. Effects of plant growth stage and leaf agingon the response of transpiration and photosynthes i s to water deficit in sunflower. Functional Plant Biology,43(8): 797-805. Ansarifard, I.,Mostafavi, K., Khosroshahli,M., Reza Bihamta , M., Ramshini, H.,2020. A study on genotype -environment interaction based onGGE biplot graphical method sunflower genotypes (Helianthus annuus L.). Food Science & Nutrition, 8(7): 3327-3334. Anonim, 2022.T Turkey y0oilsunflower production statistics. Access link:https://biruni .tuik.gov.tr/medas/?kn=92&locale=tr (Accessed: 10.09.2022) AOAC, 2005. Official methods of analysis of the AOAC, 18th ed. Methods 990.03Association of Official Analytical Chemists. Arlington, VA, USA. Atabey, S., Toprak, Z.F., 2018.Long-term temperature change comparison of Bitlis and Mus provinces within the framework of climate change. DicleUniversity EngineeringFacultyJ Journal of Engineering,9(1):419-428. Balalic,I., Brankovic, G., Zoric, M., Miklic,V., Jocic, S., Surlan-Momirovic, G.,2013. Sunflower mega-environments in SerbiaI revealed by GGE biplot analysis. Ratarstvo i povrtarstvo,50(2):20-27. Cetin, K., Oztirk, O., 2018. Determination of yield and yield characteristics of some hybrid sunflower r cultivars. Selcuk Journal of Agriculture and Food Sciences,32(3): 282-288. Dall6, S.C., Zdziarski, A.D., Woyann, L.G., Milioli, A.S., Zanella, R., Conte, J.,Benin, G., 2019. Across year and year-by-year GGE biplot analy sis to evaluate soybean performance and stabili t y in multi-environment trials. Euphytica, 215(6): 1-12. da Cruz, D.P., de Amaral Gravina, G.,Vivas, M., Entringer, G.C.,Rocha,R. S.,da Costa Jaeggi, M.E.P., Daher, R.F.,2020.Analysis of the phenotypic adaptability and stabi l ity of strains of cowpea through the GGE Biplot approach. Euphytica, 216(10): 1-11. FAA(OSTAT, 2022. World oil sunflower production statistics. Access link:https://www.fao.org/faostat/en/#data /Q CL/visualize (Accessed: 10.09.2022) Gauch Jr, H.G., 2006. Statistical anal y sis of yield trials by AMMI and GGE. Crop Science, 46(4):1488-1500. Ghaffari, M., Gholizadeh , A., Andarkhor,S. A., Zareei Siahbidi, A., Kalantar Ahmadi , S. A., Shariati, F., Rezaeizad,A., 2021. Stabi l ity and genotypex environment analysis of oil yield of sunflower single cross hybrids in diverse environments of Gholizadeh, A., Dehghani, H., 2016.Graphic analysis of trait relations of Iranian bread wheat germplasm under non-saline and saline conditions using the biplot method. Genetika, 48(2):473-486. Gholizadeh, A., Khodadadi, M., Sharifi-Zagheh, A. 2021. Modeling the f inal fruit yield of coriander (Coriandrum sativum L.) us i ng multiple linear regression and artificial neural network models. Archives of Agronomy and Soil Science, 1-15. Gholizadeh, A., Ghaffari, M., Jabbari, H.,Cheshmehnoor. M., Nadali, F..Payghamzadeh 1,, K K., Kia, S., 2022.Evaluation of Genotype x environme nt interaction for seed yield of sunflower hybrids using GGE biplot method. Journal of Crop Breeding, 14(41): 194-204. Hassani, M., Heidari, B., Dadkhodaie, A.,Stevanato,.2018.(Genotypeb by P environment interaction components underlying variations i n root, sugar and white sugar yield in sugar beet (Beta vulgari s L.). Euphytica,214(4):1-21. Jockovic.M., Cvejic, S., Jocic,,S.,Marjanovic-Jeromela, A., Miladinovic,D., Jockovic,B.. Radic.V.,2019.E valuation of sunflower hybrids in mult i -env i ronment trial (MET). Turkish Journal ofField Crops, 24(2): 202-210. Kaya ,, Y., Atakisi, I .K. 2002. Stability analysis in different yield characters in sunflower (Helianthus annuus L.).ANADOLU Journal of Aegean Agricultural Research n Institute,12(2):1-20. Kaya, Y., Evci, G., Pekcan, V., Gucer, T .,Yilmaz, M.I., 2009. The determination relationships between oil yield and some yield traitsin sunflower. Journalof Agricultural Sciences, 15(04): 310-318. Kendal, E., 2022. Us i ng Biplot Analysis Technique toSelection in Tritikale Breed ing Studies. Yuzuncu Yul UniversityJournal of AAgriculturalSciences,32(1): 186-198. Kendal, E., Sayar,M.S., 2016. The stability of some spring triticale genotypes using biplot analysis.JAPS: Journal of Animal & Plant Sciences,26(3):10-22. Khomari, A., Mohammadi, A., 2017.Stability study of yield in sunflower (Helianthus annuus L.) cultivars using AMMI method.Journal of(Crop Breeding, 9(23): 117-124. Lu'quez,J .E., Aguirrezabal,L.A.N.,Agiiero,M.E., Pereyra, V.R. 2002.Stabil i ty and adaptability of cultivars in non-balanced yield tri a ls. comparison of methods for S selecting “high oleic’sunflower hybrids for grai OICICS n yield and quality . Journal of A gronomy and Crop Science, 188(4):225-234. Malla, S., Ibrahim, A.M., Little,.R..Kalsbeck, S., Glover, K.D., Ren, C.,2010. Comparison of shifted mul t iplicative model, rank correlation,and biplot analysis for clustering winter wheat production environments. Euphytica,174(3):357-370. Mohammadi. R.. Amri. A.. 2013.Genotypex environment interaction and genetic improvement for yield and yield stability of rainfed durum wheat in Iran. Euphytica, 192(2):227-249. Movahedi, H., Mostafavi, K., Shams, M.,Golparvar, A.R . 2020. AMMI analysis of genotypex environment interaction on grain yield of sesame (Sesamum indicum L.) genotypes in Iran. Biotechnology &Biotechnological Equipment, 34(1):1013-1018. Mousavi, S.M.N., Hejazi, P., Khalkhal i ,S.K.Z., 2016. Study on stability of grain yield sunflower cultivars by AMMI and GGE biplot in Iran. Molecular PlantBreeding,7(2): 1-6. Olanrewa j u, O.S., Oyatomi, O., Babalola ,O.O., Abberton, M., 2021. GGE Biplot analysis of genotypex environmentinteraction and yield stabil i ty in bambara groundnut . Agronomy, 11(9): 1839. Omoigui, L.O., Ajeigbe, H.A., Akinwale,R.O., Timko, M.P., Oyekunle, M., Bello,L .L., 2017. Performance of cowpea V varieties under striga gesnerioides (Willd.) vatke infestation using biplot analysis. Euphytica,213(11):1-16. Rakshit, S., Ganapathy, K.N., Gomashe,S.S.·.,Rathore, A., Ghorade,FR.B..Kumar, M.V., Pati l , J.V., 2012. GGE biplot analysis to evaluate genotype,environment and their interactions in sorghum multi-location data. Euphytica, 185(3):465-479. Saremi-Rad. A.. Mostafavi. K..Mohammadi, A.,2020.. Genotype-environment interaction study base GGE biplot t method d for kernel yield m sunflower (Helianthus annuus 购 cultivars. Journal of Crop Breeding, 12(34):43-53. Sefaoglu,F.,Kaya,C..22018. The adaptation and yield components of oil s unflower (Helianthus annuusS L.)genotypes under Erzurum ecological conditions. Turkish .Journal of Agricultural and Natural Sciences,5(3):222-230. Seiler, G.J ., Qi, L.L., Marek, L.F . 2017.Utilization of sunflower crop wild relativesS for C cultivated sunflower improvement. Crop Science,57(3):1083-1101. Sserumaga, J.P., Oikeh, S.O., Mugo, S.,Asea, G., Otim,,M.,E Beyene,Y..Kikafunda.,J J.,2016. Genotype by environment interactions and agronomic performance of doubled haploids testcross maize (Zea mays L.)hybrids. Euphytica, 207(2):353-365. TTSM. 2001.Sunflower technical instruction. Ankara, 2001. Yan, W., 2015.Mega-environment analysis and test location evaluation based on unbalanced multiyear data . Crop Science,55(1): 113-122. Yan, W., Hunt , L.A. 2001. Interpretation of genotypex environment interaction for winter wheat yyiieelldd iin Ontario. Crop Science,41(1): 19-25. Yan, W., Hunt, L. A., Sheng, Q., Szlavnics,Z., 2000. Cultivar evaluation and mega-env i ronment investigation based on the GGE biplot . Crop science, 40(3):597-605. Yan, W.,Rajcan, I ., 2002. Biplot analysis of test sites and trait relations of soybean in Ontario. Crop science,42(1): 11-20. Yan. W., T i nker, IN.A., 2006. Biplot analysis of multi-environment trial data:Principles and applications. Canadia 17journal of plant science, 86(3):623-645. Xu, N.Y., Fok, M., Zhang, G .W., Jian, L.I.,Zhou, Z.G., 2014. The application of GGE biplot analysis for evaluat ng test locations and mega-environment investigation of cotton regional trials. Journal of Integrative Agriculture, 13(9):1921-1933. To Cite : Yasar, M., Cil, A.N., Ci l , A., 2023. Investigation of Genotype × Environment Interaction in Some Sunflower (Helianthus annuus L.) Genotypes in Different Environmental Conditions MAS Journal of Applied Sciences. 8(1): 41-55. DOI:http://dx.doi.org/10.5281/zenodo.7636963.
确定

还剩13页未读,是否继续阅读?

产品配置单


中国格哈特为您提供《葵花籽脂肪和蛋白质含量的检测》,该方案主要用于炒货食品及坚果制品中营养成分检测,参考标准《GB 5009.5 食品安全国家标准 食品中蛋白质的测定》,《葵花籽脂肪和蛋白质含量的检测》用到的仪器有格哈特全自动快速索氏提取SOXTHERM、格哈特凯氏消化系统KT8S、格哈特维克松无水低能耗废气涤气系统VS、格哈特带自动进样器全自动凯氏定氮仪VAP500C、德国加液器MM、滤纸筒
相关方案
更多
该厂商其他方案
更多