


方案详情
文
Commercially available high speed steel was analyzed
simultaneously using the EBSD and EDS techniques at
a very high speed of more than 200 points/s. Thanks
to its extremely fast reanalysis option the CrystAlign™
software permits the user to launch measurements without
knowing all the phases present in the sample. This in turn
significantly reduces the preparation time needed before
launching the measurement. Thanks to these new hardware
and software developments the SEM occupation time for
acquiring a map of 480,000 points was drastically reduced
to less than one hour i.e. 38 min for data acquisition, plus
maximum 15 min for sample, electron beam, hardware and
software setup.
方案详情

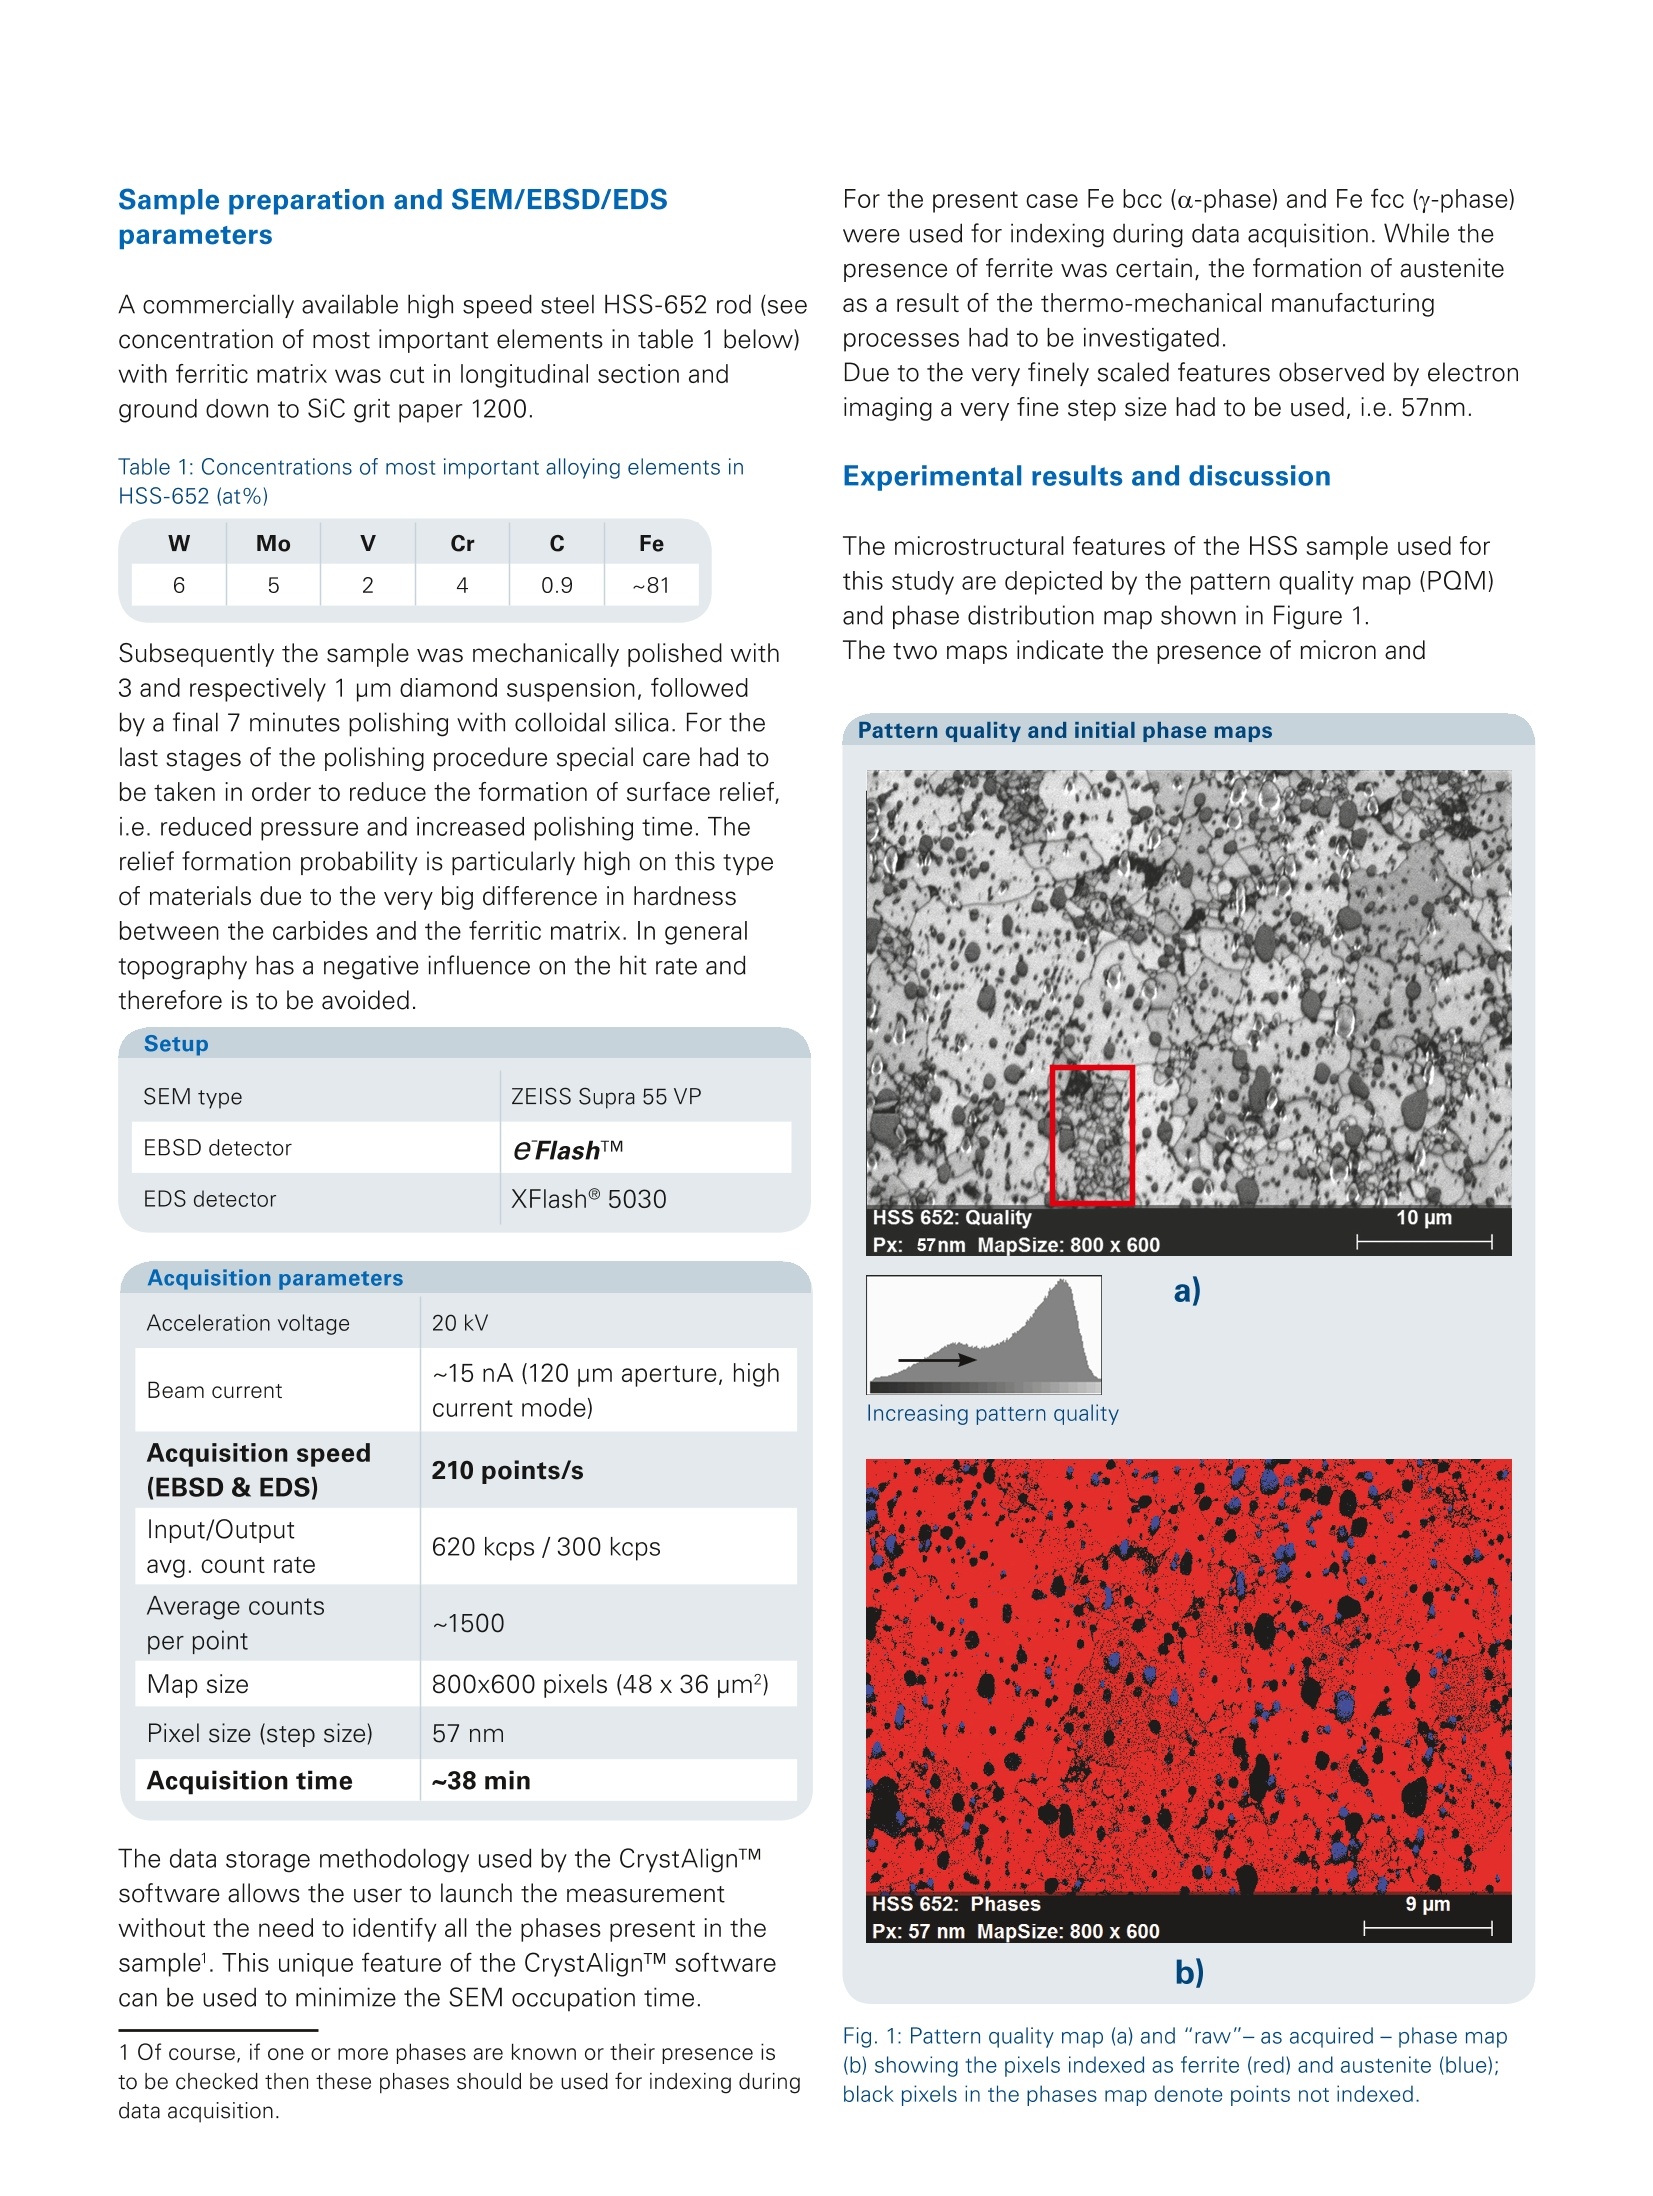
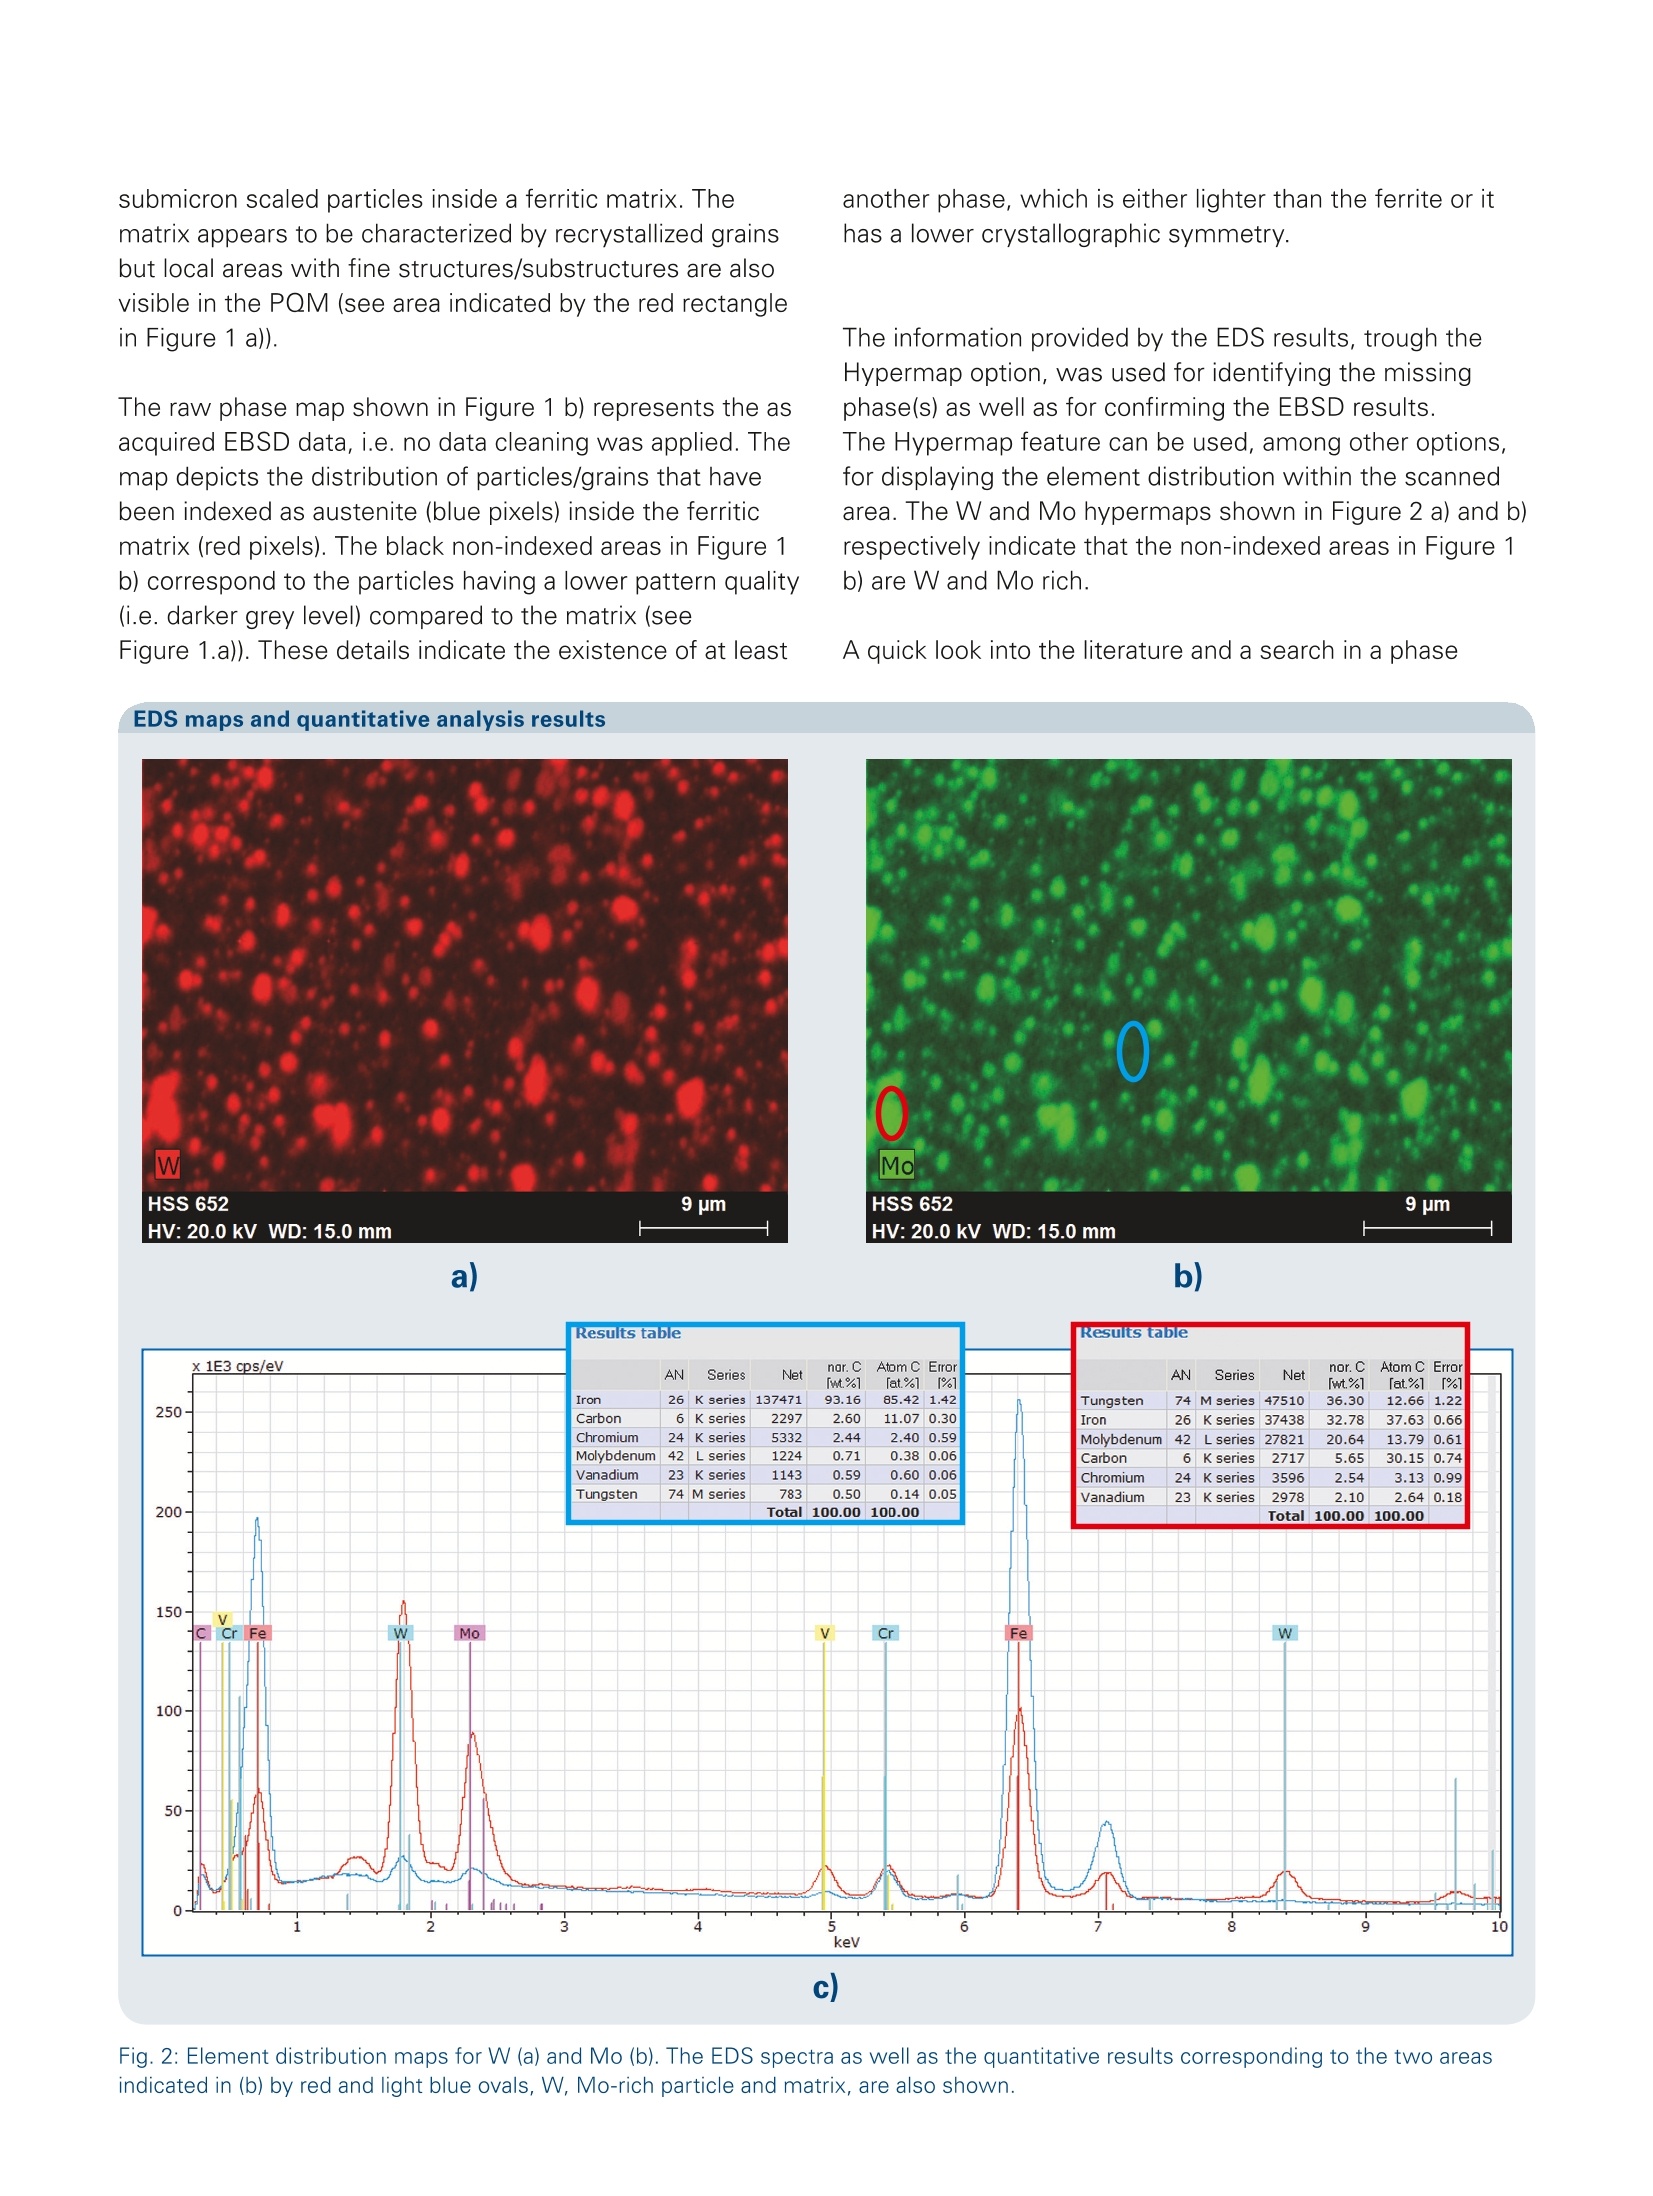
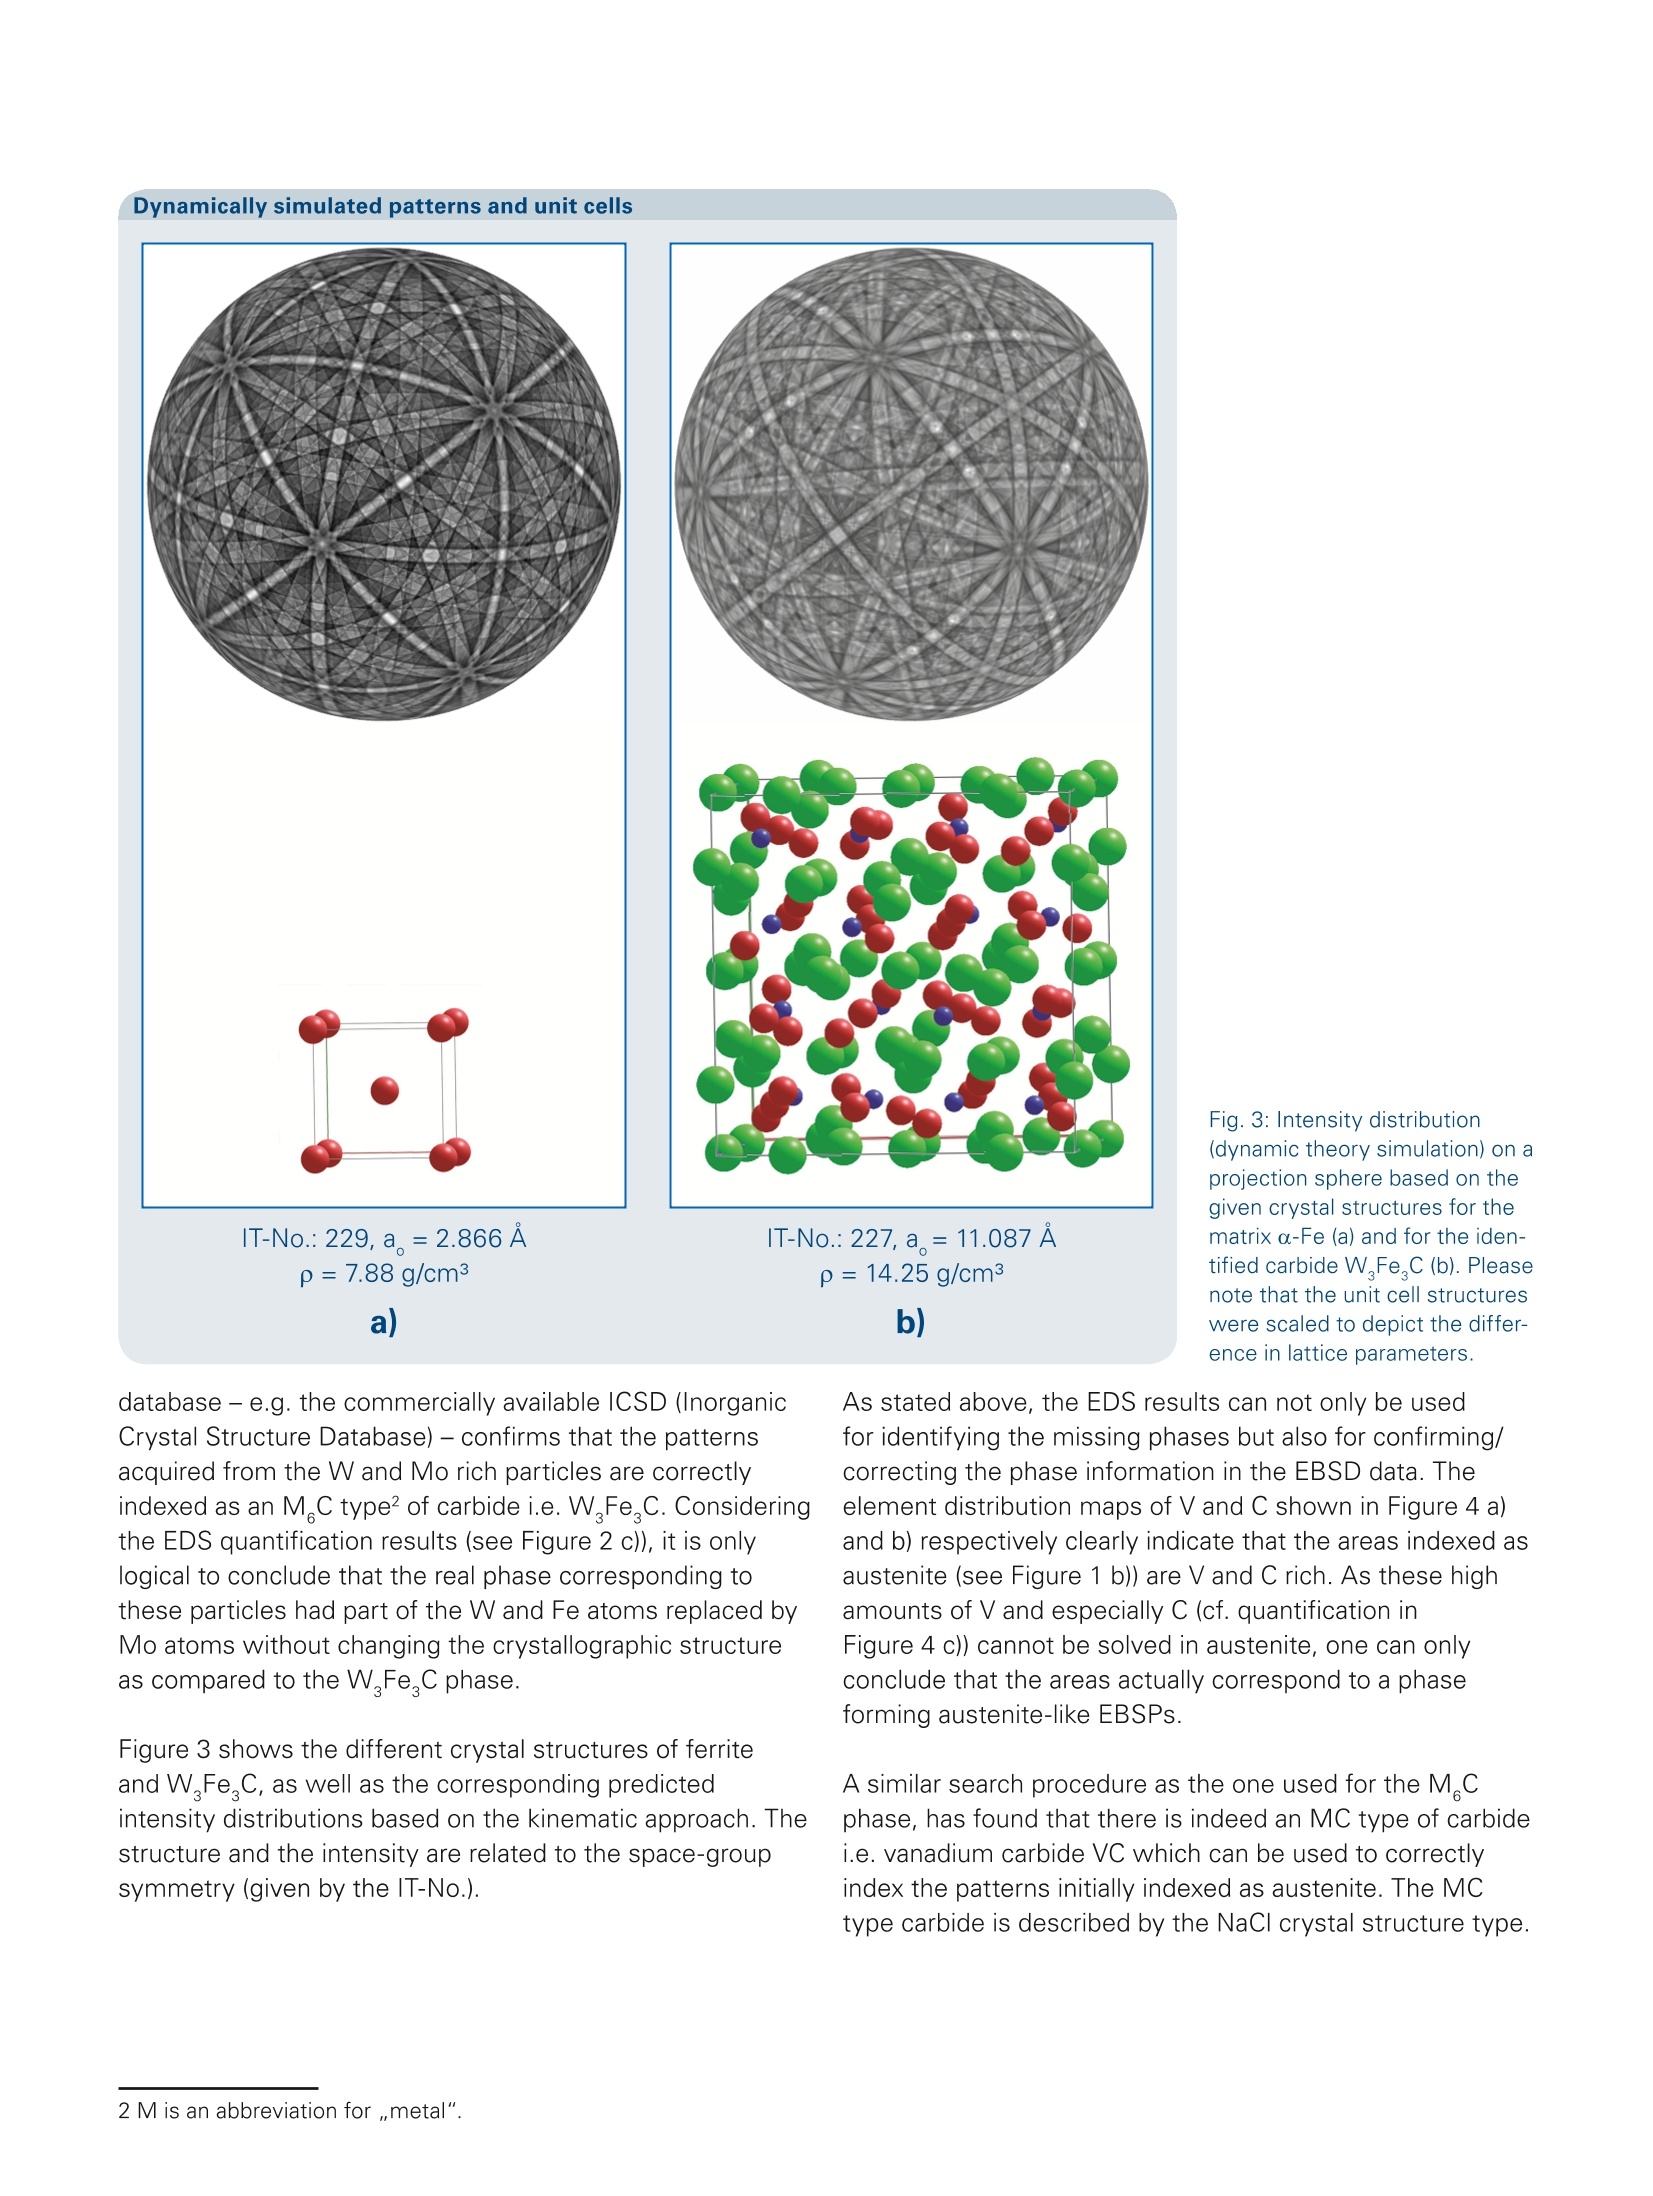
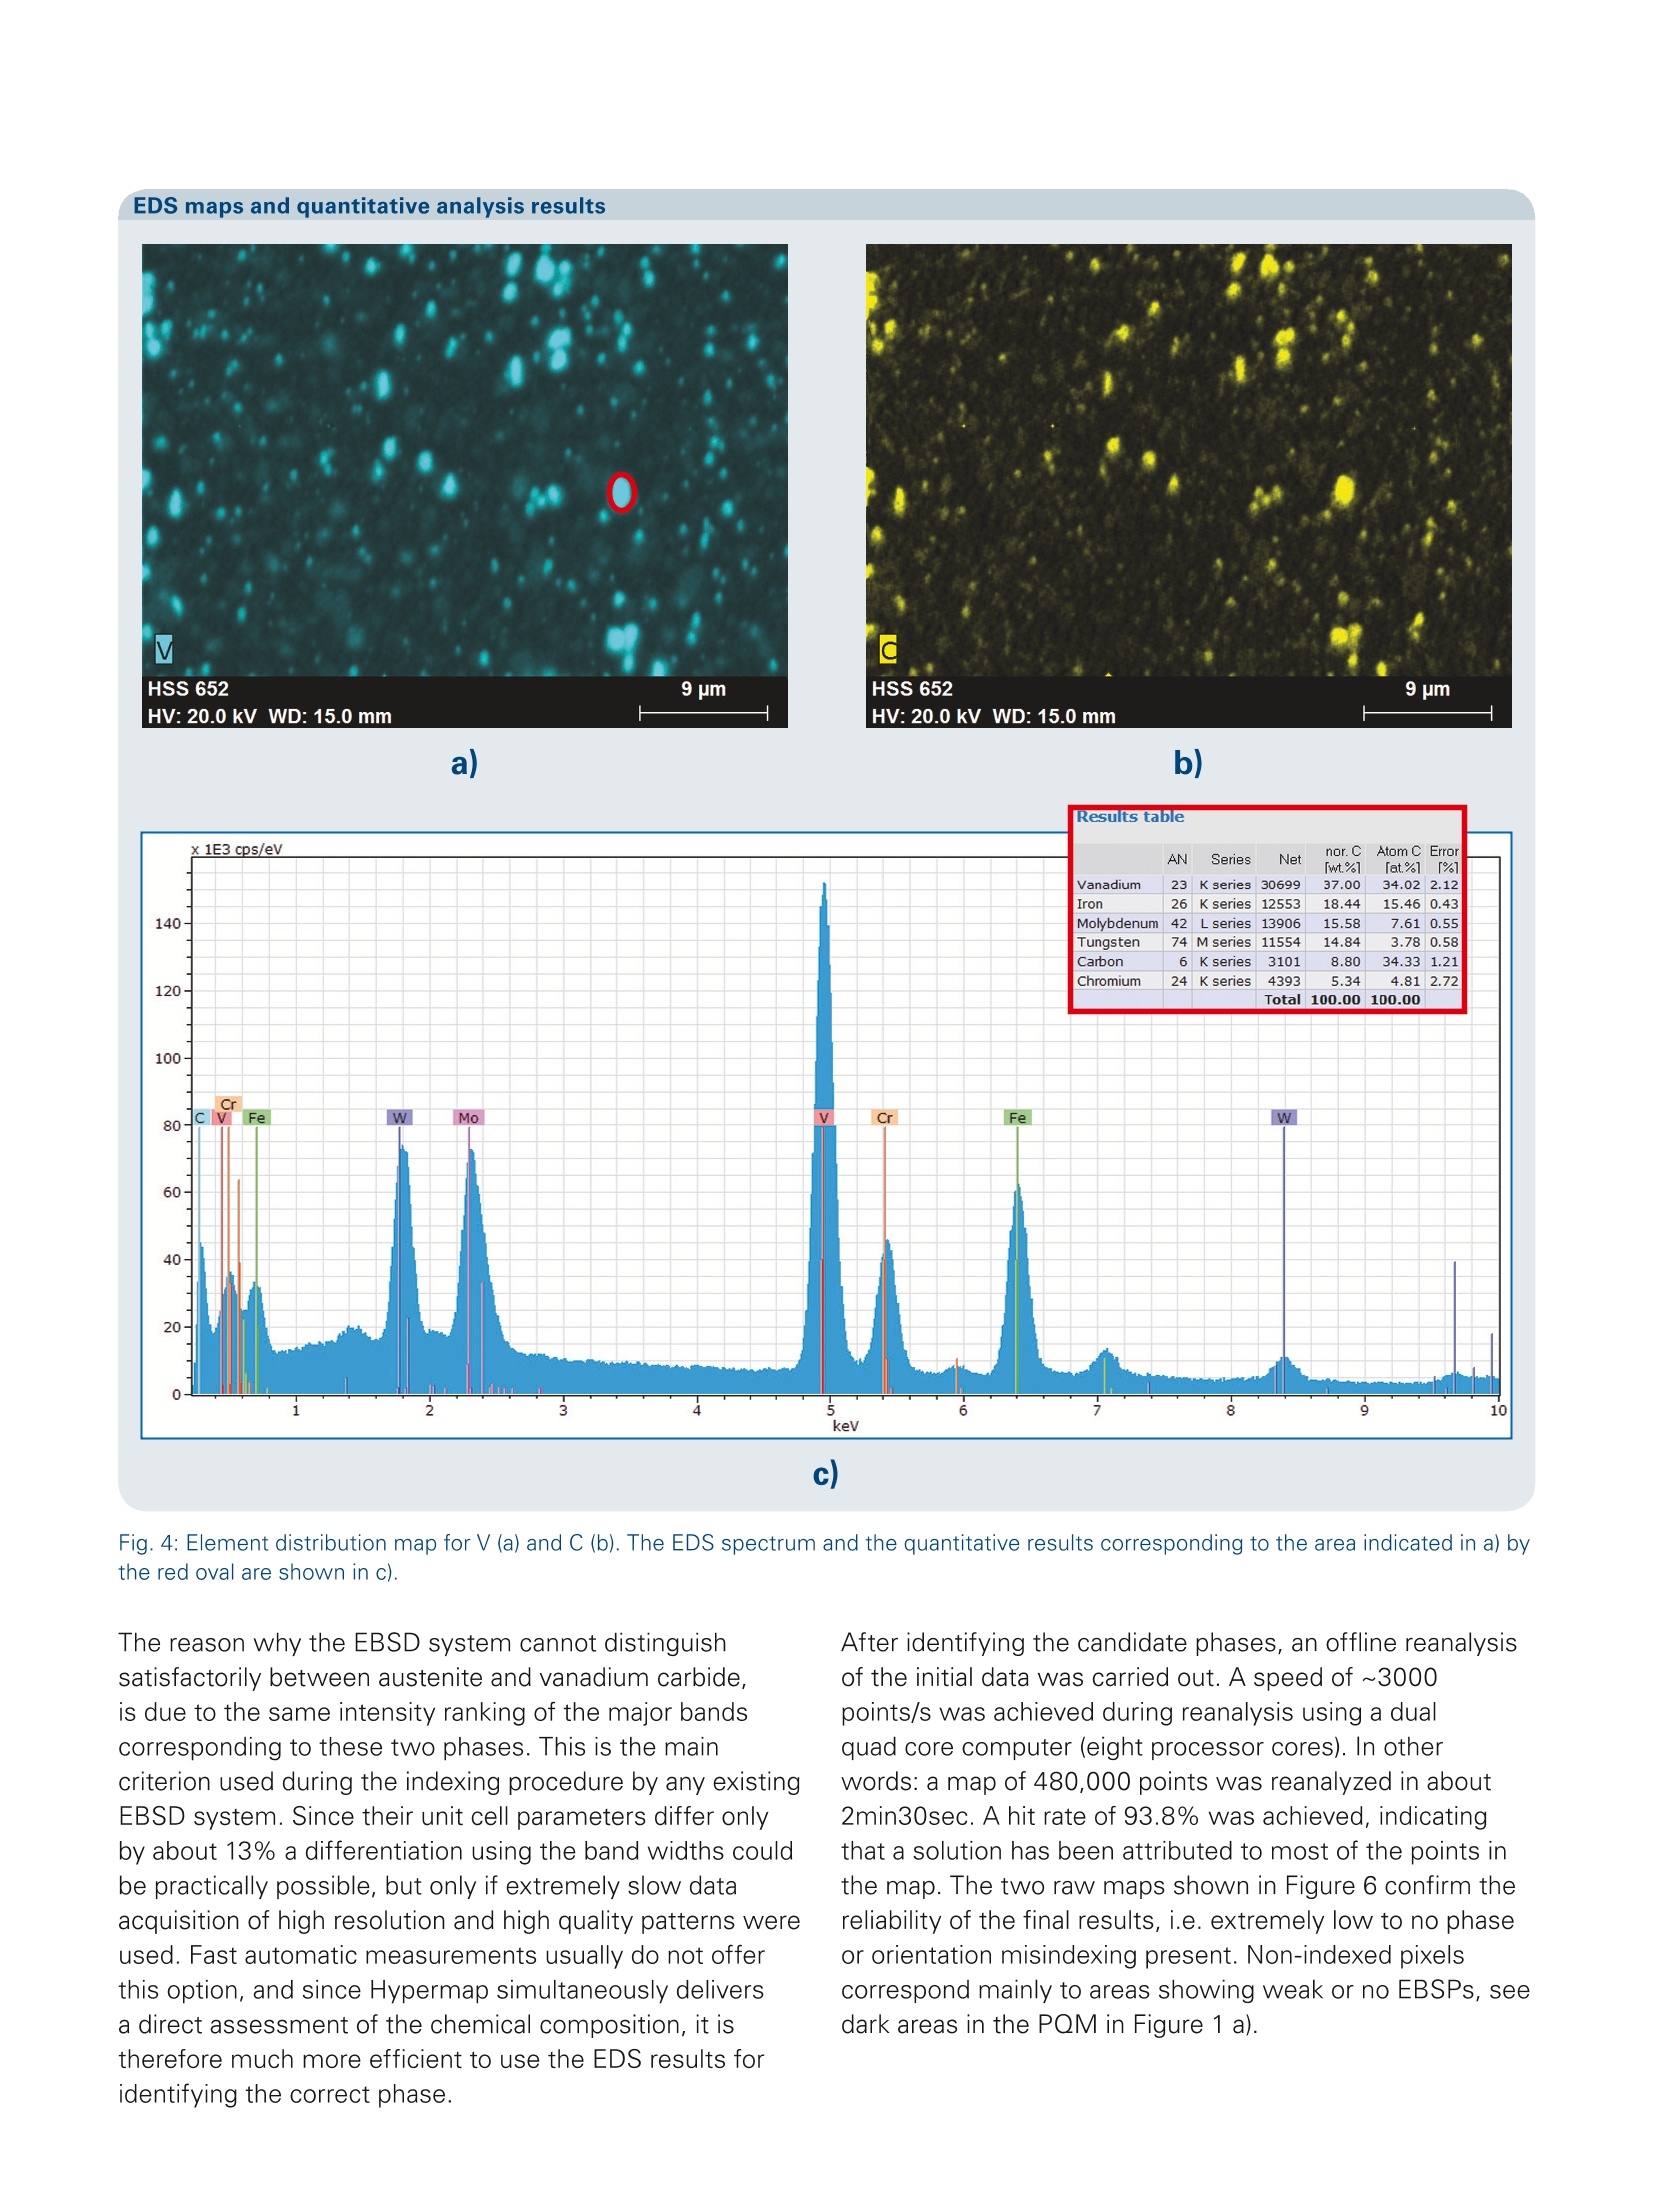
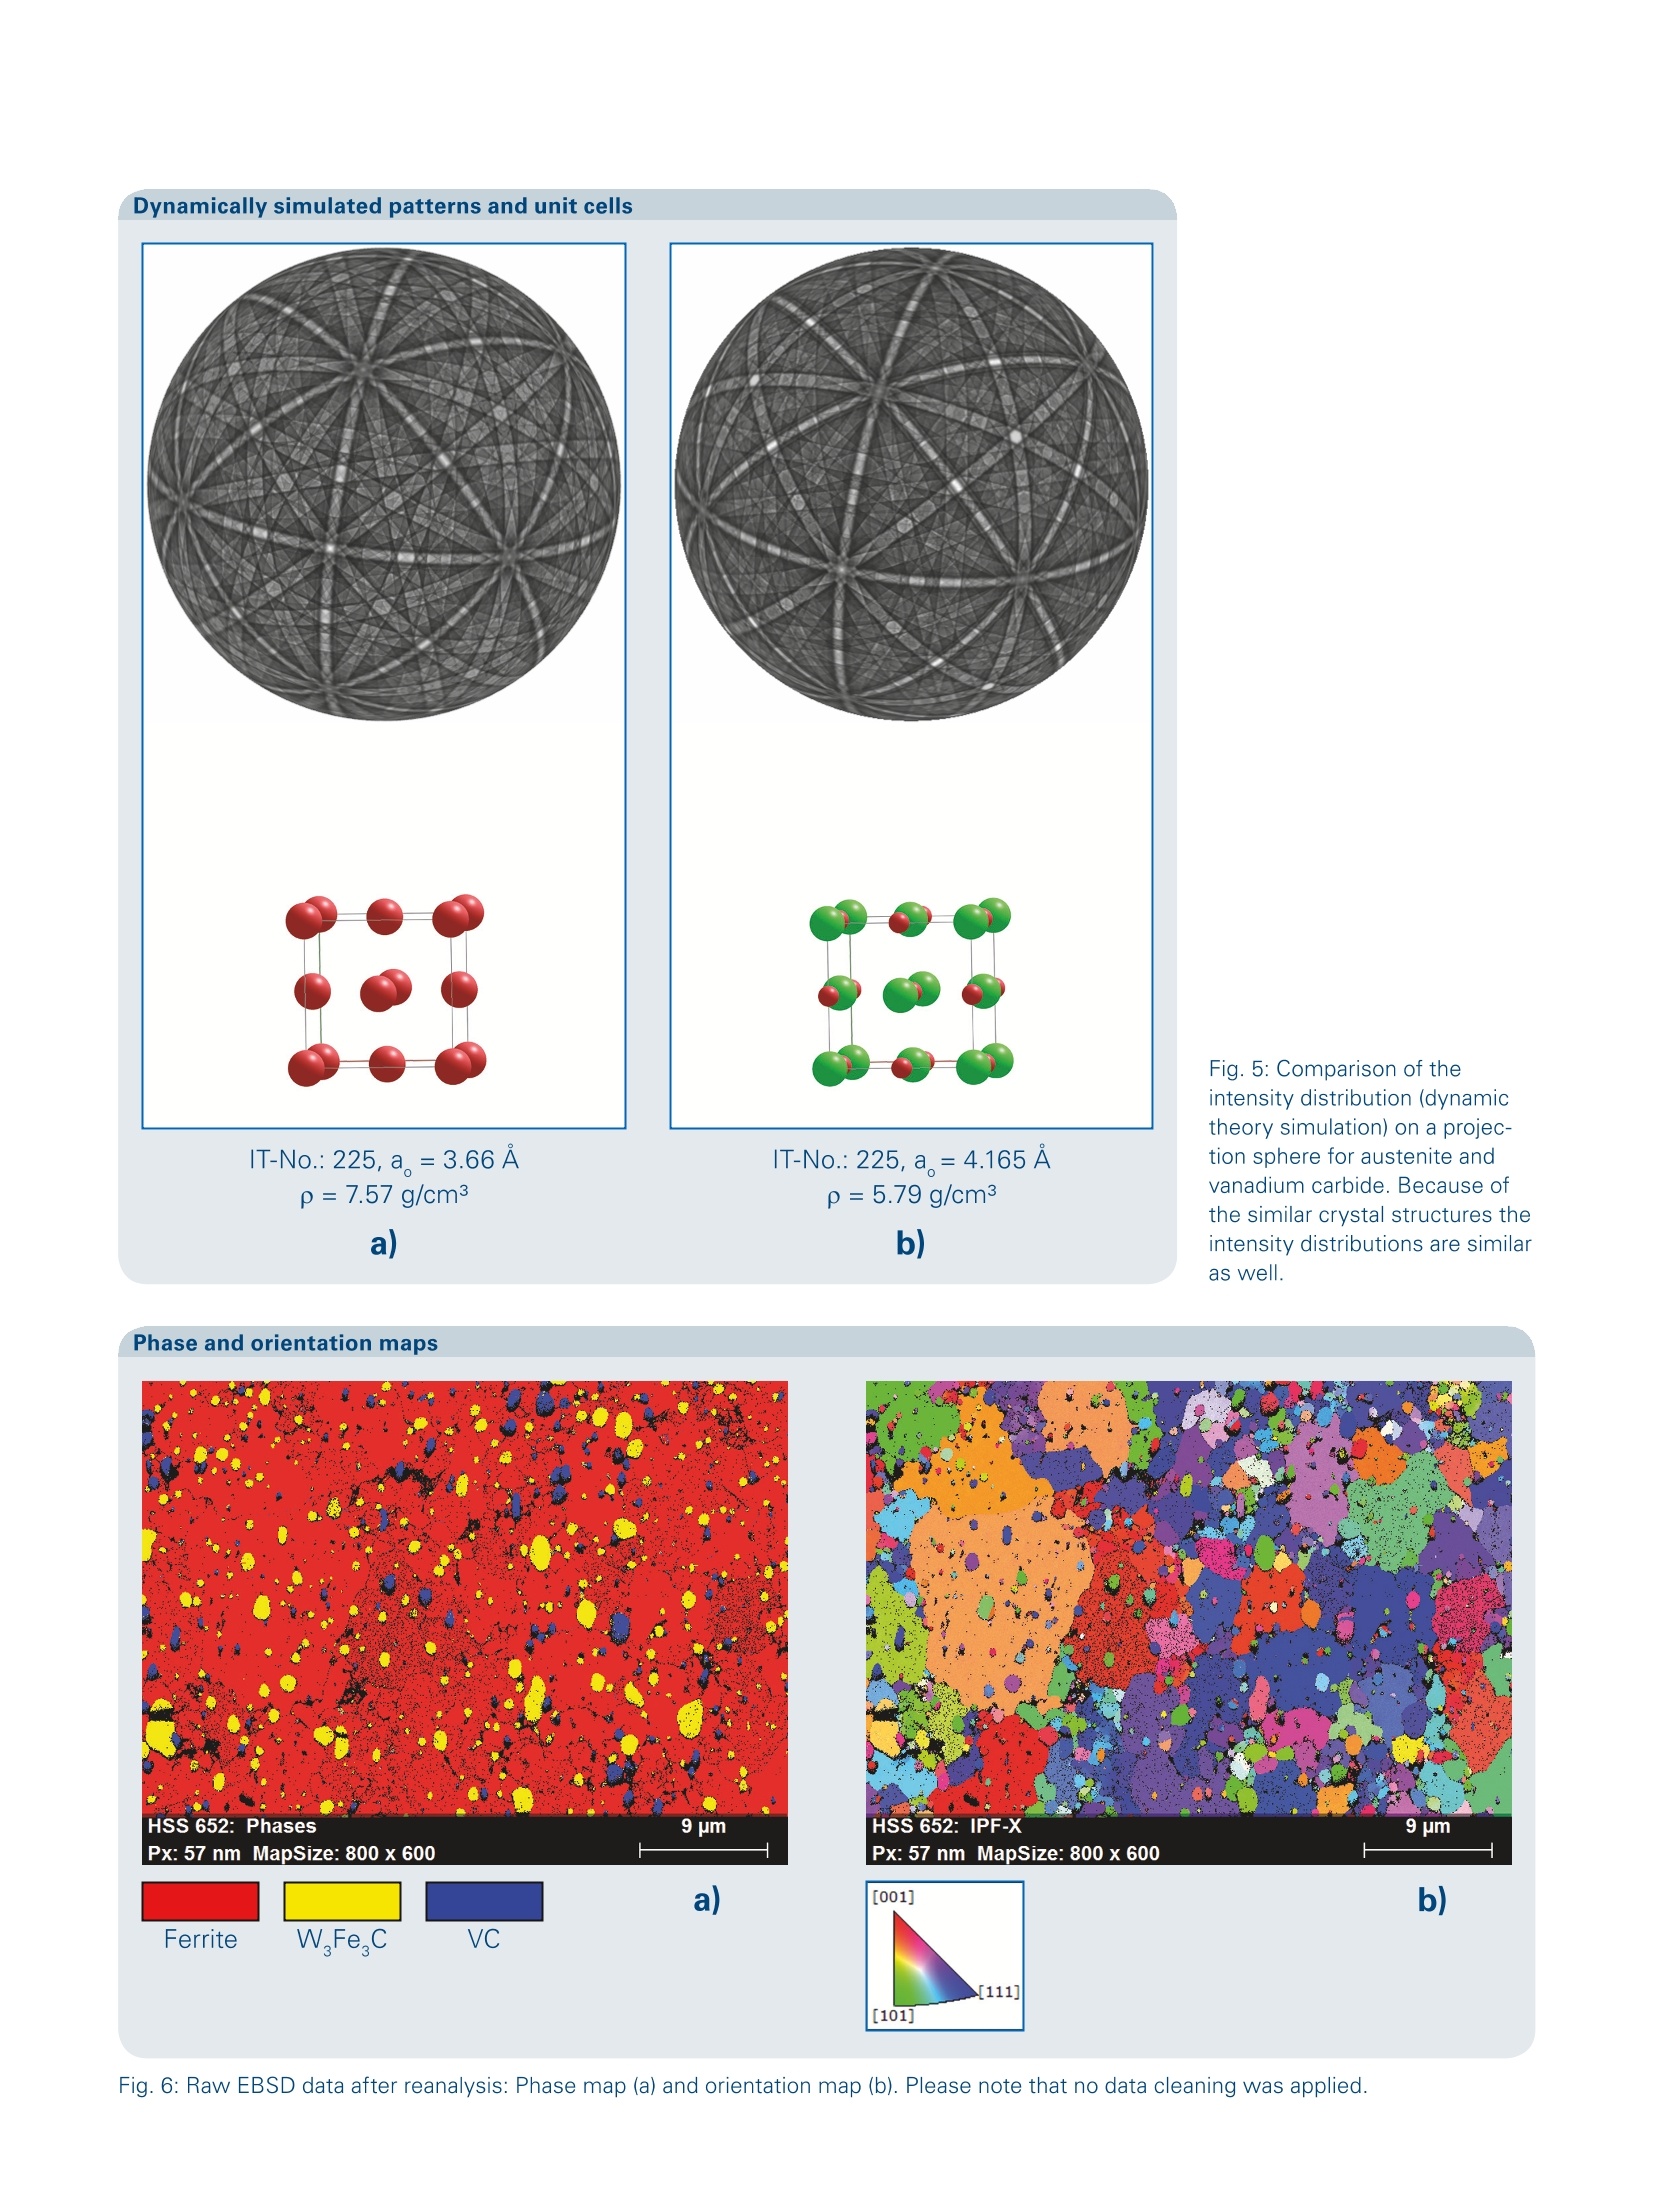
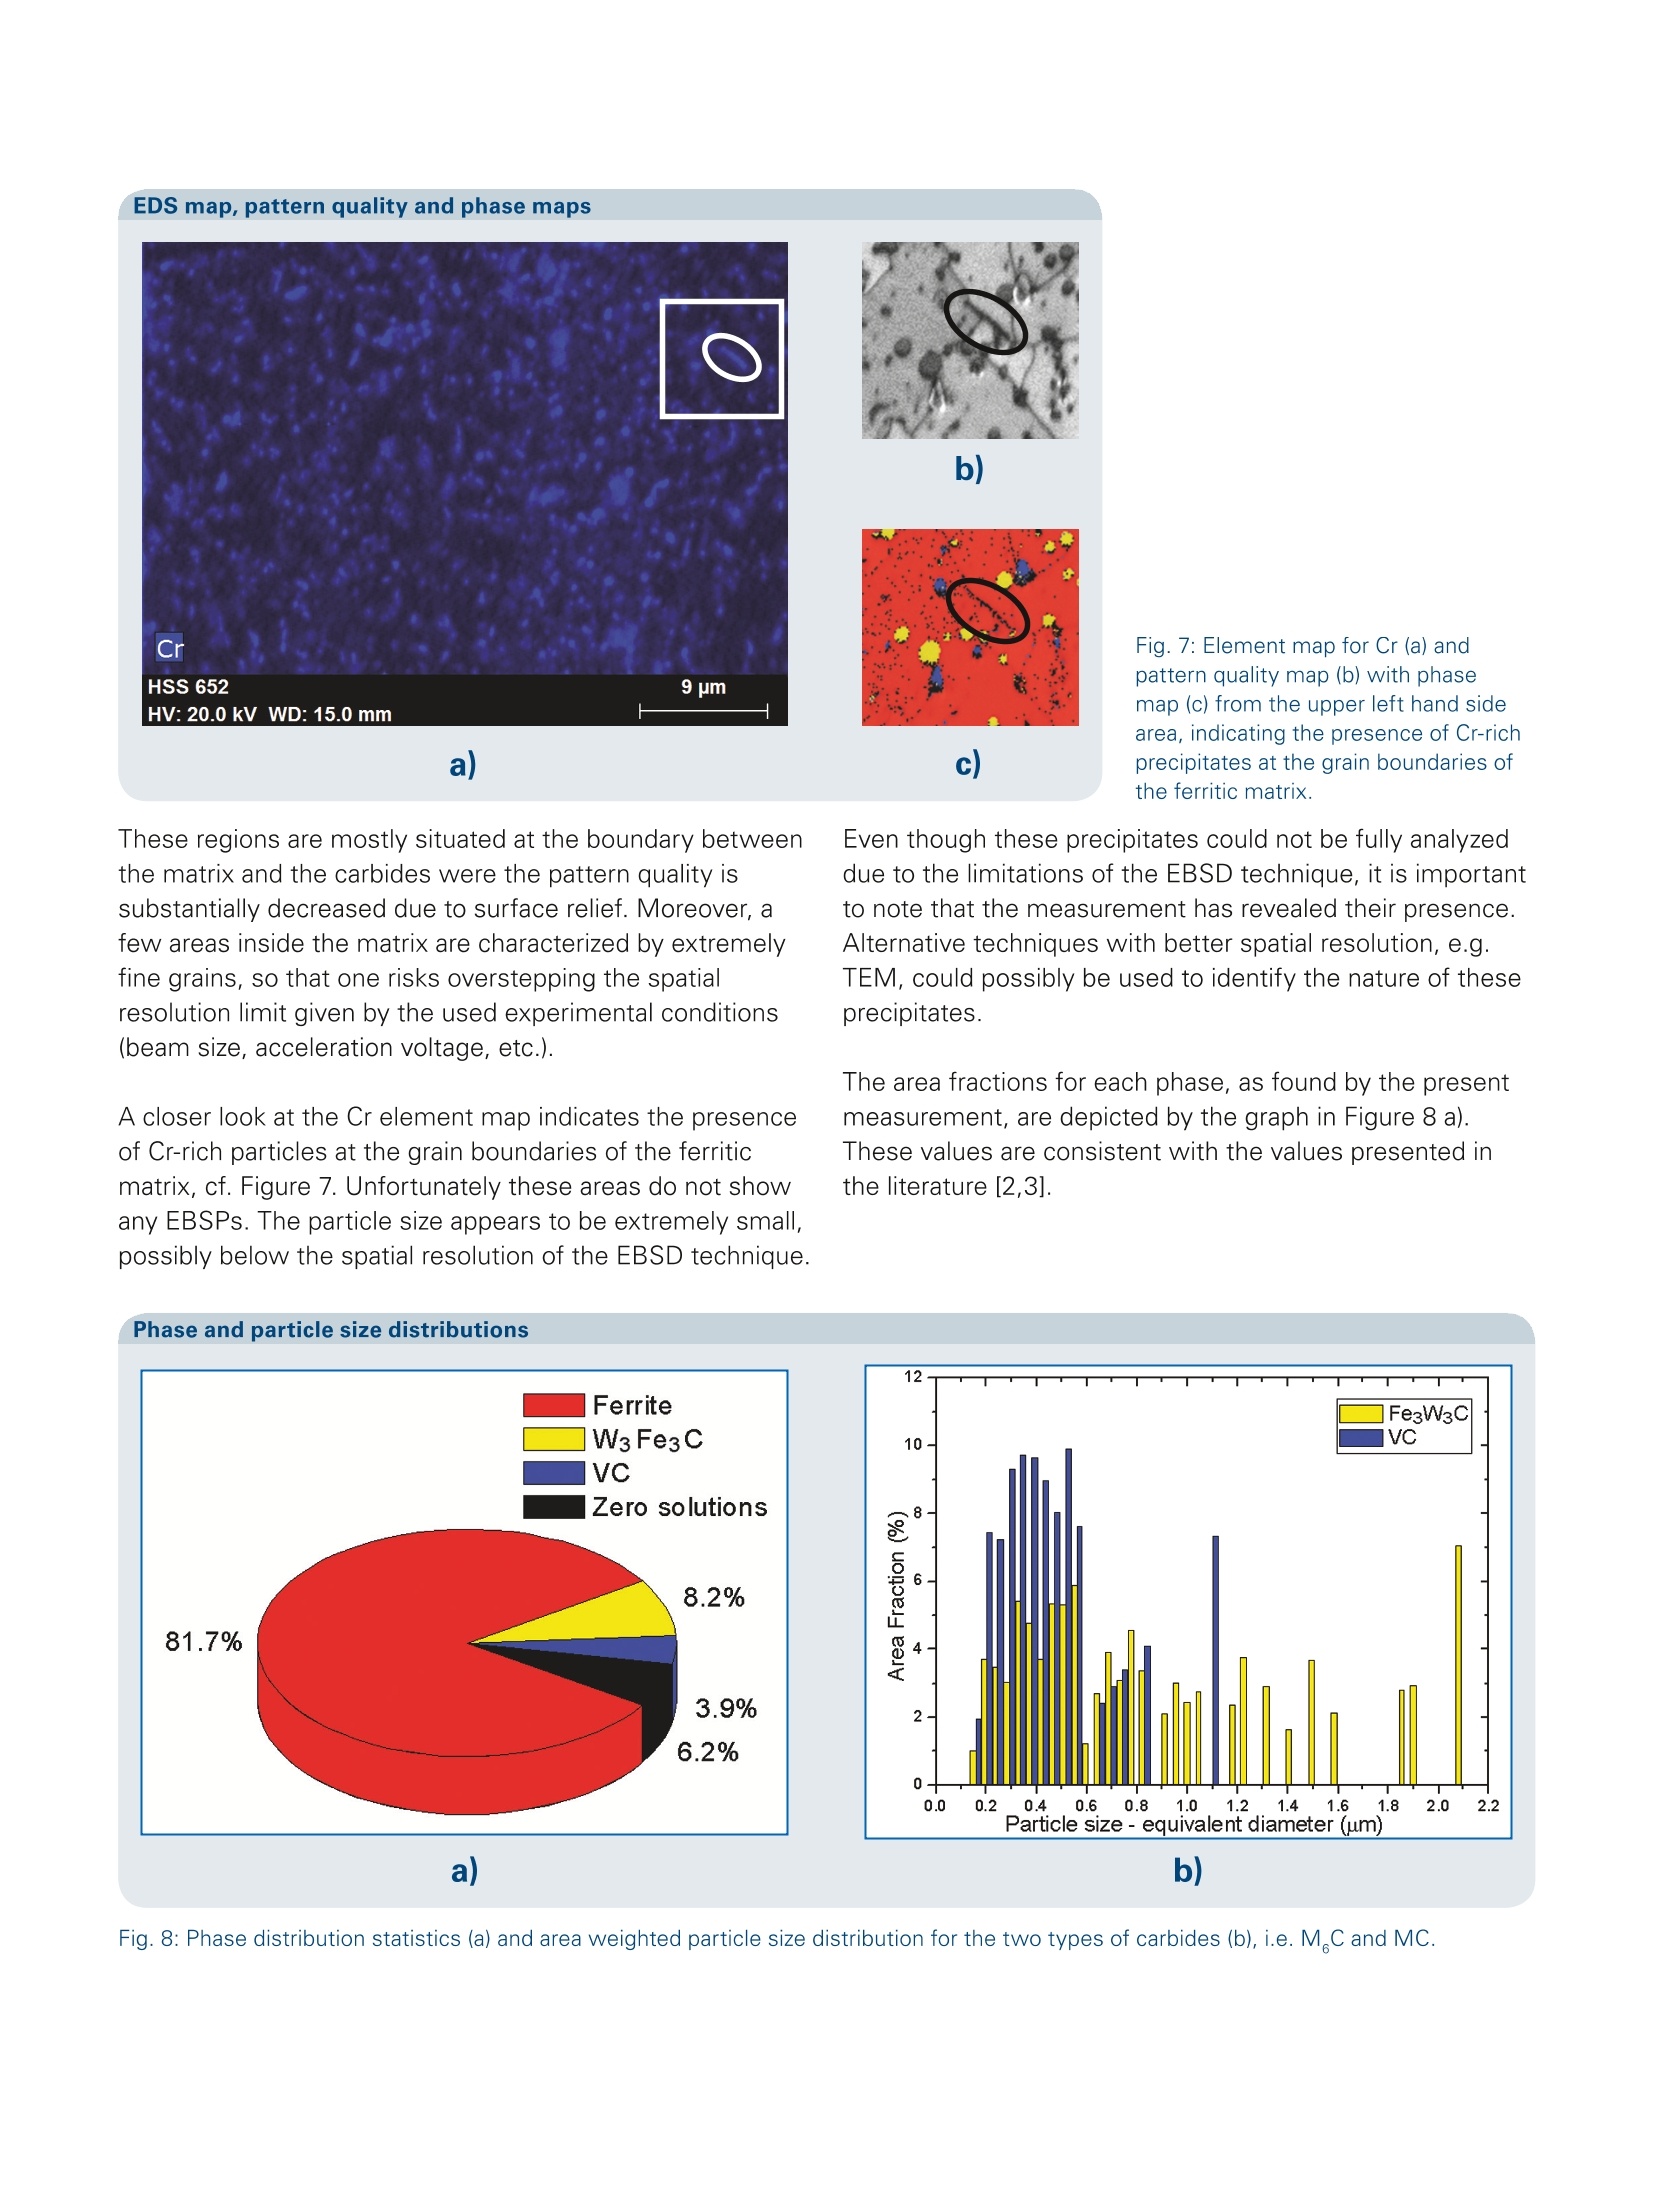
Berlin ·Germanywww.bruker.com/quantax-ebsd EDS map EBSD phase map Ferrite EBSP HSS steel Application Note # EBSD-01 Fast simultaneous EBSD and EDSmeasurements for complete analysis ofmultiphase materials The multi phase material used for this application note, i.e.high speed steel (HSS) is part of a family of alloys usedmostly for producing cutting tools. Their name representsthe synthesis of two of their most important characteristics: ■These alloys are part of a multi-component systemFe-C-Xwhere X represents a group of alloying elementsamong which the most important are: Cr, W, Mo, Vandfor certain grades Co. . The most important property of these alloys is theircapability of retaining a very high hardness, even in thehigh temperature ranges resulting from the high speedmetal cutting process. Since their introduction most of the research wasconcentrated on understanding the formation and stabilityof carbides during manufacturing, in order to control thefinal mechanical properties of these steels, e.g. hardness,wear, etc. GULYAEV et al. have proposed a discussion on the stabilityof the different types of carbides forming in HSS, basedon the atomic layer filling of each element [1]. In their workGULYAEV et al. consider that the stability of carbides in steels decreases with the increasing element groupnumber. In other words, only the transition metals posi-tioned on the left hand side of Fe in the table of elementscan form carbides in steels, i.e. replace the fairly unstablecementite (Fe,C). For the last few decades different techniques, such asX-ray diffraction, optical and electron microscopy etc. havebeen used for identifying/analyzing the different types ofcarbides present in HSS. Although the information given bythese techniques is well established recent developmentsin speed and integration of the EBSD and EDS techniqueshave created a tool that can deliver richer and easier tointerpret experimental data. The aim of this application note is to demonstrate thatthe latest developments in simultaneous EBSD/EDS dataacquisition and interpretation have created a powerfulanalytical tool for characterizing multiphase materials Sample preparation and SEM/EBSD/EDSparameters A commercially available high speed steel HSS-652 rod (seeconcentration of most important elements in table 1 below)with ferritic matrix was cut in longitudinal section andground down to SiC grit paper 1200. Table 1: Concentrations of most important alloying elements inHSS-652 (at%) W Mo V Cr c Fe 6 5 2 4 0.9 ~81 Subsequently the sample was mechanically polished with3 and respectively 1 pm diamond suspension, followedby a final 7 minutes polishing with colloidal silica. For thelast stages of the polishing procedure special care had tobe taken in order to reduce the formation of surface relief,i.e. reduced pressure and increased polishing time. Therelief formation probability is particularly high on this typeof materials due to the very big difference in hardnessbetween the carbides and the ferritic matrix. In generaltopography has a negative influence on the hit rate andtherefore is to be avoided. Setup SEM type ZEISS Supra 55 VP EBSD detector eFlashTM EDS detector XFlash@ 5030 Acceleration voltage 20kV Beam current ~15 nA (120 um aperture, high current mode) Acquisition speed 210 points/s (EBSD & EDS) Input/Output 620 kcps / 300 kcps avg.count rate Average counts ~1500 per point Map size 800x600 pixels (48x36 um2) Pixel size (step size) 57 nm Acquisition time ~38 min The data storage methodology used by the CrystAlignTMsoftware allows the user to launch the measurementwithout the need to identify all the phases present in thesample1. This unique feature of the CrystAlignTM softwarecan be used to minimize the SEM occupation time. ( 1 Of course, i f one or more phases are known or their presence isto be checked then these phases should be used fo r indexing during data acquisition. ) For the present case Fe bcc (o-phase) and Fe fcc (y-phase)were used for indexing during data acquisition. While thepresence of ferrite was certain, the formation of austeniteas a result of the thermo-mechanical manufacturingprocesses had to be investigated.Due to the very finely scaled features observed by electronimaging a very fine step size had to be used, i.e. 57nm. Experimental results and discussion The microstructural features of the HSS sample used forthis study are depicted by the pattern quality map (PQM)and phase distribution map shown in Figure 1.The two maps indicate the presence of micron and Pattern quality and initial phase maps Fig.1: Pattern quality map (a) and "raw"- as acquired - phase map(b) showing the pixels indexed as ferrite (red) and austenite (blue);black pixels in the phases map denote points not indexed. submicron scaled particles inside a ferritic matrix. Thematrix appears to be characterized by recrystallized grainsbut local areas with fine structures/substructures are alsovisible in the PQM (see area indicated by the red rectanglein Figure 1 a)). The raw phase map shown in Figure 1 b) represents the asacquired EBSD data, i.e. no data cleaning was applied. Themap depicts the distribution of particles/grains that havebeen indexed as austenite (blue pixels) inside the ferriticmatrix(red pixels). The black non-indexed areas in Figure 1b) correspond to the particles having a lower pattern quality(i.e. darker grey level) compared to the matrix (seeFigure 1.a)). These details indicate the existence of at least another phase, which is either lighter than the ferrite or ithas a lower crystallographic symmetry. The information provided by the EDS results, trough theHypermap option, was used for identifying the missingphase(s) as well as for confirming the EBSD results.The Hypermap feature can be used, among other options,for displaying the element distribution within the scannedarea. The W and Mo hypermaps shown in Figure 2 a) and b)respectively indicate that the non-indexed areas in Figure 1b) are W and Mo rich. A quick look into the literature and a search in a phase database-e.g. the commercially available ICSD (InorganicCrystal Structure Database)- confirms that the patternsacquired from the W and Mo rich particles are correctlyindexed as an M C type of carbide i.e. W,Fe,C. Consideringthe EDS quantification results (see Figure 2 c)), it is onlylogical to conclude that the real phase corresponding tothese particles had part of the W and Fe atoms replaced byMo atoms without changing the crystallographic structureas compared to the W,Fe,C phase. Figure 3 shows the different crystal structures of ferriteand W,Fe,C, as well as the corresponding predictedintensity distributions based on the kinematic approach. Thestructure and the intensity are related to the space-groupsymmetry (given by the IT-No.). As stated above, the EDS results can not only be usedfor identifying the missing phases but also for confirming/correcting the phase information in the EBSD data. Theelement distribution maps of V and C shown in Figure 4 a)and b) respectively clearly indicate that the areas indexed asaustenite (see Figure 1 b)) are V and C rich. As these highamounts of V and especially C (cf. quantification inFigure 4 c)) cannot be solved in austenite, one can onlyconclude that the areas actually correspond to a phaseforming austenite-like EBSPs. A similar search procedure as the one used for the M Cphase, has found that there is indeed an MC type of carbidei.e. vanadium carbide VC which can be used to correctlyindex the patterns initially indexed as austenite. The MCtype carbide is described by the NaCl crystal structure type. EDS maps and quantitative analysis results The reason why the EBSD system cannot distinguishsatisfactorily between austenite and vanadium carbide,is due to the same intensity ranking of the major bandscorresponding to these two phases. This is the maincriterion used during the indexing procedure by any existingEBSD system. Since their unit cell parameters differ onlyby about 13% a differentiation using the band widths couldbe practically possible, but only if extremely slow dataacquisition of high resolution and high quality patterns wereused. Fast automatic measurements usually do not offerthis option, and since Hypermap simultaneously deliversa direct assessment of the chemical composition, it istherefore much more efficient to use the EDS results foridentifying the correct phase. After identifying the candidate phases, an offline reanalysisof the initial data was carried out. A speed of ~3000points/s was achieved during reanalysis using a dualquad core computer (eight processor cores). In otherwords: a map of 480,000 points was reanalyzed in about2min30sec. A hit rate of 93.8% was achieved, indicatingthat a solution has been attributed to most of the points inthe map. The two raw maps shown in Figure 6 confirm thereliability of the final results, i.e. extremely low to no phaseor orientation misindexing present. Non-indexed pixelscorrespond mainly to areas showing weak or no EBSPs, seedark areas in the PQM in Figure 1 a). Fig. 5: Comparison of theintensity distribution (dynamictheory simulation) on a projec-tion sphere for austenite andvanadium carbide. Because ofthe similar crystal structures theintensity distributions are similaras well. Phase and orientation maps Fig. 6: Raw EBSD data after reanalysis: Phase map (a) and orientation map (b). Please note that no data cleaning was applied. Fig. 7: Element map for Cr (a) andpattern quality map (b) with phasemap (c) from the upper left hand sidearea, indicating the presence of Cr-richprecipitates at the grain boundaries ofthe ferritic matrix Even though these precipitates could not be fully analyzeddue to the limitations of the EBSD technique, it is importantto note that the measurement has revealed their presence.Alternative techniques with better spatial resolution, e.g.TEM, could possibly be used to identify the nature of theseprecipitates. The area fractions for each phase, as found by the presentmeasurement, are depicted by the graph in Figure 8 a).These values are consistent with the values presented inthe literature [2,3]. Phase and particle size distributions b) [1] A.P. Gulyaev, Metal Science and Heat Treatment 40(1998)456 [2] S. Karagoz, H.F. Fischmeister, Metallurgical and MaterialsTransactions 29A (1998)205,1998. [3] T.A. Roik, Y.F. Shevchuk, Powder Metallurgy and MetalCeramics 45 (2006) 531. ( [ 4 ] F.J. Hump hreys,S c rip ta M a teria lia, 5 1 ( 2 0 0 4 ) 771 - 7 7 6. ) [5] F.J. Humphreys, Journal of Material Science, 36 (2001)3833. .Author Dr. Daniel Goran, Application Scientist EBSD,Bruker Nano GmbH Commercially available high speed steel was analyzedsimultaneously using the EBSD and EDS techniques ata very high speed of more than 200 points/s.Thanksto its extremely fast reanalysis option the CrystAlignTMsoftware permits the user to launch measurements withoutknowing all the phases present in the sample. This in turnsignificantly reduces the preparation time needed beforelaunching the measurement. Thanks to these new hardwareand software developments the SEM occupation time foracquiring a map of 480,000 points was drastically reducedto less than one hour i.e. 38 min for data acquisition, plusmaximum 15 min for sample, electron beam, hardware andsoftware setup. As shown throughout this application note, the completephase identification as well as the map reanalysis is doneoffline extremely fast and without occupying the SEM.Although the possibility of characterizing multi phasematerials by using the EBSD and EDS techniques hasbeen already available at least for the last ten years, thisapplication note demonstrates that the combination of theBruker EBSD and EDS detectors with the ESPRITsoftwareresults in a powerful and efficient analytical tool that can beused to easily and efficiently analyze multiphase materials,providing excellent results. ( 3 F.J. Humphreys h a s s h own that a minimum of 8 pixels pe r grain arerequired for an accuracy of 5% in determining the grain size [5]. ) Bruker Nano GmbH Phone +49 (30) 670990-0 Fax+49 (30) 670990-30 info.bna@bruker.com Commercially available high speed steel was analyzedsimultaneously using the EBSD and EDS techniques ata very high speed of more than 200 points/s. Thanksto its extremely fast reanalysis option the CrystAlign™software permits the user to launch measurements withoutknowing all the phases present in the sample. This in turnsignificantly reduces the preparation time needed beforelaunching the measurement. Thanks to these new hardwareand software developments the SEM occupation time foracquiring a map of 480,000 points was drastically reducedto less than one hour i.e. 38 min for data acquisition, plusmaximum 15 min for sample, electron beam, hardware andsoftware setup.
确定

还剩6页未读,是否继续阅读?

产品配置单


布鲁克电子显微纳米分析仪器部为您提供《高速钢(HSS)中元素含量检测方案(EBSD系统)》,该方案主要用于粗钢中含量分析检测,参考标准--,《高速钢(HSS)中元素含量检测方案(EBSD系统)》用到的仪器有布鲁克 电子背散射衍射仪 EBSD eflash FS、布鲁克 电子背散射衍射仪 EBSD、布鲁克 , EDS, 能谱仪, SEM, TEM、布鲁克 ESPRIT 四合一分析软件、布鲁克3D EDS/EBSD重构软件QUBE
相关方案
更多