


方案详情
文
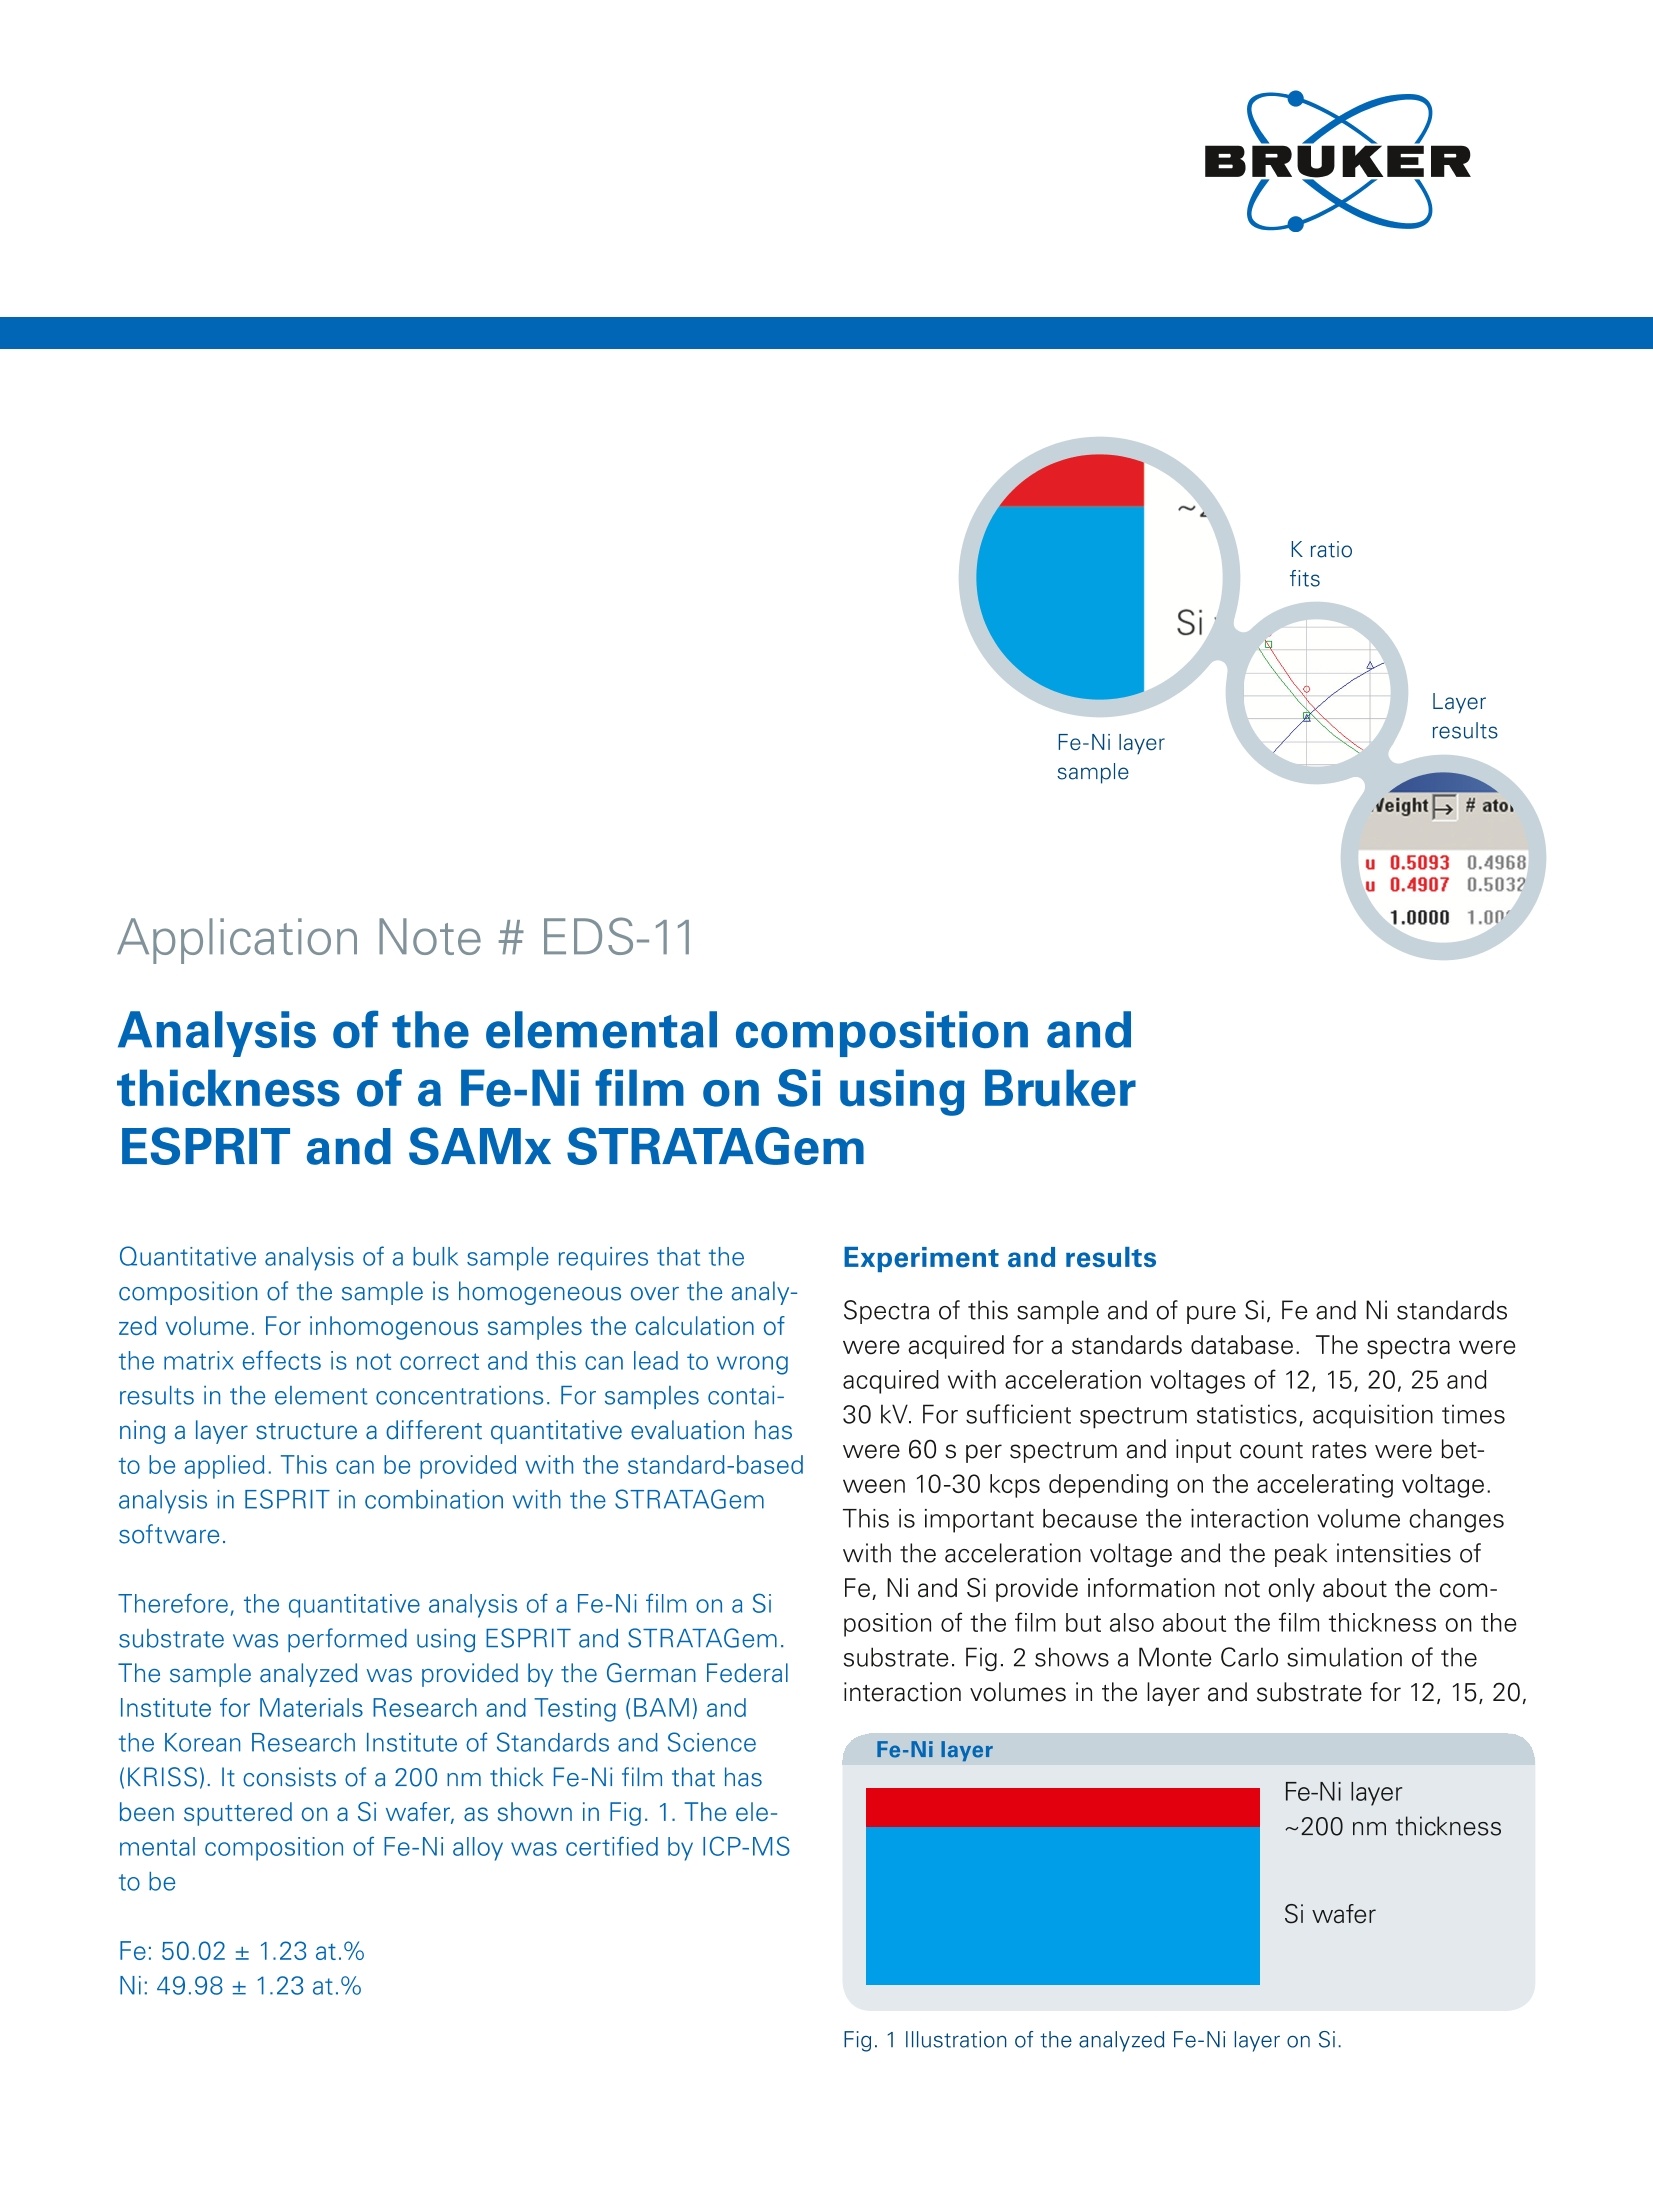
Quantitative analysis of a bulk sample requires that the
composition of the sample is homogeneous over the analyzed
volume. For inhomogenous samples the calculation of
the matrix effects is not correct and this can lead to wrong
results in the element concentrations. For samples containing
a layer structure a different quantitative evaluation has
to be applied. This can be provided with the standard-based
analysis in ESPRIT in combination with the STRATAGem
software.
方案详情

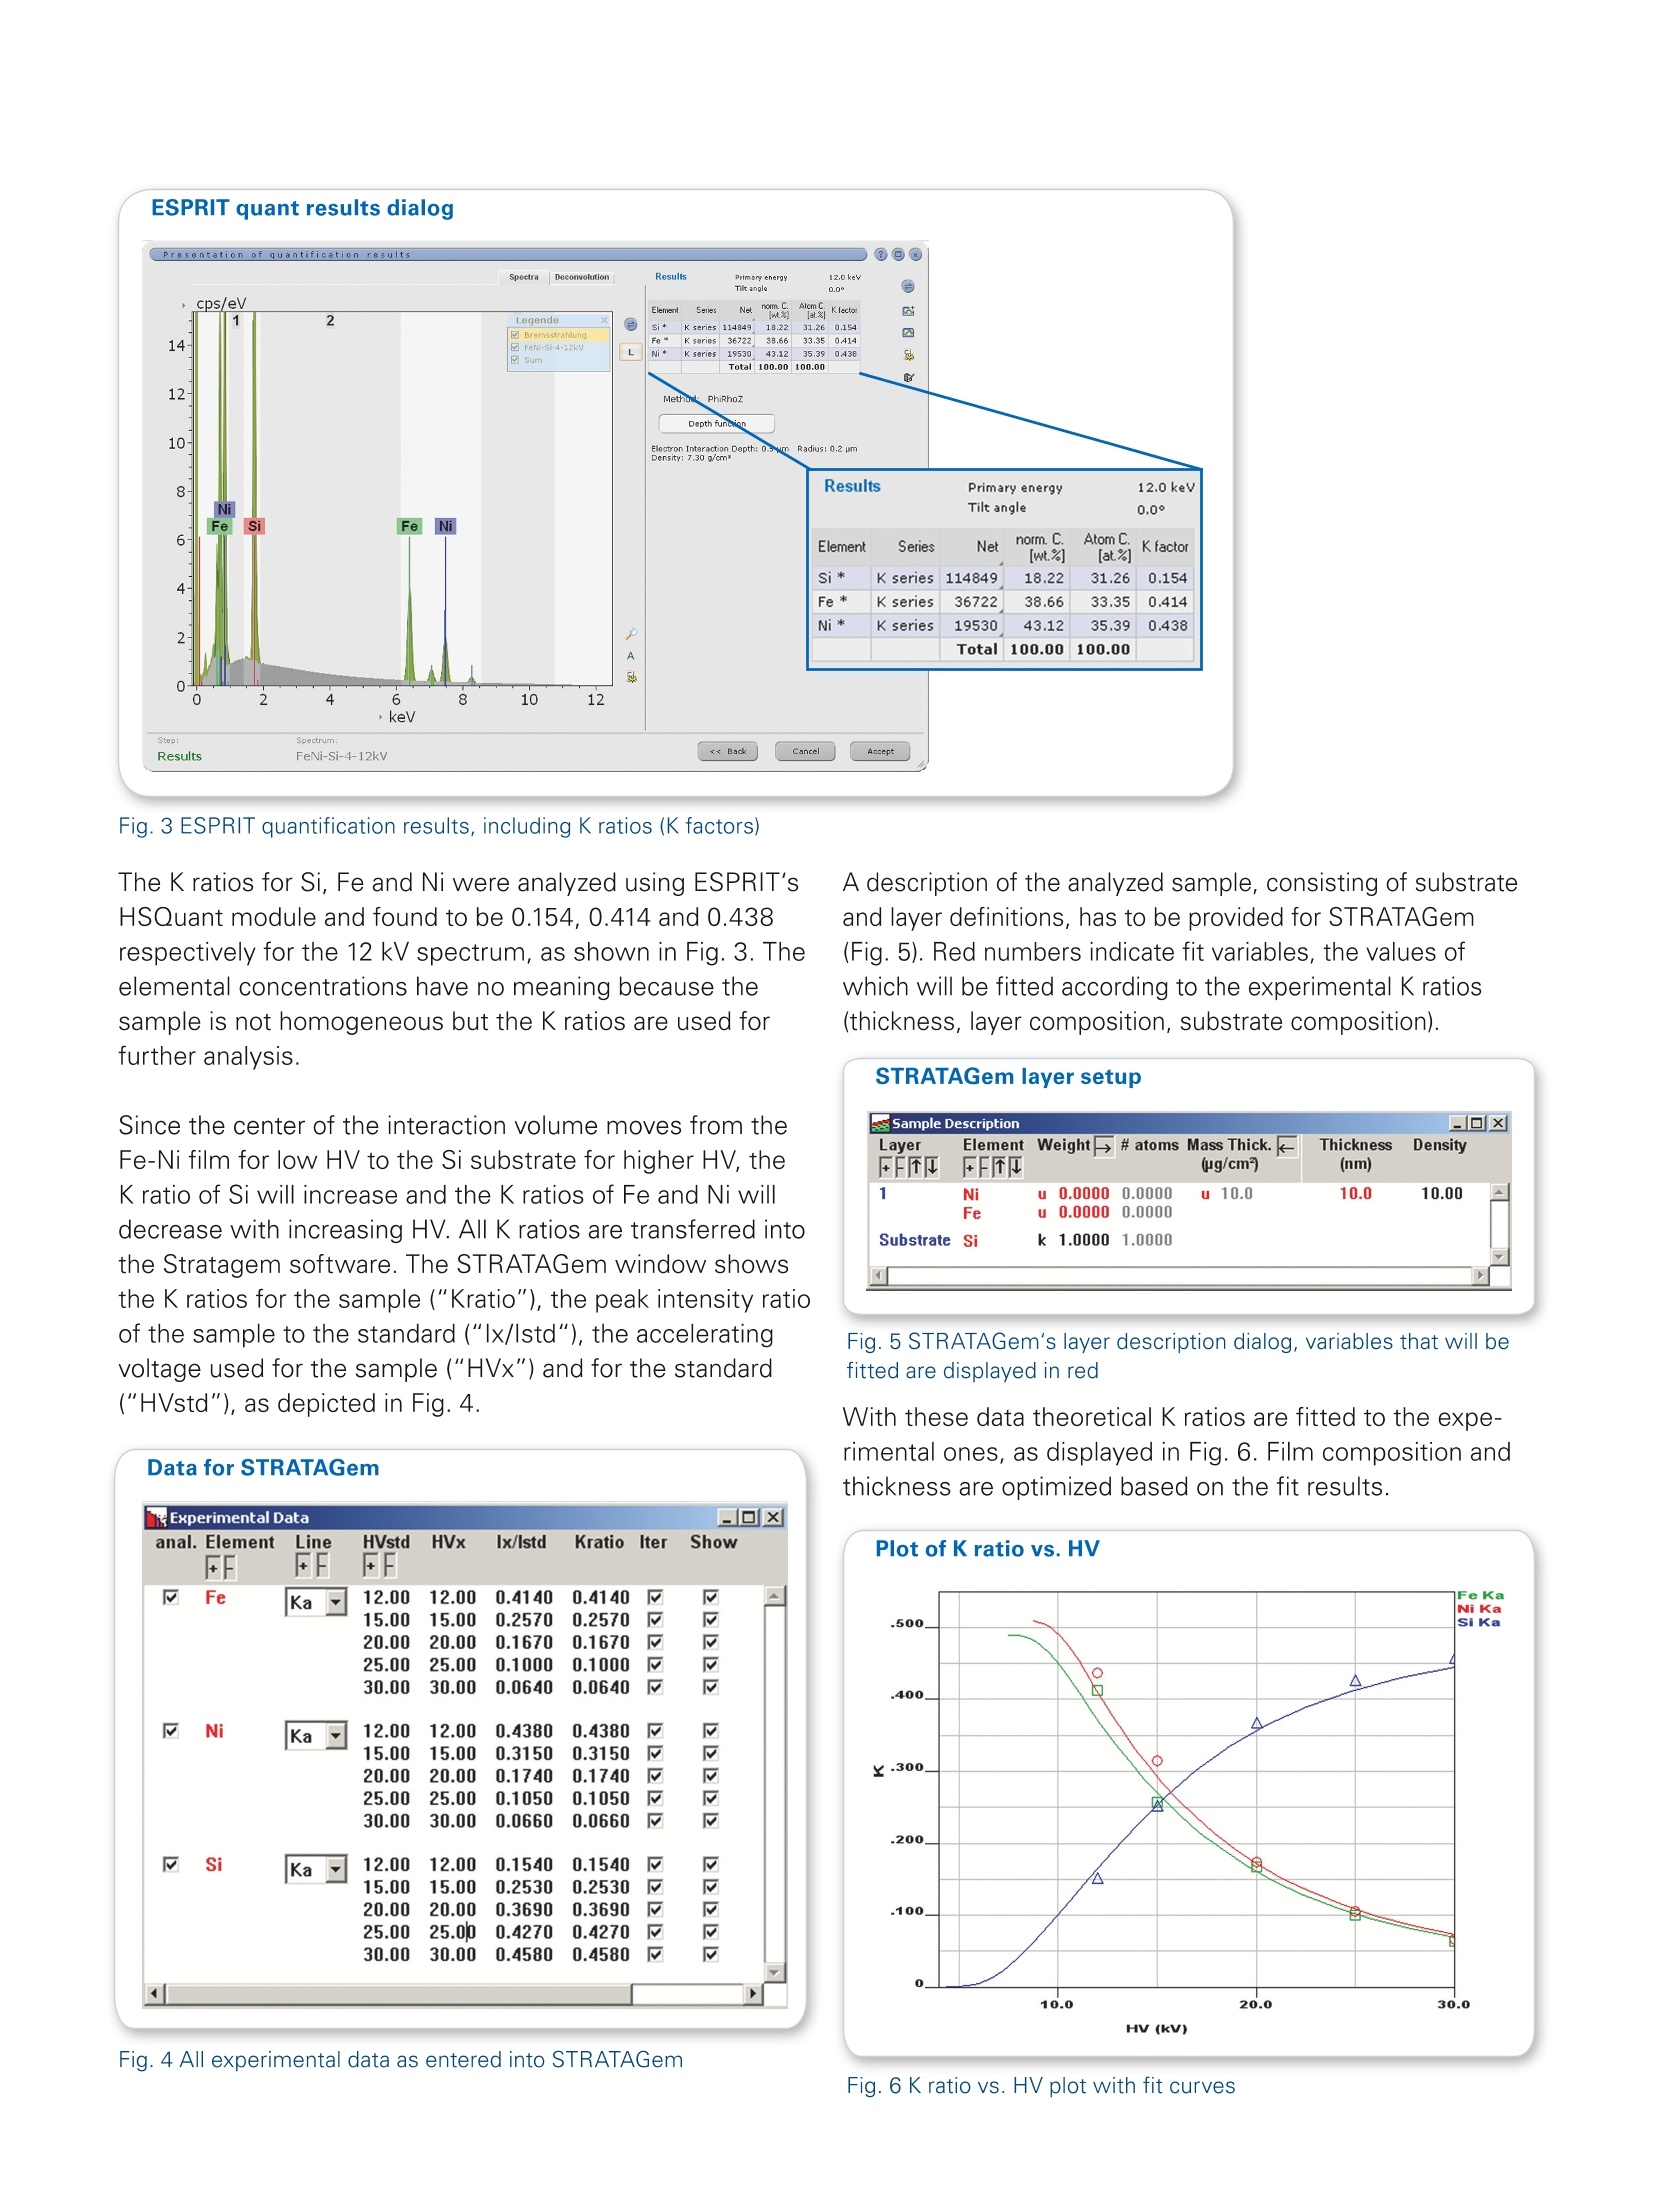
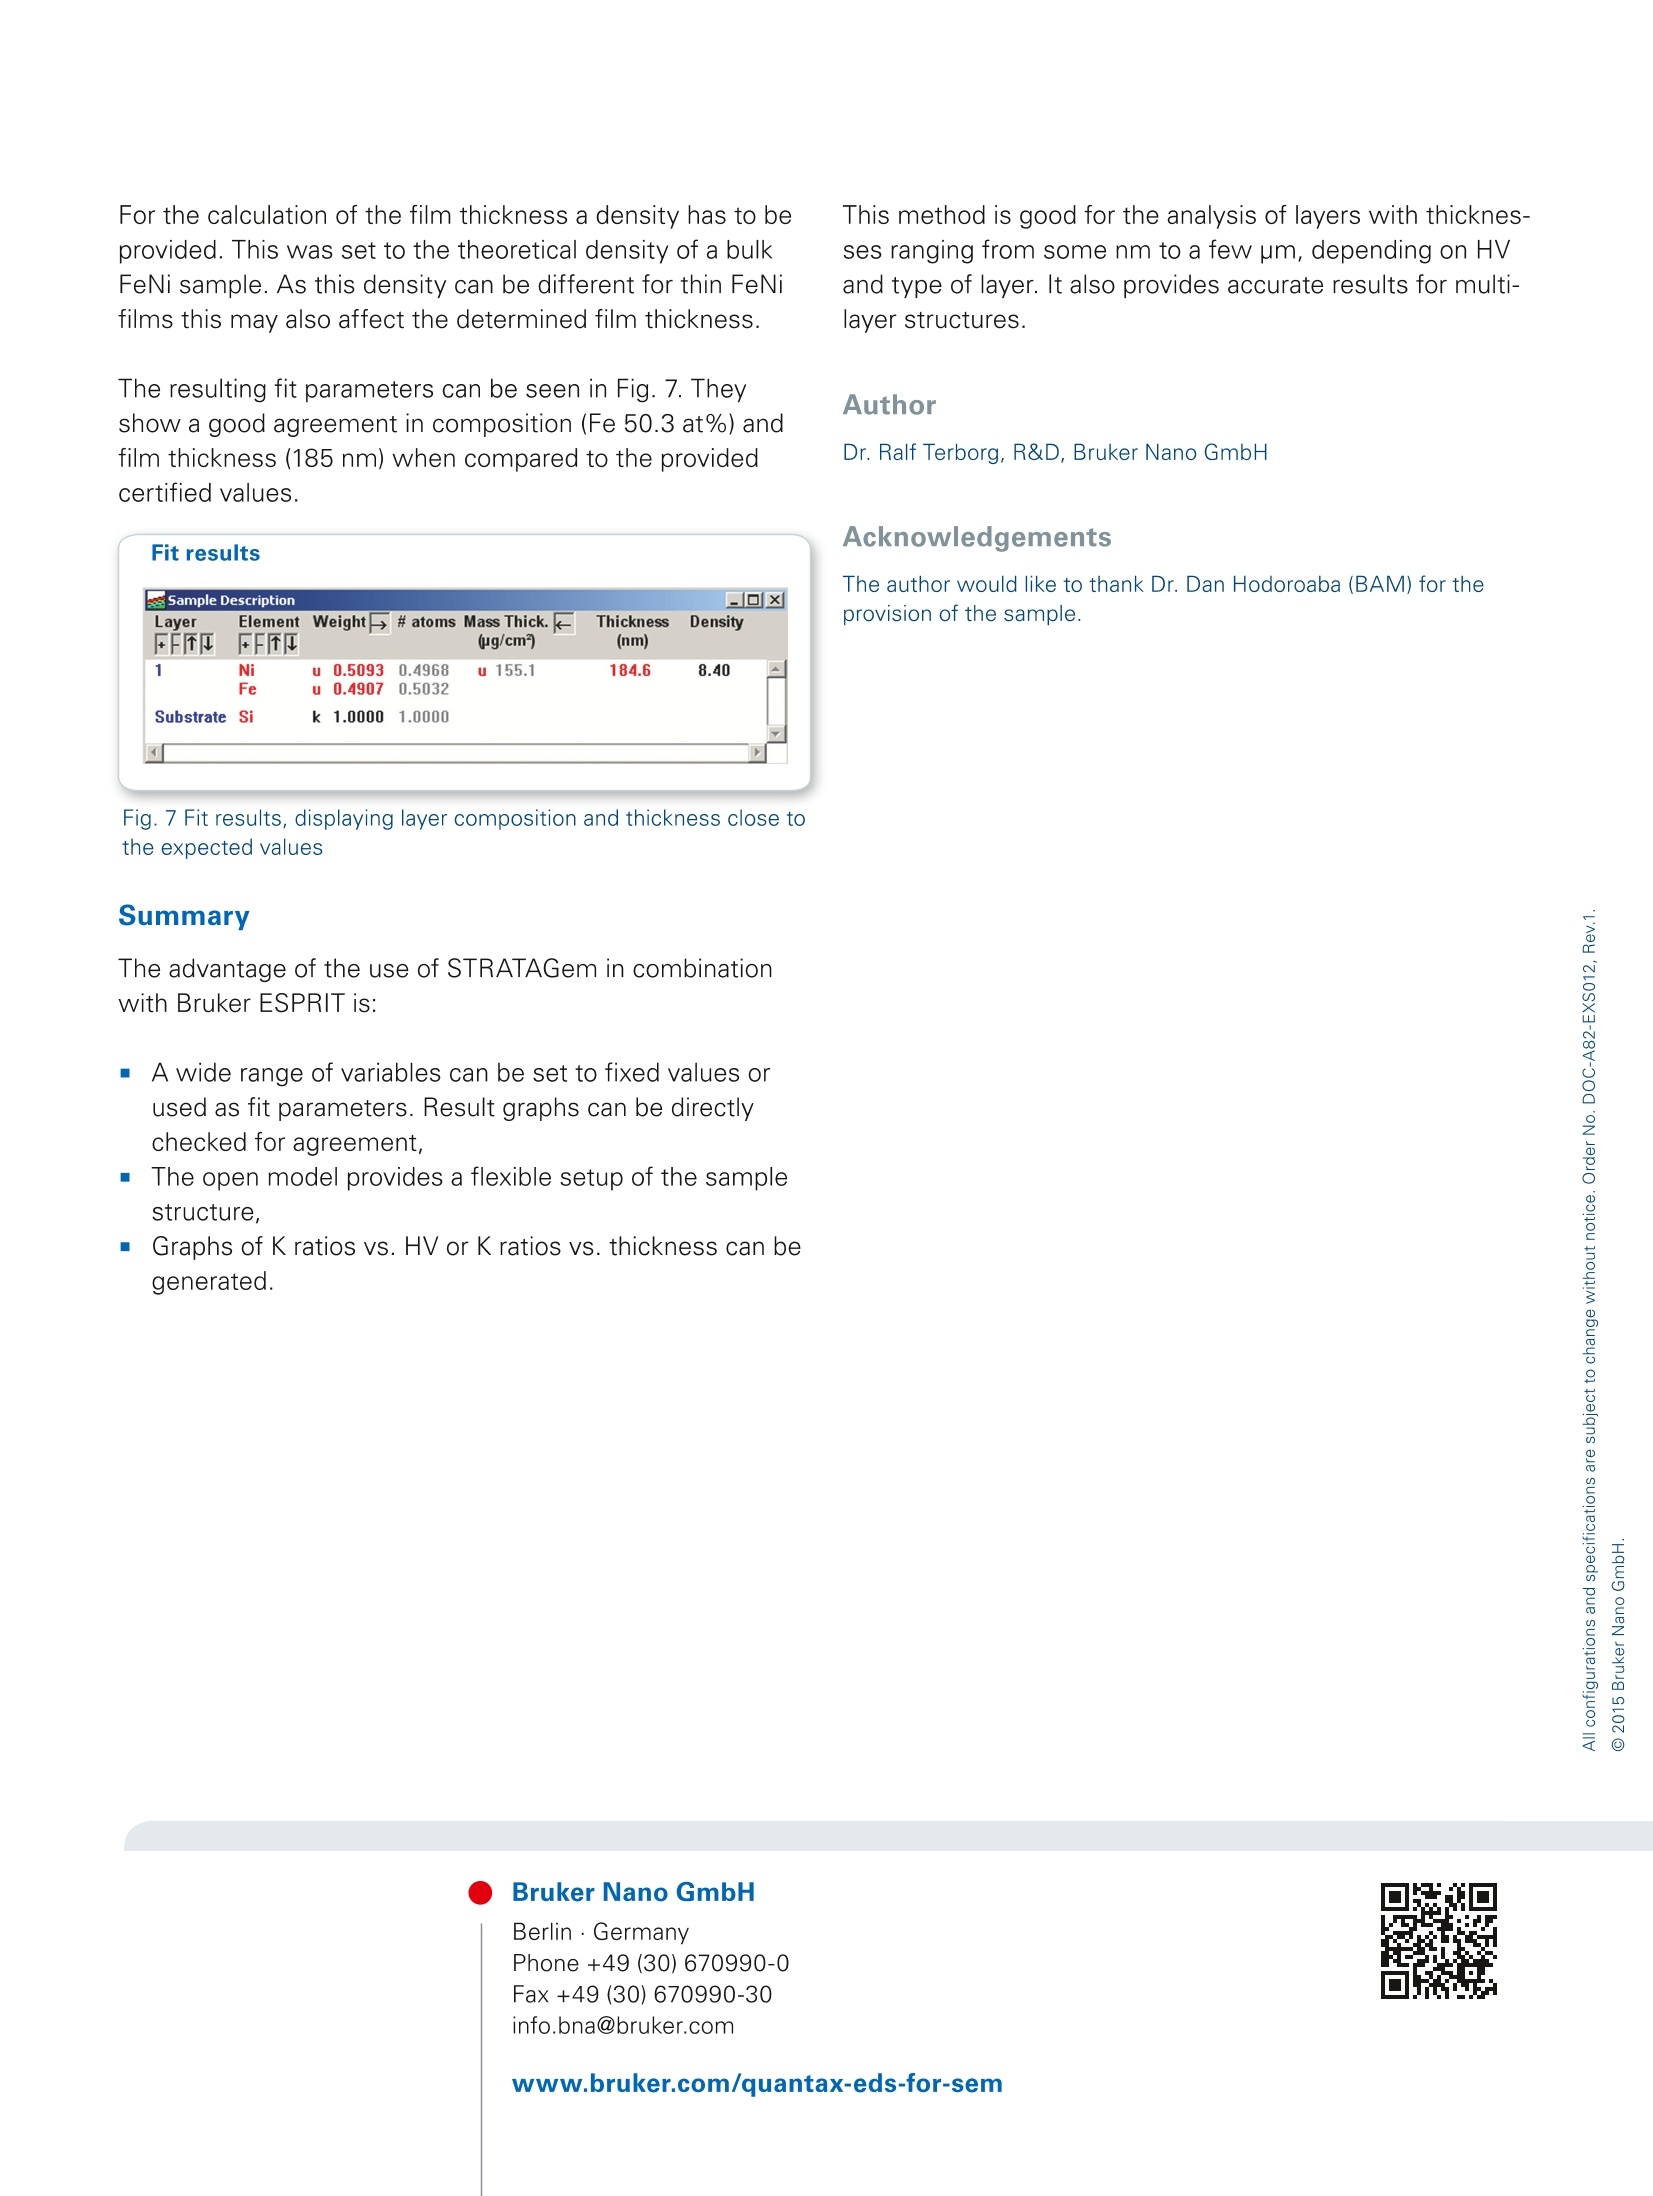
Application Note # EDS-11 1.00001.00 Analysis of the elemental composition andthickness of a Fe-Ni film on Si using BrukerESPRIT and SAMx STRATAGem Experiment and results Quantitative analysis of a bulk sample requires that thecomposition of the sample is homogeneous over the analy-zed volume. For inhomogenous samples the calculation ofthe matrix effects is not correct and this can lead to wrongresults in the element concentrations. For samples contai-ning a layer structure a different quantitative evaluation hasto be applied. This can be provided with the standard-basedanalysis in ESPRIT in combination with the STRATAGemsoftware. Therefore, the quantitative analysis of a Fe-Ni film on a Sisubstrate was performed using ESPRIT and STRATAGem.The sample analyzed was provided by the German FederalInstitute for Materials Research and Testing (BAM) andthe Korean Research Institute of Standards and Science(KRISS). It consists of a 200 nm thick Fe-Ni film that hasbeen sputtered on a Si wafer, as shown in Fig.1. The ele-mental composition of Fe-Ni alloy was certified by ICP-MSto be ( F e: 5 0. 02 ± 1 . 23at.% N i : 49.98±1.23 at.% ) Spectra of this sample and of pure Si, Fe and Ni standardswere acquired for a standards database. The spectra wereacquired with acceleration voltages of 12, 15, 20, 25 anc30 kV. For sufficient spectrum statistics, acquisition timeswere 60 s per spectrum and input count rates were bet-ween 10-30 kcps depending on the accelerating voltage.This is important because the interaction volume changeswith the acceleration voltage and the peak intensities ofFe, Ni and Si provide information not only about the com-position of the film but also about the film thickness on thesubstrate. Fig. 2 shows a Monte Carlo simulation of theinteraction volumes in the layer and substrate for 12, 15, 20, Monte Carlo simulations FeNi 200.00 nm si 1200.0 nm 1800.0 nm 2400.0 nm (c) Fig. 2 a- e Monte Carlo simulations of electron beams hitting thesample with acceleration voltages of 12 kV (a), 15 kV (b), 20 kV (c),25 kV (d) and 30 kV (e). 25, 30 kV. The STRATAGem software tool can be used to calculatefilm composition and thickness with the help of the K ratios.K ratios are the ratios of the peak intensities of the sampleand the standard normalized to beam current and live time, e.g. For a pure element standard: OsK≤1. Fig. 3 ESPRIT quantification results, including K ratios (K factors) The K ratios for Si, Fe and Ni were analyzed using ESPRIT'sHSQuant module and found to be 0.154, 0.414 and 0.438respectively for the 12 kV spectrum, as shown in Fig. 3. Theelemental concentrations have no meaning because thesample is not homogeneous but the K ratios are used forfurther analysis. Since the center of the interaction volume moves from theFe-Ni film for low HV to the Si substrate for higher HV, theK ratio of Si will increase and the K ratios of Fe and Ni willdecrease with increasing HV. All K ratios are transferred intothe Stratagem software. The STRATAGem window showsthe K ratios for the sample ("Kratio"), the peak intensity ratioof the sample to the standard ("lx/lstd"), the acceleratingvoltage used for the sample ("HVx") and for the standard("HVstd"), as depicted in Fig. 4. A description of the analyzed sample, consisting of substrateand layer definitions, has to be provided for STRATAGem(Fig. 5). Red numbers indicate fit variables, the values ofwhich will be fitted according to the experimental K ratios(thickness, layer composition, substrate composition). Fig. 5 STRATAGem's layer description dialog, variables that will befitted are displayed in red With these data theoretical K ratios are fitted to the expe-rimental ones, as displayed in Fig. 6. Film composition andthickness are optimized based on the fit results. This method is good for the analysis of layers with thicknes-ses ranging from some nm to a few um, depending on HVand type of layer. It also provides accurate results for multi-layer structures. For the calculation of the film thickness a density has to beprovided. This was set to the theoretical density of a bulkFeNi sample.As this density can be different for thin FeNifilms this may also affect the determined film thickness. The resulting fit parameters can be seen in Fig. 7. Theyshow a good agreement in composition (Fe 50.3 at%) andfilm thickness (185 nm) when compared to the providedcertified values. AuthorDr. Ralf Terborg, R&D, Bruker Nano GmbH Acknowledgements Sample Description .0X Layer Element Weight # atoms Mass Thick. Thickness Density FFTF FFT (ug/cm) (nm) 1 u 0.5093330.4968 155.1 184.6 8.40 u 0.4907 0.5032 Substrate Si k 1.0000101.0000 The author would like to thank Dr. Dan Hodoroaba (BAM) for theprovision of the sample. Fig. 7 Fit results, displaying layer composition and thickness close tothe expected values Summary The advantage of the use of STRATAGem in combinationwith Bruker ESPRIT is: A wide range of variables can be set to fixed values orused as fit parameters. Result graphs can be directlychecked for agreement, The open model provides a flexible setup of the samplestructure. Graphs of K ratios vs. HV or K ratios vs. thickness can begenerated. Bruker Nano GmbH Berlin ·Germany Phone +49 (30) 670990-0 Fax +49 (30)670990-30 info.bna@bruker.com www.bruker.com/quantax-eds-for-sem The advantage of the use of STRATAGem in combinationwith Bruker ESPRIT is: A wide range of variables can be set to fixed values orused as fit parameters. Result graphs can be directlychecked for agreement, The open model provides a flexible setup of the samplestructure, Graphs of K ratios vs. HV or K ratios vs. thickness can begenerated.This method is good for the analysis of layers with thicknessesranging from some nm to a few μm, depending on HVand type of layer. It also provides accurate results for multilayerstructures.
确定

还剩2页未读,是否继续阅读?

产品配置单

布鲁克电子显微纳米分析仪器部为您提供《Fe-Ni中元素含量检测方案(X射线能谱仪)》,该方案主要用于铁中理化分析检测,参考标准--,《Fe-Ni中元素含量检测方案(X射线能谱仪)》用到的仪器有布鲁克 , EDS, 能谱仪, SEM, TEM、布鲁克 QUANTAX EDS 能谱仪(TEM)、布鲁克3D EDS/EBSD重构软件QUBE、布鲁克 ESPRIT 四合一分析软件