


方案详情
文
Suspected drug products can be analysed by Raman spectroscopy to confirm the nature of the material. Small differences can be identified from the Raman analysis (ex: cocaine HCl / free base cocaine). By confocal Raman spectroscopy, traces can be identified on surfaces or in vials transparent to the visible excitation wavelength (glass, polymer..). Mixtures of different drug compounds or mixtures of a drug substance with additives (cutting agents) can give characteristic Raman features allowing the determination of the nature of each component and the generation of Raman maps showing their distribution.
方案详情

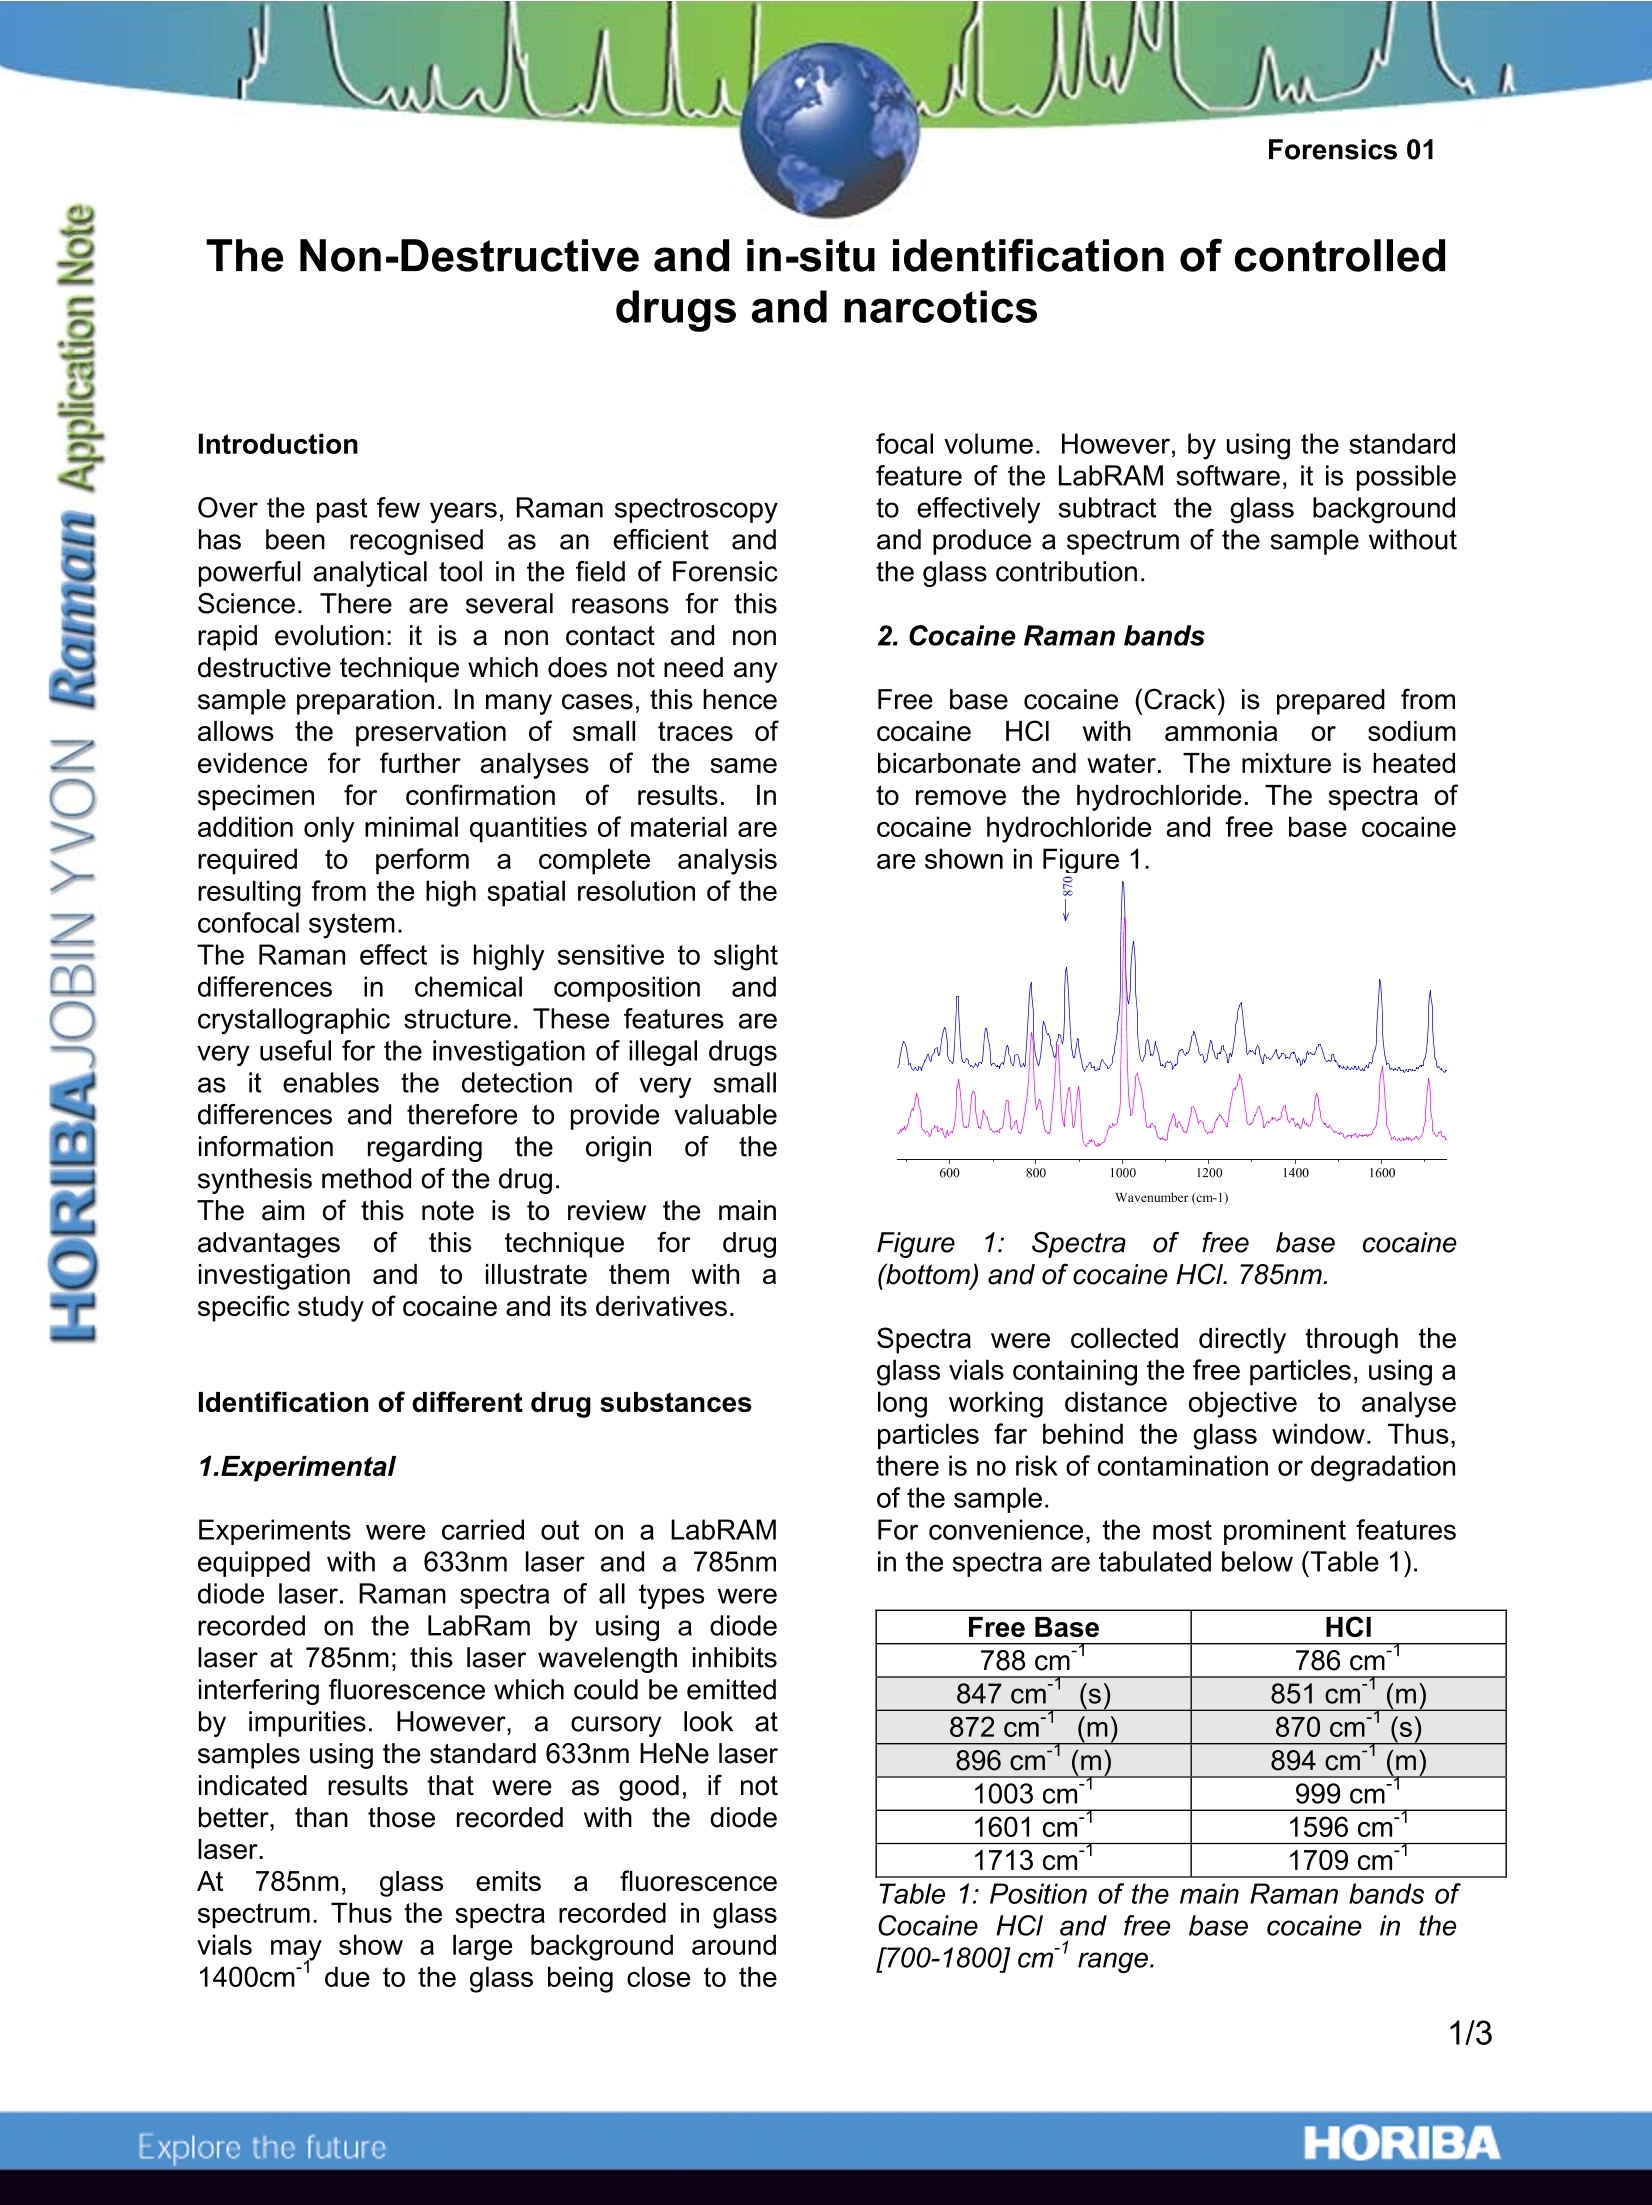
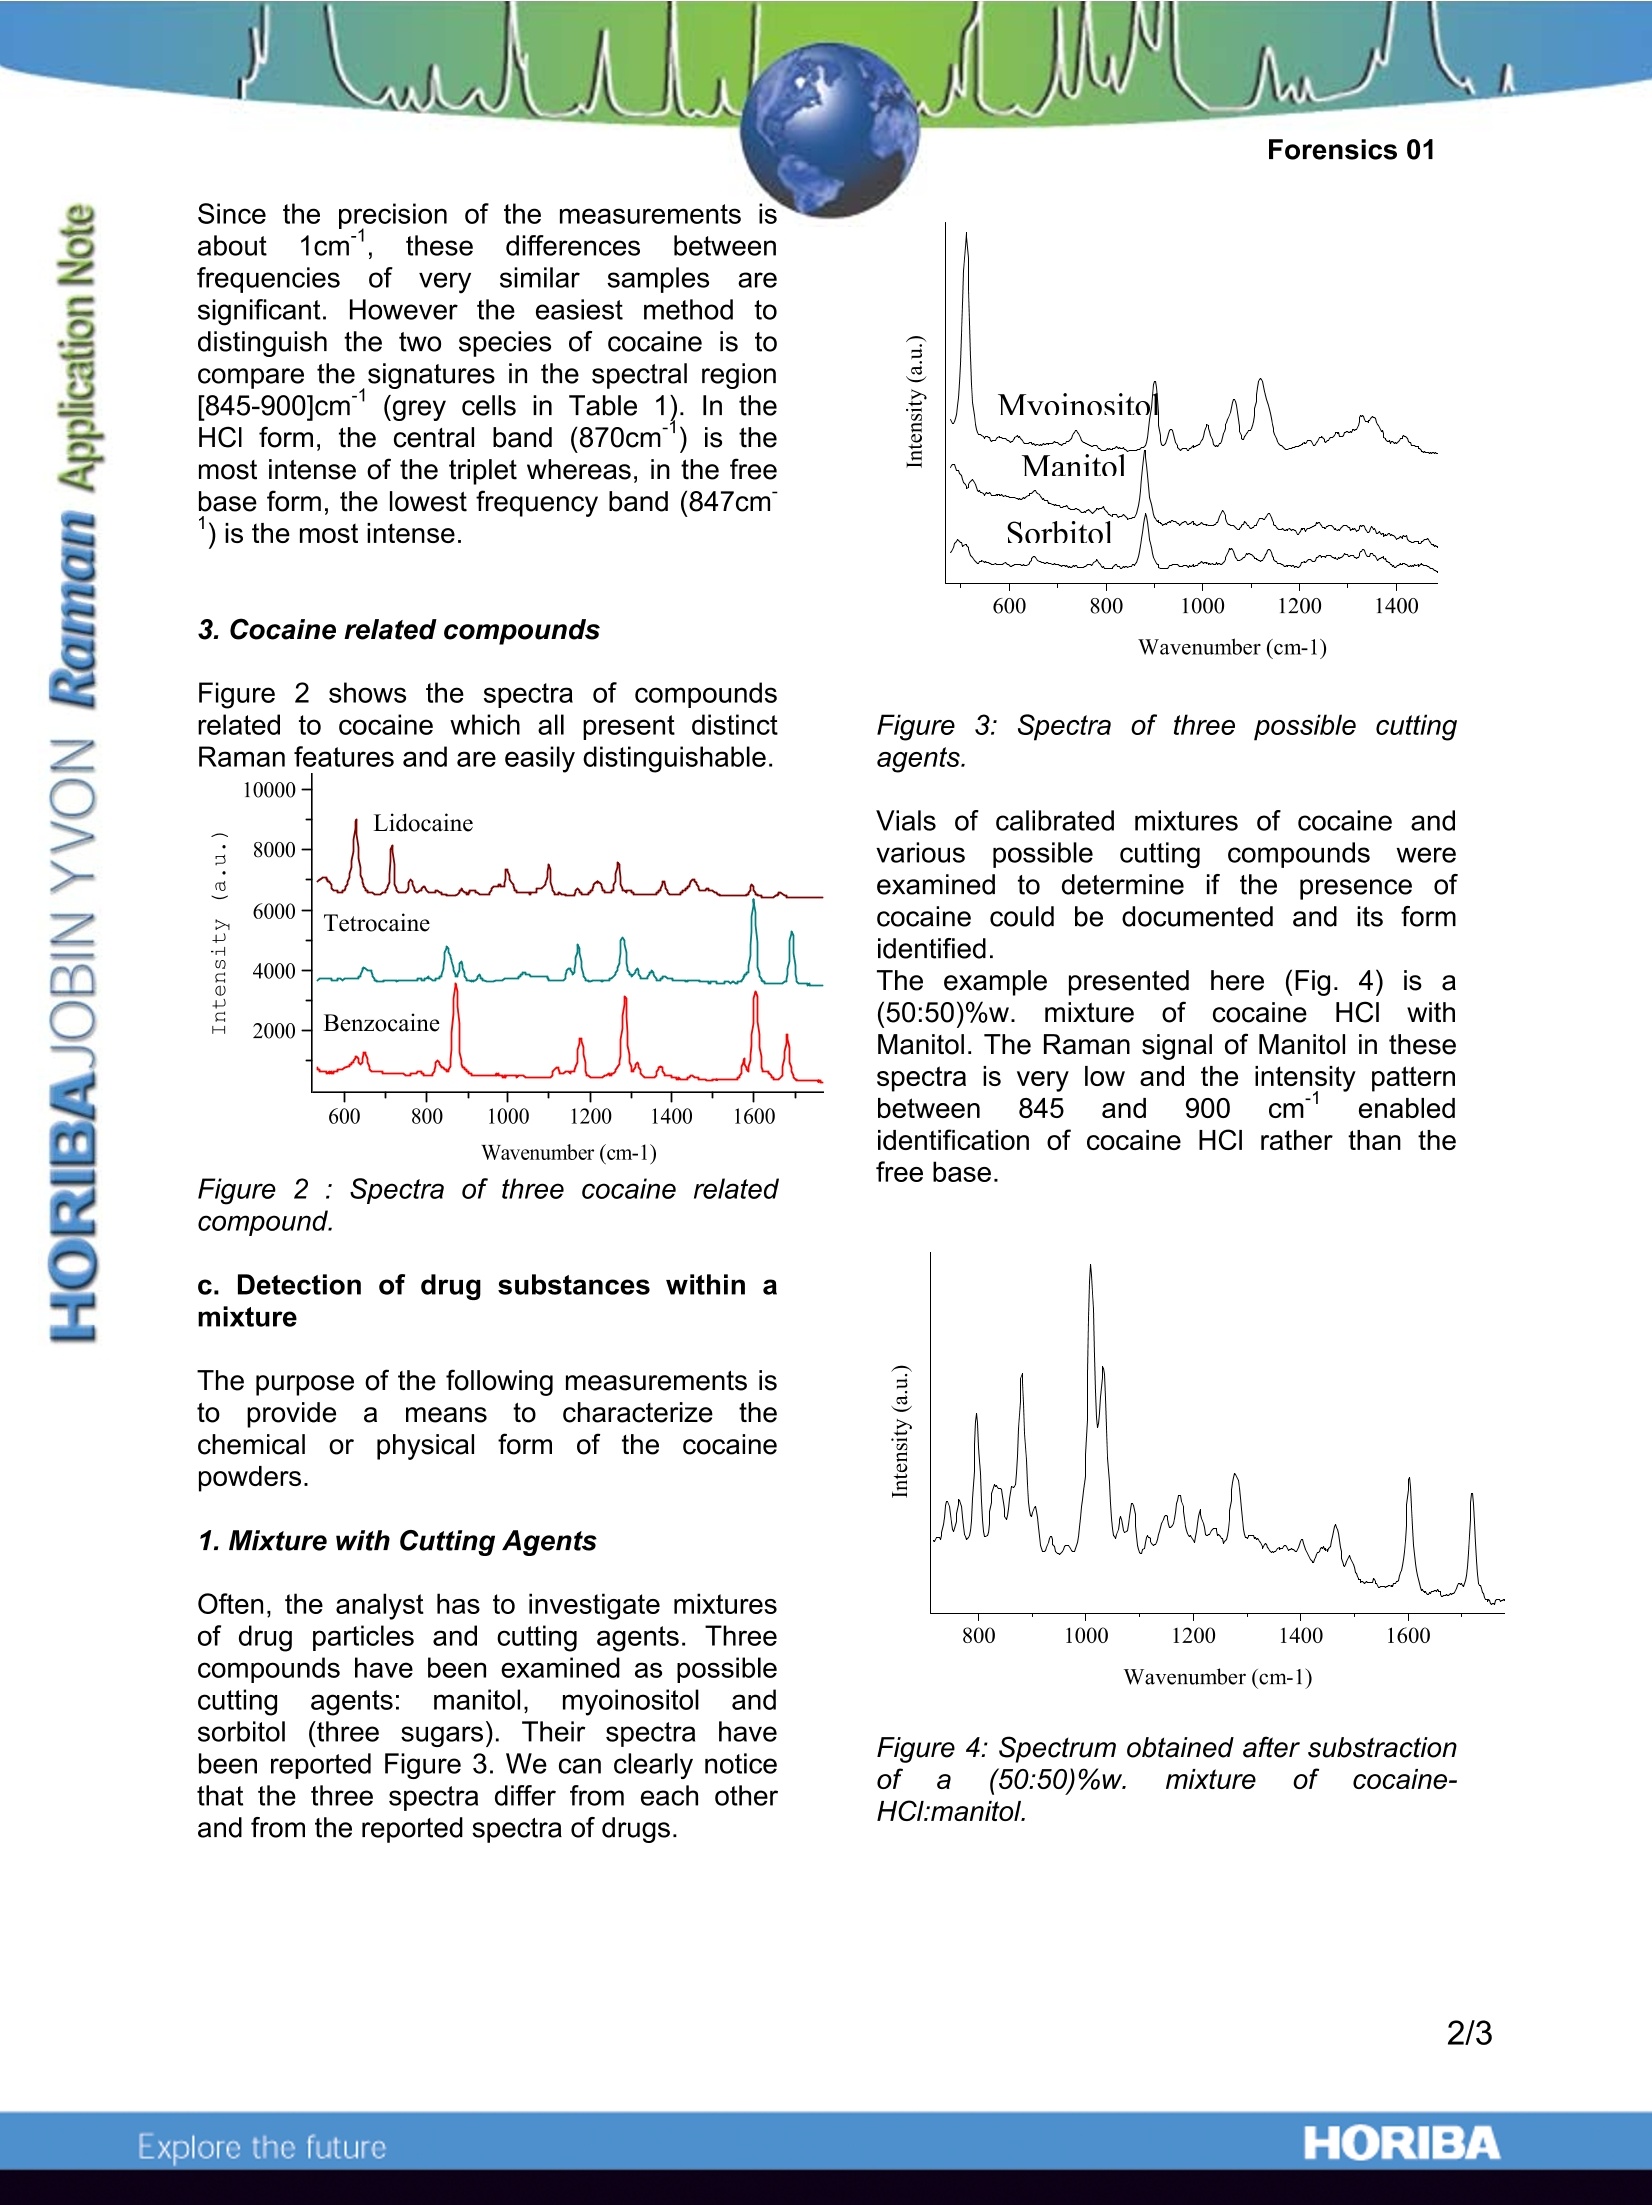
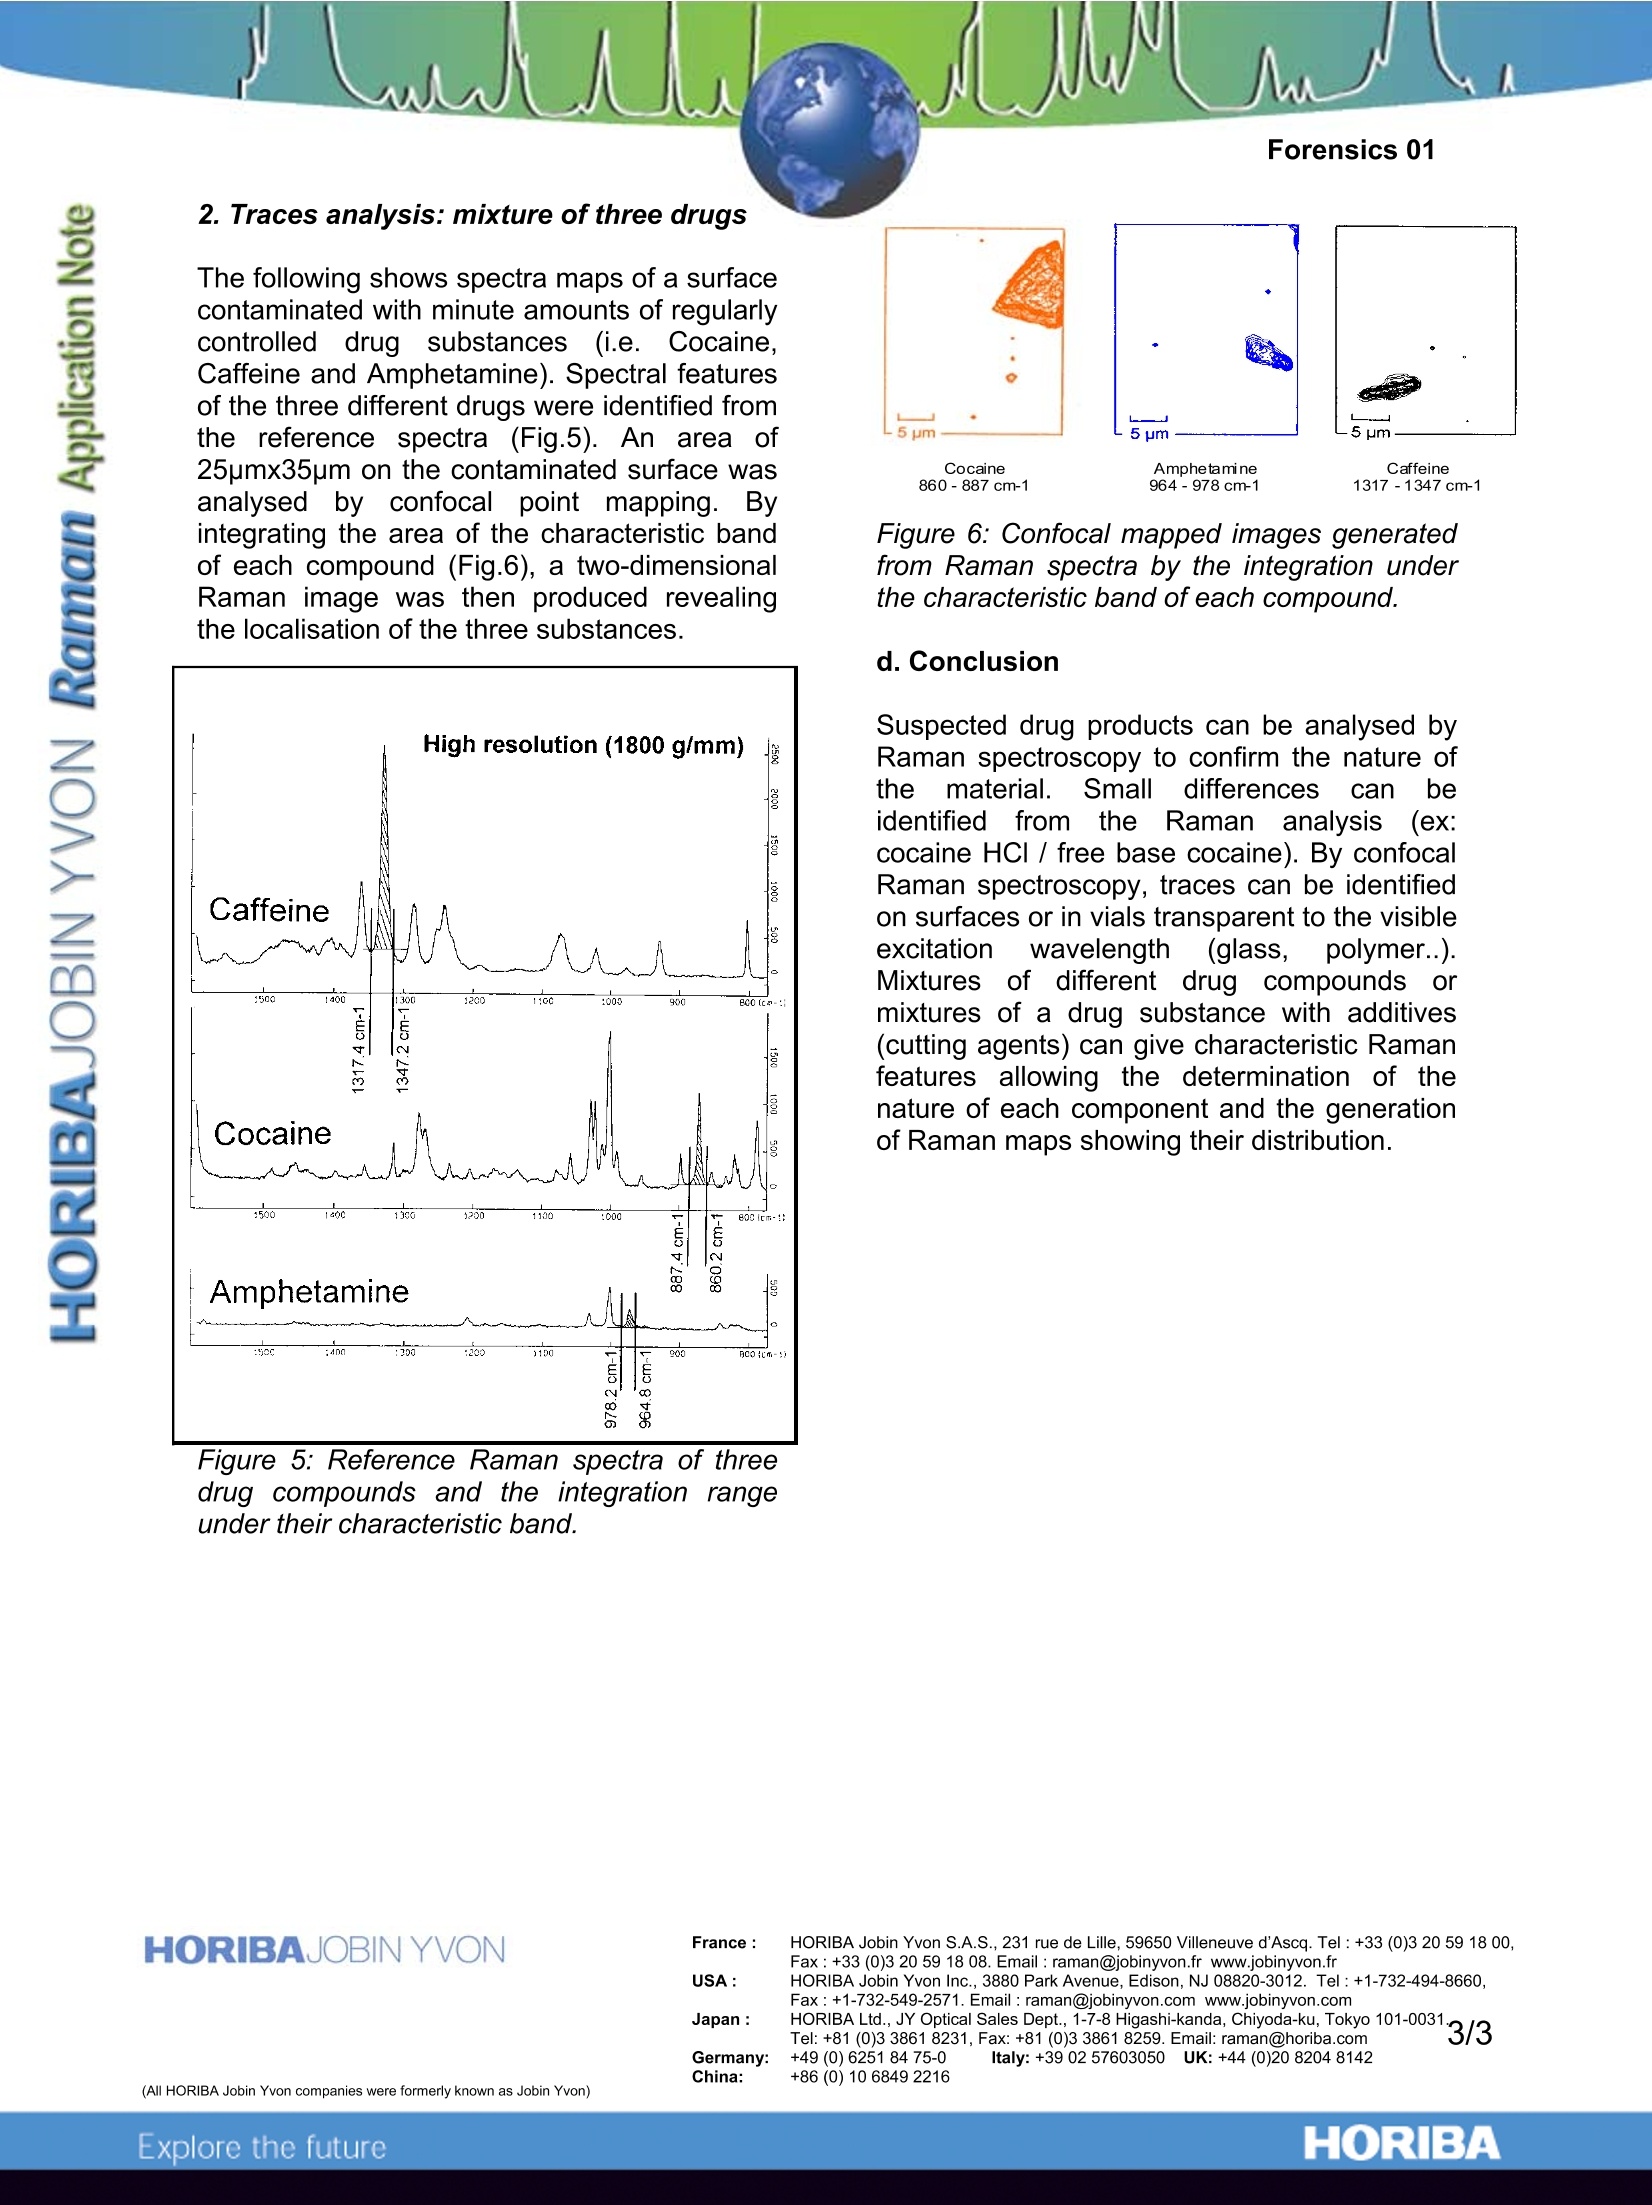
Forensics 01 The Non-Destructive and in-situ identification of controlleddrugs and narcotics Introduction Over the past few years, Raman spectroscopyhas been recognised as an efficient andpowerful analytical tool in the field of ForensicScience. There are several reasons for thisrapid evolution: it is a non contact and nondestructive technique which does not need anysample preparation. In many cases, this henceallows the preservation of smalll1traces ofevidence for further analyses of the samespecimen for confirmation of results. Inaddition only minimal quantities of material arerequired to performna(complete analysisresulting from the high spatial resolution of theconfocal system. The Raman effect is highly sensitive to slightdifferences in chemical compositionandcrystallographic structure. These features arevery useful for the investigation of illegal drugsas it enables the detection of very smalldifferences and therefore to provide valuableinformation regardingtthe origin of thesynthesis method of the drug. The aim of this note is to review the mainadvantages offtthis techniquee tforr cdruginvestigation and to illustrate them withaspecific study of cocaine and its derivatives. Identification of different drug substances 1.Experimental Experiments were carried out on a LabRAMequipped with a 633nm laser and a 785nmdiode laser. Raman spectra of all types wererecorded on the LabRam by using a diodelaser at 785nm; this laser wavelength inhibitsinterfering fluorescence which could be emittedby impurities. However, a cursory look atsamples using the standard 633nm HeNe laserindicated results that were as good, if notbetter, than those recordedwith the diodelaser. At 785nm, glass; emits a fluorescencespectrum. Thus the spectra recorded in glassvials may show a large background around1400cmdue to the glass being close to the focal volume. However, by using the standardfeature of the LabRAM software, it is possibleto effectively subtract the glass backgroundand produce a spectrum of the sample withoutthe glass contribution. 2. Cocaine Raman bands Free base cocaine (Crack) is prepared fromcocaine HClwithammonia or :sodiumbicarbonate and water. The mixture is heatedto remove the hydrochloride. The spectra ofcocaine hydrochloride and free base cocaineare shown in Figure 1. Figure1::1sSpectra of free tbase cocaine(bottom) and of cocaine HCI. 785nm. Spectra were collected directly through theglass vials containing the free particles, using along working distance objective to analyseparticles far behind the glass window. Thus,there is no risk of contamination or degradationof the sample. For convenience, the most prominent featuresin the spectra are tabulated below (Table 1). Free Base HCI 788 cm 786 cm 847 cm (s) 851 cm (rm) 872 cm m) 870 cm ) 896 cm~ (m) 894 cm m) 1003 cm 999 cm 1601 cm 1596 cm 1713 cm 1709 cm Table 1: Position of the main Raman bands ofCocaine HCI and free base cocaine in the[700-1800]cmrange. Since the precision of the measurements isabout1cm, these differences betweenfrequencies ofverysimilar samples aresignificant. However the easiest method todistinguish the two species of cocaine is tocompare the signatures in the spectral region[845-900]cm(grey cells in Table 1). In theHCl form, the central band (870cm) is themost intense of the triplet whereas, in the freebase form, the lowest frequency band (847cm) is the most intense. 3. Cocaine related compounds Figure 2 shows the spectra of compoundsrelated to cocaine which all present distinctRaman features and are easily distinguishable. 10000- Figure 2 : Spectra of three cocaine relatedcompound. c. Detection of drug substances within amixture The purpose of the following measurements isto provide a means to characterize thechemical or physical form of the cocainepowders. 1. Mixture with Cutting Agents Often, the analyst has to investigate mixturesof drug particles and cutting agents. Threecompounds have been examined as possiblecutting agents:rnanitol, myoinositolandsorbitol (three sugars). Their spectra havebeen reported Figure 3. We can clearly noticethat the three spectra differ from each otherand from the reported spectra of drugs. Figure 3: Spectra of three possible cuttingagents. Vials of calibrated mixtures of cocaine andvariouss possible cutting compounds wereexamined to determine if the presence ofcocaine could be documented and its formidentified. The example presented here (Fig. 4) isa(50:50)%w. mixture of cocaine HCl withManitol. The Raman signal of Manitol in thesespectra is very low and the intensity patternbetween 845 and 900o cm1eenabledidentification of cocaine HCl rather than thefree base. Figure 4: Spectrum obtained after substractionofa (50:50)%w.v. nmixture of cocaine-HCl:manitol. 2. Traces analysis: mixture of three drugs The following shows spectra maps of a surfacecontaminated with minute amounts of regularlycontrolled drug substances (i.e. Cocaine,Caffeine and Amphetamine). Spectral featuresof the three different drugs were identified fromthe reference spectra (Fig.5). An1 areaof25pmx35pm on the contaminated surface wasanalysed by confocal point mapping. Byintegrating the area of the characteristic bandof each compound (Fig.6), a two-dimensionalRaman image was then produced revealingthe localisation of the three substances. Figure 5: Reference Raman spectra of threedrug compounds and the integration rangeunder their characteristic band. Figure 6: Confocal mapped images generatedfrom Raman spectra by the integration underthe characteristic band of each compound. d.Conclusion Suspected drug products can be analysed byRaman spectroscopy to confirm the nature ofthe material. Small differences canbeidentifiedfrom theRamananalysisS((ex:cocaine HCI / free base cocaine). By confocalRaman spectroscopy, traces can be identifiedon surfaces or in vials transparent to the visibleexcitationwavelength (glass, polymer..).Mixtures of different drug compounds ormixtures of a drug substance with additives(cutting agents) can give characteristic Ramanfeatures allowing the determination of thenature of each component and the generationof Raman maps showing their distribution. HORIBA Jobin Yvon S.A.S., 231 rue de Lille, 59650 Villeneuve d'Ascq. Tel: +33(0)3 20 59 18 00, ORIBAExplore the future ORIBAExplore the future Suspected drug products can be analysed by Raman spectroscopy to confirm the nature of the material. Small differences can be identified from the Raman analysis (ex: cocaine HCl / free base cocaine). By confocal Raman spectroscopy, traces can be identified on surfaces or in vials transparent to the visible excitation wavelength (glass, polymer..). Mixtures of different drug compounds or mixtures of a drug substance with additives (cutting agents) can give characteristic Raman features allowing the determination of the nature of each component and the generation of Raman maps showing their distribution.
确定
还剩1页未读,是否继续阅读?

HORIBA(中国)为您提供《管制药品,麻醉剂中化学组成及分布检测方案(激光拉曼光谱)》,该方案主要用于其他中化学组成及分布检测,参考标准--,《管制药品,麻醉剂中化学组成及分布检测方案(激光拉曼光谱)》用到的仪器有
相关方案
更多
该厂商其他方案
更多