


方案详情
文
The different components of this pharmaceutical sample can be characterized easily by Raman spectroscopy and the comparison with spectra from our libraries allowed us to identify some of these molecules. A good spectral discrimination could be obtained as the characteristic spectral fingerprints have exclusive features. The Raman imaging technique is a very powerful tool as shown here, as it also enables to characterize the spatial distribution of the components with a high spatial resolution. The complementary results obtained by FTIR spectroscopy on the sample confirm the presence of lactose and allows the identification of the third component also observed by Raman spectroscopy. The combination of FTIR and Raman analysis on the same spectrometer represents a powerful analytical tool to readily record both IR and Raman vibrational information from a same sample position.
方案详情

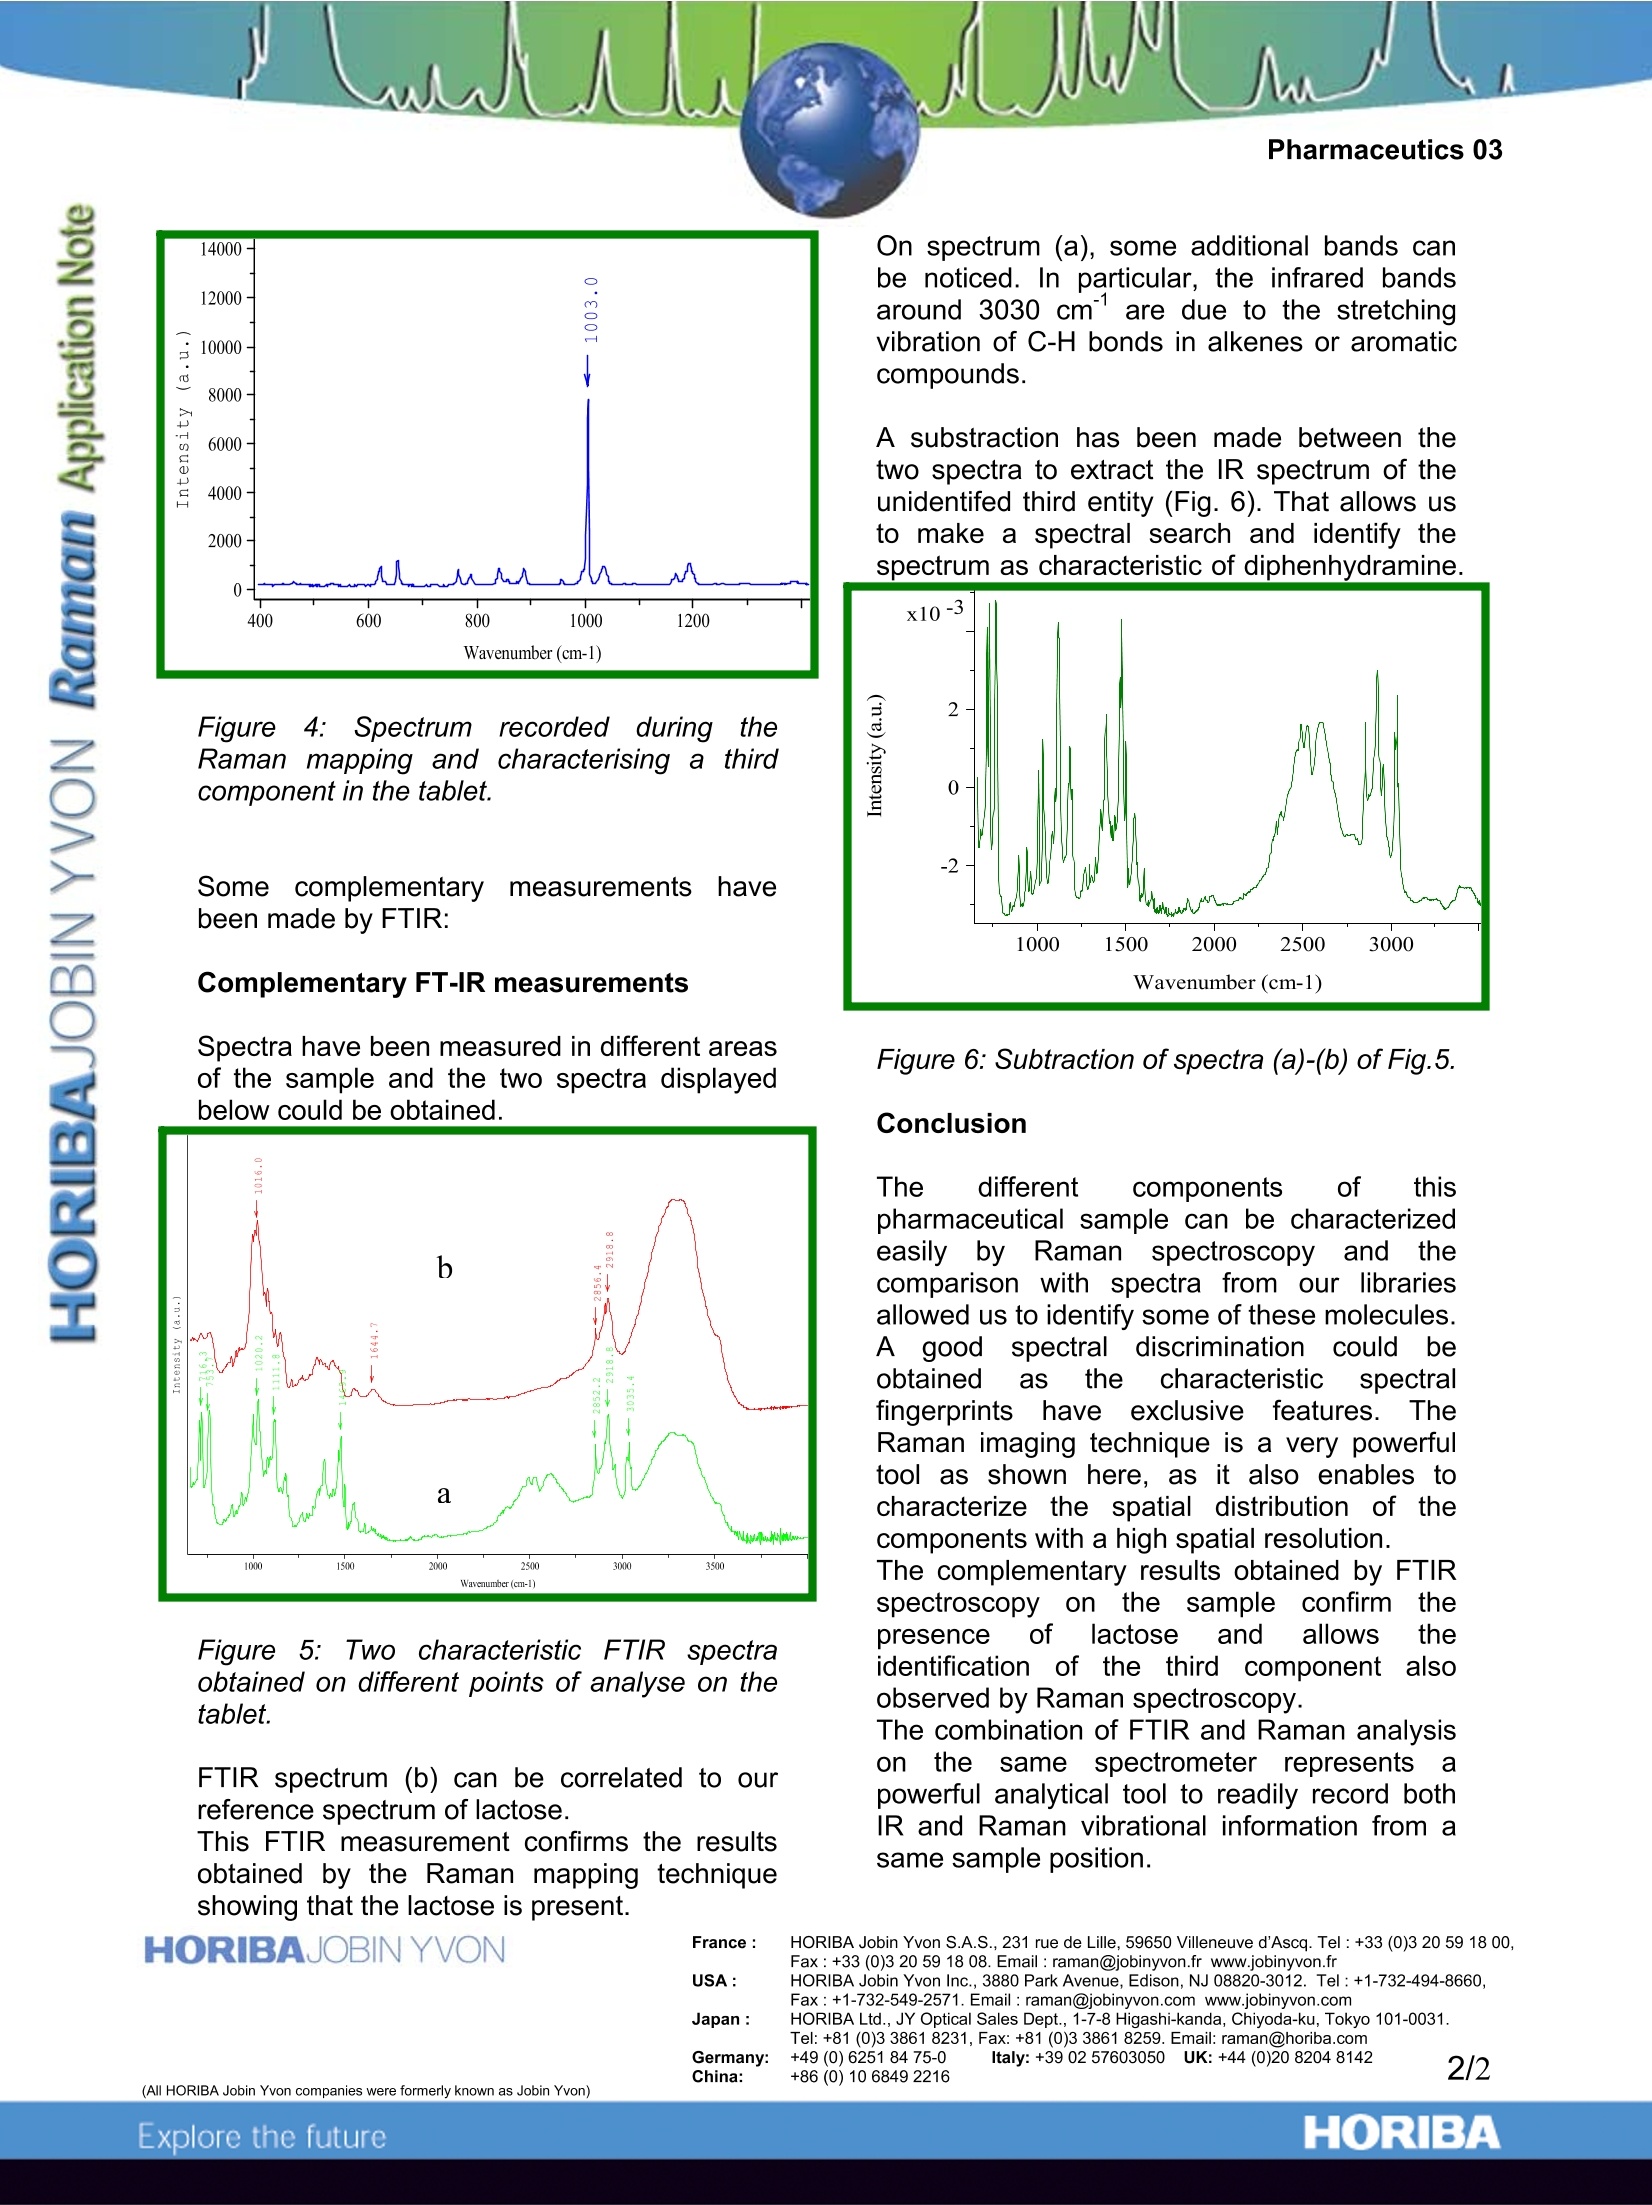
Pharmaceutics 03 Characterisation and Mapping of active pharmaceutical ingredientsand excipients in a tablet BY RAMAN and infrared spectroscopy onthe same microspectrometer Aim of the measurements The objective of the measurementsisStoidentify the unknown components and theirrespective dispersion within pharmaceuticaltabs by Raman and FT-IR microspectrometry. Conditions of measurements : The LabRAM IR provides a unique functionalityto collect Raman and infrared spectra on thesame microscope. This strongly facilitates the operation and handling of the samples.The Raman spectra have been acquired byusing an excitation at 633nm.The IR spectra have been acquired by using an ATR objective and the spectral resolution is4 cm". The spectra have been adjusted takingaccount of the effect of depth penetration. Identification of the different ingredients Several point measurements have beencarried out in different areas of the sample andtwo typical spectra have been obtained. Themain Raman bands have been pointed out anda spectral search using an electronic libraryenables tto identify the componentscharacterized by these two spectra (Fig.1) asbeing Lactose and Starch. Figure 1:Spectrum recorded on the tablet andassigned to starch (a) and lactose (b). Thespectra have been translated in the y axis inorder to make the comparison easier. In order to improve the chemical description ofthe sample, aRaman mapping has; beenacquired on the area presented below (Fig.2).The area is 35x35 pmlarge and one spectrumhas been recorded every 1um. Figure 2: Video image of On each spectrum,the area of the bands characteristic of starchand lactose are calculated. Then the Ramanmapping(Figure 3) showsthe spatialdistribution of the compounds and allows us toidentify another ingredient characterized by thespectrum plotted Fig.4. For this third spectrum,the spectrallibrary did notidentifythecomponent. However, some useful informationcan be extracted from this spectrum as themain Raman band pointed out at 1005 cmcharacterizes a substituted aromatic group. Figure 3: Map recorded on the surface definedFig.2. The color scale displays the area of aband characteristic of starch (red), lactose(green) and a third component (blue) whichspectrum is reported Fig.4. Figure4: Spectrumrecordedduring theRaman mapping and characterising a thirdcomponent in the tablet. Some complementary measurementshavebeen made by FTIR: Complementary FT-IR measurements Spectra have been measured in different areasof the sample and the two spectra displayedbelow could be obtained. Figure 5:Two characteristic FTIR spectraobtained on different points of analyse on thetablet. FTIR spectrum (b) can be correlated to ourreference spectrum of lactose. This FTIR measurement confirms the resultsobtained by the Raman mapping techniqueshowing that the lactose is present. On spectrum (a), some additional bands canbe noticed. In particular, the infrared bandsaround 3030 cm are due to the stretchingvibration of C-H bonds in alkenes or aromaticcompounds. A substraction has been made between thetwo spectra to extract the IR spectrum of theunidentifed third entity (Fig. 6). That allows usto make a spectral search and identify thespectrum as characteristic of diphenhydramine. Figure 6: Subtraction of spectra (a)-(b) of Fig.5. Conclusion The different components of thispharmaceutical sample can be characterizedeasilyby FRamannspectroscopy andthecomparison with spectra from our librariesallowed us to identify some of these molecules.Agoodspectral discrimination could beobtainedaastthe characteristic spectralfingerprintshave exclusive features.. TheRaman imaging technique is a very powerfultool as shown here, as it also enables tocharacterize the spatial distribution of thecomponents with a high spatial resolution. The complementary results obtained by FTIRspectroscopy on tthee sample confirmthepresenceofflactose andallows theidentification of the third component alsoobserved by Raman spectroscopy. The combination of FTIR and Raman analysisonthe1esame spectrometer representsapowerful analytical tool to readily record bothIR and Raman vibrational information from asame sample position. ( France: HORIBA Jobin Yvon S.A.S., 231 rue de Lille, 59650 Villeneuve d'Ascq. T e l:+33(0)3 20 59 18 00,Fax :+33 (0)320 59 18 08. Email : raman@jobinyvon.fr www.jobinyvon.fr USA : HORIBA Jobin Yvon Inc., 3880 Park Avenue, Edison, NJ 08820-3012. Te l :+1-732-494-8660, t le Fax : +1-732-549-2571. Email : raman@jobinyvon.com w ww.jobinyvon.com Japan: HORIBA Ltd., JY Optical Sales Dept., 1-7-8 H igashi-kanda, Chiyoda-ku, T o kyo 101-0031.Tel: +81 (0)3 3861 8231, Fax: +81 ( 0)3 3861 8 259. Email: raman@horiba.com Germany: +49(0)6251 84 75-0 l taly: +39 02 5760305 0 U K : +44(0)208204 8142 China: +86(0) 10 6849 2216 2/2 ) ORIBAExplore the future HORIBAJOBIN YVON(All HORIBA Jobin Yvon companies were formerly known as Jobin Yvon)HORIBAExplore the future The different components of this pharmaceutical sample can be characterized easily by Raman spectroscopy and the comparison with spectra from our libraries allowed us to identify some of these molecules. A good spectral discrimination could be obtained as the characteristic spectral fingerprints have exclusive features. The Raman imaging technique is a very powerful tool as shown here, as it also enables to characterize the spatial distribution of the components with a high spatial resolution. The complementary results obtained by FTIR spectroscopy on the sample confirm the presence of lactose and allows the identification of the third component also observed by Raman spectroscopy. The combination of FTIR and Raman analysis on the same spectrometer represents a powerful analytical tool to readily record both IR and Raman vibrational information from a same sample position.
确定

还剩1页未读,是否继续阅读?

HORIBA(中国)为您提供《药物中化学组成及分布检测方案(激光拉曼光谱)》,该方案主要用于其他中化学组成及分布检测,参考标准--,《药物中化学组成及分布检测方案(激光拉曼光谱)》用到的仪器有
相关方案
更多
该厂商其他方案
更多