


方案详情
文
The objective of this investigation was to evaluate two methods for measuring the maximum sublimation rate that a freeze-dryer will support—the minimum controllable pressure method and the choke point method.
方案详情

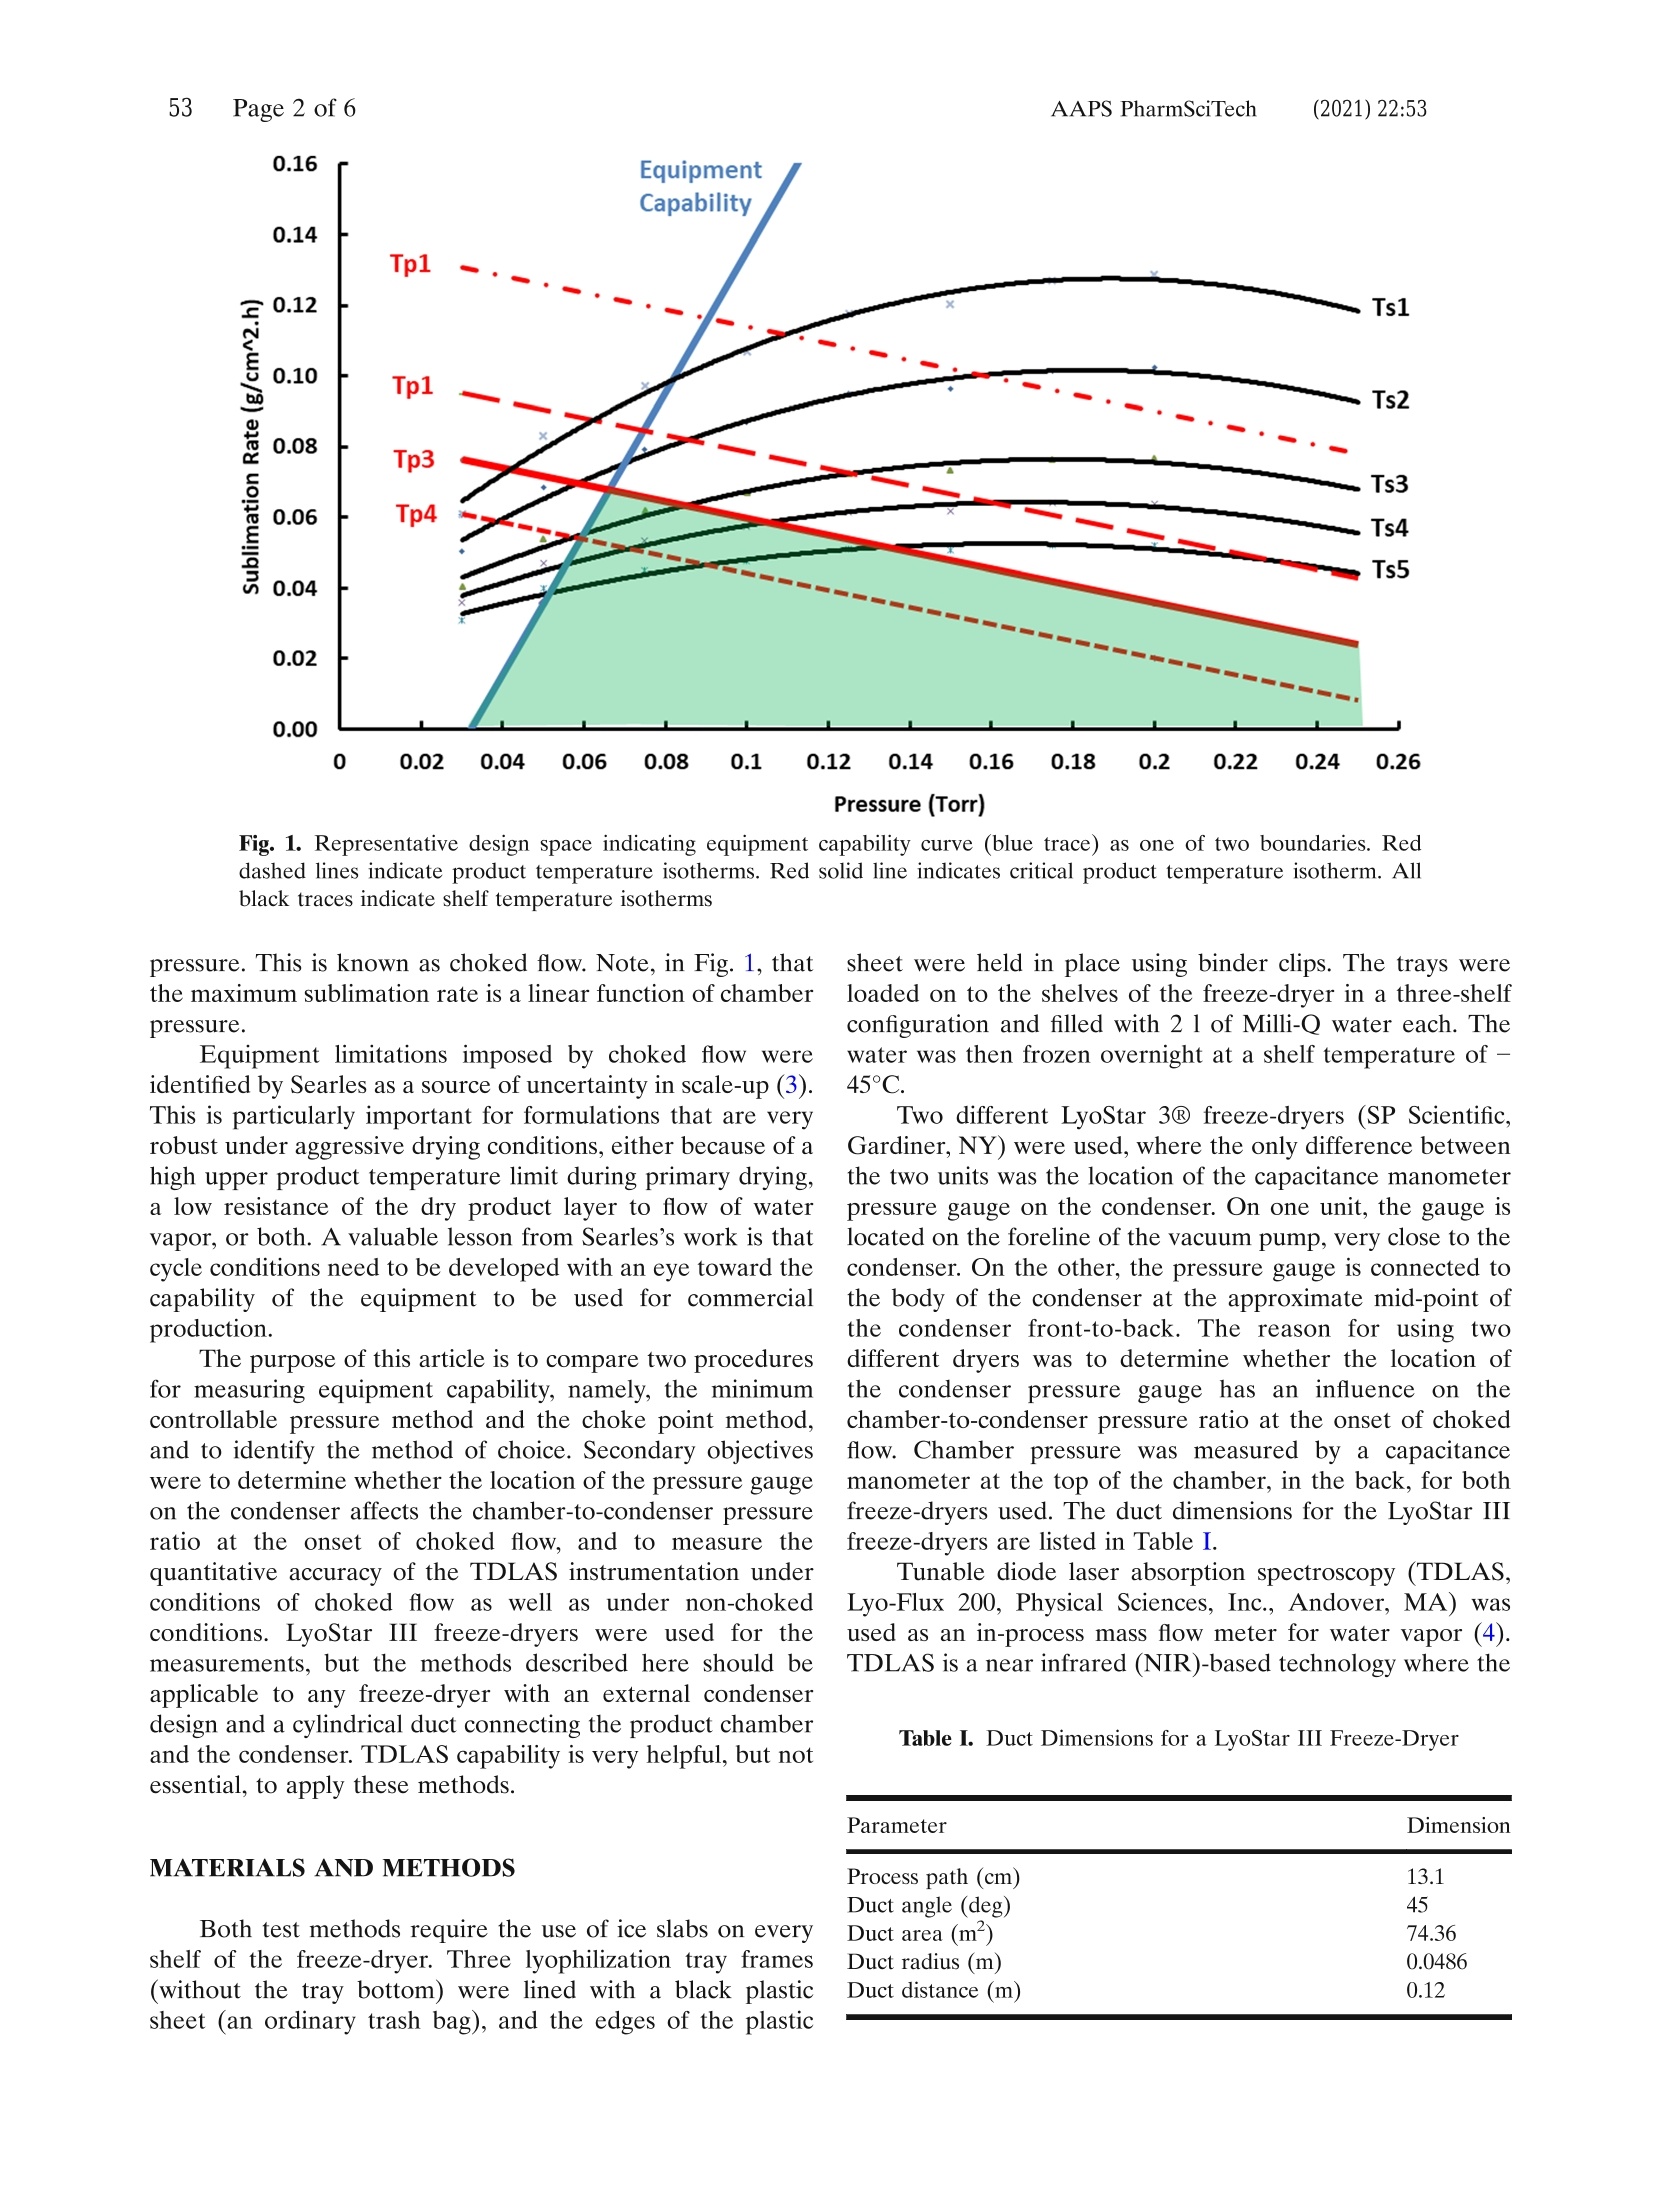
Freeze-drying is an essential unit operation in manufac ture of injectable drug products, but the process suffers from being very ineffificient, with cycle times of days rather than a few hours, as in most pharmaceutical unit operations. The inherent ineffificiency of the process is commonly made worse by a trial-and-error approach to cycle development, where process conditions may be developed that are far from optimum, where optimum conditions are defifined as those that minimize cycle time while providing a pharmaceutically acceptable product using conditions that are within the capability of the equipment.Identifification of optimum conditions for primary drying has been facilitated in recent years by application of a graphical design space for primary drying (1,2). A represen tative design space is illustrated in Fig.1, with sublimation rate on they-axis and chamber pressure on thex-axis. There are two sets of isotherms—one for shelf temperature and one for product temperature. The design space is constructed usingfifirst principles of heat and mass transfer along with measured values for the vial heat transfer coeffificient (Kv) and the resistance of the dried product layer toflflow of water vapor during primary drying (Rp). These isotherms establish the relationship between the process variables that are directly controlled, shelf temperature and chamber pressure, and product temperature, a critical process variable that is not directly controlled.AAPSPharmSciTech (2021) 22:53DOI: 10.1208/s12249-021-01921-2Research Article AAPS PharmSciTech (2021) 22:5353 Page 3 of 6 EquipmentCapabilityMeasurement ofLaboratory Freeze-Dryers: aComparison of Two Methods Jayasree M. Srinivasan,1,5Gregory A. Sacha,1Vaibhav Kshirsagar,2Alina Alexeenko,3,4 and Steven L. Nail1 Received 20 October 2020; accepted 4 January 2021 Abstract. The objective of this investigation was to evaluate two methods for measuring the maximum sublimation rate that a freeze-dryer will support—the minimum controllable pressure method and the choke point method. Bothmethods gave equivalent results, but the minimum controllable pressure method is preferred, since it is easier, faster, and less subjective. The ratio of chamber pressure to condenser pressure corresponding to the onset of chokedhow was considerably higher in this investigation(up to about 20:1) than in previously published reports.This ratiowas not affected by the location of the pressure gauge on the condenser; that is, on the foreline of the vacuum pump versus on the body of the condenser itself. The total water loss due to sublimation as measured by tunable diode laser absorption spectroscopy was consistently within 5% of gravimetrically determined weight loss, regardless of whether the measurement took place during choked versus non-choked process conditions. KEYWORDS: equipment capability;minimum controllable pressure; choke point; choked low; tunable diode laser absorption spectroscopy (TDLAS). INTRODUCTION Freeze-drying is an essential unit operation in manufac-ture of injectable drug products, but the process suffers from being very ineficient, with cycle times of days rather than a few hours, as in most pharmaceutical unit operations. The inherent ineficiency of the process is commonly made worse by a trial-and-error approach to cycle development, where process conditions may be developed that are far from optimum, where optimum conditions arede nedasthose that minimize cycle time while providing a pharmaceutically acceptable product using conditions that are within the capability of the equipment. Identiication of optimum conditions for primary drying has been facilitated in recent years by application of a graphical design space for primary drying (1,2). A represen-tative design space is illustrated in Fig. 1, with sublimation rate on the y-axis and chamber pressure on the x-axis. There are two sets of isotherms—one for shelf temperature and one 1 Pharmaceutical R&D, Baxter Healthcare, 927 S. Curry Pike, Bloomington, Indiana 47403, USA. 2 Present Address:IMA Life, Inc., Tonawanda, New York 14150, USA. 3 School of Aeronautics and Astronautics, Purdue University, West Lafayette, Indiana 47907, USA. 4Davidson School of ChemicalEngineering, PurdueUniversity, West Lafayette, Indiana 47907, USA. 5To whom correspondence should be addressed. (e–mail:jayasree_srinivasan@baxter.com) for product temperature. The design space is constructed usingirst principlesofheat and mass transferalong with measured values for the vial heat transfer coeficient (Kv) and theresistanceofthedriedproductlayerto ow of water vapor during primary drying (Rp). These isotherms establish the relationship between the process variables that are directly controlled, shelf temperature and chamber pressure, and product temperature, a critical process variable that is not directly controlled. There are two boundaries on the design space in Fig.1—one product-related and the other equipment-related. One of the product temperature isotherms (solid red line) represents the maximum allowable product temperature during primary drying (usually, but not always, the collapse temperature). The other boundary (blue trace) is the equipment capability curve. This curve recognizes that any freeze-dryer has limits with respect to the maximum sublima-tion rate that it will support. Limiting factors could be refrigeration capacity, condenser surface area, or maximum attainable shelf temperature. However, for many freeze-dryers using an external condenser design, equipment capa-bility is limited by sonic velocity in the duct connecting the freeze-dryer chamber to the condenser (3). Sonic velocity is the maximum obtainable low velocity for a constant cross-section pipe.Aswater vapor velocity approaches the speed of sound (about 390 m/s at − 25°C), the mass low rate through theductattainsits maximum valueforagivenupstream (chamber) pressure and becomes independent of pressure on the downstream side of the duct—in this case, the condenser 53 Page 2 of 6 AAPS PharmSciTech (2021) 22:53 Pressure (Torr) Fig. 1. Representative design space indicating equipment capability curve (blue trace) as one of two boundaries. Red dashed lines indicate product temperature isotherms. Red solid line indicates critical product temperature isotherm. All black traces indicate shelf temperature isotherms pressure. This is known as choked low. Note, in Fig. 1, that themaximum sublimation rate is a linear function of chamber pressure. Equipment limitations imposed by choked iow were identiied by Searles as a source of uncertainty in scale-up (3). This is particularly important for formulations that are very robust under aggressive drying conditions, either because of a high upper product temperature limit during primary drying, a low resistance of the dry product layer tolow of water vapor, or both. A valuable lesson from Searles’s work is that cycle conditions need to be developedwith an eye toward the capability of the equipment to be used for commercial production. The purpose of this article is to compare two procedures for measuringequipment capability,namely,the minimum controllable pressure method and the choke point method, and to identify the method of choice. Secondary objectives were to determinewhether the location of the pressure gauge on the condenser affects the chamber-to-condenser pressure ratio at the onset of choked ow, and to measure the quantitative accuracy of the TDLAS instrumentation under conditions of choked cow as well as under non-choked conditions. LyoStar III freeze-dryers were used for the measurements,but the methodsdescribed hereshould be applicabletoanyfreeze-dryer with anexternalcondenser design and a cylindrical duct connecting the product chamber and the condenser. TDLAS capability is very helpful, but not essential, to apply these methods. MATERIALSANDMETHODS Both test methods require the use of ice slabs on every shelf of thefreeze-dryer. Threelyophilizationtray frames (withoutthetraybottom) were lined with ablackplastic sheet (an ordinary trash bag), and the edges of the plastic sheet were held in place using binder clips. The trays were loaded on to the shelves of the freeze-dryer in a three-shelf coniguration and illed with 2 l of Milli-Q water each. The water was then frozen overnight at a shelf temperature of −45°C. Two different LyoStar 3® freeze-dryers(SP Scientiic, Gardiner, NY)were used, where the only difference between the two units was the location of the capacitance manometer pressure gauge on the condenser. On one unit, the gauge is located on the foreline of the vacuum pump, very close to the condenser. On the other, the pressure gauge is connected to the body of the condenser at the approximate mid-point of the condenser front-to-back. The reason for using two differentdryers was to determine whetherthelocationof the condenser pressure gauge has an inluence on the chamber-to-condenser pressure ratio at the onset of choked low. Chamber pressure was measured by a capacitance manometer at the top of the chamber, in the back, for both freeze-dryers used. The duct dimensions for the LyoStar III freeze-dryers are listed in Table I. Tunable diode laser absorption spectroscopy (TDLAS, Lyo-Flux 200, Physical Sciences, Inc., Andover, MA) was used as an in-process mass low meter for water vapor (4). TDLAS is a near infrared (NIR)-based technology where the Table I. Duct Dimensions for a LyoStar III Freeze-Dryer Parameter Dimension Process path (cm) 13.1 Duct angle (deg) 45 Duct area (m2) 74.36 Duct radius (m) 0.0486 Duct distance (m) 0.12 laser is tuned to detectwater vapor absorption tomeasure the density (molecules/cc) of water vapor as well as its velocity (m/s). The optical hardware is installed in the duct that connects the freeze-dryer chamber and the condenser. TDLAS can only be used with dryers that are equipped with an external condenser, where the chamber and condenser are connected by a cylindrical duct, and the duct can accommo-date the TDLAS optical hardware. The freeze-dryer/TDLAS used for this investigation is an integrated system that provides the following advantages over the previous stand-alone versions: (1) automated determination of the TDLAS sensor zero offset velocity; (2) automated saving of the TDLAS sensor data and integration of the total amount of water removed; (3) transfer of the TDLAS sensor data to the freeze-dryer data historian, providing consistent time stamps for theTDLAS and the freeze-dryer process data; (4) transfer of freeze-dryer chamber pressure and shelf temperature data to the TDLAS sensor automating data analysis for recipes with changing freeze-dryer operating pressure and enabling automated calculation of data products from the heat and mass transfer model of vial-based pharmaceutical freeze-drying; and (5) elimination of the need for an operator to be present at the start of a cycle orwhen a change in pressure set point is needed. MinimumControllable Pressure Method For the minimum controllable pressure method, the chamber pressure set point was 10 mT, which is below the lowest attainable pressure for the freeze-dryers under con-sideration. The initial shelf temperature was − 45°C. After a steady state chamber pressure was reached, the mass rate of water vapor was recorded. The shelf temperature was then increased by 10°C, and the process was repeated for several more shelf temperature set points. While only two points are required to establish a straight line, we consider it best practice to collect data for ive or six pressures. With the minimum controllable pressure method, cow was choked throughout the experiment. Choke Point Method After freezing the trays ofwater at − 45°C overnight, the system was evacuated and the pressure was allowed to stabilize at 45 mTorr. When steady state was established at this pressure set point, step changes to the shelf temperature were made until chokedhow was observed. The resulting mass low rate was then recorded. A new pressure set point was then established and the process was repeated. TDLASAccuracy Measurement For both test methods, the test was stopped when roughly 60–75% of the original ice load remained. The remaining ice was then weighed, and the percent error in the TDLAS measurement was calculated. For the choke point method, low is choked during only part of the test, but the oscillations in both pressure and mass ow rate (see below) would appear to present a more challenging situation for accurate mass low rate measurement by TDLAS. For comparative data on TDLAS accuracy under entirely non-choked conditions, ice slab tests were done under modest process conditions, using a shelf temperature of either − 15°C or 0°C and a chamber pressure of 100 mT. RESULTSANDDISCUSSION MinimumControllable Pressure Method The lyo in-process data were used to graph the pressure and the mass low rate as a function of time (Fig. 2). The condenser pressure ranged from 2 to 13 mTorr throughout the experiment. As a result, the ratio of chamber pressure to condenser pressure ranged from approximately 8:1 to as high as 20:1. This is a surprisingly high pressure ratio as compared with literature reports. Searles (3) reported the use of the ratio of chamber pressure to condenser pressure as an indicatorofchokedtow, wherearatioofthreeor more should be taken as conirmatory of choked low. Isentropic low theory (5) gives the theoretical pressure ratio between the upstream and downstream reservoirs that correspond to choked conditions as p/p* = ((γ + 1)/2)γ/(γ+ 1)where γ is the speciic heat ratio (Cp/Cv), p is the chamber pressure, and p*is thepressureatthe ductexit.For watervaporat low temperatures,γ= 1.33 and p/p* = 1.85. A chamber-to-condenser ratio of less than 1.85 is taken as conirmation that the low is not choked. Due to viscous effects not accounted for in the isentropic low theory, the actual pressure ratio at which choking occurs for a given freeze-dryer may be higher than 1.85 and is highly dependent on the equipment design. There is some uncertainty regarding the pressure at the duct exit, with the condenser pressure gauge located either on the foreline of the vacuum pump, near the condenser body, or on the condenser itself on thetop of the condenser roughly midway along the length.Given thatwater vapor is constantly being removed by the condenser (condenser temperature usually in the range of − 80 to − 85°C), we would expect pressure gradients in the condenser. Another factor that may affect the chamber-to-condenser pressure ratio corresponding to the onset of choked low is the presence of isolation valve hardware inside the duct. The theoretical pressure ratio assumes a “clean”cylinder. Kshirsagar and coworkers (6) reported that the isolation valve, contained within the connecting duct in the LyoStar freeze-dryers, reduces the cross-sectional area avail-able for low of gasses. The resulting pressure drop causes an increase in chamber pressure and would increase the chamber-to-condenser pressure ratio. These investigators did not attempt to calculate the expected pressure ratio under choked conditions. Patel et al. (7), using choke point testing, reported that the chamber-to-condenser pressure ratio was always greater than 2 when control of chamber pressure was lost. In our experiment, the mass low rate increased linearly with chamber pressure as the shelf temperature was increased in increments of 10°C. Note that the condenser temperaturewas unaffected by choked low and remained at less than − 75°C throughout (Fig. 2). For the equipment used here, condenser performance is not a limiting factor in equipment capability. AAPS PharmSciTech (2021) 22:53 —Condenser Temperature Chamber CM 一一Condenser CM ·Mass Flow Rate Fig. 2. Graph of pressure and mass low rate as a function of time using the minimum controllable pressure method. Note that the condenser temperature remained at < − 70°C throughout the experiment Choke Point Method Referring to the process data in Fig. 3, note that there are two ways of identifying choked low using this method. Oneway is to observe that the chamber pressure drifts above the set point pressure.With respect to the process data in Fig.3, this is a subtle change that might easily be overlooked. While chamber pressure exceeding the set point is evident at a set point of 120 mT (inset, at about 8.7 h), there are some set pointswhere the pressure exceeding the set point is hardly evident at all. A more telling indicator of choked low is the condenser pressure. Note that there is a period where both the mass low rate and the condenser pressure are oscillating out-of-phase as the control system tries to maintain the chamber pressure set point. During this period of oscillation, ascondenserpressuredecreases, masscow rate increases, andviceversa. By deinition,iow of watervaporisnot choked at this point, despite a chamber/condenser pressure ratio in the range of 2 to 3. At the point where the chamber pressure exceeds the set point, note that the condenser pressure drops rapidly. This is the point where the low of nitrogen, used to control the pressure, cuts off, and the condenser pressure “bottoms out” at less than 10 mT, indicating the onset of choked ow. This probably Chamber CM —-CONDENSER CM -Mass Flow Rate Fig. 3. Graph of pressure and mass low rate as a function of time using the choke point method and expanded graph to show condenser pressure “bottoming out”when the low is choked at a pressure set point of 120 mTorr (inset) Fig. 4. Comparison of minimum controllable pressure and choke point methods corresponds to the low pressure limit of the vacuum system. These data demonstrate the utility of having a capacitance manometer on both the chamber and the condenser, partic-ularly as a tool in measuring equipment performance. Effect of Condenser Pressure Gauge Placement The data reported here used the freeze-dryer with the condenser pressure gauge placed on the foreline of the vacuum pump. However, we found that a minimum control-lable pressure test using the freeze-dryer with the condenser pressure gauge mounted on the body of the condenser resulted in process data that were not distinguishable from the data in Fig. 2 (data not shown). These data support the idea that, at least for the two condenser pressure gauge conigurations shown here, the minimum controllable pres-sure results are unaffected by the location of the pressure gauge. Of course, it would be useful to examine the inluence of placing the pressure gauge at the duct exit. Comparison of the Two Methods Comparison of the massCow data obtained using the minimum controllable pressure and choke point methods showed an excellent agreement between the twomethods, as indicated by the superimposable lines in Fig. 4. Based on the results of this study, we recommend the minimum controlla-ble pressure method because it is easier, quicker, and less subjective than the choke point method. In fact, the choke point method would not be advisable at all without the additional information provided by a pressure gauge on the condenser, given the often uncertainty around the point where the chamber pressure has exceeded the set point. Also, the minimum controllable pressure method allows for the experiment to be conducted in a fully automatic mode, whereas the choke point method allows for only a semi-automatic cycle with user intervention required periodically to determine the onset of choked low. TDLASAccuracy The accuracy of the TDLAS as a lowmeter to measure the mass low ratewas determined by comparing the quantity of icesublimed as measuredby TDLAS with gravimetric weight loss for several ice slab tests. The experiments were conductedeither at steadystate undernon-choked condi-tions, when sublimation occurred at 0°C or − 15°C using a chamber pressure of 100 mTorr (Table II, runs 1–3), during minimum controllable pressuretestingunderchoked (Table II, run 4), and during choke point testing (Table II, run Table II. Comparison of Gravimetric and TDLASWeight Losses During Ice-Slab Experiments Run # Choked or non-choked low Gravimetric weight loss (g) TDLASweight loss (g) TDLAS error (%) 1 Non-choked 820 865 5.5 2 Non-choked 5380 5143 − 4.4 3 Non-choked 2200 2290 4.1 4 Choked 2820 2930 3.9 5 Choked 2800 2840 1.4 5). The TDLAS results were within 5.5% of the gravimetric results, indicating the accuracy of the TDLAS as anin-process lowmeter.Alsoworth noting is that the resolution of thetoploaderbalancethat was usedforthegravimetric weights is 10 g which introduces a source of uncertainty with the gravimetric weights. Our results are consistent with those reported by Patel and coworkers (7)who determined that the accuracy of TDLAS was unaffected by whether ow was choked or not. CONCLUSION The equipment capability curve of a LyoStar III freeze-dryer was measured using two test methods: (a) minimum controllable pressure and (b) choke point. The results obtained using both methods were equivalent. However, the minimum controllable pressure method required less time to conduct the testing and hence is the recommendedmethod by the authors. ACKNOWLEDGMENTS The authors wouldliketo thank William J. Kessler, Physical Sciences Inc., for his technical support. Open Access This article is licensed under a Creative Commons Attribution 4.0 International License, which per-mits use, sharing, adaptation, distribution and reproduction in any medium or format, as long as you give appropriate credit to the original author(s) and the source, provide a link to the Creative Commons licence, and indicate if changes were made. The images or other third party material in this article are included in the article'sCreativeCommons licence, unless indicated otherwise in a credit line to thematerial. Ifmaterial is not included in the article's Creative Commons licence and your intended use is not permitted by statutory regulation or exceeds the permitted use, youwill need to obtain permission directly from the copyright holder. To view a copy of this licence, visit http://creativecommons.org/licenses/by/4.0/. REFERENCES 1. Nail SL, Searles JA. Elements of quality by design in develop-mentand scale-up offreeze-dried parenterals. BioPharm Int.2008;21(1):44–52. 2. Mockus LN, Paul TW, Pease NA, Harper NJ, Basu PK, Oslos EA, et al. Quality by design in formulation and process development for a freeze-dried, small molecule parenteral product: a case study. PharmDev Technol. 2011;16(6):549–76. 3. Searles J.Observation and implications of sonicwater vapor low during freeze-drying. Am PharmRev. 2004;7:58–69. 4. Gieseler H, Kessler WJ, Finson M, Davis SJ, Mulhall PA, Bons V, et al. Evaluation of tunable diode laser absorption spectros-copy for in-process water vapor mass lux measurements during freeze drying. J Pharm Sci. 2007;96(7):1776–93. 5. Anderson Jr JD. Fundamentals of aerodynamics. Tata McGraw-Hill Education; 2010. 6. Kshirsagar V, Tchessalov S, Kanka F, Hiebert D, Alexeenko A. Determining maximum sublimation rate for a production lyoph-ilizer: computationalmodeling and comparisonwith ice slab tests. J Pharm Sci. 2019;108(1):382–90. 7. Patel SM, Chaudhuri S, Pikal MJ. Choked low and importance of Mach I in freeze-drying process design. Chem Eng Sci.2010;65(21):5716–27. Publisher’sNote SpringerNature remains neutralwith regard tojurisdictional claims in published maps and institutional afiliations.
确定


还剩4页未读,是否继续阅读?

产品配置单


德祥科技有限公司为您提供《冻干机设备性能的测量:两种方法的比较》,该方案主要用于其他中-检测,参考标准--,《冻干机设备性能的测量:两种方法的比较》用到的仪器有Biopharma Technology冻干显微镜LyoStat5、Genevac自动化溶剂蒸发工作站EZ-2 4.0 Bionic、Biopharma Micropress冻干饼强度测试仪、SP台式冻干机Virtis AdVantage Pro、SP冷冻干燥机Genesis Pilot Lyophilizers
相关方案
更多
该厂商其他方案
更多