


方案详情
文
TDLAS在冻干领域可测定和监测如下数据信息:
- 升华界面的产品温度;
- 样品瓶底部中心的产品温度;
- 产品的干燥阻力;
- 残留的水分;
- 主干燥和次级干燥终点;
- 样品瓶热传递系数;
- 连续监测冰层及干燥层厚度;
- 冻干设备气流不受阻的最大升华能力;
方案详情

This technical brief provides an overview of Tunable Diode Laser Absorption Spectroscopy (TDLAS) and its application for monitoring freeze drying processes. Through the combination of TDLASmeasurements and a well-established heat and mass transfer model describing freeze drying, users can obtain information about Key Process Parameters (KPPs) affecting end product quality. The Physical Sciences Inc. (PSI) TDLAS based sensor, LyoFlux, measures water vapor concentration and gas flow velocity in the spool connecting a freeze-dryer chamber and condenser. The near-IR spectrometer provides real-time measurements of water concentration and gas flow velocity that are used to determine the water mass flux (grams/second/cm2) in the spool. The flux measurements are combined with knowledge of the spool cross sectional area to provide a determination of the water vapor flow (grams/second) exiting the product drying chamber.1The flow measurements are integrated during the product drying cycle to provide a determination of the total water removed (grams). The sensor control electronics and near-IR light source are designed to be remotely located from the sensor head. Communication between the sensor control unit (SCU) and the optical measurement interface is achieved using fiber optic and electronic signal cabling. The sensor hardware and software are designed for automatic sensor operation on power-up, providing continuous measurements with limited user interaction. The monitor is designed for 24/7 operation using robust telecommunications-grade optics and periodic system health monitoring to ensure accurate flow rate measurements.Technical Note: Application of TDLAS to Monitoring Pharmaceutical LyophilizationAuthored by William J. Kessler, Physical Sciences Inc. Technical Note: Application of TDLAS to Monitoring Pharmaceutical Lyophilization Application of Tunable Diode Laser Absorption Spectroscopy(TDLAS) to Monitoring Pharmaceutical Lyophilization Author: William J. Kessler, Physical Sciences Inc. Introduction This technical brief provides an overview of Tunable Diode Laser Absorption Spectroscopy(TDLAS) and its application for monitoring freeze drying processes. Through the combination of TDLAS measurements and a well-established heat and mass transfer model describing freeze drying, users can obtain information about Key Process Parameters (KPPs) affecting end product quality. The Physical Sciences Inc. (PSI) TDLAS based sensor, LyoFlux, measures water vapor concentration and gas flow velocity in the spool connecting a freeze-dryer chamber and condenser. The near-IR spectrometer provides real-time measurements of water concentration and gas flow velocity that are used to determine the water mass flux (grams/second/cm2) in the spool. The flux measurements are combined with knowledge of the spool cross sectional area to provide a determination of the water vapor flow(grams/second) exiting the product drying chamber.1 The flow measurements are integrated during the product drying cycle to provide a determination of the total water removed (grams). The sensor control electronics and near-IR light source are designed to be remotely located from the sensor head. Communication between the sensor control unit (SCU) and the optical measurement interface is achieved using fiber optic and electronic signal cabling. The sensor hardware and software are designed for automatic sensor operation on power-up, providing continuous measurements with limited user interaction. The monitor is designed for 24/7 operation using robust telecommunications-grade optics and periodic system health monitoring to ensure accurate flow rate measurements. Measurement Physics TDLAS sensors rely on well-known spectroscopic principles and sensitive detection techniques to continuously measure trace concentrations of selected gases. The TDLAS sensor is based upon the attenuation of the laser beam as it propagates through an absorbing medium. The absorption feature of the gaseous constituent of interest is described by Beer's Law Eq. (1): where Io,υis the initial laser intensity, Iυis the intensity recorded after traversing a path length, L across the measurement volume, S (T) is the temperature dependent absorption line strength, g (υ-υo) is the spectral line shape function (which integrates to a value of 1), and N is the number density of the target absorber. The temperature dependence of the line strength, S, arises from the Boltzmann thermal population statistics of the quantum state of the absorber being probed. The quantity in the brackets is known as the optical absorbance and is a measure of the pure signal strength in terms of fractional change in the transmitted intensity. The product of the line strength and line shape function is the optical absorption cross-section. Equation (1) can be rearranged and integrated to provide a solution for determining the solvent number density, N, in molecules cm-3 or grams cm-3, which is used to determine the mass flow rate of the gas. Determination of mass flow requires the measurement of the gas flow velocity in the measurement volume. The velocity measurement concept is based upon Doppler shifted absorption measurements as schematically shown in Figure 1. The velocity is determined from the Doppler-shifted absorption spectrum of water vapor resulting from the laser propagation vector, k, directed at a known angle, , to the gas flow velocity vector, u. The absorption spectrum is shifted in wavelength or frequency with respect to the absorption wavelength of a static gas sample by an amount related to the velocity of the gas, u, and the angle between u and the probe laser beam propagation vector, k. Using two line-of-sight measurements across the spool the frequency shift is measured with one measurement path compared to the second path within the spool and described by (Eq. (2)): where u is the velocity (cm/sec), c is the speed of light (3 1010 cm/second), Δυ is the peak absorption shift from its zero velocity frequency (or wavelength) in cm-1, υ0 is the absorption peak frequency, cm-1, (or wavelength) at zero flow velocity and θ is the angle formed between the laser propagation across the flow and the gas flow vector. The instantaneous mass flow (dm/dt, grams/second) is determined using Eq. (3) where dm/dt is calculated from the product of the measured number density (N, grams cm-3), the gas flow velocity (u, cm/second), the cross-sectional area of the flow duct (A, cm2) and a number of unit conversion factors: The total amount of water removed (grams) is determined by integrating the instantaneous measurements over the time of the sublimation run. Relative Frequency [cm] K-5994 Figure 1. Illustration of the concept of velocity measurement in the freeze dryer spool (left) and resulting Doppler shifted absorption spectrum (right). Figure 2 shows a photograph of the TDLAS optical spool mounted in an SP Scientific Lyostar 3freeze dryer. The dual line of sight measurement configuration provides velocity measurement sensitivity of better than 1 m/s and mass flow determination sensitivity of better than 1x10⁻⁴ grams/s. SP SCIENTIFIC Authored by William J. Kessler, Physical Sciences Inc. L-1343 Figure 2. Schematic diagram of the dual line of sight measurement configuration and a photogram of the optical spool installed in an SP Scientific Lyostar 3 freeze dryer. Measurement Applications Primary and Secondary Drying Endpoints Figure 3 shows representative TDLAS water concentration measurements and mass flow determinations during the drying of a 5% lactose formulation in vials in a Lyostar 2 freeze dryer. The spikes in the data traces are due to pressure rise measurements that were undertaken throughout the drying cycle. The product shelf temperature was adjusted through four different set points throughout primary drying resulting in the step changes observed in the red mass flow data trace. The drop in the mass flow rate prior to the end of primary drying was due to the buildup of dry layer resistance with increasing dry cake thickness. Both the water concentration and mass flow rate data traces clearly indicate the primary and secondary drying endpoints. Mass Flux Temporal Profile Figure 3. Example TDLAS water vapor concentration measurements and mass flow determination temporal traces during the drying of 5% lactose formulation in vials in a Lyostar 2 freeze dryer. Product Temperature Determinations During lyophilization product temperature history is the most important characteristic of the pharmaceutical product, but its measurement has been problematic. The standard laboratory methodology has involved placing temperature sensors, usually thermocouples, directly in a few selected vials of product. Placing the thermocouple in the product causes bias in freezing behavior which translates into differences in product temperature and drying time. Product temperature during drying directly affects product quality, thus, the development of a widely applicable, robust measurement solution is an important industry goal, and temperature measurements during a process abnormality may prevent the loss of product. The Manometric Temperature Measurement (MTM) pressure rise technique has been used to provide batch average product temperature during the first two-thirds of primary drying, when essentially all vials in the batch are in primary drying as demanded by the theory for pressure rise. Due to the requirement of a quick-closing isolation valve, this technique is generally only applied to laboratory scale lyophilizers and does not provide a solution for production scale temperature monitoring. In contrast, the TDLAS based measurement technique may provide the needed measurement capability for all dryers. It has been demonstrated that TDLAS based mass flow rate measurements (dm/dt) may be combined with a steady state heat and mass transfer model2,3 to provide continuous, real-time determinations of batch average product temperature in a laboratory scale dryer4. Heat transfer during vial based lyophilization can be described in terms of thermal barriers and temperature gradients. Heat is supplied to the frozen product from the drying chamber shelves through the bottom of the glass vials to compensate for the heat removed by sublimation. Heat flow from the shelves to the product is described by Eq. 4. where dQ/dt is the heat flow (cal/s or J/s) from the shelves to the product; Av is the cross sectional area of the vial calculated from the vial outer diameter; Kv is the vial heat transfer coefficient (for a specific vial type at a specific pressure); Ts is the temperature of the shelf surface and Tb is the temperature of the frozen product at the bottom center of the vial. In steady state, the heat flow (dQ/dt) can be related to mass flow (dm/dt) by using the heat of ice sublimation, ΔHs (Eq. 5): where ΔHS is (650 cal/g). Equations 4 and 5 can be combined to and rearranged to provide the product temperature in the bottom of the vial shown in Eq. 6: In the laboratory, the vial heat transfer coefficient, Kv, can be separately determined using Eq. 7 and by performing sublimation tests with pure water filled into vials instead of product. Here, the average temperature difference, (Ts - Tb), can be determined using thermocouples in selected vials (bottom center) as well as adhesive thermocouples on the shelf surface during the experiments. Note that in the laboratory, temperature bias between vials containing thermocouples and vials not containing thermocouples are observed to be small, likely due to particulate contamination in the product fluid used to fill the vials and is also not important for the determination of Kv. Av is easily determined by measurement. Mass flow can be determined either gravimetrically from the known initial mass of water and the remaining mass of water after a predefined time interval in primary drying4 or by the TDLAS sensor for a batch average measurement4,5. Increasing chamber pressure results in larger Kv values as the contribution from gas conduction to the vial heat transfer coefficient dominates over the shelf conduction and radiative heat transfer contributions. Following the determination of the batch average vial heat transfer coefficient dm/dt measurements were combined with thermocouple based shelf temperature measurements, the vial cross sectional area and the water heat of sublimation to determine the batch average product temperature using Eq. 6.4 The TDLAS determined bottom center temperature was compared to thermocouple based product temperature measurements to assess the accuracy of the measurement technique. Results of the 10% glycine drying primary drying experiment shown in Figure 5. Figure 5. Preliminary feasibility demonstration of TDLAS-based batch average product temperature determinations. The plot shows a clear difference between the center vial and edge vial thermocouple based temperature measurements, with the edge vial product temperatures higher than the center vials due to radiative heat loading from the warm dryer walls and door. The TDLAS determined batch average product temperature is initially biased to the center vial thermocouple based measurements during early primary drying, as expected since initially there are many more “center vials” than “edge vials” in primary drying, and then providing an average determination between edge and center vials in the later stages of primary drying. In addition to the TDLAS and thermocouple temperature measurements, the batch average product temperature was also determined using the MTM technique. The MTM and TDLAS techniques agree during the first half of primary drying before the MTM measurement techniques fails due to many vials having completed primary drying. Additional analysis enables the determination of the product temperature at the sublimation interface, Tp6. In addition to the determination of process endpoints and product temperatures, additional applications of the LyoFlux TDLAS sensor include assessing the freeze dryer equipment capability limits, Technical Note: Application of TDLAS to Monitoring Pharmaceutical Lyophilization Authored by William J. Kessler, Physical Sciences Inc. monitoring process and product parameters and for developing drying cycles based upon Quality by Design procedures. A summary of demonstrated applications to freeze drying include: Measurement of water vapor concentration and gas flow velocity to enable continuous determination of water vapor mass flow rate1 Determination of primary and secondary drying endpoints1 Determination of equipment capability: choked flow determinations7 QbD based freeze drying cycle development7,8 Determination of vial heat transfer coefficients4,5 Continuous determination of batch average product temperature during primary drying4 Continuous determination of product dry layer thickness Continuous determination of product resistance to drying 9,10 Assessment of drying heterogeneity: prediction of the number of vials completing primary drying9 Real-time tracking of product residual moisture content during secondary drying11 In summary, the LyoFlux TDLAS based sensor provides a unique measurement capability that provides autonomous and continuous water vapor mass flow determinations throughout the freeze drying process. Water vapor mass flow rate determinations can be combined with heat and mass transfer models of freeze drying to provide additional insight into the drying process and determinations of critical parameters, such as product temperature, that affect final dried product quality. LyoFlux is applicable to laboratory, pilot and production scale freeze dryers, enabling use of this PAT tool for process scale-up and process control. References 1. Gieseler, H., Kessler, W. J., Finson, M. F. et al., “Evaluation of tunable diode laser absorption spectroscopy for in-process water vapor mass flux measurements during freeze-drying,” J. Pharm. Sci. 96(7):1776-93, 2007. 2. Pikal, M. J., “Use of laboratory data in freeze drying process design: Heat and mass transfer coefficients and the computer simulation of freeze drying,” J Parent Sci Technol 39:115-138, 1985. 3. Milton, N., Pikal, M. J., Roy, M.L., Nail, S.L., “Evaluation of manometric temperature measurement as a method of monitoring product temperature during lyophilization,” PDA Jour Pharm Sci Tech 51:7-16, 1997. 4. Schneid, S. C., Gieseler, H., Kessler, W. J., Pikal, M. J.,“Non-invasive product temperature determination during primary drying using tunable diode laser absorption spectroscopy,” J. Pharm. Sc. 98(9):3401-3418,2009. 5. Kuu, W. Y., Nail, S. L., Sacha, G., ‘Rapid determination of vial heat transfer parameters using Tunable Diode Laser Absorption Spectroscopy (TDLAS) in response to step-changes in pressure set-point during freeze-drying,” J. Pharm. Sci. 98 (3):1136–1154, 2009. 6. Tang, X., Nail,, S.L., and Pikal, M.J., “Freeze-Drying Process Design by Manometric Temperture Measurement: Design of a Smart Freeze-Dryer,” Pharm Res 22(4), 2005. 7. Patel, S., Chaudhuri, S., Pikal, M.J., “Choked flow and importance of Mach I in freeze-drying process design”, Chem Eng Sci 65: 5716-5727, 2010. 8. Nail SL, Searles JA, “Elements of quality by design in development and scale-up of freeze-dried parenterals”, Biopharm International 21(1):44-52, 2008 9. Sharma, P., “Non-Invasive In-Line Monitoring of Product Temperature During Lyophilization Using Tunable Diode Laser Absorption pectroscopy (TDLAS)”, 11th Pep Talk Protein Science Week, Jan.12, 2012, San Diego, CA. 10. Kuu, W., O’Bryan, K.R., Hardwick, L.M., Paul, T.W., “Product mass transfer resistance directly determined during freeze-drying cycle runs using tunable diode laser absorption spectroscopy (TDLAS) and pore diffusion model”, Pharm Dev Technol, 16(4) 343-57, 2011. 11. Unpublished work.
确定


还剩4页未读,是否继续阅读?

产品配置单


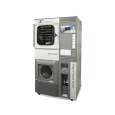

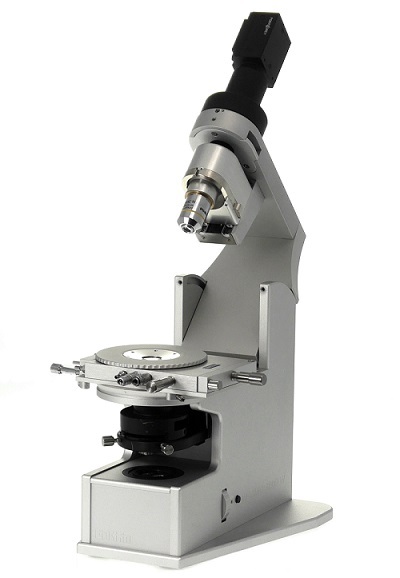
德祥科技有限公司为您提供《可调谐二极管激光吸收光谱(TDLAS)在药物冻干过程监测中的应用》,该方案主要用于其他中TDLAS检测,参考标准--,《可调谐二极管激光吸收光谱(TDLAS)在药物冻干过程监测中的应用》用到的仪器有Biopharma Technology冻干显微镜LyoStat5、Biopharma Micropress冻干饼强度测试仪、SP Hull LyoStar 4.0冻干机、美国SP Scientific冻干机、SP台式冻干机Virtis AdVantage Pro
相关方案
更多
该厂商其他方案
更多