


方案详情
文
利用特定分析来验证红辣椒粉的地理来源THE USE OF TARGETED ANALYSIS TO VERIFY THE GEOGRAPHICAL ORIGIN OF GROUND PAPRIKA
方案详情

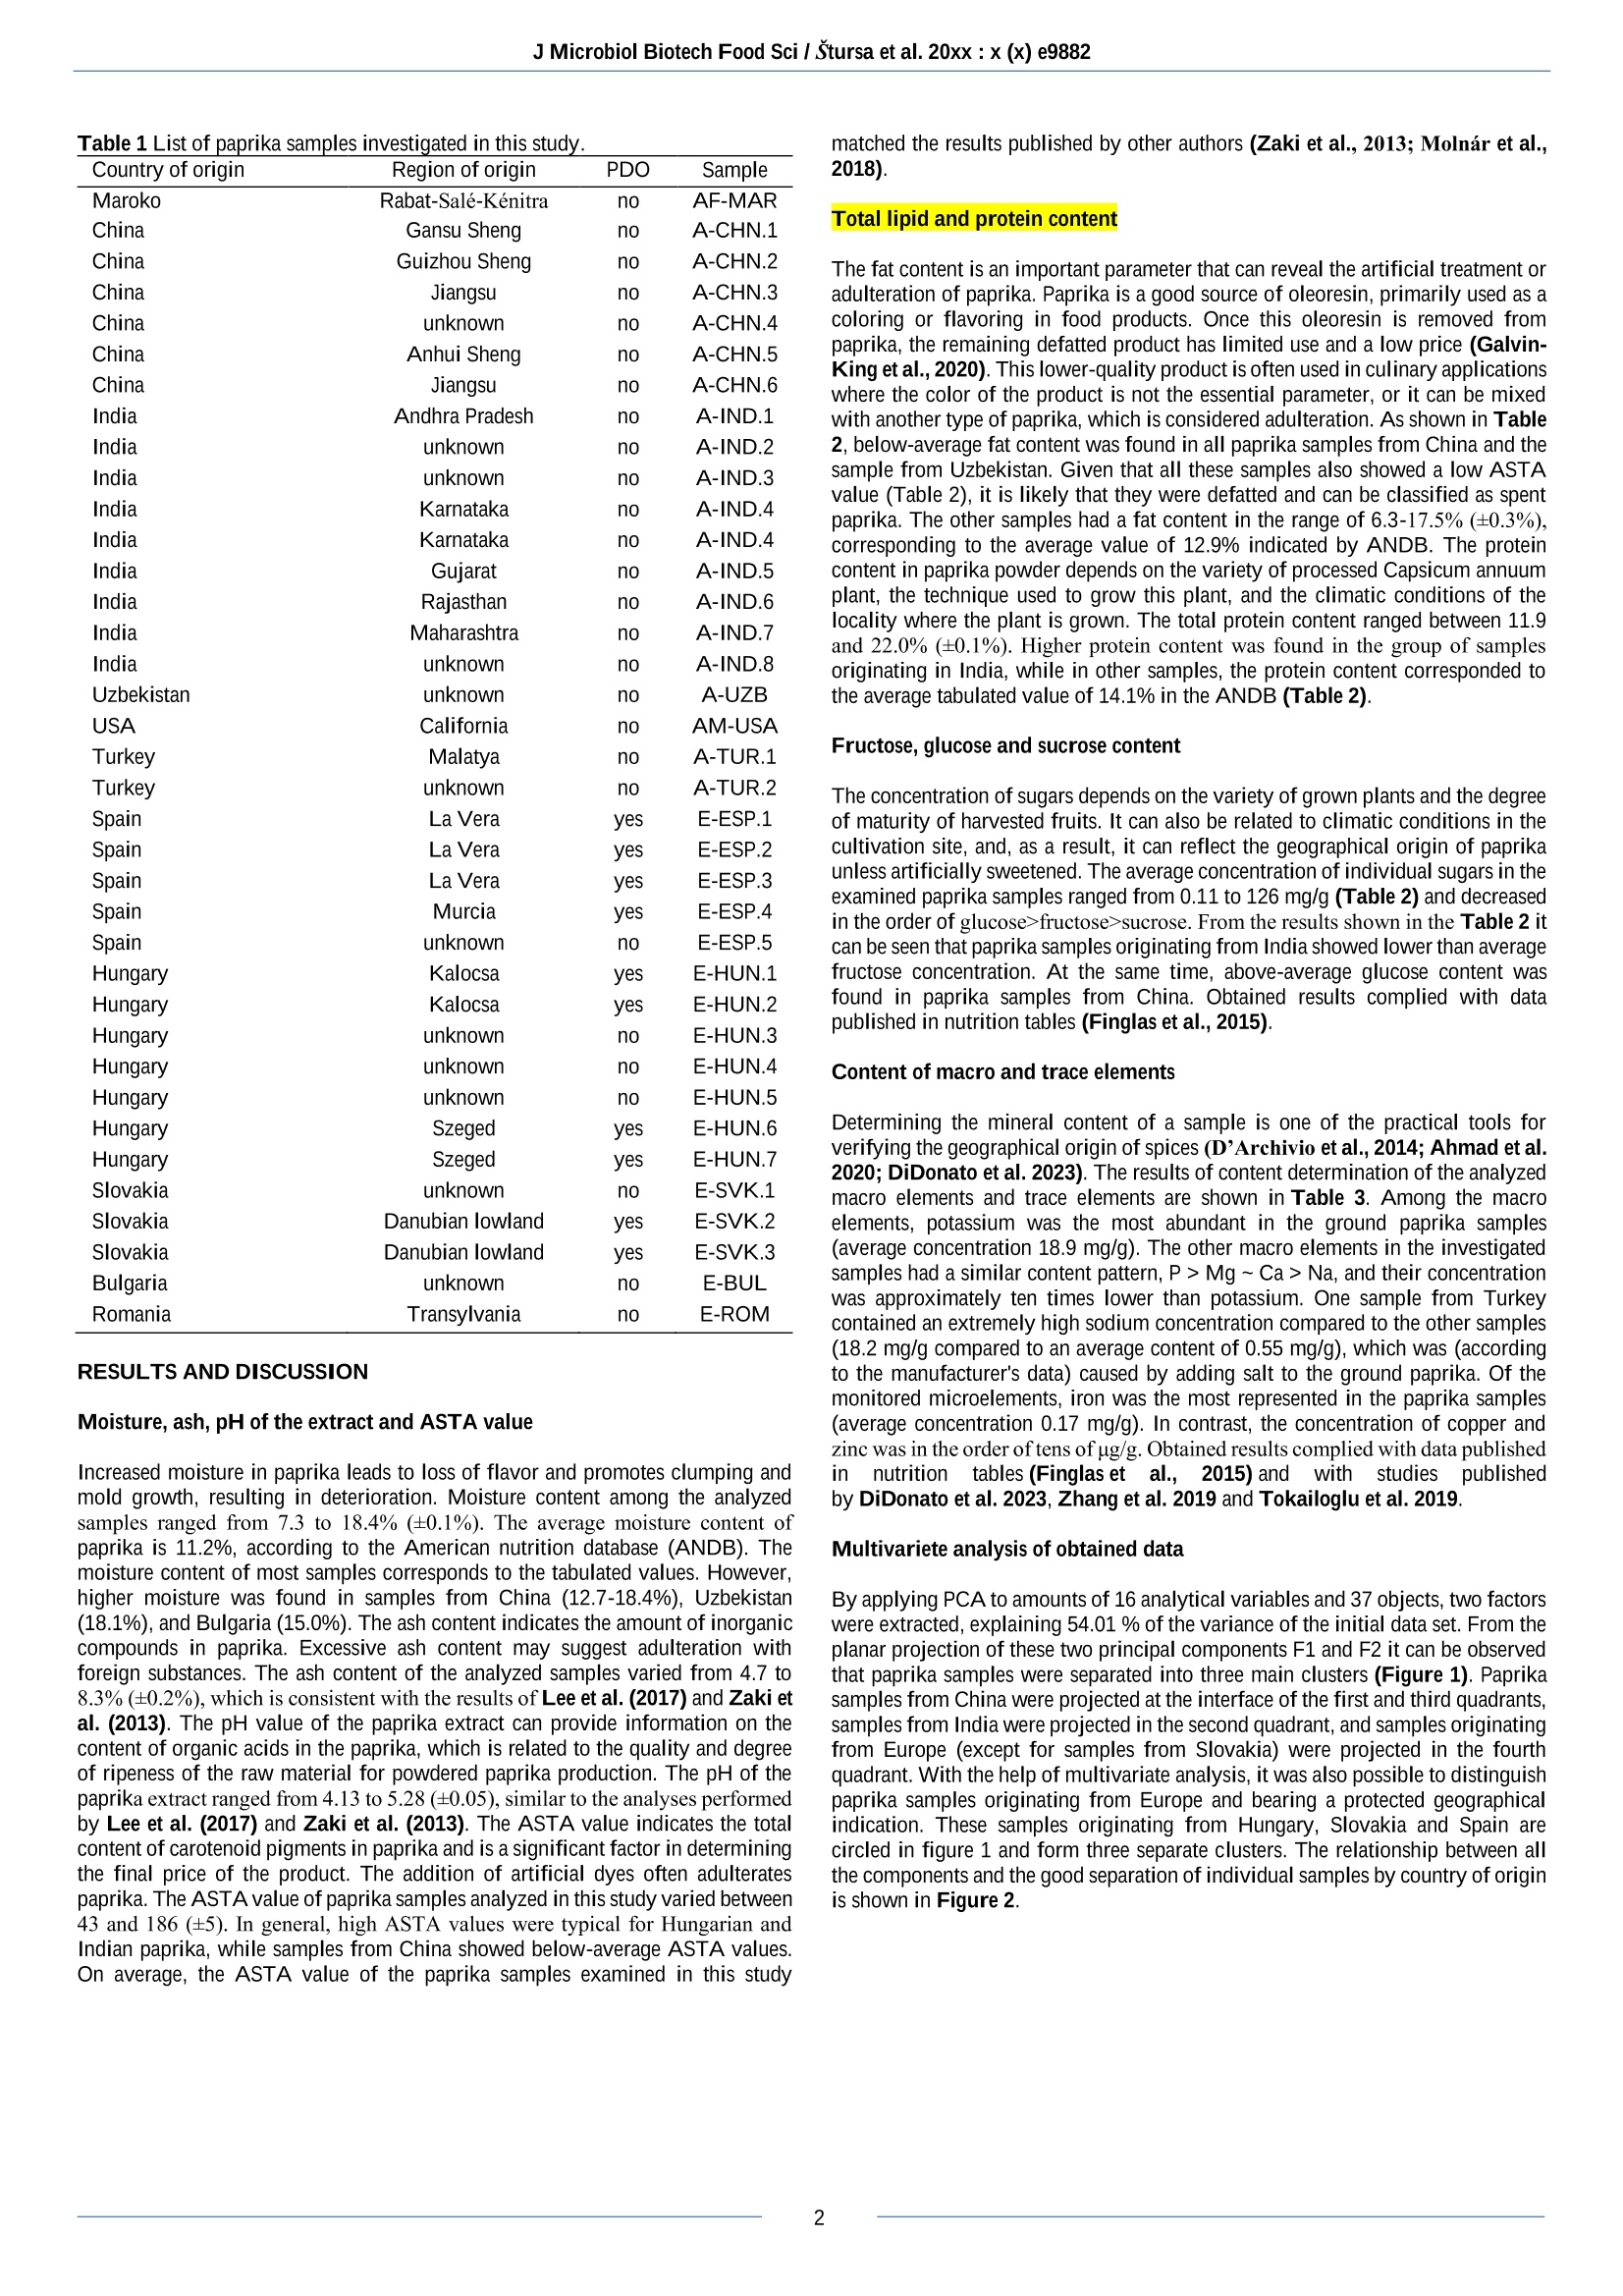
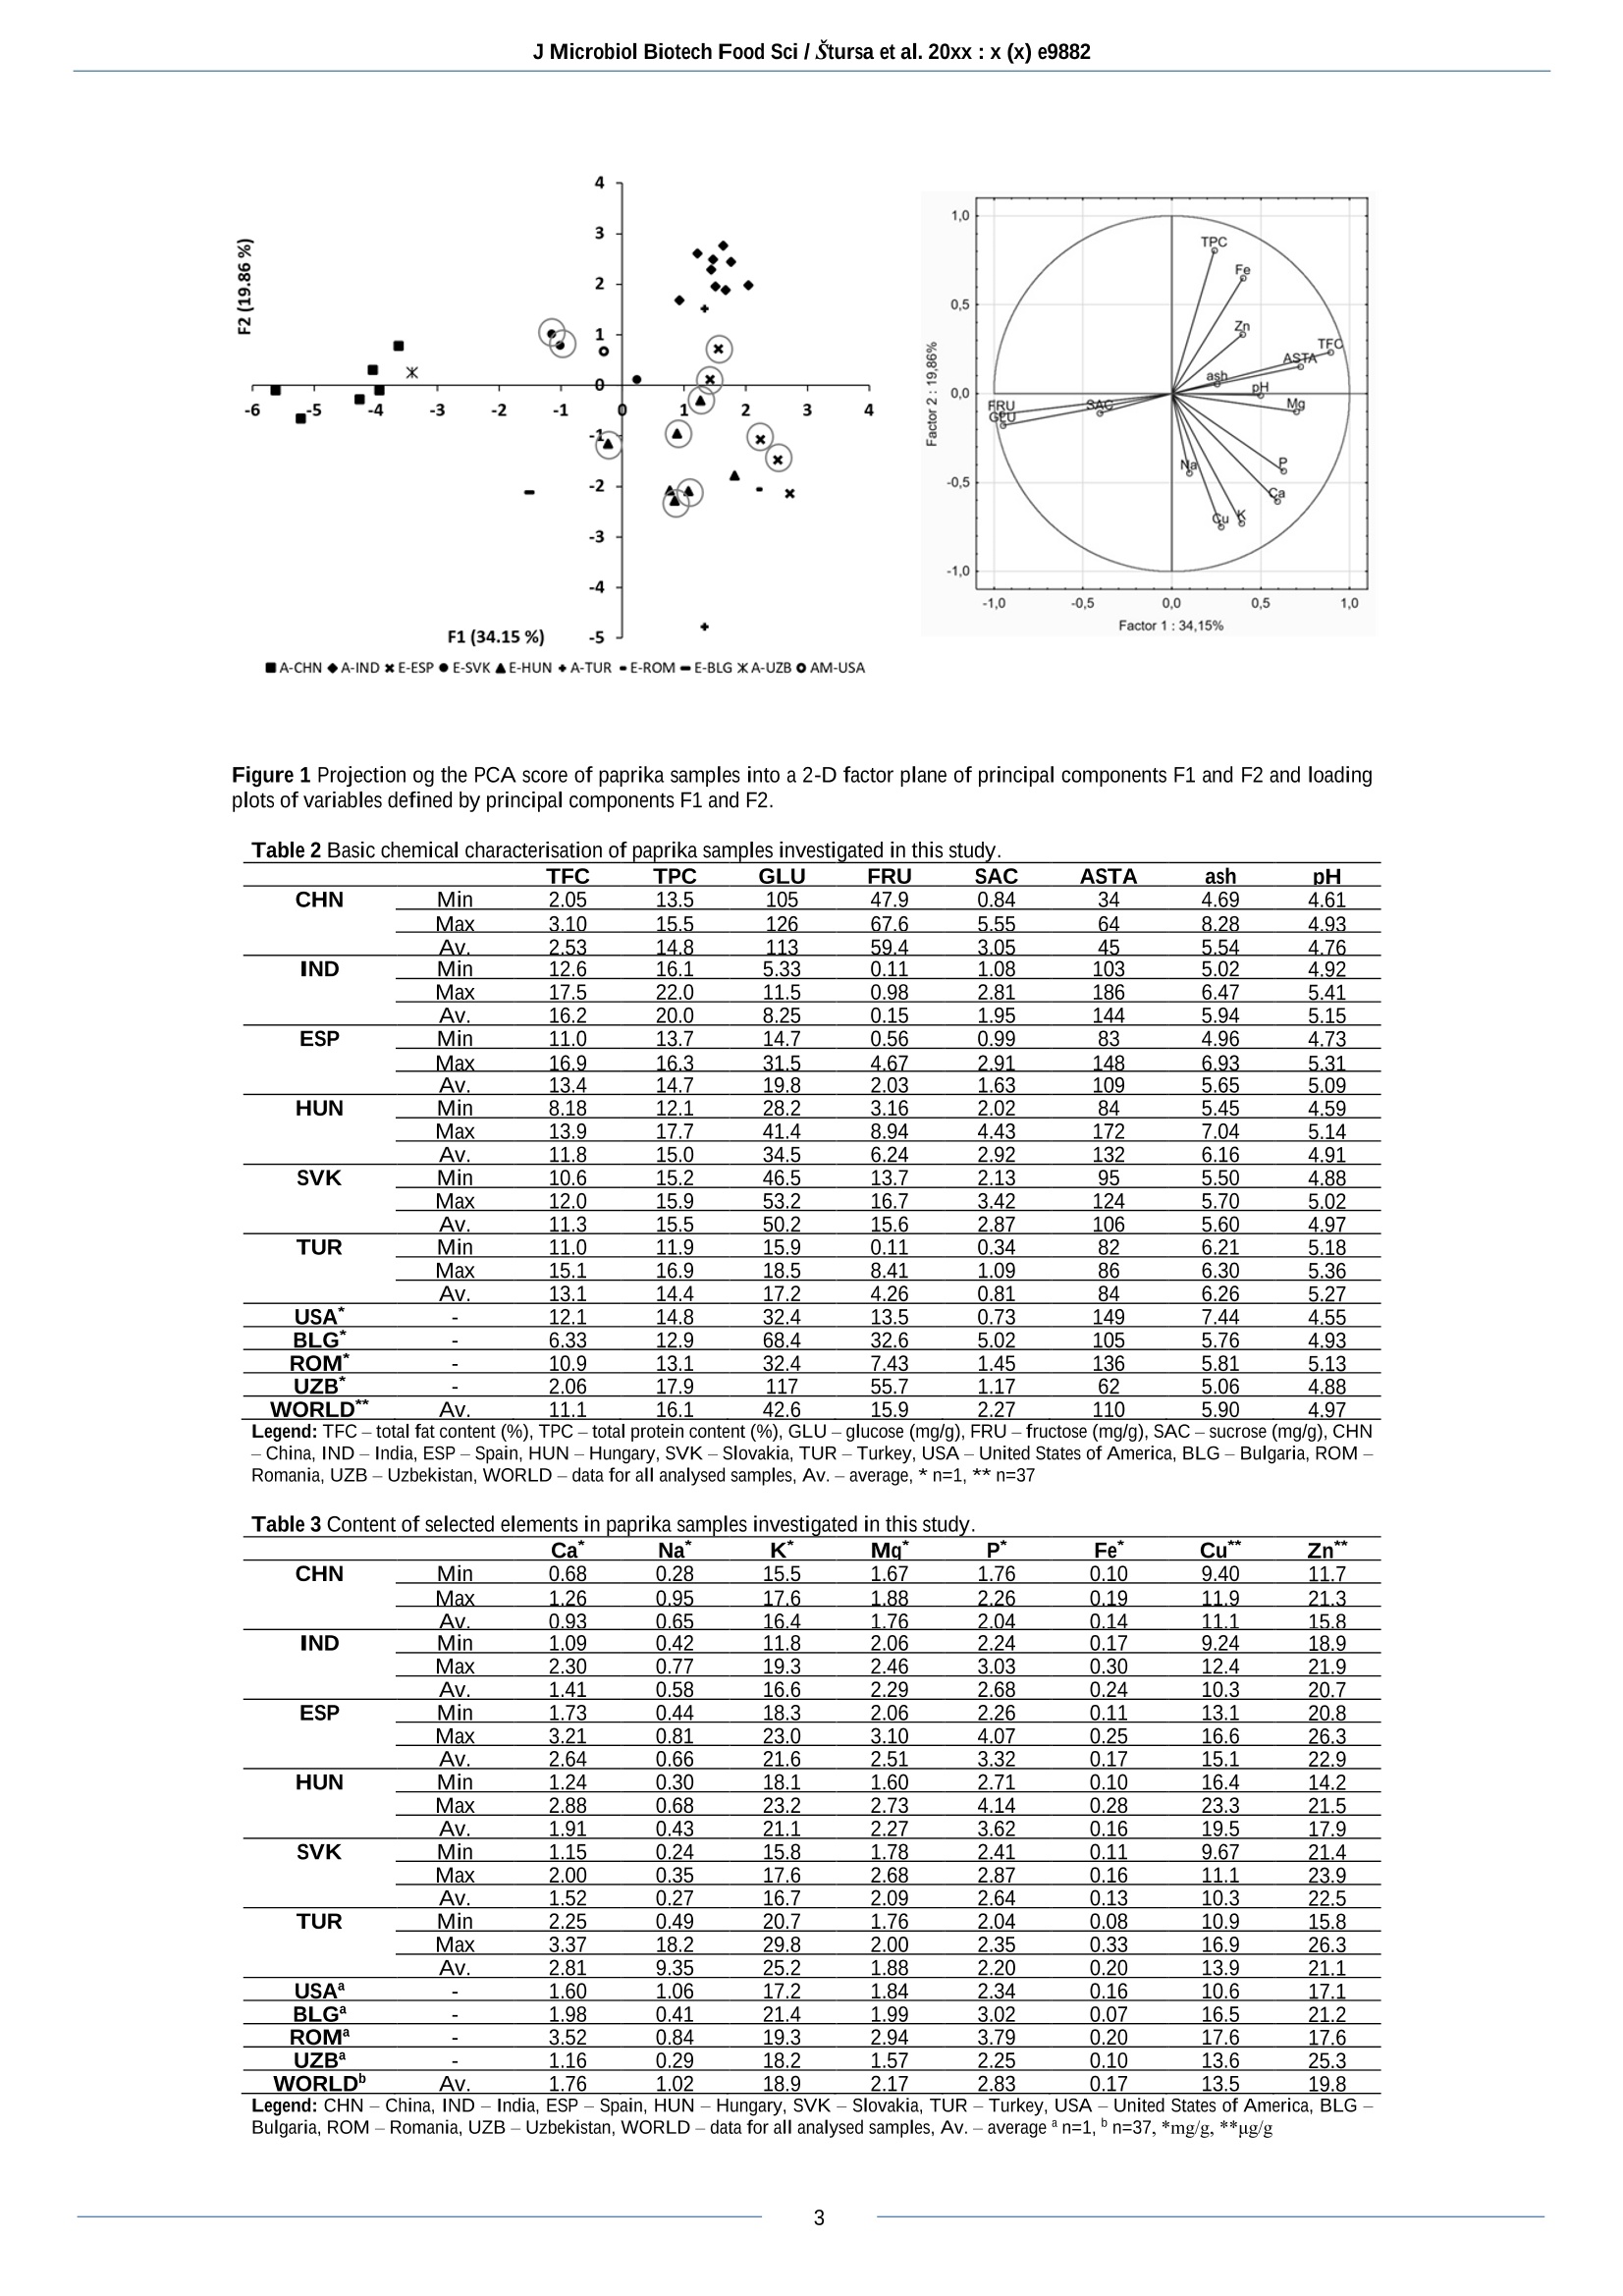
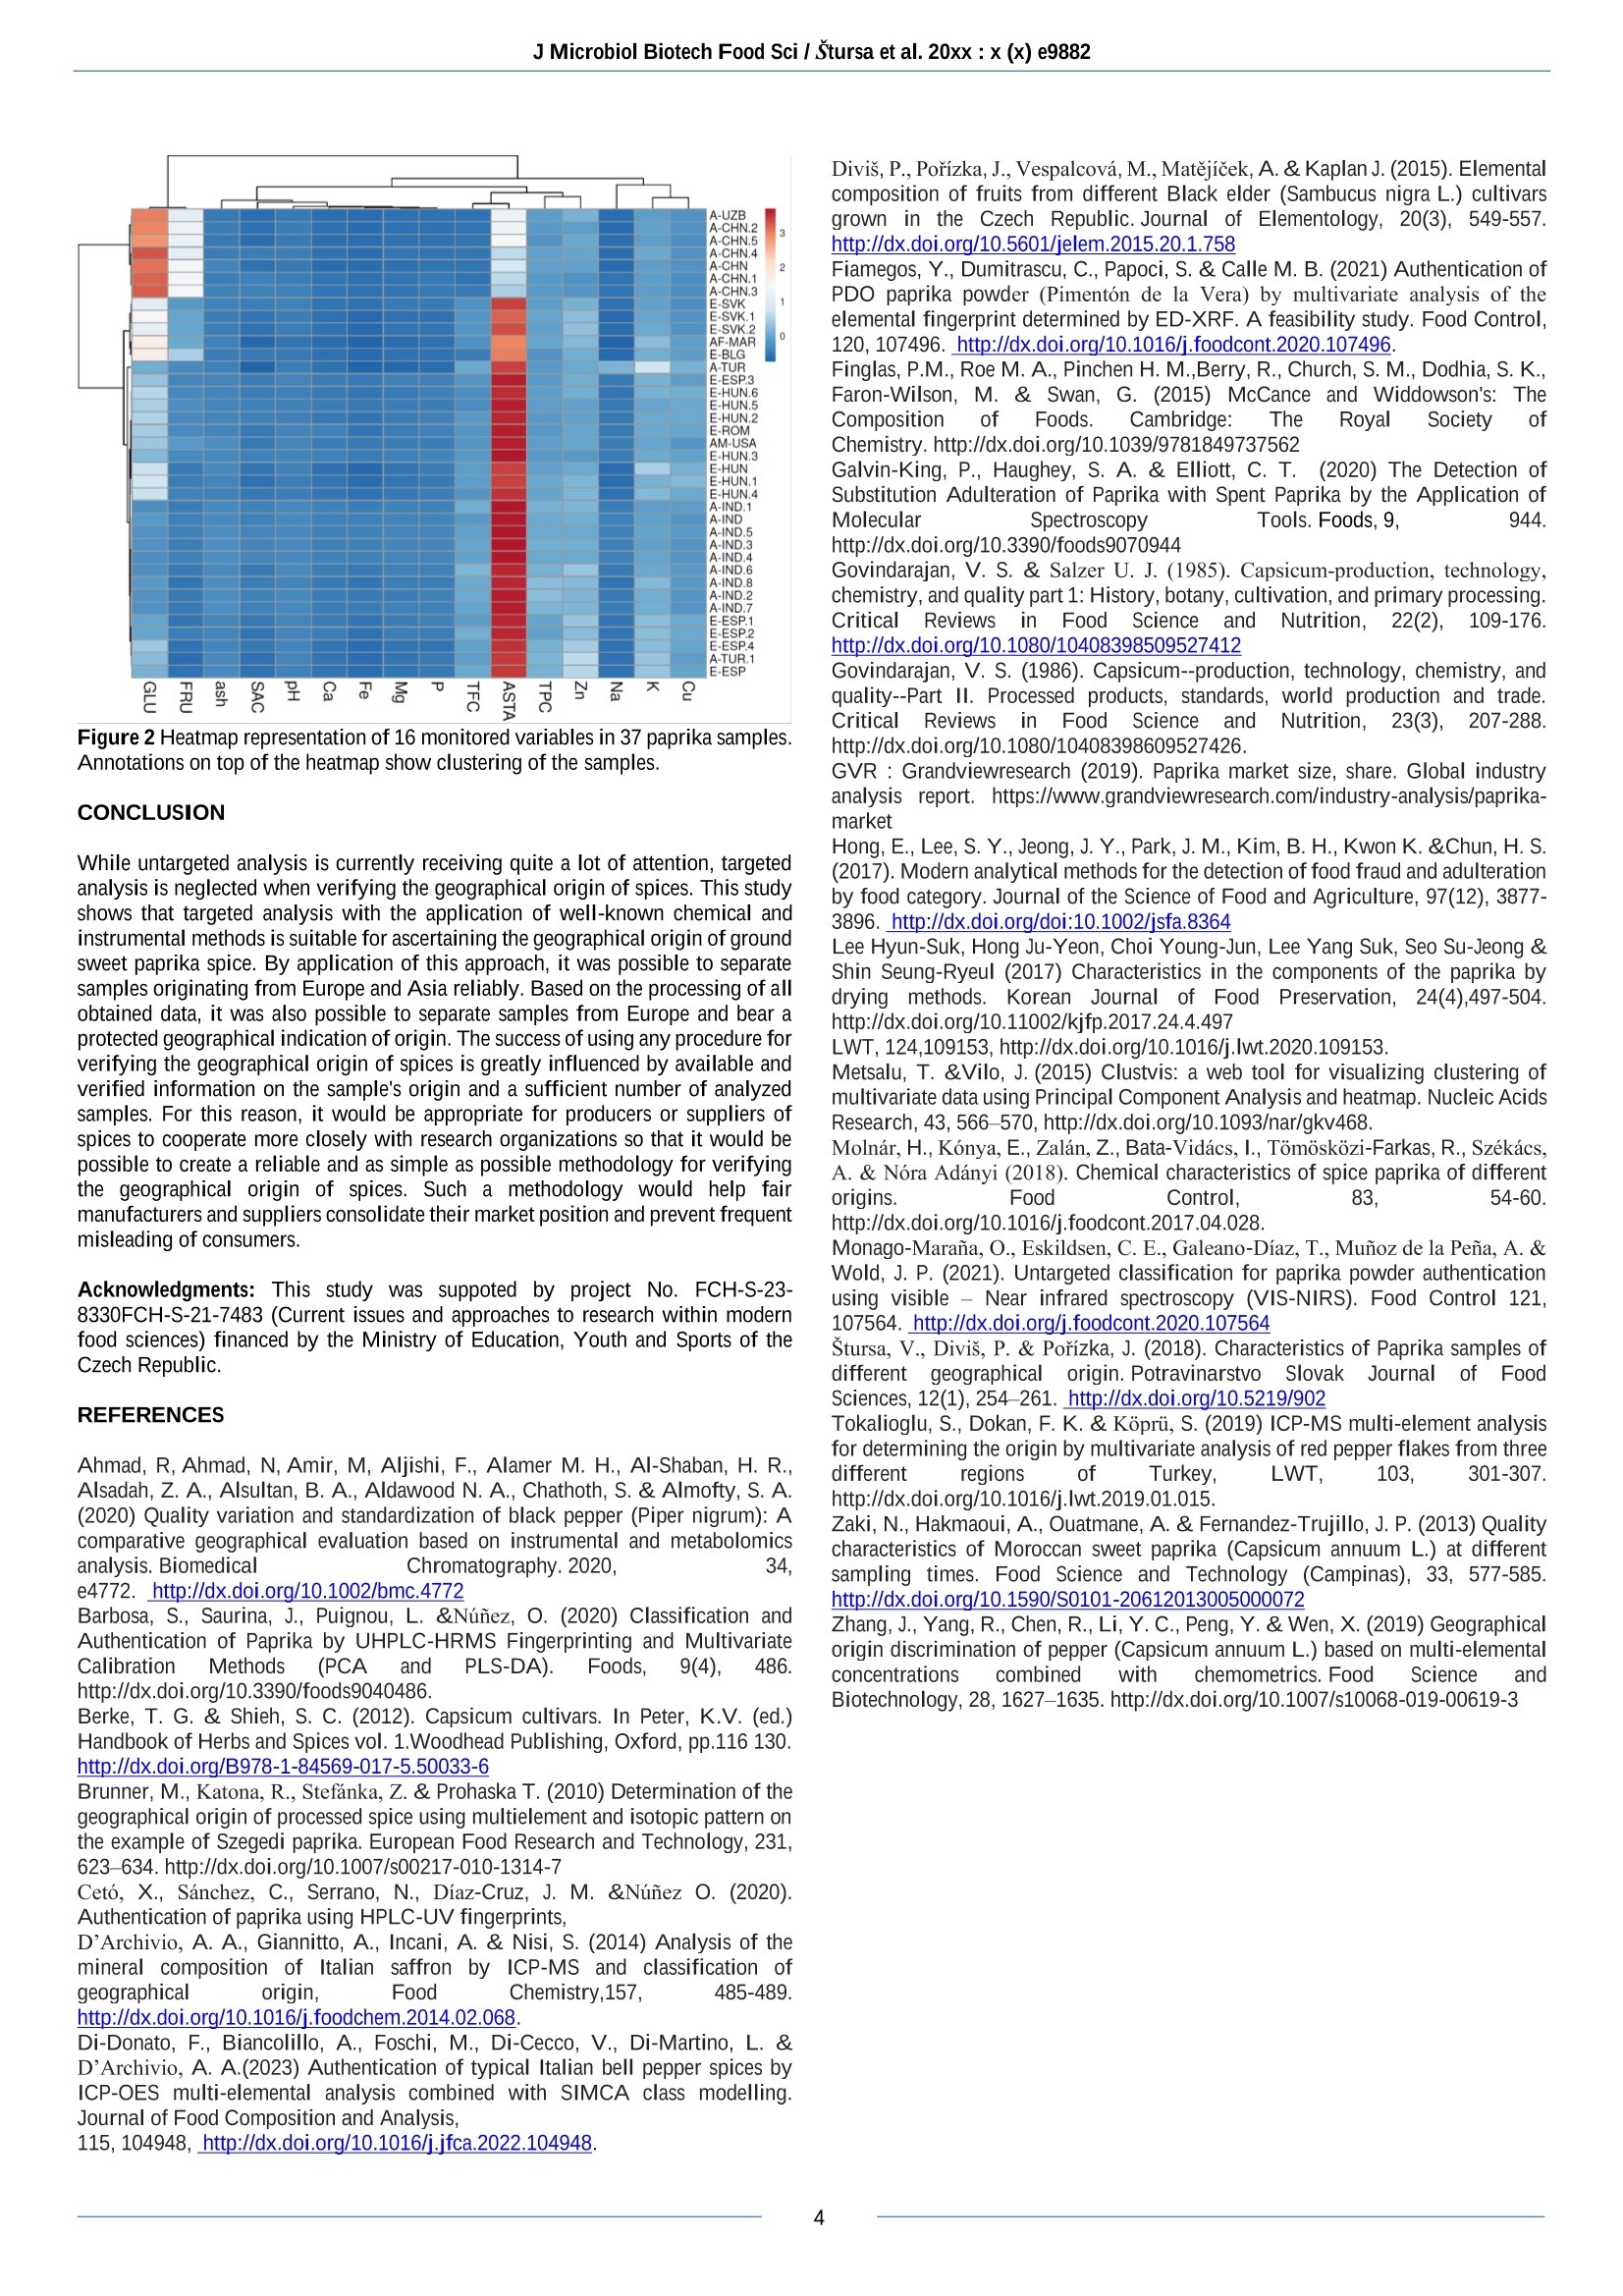
利用特定分析来验证红辣椒粉的地理来源THE USE OF TARGETED ANALYSIS TO VERIFY THE GEOGRAPHICAL ORIGIN OF GROUND PAPRIKAJ Microbiol Biotech Food Sci / Štursa et al. 20xx : x (x) e9882 三 8- THE USE OF TARGETED ANALYSIS TO VERIFY THE GEOGRAPHICAL ORIGIN OF GROUND PAPRIKA 利用特定分析来验证红辣椒粉的地理来源 Václav Štursa1, Pavel Diviš*1and Jaromír Pořízka1 Address(es): 捷克布尔诺理工大学化学学院食品化学和生物技术系 1Brno University of Technology, Faculty of Chemistry, Department of Food Chemistry and Biotechnology, Purkyňova 118, 61200 Brno, Czech Republic *Corresponding author: divis@fch.vut.cz https://doi.org/10.55251/jmbfs.9882 ARTICLE INFO ABSTRACT Received 10. 2. 2023 This study investigated the use of targeted analysis to verify the geographic origin of ground paprika samples. In total, 36 samples were Revised 5. 5. 2023 analyzed from all over the world (17 from Europe, 17 from Asia, one from North America, and one from Africa). Deliberately chosen methods that use equipment commonly available in control laboratories were used for the analysis. The samples were examined for total Accepted 10. 5. 2023 fat content, total protein content, sugar concentration, the concentration of selected elements, ASTA coloring, ash content, and pH of the Published xx.xx.201x extract. The results were processed using multivariate analysis, which showed that, based on these investigated parameters, it is possible to differentiate ground paprika samples from different regions. In addition to being able to separate samples originating from Asia from Regular article those originating from Europe, it was also possible to distinguish samples from Europe with protected geographical indications, such as paprika from Hungary, Spain, and Slovakia. OPEN ACCESS Keywords: paprika, geographical origin, targeted analysis, authentication, spice INTRODUCTION In its basic form, paprika is made up of ground dried bell peppers (Capsicum annuum). The name 'paprika' comes from the Hungarian word 'paprika', which is derived from the Latin word 'piper'. However, the pepper is native to South America. After originating in America, paprika was brought to Spain in the 16th century, mainly for use as a decorative plant before it became a popular spice. The commerce in paprika spread from the Iberian Peninsula through Africa and Asia, eventually reaching Central Europe via the Ottoman-controlled Balkans (Govindarajan, 1986). Paprika has many uses in food processing, including as a food colorant, a source of pungency, flavor, and texture (Berke and Shieh, 2012). The world production of sweet paprika spice is about 200 thousand Mt annually. Although worldwide paprika production is relatively stable, the global paprika market grows yearly and was valued at USD 433 million in 2018 (Govindarajan and Salzer, 1985; GVR, 2019). High demand and a developed paprika trade are the main reasons that paprika is often an attractive target for adulteration. Food adulteration occurs mainly through changes in the food's composition or false information on the product's label (Hong et al., 2017). In the case of paprika, foreign substances such as brick dust, tomato skins, or synthetic dyes are mixed into the paprika powder to increase the weight or improve the product's basic properties. Mixtures of higher and lower-quality spices are also often marketed. Misleading the consumer by providing false information on the packaging is most often caused by incorrect indication of the origin of the paprika or misuse of the protected designation. In recent years, several studies have addressed verifying the geographical origin of paprika (Brunner et al., 2010; Monago-Marana et al. 2021; Fiamegos et al ., 2021; Barbosa et al ., 2020). However, specific methods that are not available in routine control laboratories, suchasisotoperatio inductively coupled plasma mass spectrometry or ultrahigh-performance liquid chromatography tandem mass spectrometry, have been developed to detect paprika adulteration.Ceto et al . (2020) used high-performance liquid chromatography with an ultraviolet detector for the non-targeted analysis of paprika samples and drew attention to the lack of low-cost analytical methods applicable to assess the authenticity of paprika. The aim of the present study is to verify whether targeted analysis of paprika using well-known chemical and readily available instrumental methods can be helpful in determining the geographical origin of paprika. MATERIAL AND METHODS Samples Paprika samples were purchased from the Czech sales network or delivered by Worlée NaturProdukte GmbH (Hamburg, Germany). A total of 37 samples from 10countrieswereanalyzedinthisstudy (Table1).Sampleprocessingfor individual chemical analysis is described in detail in the previous pilot study (Štursa et al., 2018). All samples were mineralized in a microwave oven in the presence of 5 ml of nitric acid and 2 ml of hydrogen peroxide prior to analysis on an optical emission spectrometer with inductively coupled plasma. Sample weight for microwave decomposition was 100 mg. To extract the sugars, 1 gram of the sample was stirred for 30 minutes with 10 ml of hot 50% ethanol solution. After pouring the extract into a volumetric flask, a repeated 30-minute extraction of the sample was performed with another 10 ml of hot 50% ethanol solution. Before analysis using instrumental techniques, the sample was filtered through a nylon syringe filter with a pore size of 0.45 µm. Chemical and instrumental analysis The following standardized methods were used for the analysis: ISO 7540:2020(total lipids content), ISO 1871:2009 (total proteins content), ISO 7541:2020(determination of the extractable colour), ISO 10523:2008, ISO763:2003 (ash content) and ISO 1842:1991 (determination of pH). Instruments used during this study includes: spectrophotometer Helios Gamma (Spectronic Unicam, USA), pH meter with combined SenTix electrode (WTW,Germany), Kjeldahl digester (Kjeldatherm, Gerhard, Germany), steem destilation apparatur (Vapodest, Gerhard, Germany), Soxhlet extractor (Soxtherm, Gerhard, Germany), microwave oven (Milestone 1200, Milestone, Italy), muffle furnace (LAC LE 0511, LAC, Czechrepublic)andhotairoven(MemmertUFE550, Memmert,Germany). Analysis of glucose, fructose and sucrose was performed on high performance chromatograph with evaporative light scattering detector (Agilent Infinity 1260, Agilent Technologies, USA) according to the method described in Štursa et al.(2018).Thismethoduses5µmhydrophilicpolymericgelparticleswithan aminopropyl functional groups as a stationary phase and a mixture of acetonitrile and water (75:25 volume ratio) as a mobile phase. The concentration of individual elements was determined using an optical emission spectrometer with inductively coupled plasma (Ultima 2, Horiba Scientific, France) according to the method described by Diviš et al. (2015). All analyzes were performed in triplicate. Mineral content, the content of glucose, fructose, sucrose, TLC and TPC were expressed as dry weight. Statistical analysis All experimental data were statistically processed using software XLstat (Addinsoft, USA). Principal component analysis was used to reduce the entire dataset to a small number of principal components and for visualization of data. The heat map and cluster analysis were created in the ClustVist application (Metsalu and Vilo, 2015). Table 1 List of paprika samples investigated in this study. Country of origin Region of origin PDO Sample Maroko Rabat-Salé-Kénitra no AFc-oMdeAR China Gansu Sheng no A-CHN.1 China Guizhou Sheng no A-CHN.2 China Jiangsu no A-CHN.3 China unknown no A-CHN.4 China Anhui Sheng no A-CHN.5 China Jiangsu no A-CHN.6 India Andhra Pradesh no A-IND.1 India unknown no A-IND.2 India unknown no A-IND.3 India Karnataka no A-IND.4 India Karnataka no A-IND.4 India Gujarat no A-IND.5 India Rajasthan no A-IND.6 India Maharashtra no A-IND.7 India unknown no A-IND.8 Uzbekistan unknown no A-UZB USA California no AM-USA Turkey Malatya no A-TUR.1 Turkey unknown no A-TUR.2 Spain La Vera yes E-ESP.1 Spain La Vera yes E-ESP.2 Spain La Vera yes E-ESP.3 Spain Murcia yes E-ESP.4 Spain unknown no E-ESP.5 Hungary Kalocsa yes E-HUN.1 Hungary Kalocsa yes E-HUN.2 Hungary unknown no E-HUN.3 Hungary unknown no E-HUN.4 Hungary unknown no E-HUN.5 Hungary Szeged yes E-HUN.6 Hungary Szeged yes E-HUN.7 Slovakia unknown no E-SVK.1 Slovakia Danubian lowland yes E-SVK.2 Slovakia Danubian lowland yes E-SVK.3 Bulgaria unknown no E-BUL Romania Transylvania no E-ROM RESULTS AND DISCUSSION Moisture, ash, pH of the extract and ASTA value Increased moisture in paprika leads to loss of flavor and promotes clumping and mold growth, resulting in deterioration. Moisture content among the analyzed samples ranged from 7.3 to 18.4% (±0.1%). The average moisture content of paprika is 11.2%, according to the American nutrition database (ANDB). The moisture content of most samples corresponds to the tabulated values. However, higher moisture was found in samples from China (12.7-18.4%), Uzbekistan (18.1%), and Bulgaria (15.0%). The ash content indicates the amount of inorganic compoundsin paprika.Excessive ashcontent maysuggestadulteration with foreign substances. The ash content of the analyzed samples varied from 4.7 to 8.3% (±0.2%), which is consistent with the results of Lee et al. (2017) and Zaki et al. (2013). The pH value of the paprika extract can provide information on the content of organic acids in the paprika, which is related to the quality and degree of ripeness of the raw material for powdered paprika production. The pH of the paprika extract ranged from 4.13 to 5.28 (±0.05), similar to the analyses performed by Lee et al. (2017) and Zaki et al. (2013). The ASTA value indicates the total content of carotenoid pigments in paprika and is a significant factor in determining the final price of the product. The addition of artificial dyes often adulterates paprika. The ASTA value of paprika samples analyzed in this study varied between 43 and 186 (±5). In general, high ASTA values were typical for Hungarian and Indian paprika, while samples from China showed below-average ASTA values. On average, the ASTA value of the paprika samples examined in this study matched the results published by other authors (Zaki et al., 2013; Molnár et al.,2018). Total lipid and protein content The fat content is an important parameter that can reveal the artificial treatment or adulteration of paprika. Paprika is a good source of oleoresin, primarily used as a coloring or flavoring in food products. Once this oleoresin is removed from paprika, the remaining defatted product has limited use and a low price (Galvin-King et al., 2020). This lower-quality product is often used in culinary applications where the color of the product is not the essential parameter, or it can be mixed with another type of paprika, which is considered adulteration. As shown in Table 2, below-average fat content was found in all paprika samples from China and the sample from Uzbekistan. Given that all these samples also showed a low ASTA value (Table 2), it is likely that they were defatted and can be classified as spent paprika. The other samples had a fat content in the range of 6.3-17.5% (±0.3%), corresponding to the average value of 12.9% indicated by ANDB. The protein content in paprika powder depends on the variety of processed Capsicum annuum plant, the technique used to grow this plant, and the climatic conditions of the locality where the plant is grown. The total protein content ranged between 11.9and 22.0% (±0.1%). Higher protein content was found in the group of samples originating in India, while in other samples, the protein content corresponded to the average tabulated value of 14.1% in the ANDB (Table 2). Fructose, glucose and sucrose content The concentration of sugars depends on the variety of grown plants and the degree of maturity of harvested fruits. It can also be related to climatic conditions in the cultivation site, and, as a result, it can reflect the geographical origin of paprika unless artificially sweetened. The average concentration of individual sugars in the examined paprika samples ranged from 0.11 to 126 mg/g (Table 2) and decreased in the order of glucose˃fructose˃sucrose. From the results shown in the Table 2 it can be seen that paprika samples originating from India showed lower than average fructose concentration. At the same time, above-average glucose content was foundinpaprikasamplesfromChina.Obtainedresultscompliedwithdata published in nutrition tables (Finglas et al ., 2015). Content of macro and trace elements Determining the mineral content of a sample is one of the practical tools for verifying the geographical origin of spices (D’Archivio et al., 2014; Ahmad et al .2020; DiDonato et al . 2023). The results of content determination of the analyzed macro elements and trace elements are shown in Table 3. Among the macro elements,potassiumwasthemostabundantinthegroundpaprikasamples (average concentration 18.9 mg/g). The other macro elements in the investigated samples had a similar content pattern, P > Mg ~ Ca > Na, and their concentration was approximately ten times lower than potassium. One sample from Turkey contained an extremely high sodium concentration compared to the other samples (18.2 mg/g compared to an average content of 0.55 mg/g), which was (according to the manufacturer's data) caused by adding salt to the ground paprika. Of the monitored microelements, iron was the most represented in the paprika samples (average concentration 0.17 mg/g). In contrast, the concentration of copper and zinc was in the order of tens of μg/g. Obtained results complied with data published in nutrition tables (Finglas et al ., 2015) and with studies published by DiDonato et al. 2023, Zhang et al. 2019 and Tokailoglu et al. 2019. Multivariete analysis of obtained data By applying PCA to amounts of 16 analytical variables and 37 objects, two factors were extracted, explaining 54.01 % of the variance of the initial data set. From the planar projection of these two principal components F1 and F2 it can be observed that paprika samples were separated into three main clusters (Figure 1). Paprika samples from China were projected at the interface of the first and third quadrants, samples from India were projected in the second quadrant, and samples originating from Europe (except for samples from Slovakia) were projected in the fourth quadrant. With the help of multivariate analysis, it was also possible to distinguish paprika samples originating from Europe and bearing a protected geographical indication. These samples originating from Hungary, Slovakia and Spain are circled in figure 1 and form three separate clusters. The relationship between all the components and the good separation of individual samples by country of origin is shown in Figure 2. ■A-CHN ◆A-IND X E-ESP ● E-SVK ▲E-HUN +A-TUR ·E-ROM-E-BLGXA-UZB O AM-USA Figure 1 Projection og the PCA score of paprika samples into a 2-D factor plane of principal components F1 and F2 and loading plots of variables defined by principal components F1 and F2. Table 2 Basic chemical characterisation of paprika samples investigated in this study. TFC TPC CHN Min 2.05 3.10 13.5 FRU ash pH Max 105 47.9 34 4.69 4.61 2.53 15.5 14.8 64 8.28 4.93 Min 12.6 16.1 1.08 5.54 4.76 Max 17.5 22.0 103 5.02 4.92 Av. 16.2 20.0 8.25 6.47 5.41 ESP Min 11.0 13.7 14.7 1.95 144 5.94 5.15 Max 16.9 16.3 83 4.96 4.73 148 6.93 5.31 Av. 13.4 14.7 19.8 1.63 109 5.65 5.09 HUN Min 8.18 12.1 28.2 3.16 2.02 84 5.45 4.59 Max 13.9 17.7 41.4 172 7.04 5.14 Av. 11.8 132 6.16 4.91 SVK Min 10.6 46.5 13.7 2.13 95 5.50 4.88 Max 12.0 15.9 53.2 16.7 3.42 124 5.70 5.02 Av. 11.3 15.5 50.2 TUR Min 11.0 15.1 11.9 15.9 2.87 106 5.60 4.97 Max Av. 13.1 16.9 14.4 18.5 17.2 0.34 82 6.21 5.18 USA* - 12.1 1.09 86 6.30 5.36 BLG* - 6.33 12.9 84 6.26 5.27 13.5 0.73 149 7.44 4.55 ROM* - 10.9 13.1 32.4 32.6 5.02 105 5.76 4.93 UZB* 7.43 1.45 136 5.81 5.13 WORLD** - 17.9 117 55.7 1.17 62 5.06 4.88 Av. 16.1 42.6 15.9 5.90 4.97 – China, IND – India, ESP – Spain, HUN – Hungary, SVK – Slovakia, TUR – Turkey, USA – United States of America, BLG – Bulgaria, ROM –Romania, UZB – Uzbekistan, WORLD – data for all analysed samples, Av. – average, * n=1, ** n=37 Table 3 Content of selected elements in paprika samples investigated in this study. CHN Min Max 1.26 Av. 0.93 IND Min 1.09 Max Av. ESP Min Max Av. HUN Min Max Av. Min 0.58 16.6 0.44 18.3 23.0 1.60 Av. Min Max 15.8 1.78 17.6 2.68 0.27 16.7 2.09 0.49 20.7 29.8 2.00 USAa - 1.60 25.2 BLGa - 1.98 1.06 17.2 2.34 ROMa - 3.52 21.4 1.99 3.02 UZBa - 1.16 0.84 19.3 2.94 0.29 18.2 1.57 WORLDb Av. 1.76 1.02 18.9 2.17 Na* K* Mg* P* Fe* Zn** 15.5 1.67 1.76 0.10 9.40 11.7 17.6 1.88 11.9 21.3 16.4 1.76 2.04 11.1 15.8 11.8 2.06 2.24 9.24 18.9 2.46 12.4 21.9 10.3 20.7 13.1 20.8 16.6 26.3 0.17 15.1 22.9 16.4 14.2 23.3 21.5 19.5 17.9 0.11 9.67 21.4 0.16 11.1 23.9 10.3 22.5 0.08 10.9 15.8 0.33 16.9 26.3 0.20 13.9 21.1 10.6 17.1 0.07 16.5 21.2 0.20 17.6 17.6 13.6 25.3 13.5 19.8 Legend: CHN – China, IND – India, ESP – Spain, HUN – Hungary, SVK – Slovakia, TUR – Turkey, USA – United States of America, BLG – Bulgaria, ROM – Romania, UZB – Uzbekistan, WORLD – data for all analysed samples, Av. – average a n=1, b n=37, *mg/g, **μg/g Figure 2 Heatmap representation of 16 monitored variables in 37 paprika samples. Annotations on top of the heatmap show clustering of the samples. CONCLUSION While untargeted analysis is currently receiving quite a lot of attention, targeted analysis is neglected when verifying the geographical origin of spices. This study shows that targeted analysis with the application of well-known chemical and instrumental methods is suitable for ascertaining the geographical origin of ground sweet paprika spice. By application of this approach, it was possible to separate samples originating from Europe and Asia reliably. Based on the processing of all obtained data, it was also possible to separate samples from Europe and bear a protected geographical indication of origin. The success of using any procedure for verifying the geographical origin of spices is greatly influenced by available and verified information on the sample's origin and a sufficient number of analyzed samples. For this reason, it would be appropriate for producers or suppliers of spices to cooperate more closely with research organizations so that it would be possible to create a reliable and as simple as possible methodology for verifying the geographical origin of spices. Such a methodology would help fair manufacturers and suppliers consolidate their market position and prevent frequent misleading of consumers. Acknowledgments: This study was suppoted by project No. FCH-S-23-8330FCH-S-21-7483 (Current issues and approaches to research within modern food sciences) financed by the Ministry of Education, Youth and Sports of the Czech Republic. REFERENCES Ahmad, R, Ahmad, N, Amir, M, Aljishi, F., Alamer M. H., Al-Shaban, H. R., Alsadah, Z. A., Alsultan, B. A., Aldawood N. A., Chathoth, S. & Almofty, S. A.(2020) Quality variation and standardization of black pepper (Piper nigrum): A comparative geographical evaluation based on instrumental and metabolomics analysis. Biomedical Chromatography . 2020, 34, e4772. http://dx.doi.org/10.1002/bmc.4772 Barbosa,S.,Saurina,J.,Puignou,L.&Núñez,O.(2020)Classificationand Authentication of Paprika by UHPLC-HRMS Fingerprinting and Multivariate Calibration Methods (PCA and PLS-DA). Foods , 9(4), 486. http://dx.doi.org/10.3390/foods9040486. Berke, T. G. & Shieh, S. C. (2012). Capsicum cultivars. In Peter, K.V. (ed.) Handbook of Herbs and Spices vol. 1.Woodhead Publishing, Oxford, pp.116 130. http://dx.doi.org/B978-1-84569-017-5.50033-6 Brunner, M., Katona, R., Stefánka, Z. & Prohaska T. (2010) Determination of the geographical origin of processed spice using multielement and isotopic pattern on the example of Szegedi paprika. European Food Research and Technology , 231,623–634. http://dx.doi.org/10.1007/s00217-010-1314-7 Cetó,X.,Sánchez,C., Serrano, N.,Díaz-Cruz,J. M.&NúñezO. (2020). Authentication of paprika using HPLC-UV fingerprints, D’Archivio, A. A., Giannitto, A., Incani, A. & Nisi, S. (2014) Analysis of the mineral composition of Italian saffron by ICP-MS and classification of geographical origin, Food Chemistry ,157, 485-489. http://dx.doi.org/10.1016/j.foodchem.2014.02.068. Di-Donato,F.,Biancolillo,A.,Foschi,M.,Di-Cecco,V.,Di-Martino,L.&D’Archivio, A. A.(2023) Authentication of typical Italian bell pepper spices by ICP-OES multi-elemental analysis combined with SIMCA class modelling. Journal of Food Composition and Analysis , 115, 104948, http://dx.doi.org/10.1016/j.jfca.2022.104948. Diviš, P., Pořízka, J., Vespalcová, M., Matějíček, A. & Kaplan J. (2015). Elemental composition of fruits from different Black elder (Sambucus nigra L.) cultivars grown in the Czech Republic.Journal of Elementology , 20(3), 549-557. http://dx.doi.org/10.5601/jelem.2015.20.1.758 Fiamegos, Y., Dumitrascu, C., Papoci, S. & Calle M. B. (2021) Authentication of PDOpaprika powder(Pimentón delaVera) by multivariateanalysis ofthe elemental fingerprint determined by ED-XRF. A feasibility study. Food Control ,120, 107496. http://dx.doi.org/10.1016/j.foodcont.2020.107496. Finglas, P.M., Roe M. A., Pinchen H. M.,Berry, R., Church, S. M., Dodhia, S. K., Faron-Wilson, M. & Swan, G. (2015) McCance and Widdowson's: The Composition of Foods. Cambridge: The Royal Society of Chemistry. http://dx.doi.org/10.1039/9781849737562 Galvin-King,P.,Haughey,S.A. &Elliott,C.T. (2020) TheDetectionof Substitution Adulteration of Paprika with Spent Paprika by the Application of Molecular Spectroscopy Tools. Foods , 9, 944. http://dx.doi.org/10.3390/foods9070944 Govindarajan, V. S. & Salzer U. J. (1985). Capsicum‐production, technology, chemistry, and quality part 1: History, botany, cultivation, and primary processing. Critical Reviews in Food Science and Nutrition , 22(2), 109-176. http://dx.doi.org/10.1080/10408398509527412 Govindarajan, V. S. (1986). Capsicum--production, technology, chemistry, and quality--Part II. Processed products, standards, world production and trade. Critical Reviews in Food Science and Nutrition , 23(3), 207-288. http://dx.doi.org/10.1080/10408398609527426. GVR : Grandviewresearch (2019). Paprika market size, share. Global industry analysis report. https://www.grandviewresearch.com/industry-analysis/paprika-market Hong, E., Lee, S. Y., Jeong, J. Y., Park, J. M., Kim, B. H., Kwon K. &Chun, H. S.(2017). Modern analytical methods for the detection of food fraud and adulteration by food category. Journal of the Science of Food and Agriculture , 97(12), 3877-3896. http://dx.doi.org/doi:10.1002/jsfa.8364 Lee Hyun-Suk, Hong Ju-Yeon, Choi Young-Jun, Lee Yang Suk, Seo Su-Jeong &Shin Seung-Ryeul (2017) Characteristics in the components of the paprika by drying methods. Korean Journal of Food Preservation , 24(4),497-504. http://dx.doi.org/10.11002/kjfp.2017.24.4.497 LWT , 124,109153, http://dx.doi.org/10.1016/j.lwt.2020.109153. Metsalu, T. &Vilo, J. (2015) Clustvis: a web tool for visualizing clustering of multivariate data using Principal Component Analysis and heatmap. Nucleic Acids Research , 43, 566–570, http://dx.doi.org/10.1093/nar/gkv468. Molnár, H., Kónya, E., Zalán, Z., Bata-Vidács, I., Tömösközi-Farkas, R., Székács, A. & Nóra Adányi (2018). Chemical characteristics of spice paprika of different origins. Food Control , 83, 54-60. http://dx.doi.org/10.1016/j.foodcont.2017.04.028. Monago-Maraña, O., Eskildsen, C. E., Galeano-Díaz, T., Muñoz de la Peña, A. &Wold, J. P. (2021). Untargeted classification for paprika powder authentication using visible–Near infrared spectroscopy (VIS-NIRS). Food Control 121,107564. http://dx.doi.org/j.foodcont.2020.107564 Štursa, V., Diviš, P. & Pořízka, J. (2018). Characteristics of Paprika samples of different geographical origin. Potravinarstvo Slovak Journal of Food Sciences , 12(1), 254–261. http://dx.doi.org/10.5219/902 Tokalioglu, S., Dokan, F. K. & Köprü, S. (2019) ICP-MS multi-element analysis for determining the origin by multivariate analysis of red pepper flakes from three different regions of Turkey, LWT, 103, 301-307. http://dx.doi.org/10.1016/j.lwt.2019.01.015. Zaki, N., Hakmaoui, A., Ouatmane, A. & Fernandez-Trujillo, J. P. (2013) Quality characteristics of Moroccan sweet paprika (Capsicum annuum L.) at different sampling times. Food Science and Technology (Campinas), 33, 577-585. http://dx.doi.org/10.1590/S0101-20612013005000072 Zhang, J., Yang, R., Chen, R., Li, Y. C., Peng, Y. & Wen, X. (2019) Geographical origin discrimination of pepper (Capsicum annuum L.) based on multi-elemental concentrations combined with chemometrics. Food Science and Biotechnology, 28, 1627–1635. http://dx.doi.org/10.1007/s10068-019-00619-3
确定

还剩3页未读,是否继续阅读?

产品配置单


中国格哈特为您提供《来自世界各地36个红辣椒粉样品中蛋白质和总脂肪含量的检测》,该方案主要用于其他调味品中营养成分检测,参考标准《GB 5009.6 食品中脂肪的测定》,《来自世界各地36个红辣椒粉样品中蛋白质和总脂肪含量的检测》用到的仪器有格哈特全自动超级总脂肪测定系统、格哈特自动升降凯氏定氮电热消解仪KT-L 20s、格哈特带自动进样器凯氏定氮仪VAP500C、格哈特维克松废气废物处理涤气系统VS、滤纸筒、德国移液器MM、凯氏定氮催化剂5.0g K2SO4+0.5g CuSO4 x 5H2O
该厂商其他方案
更多