


方案详情
文
关键词:蛋白质二级结构,FTIR,transmission cell,SSE测定,酰胺带,α-螺旋,beta sheet, beta turn,溶菌酶,血细胞凝集素
方案详情

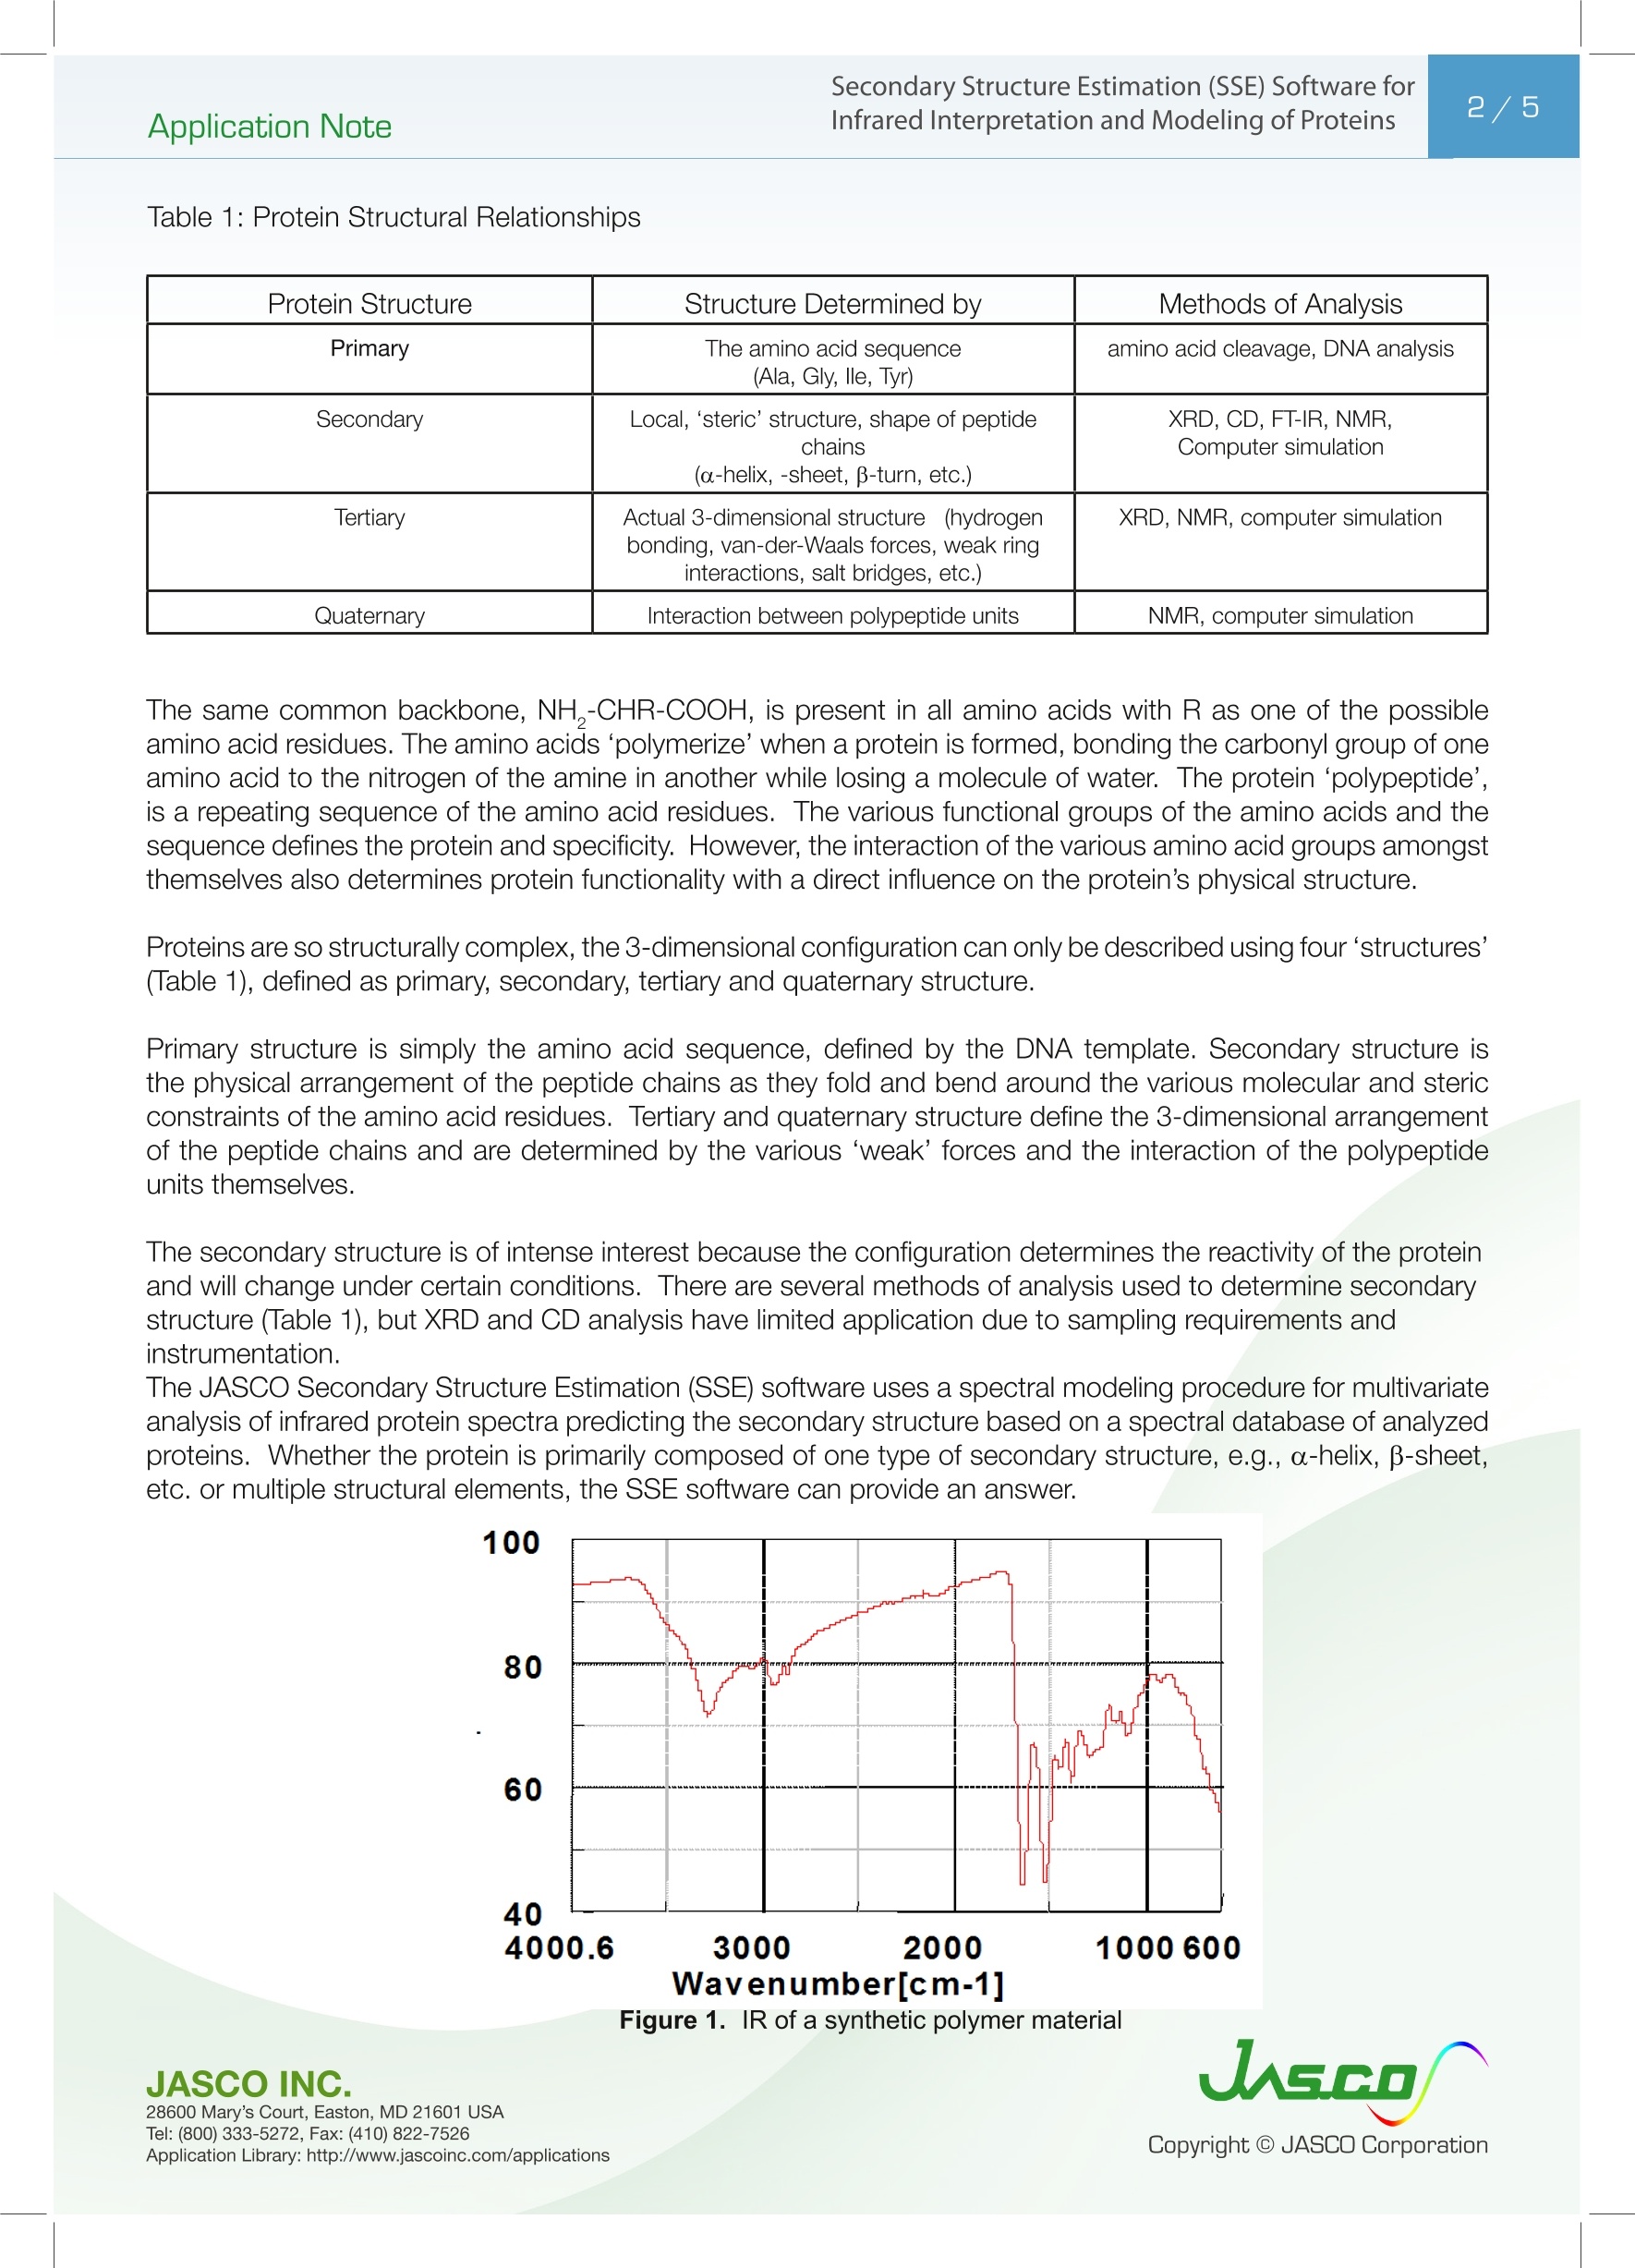
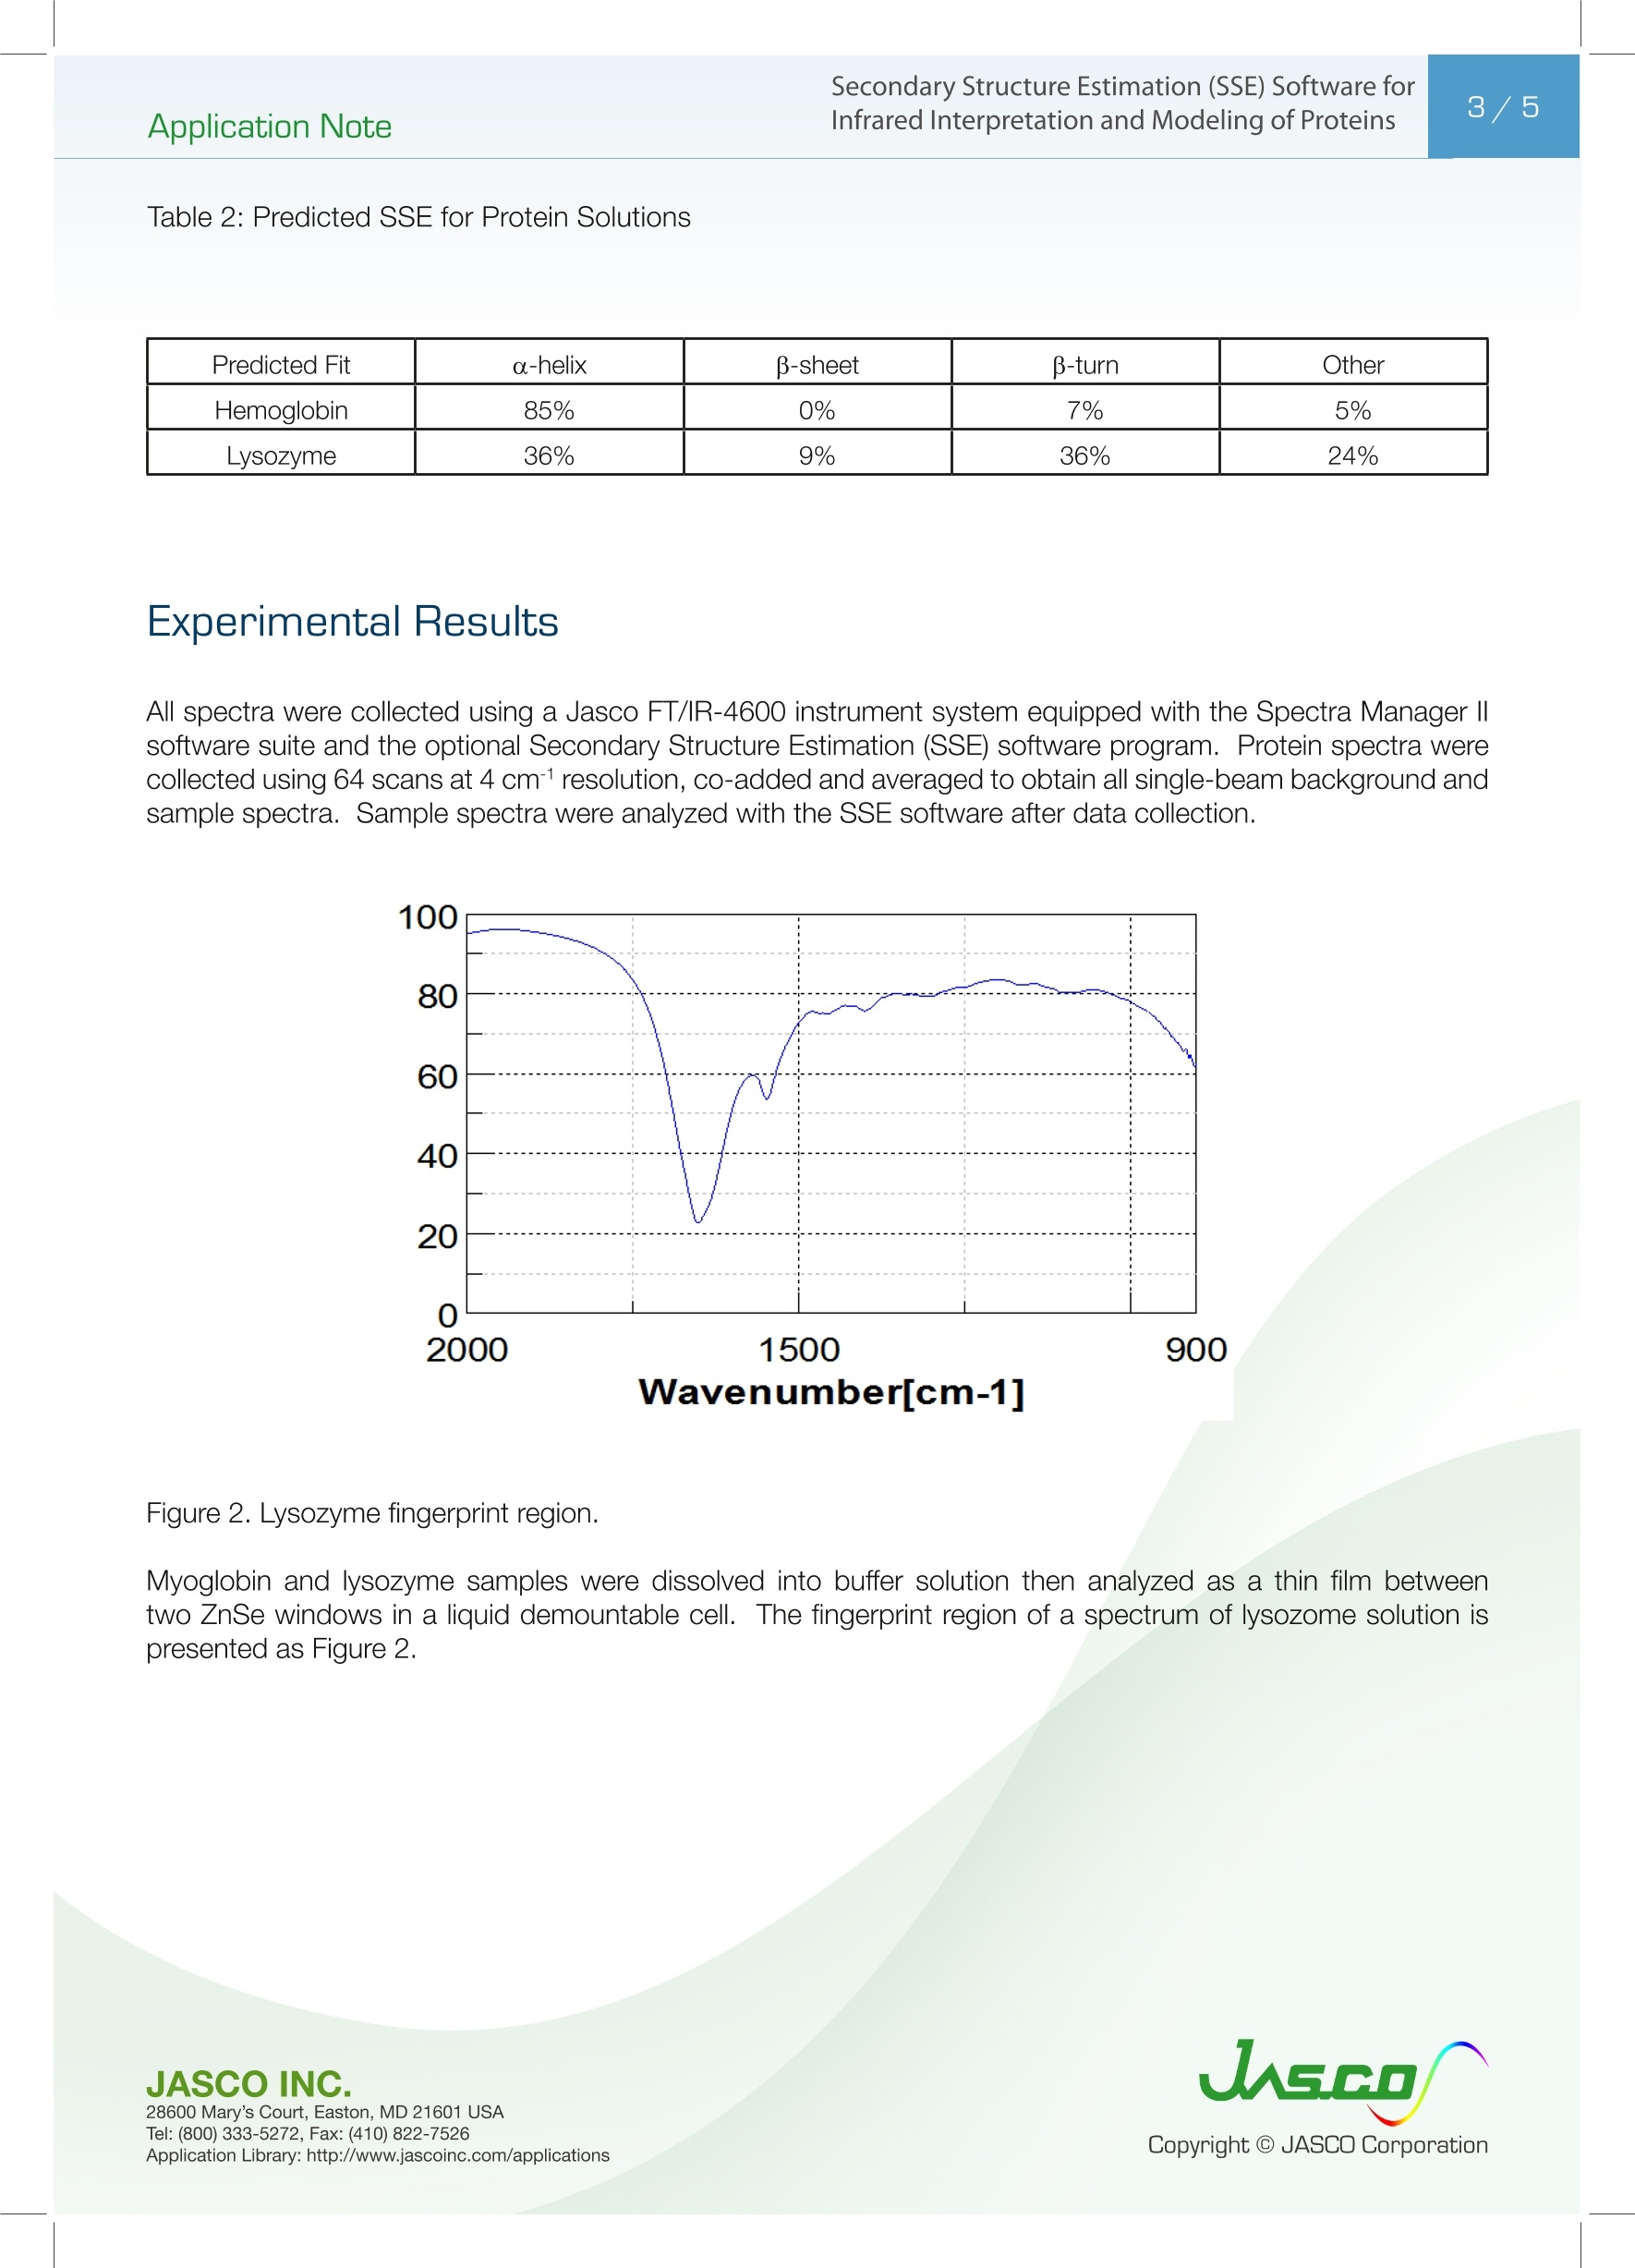
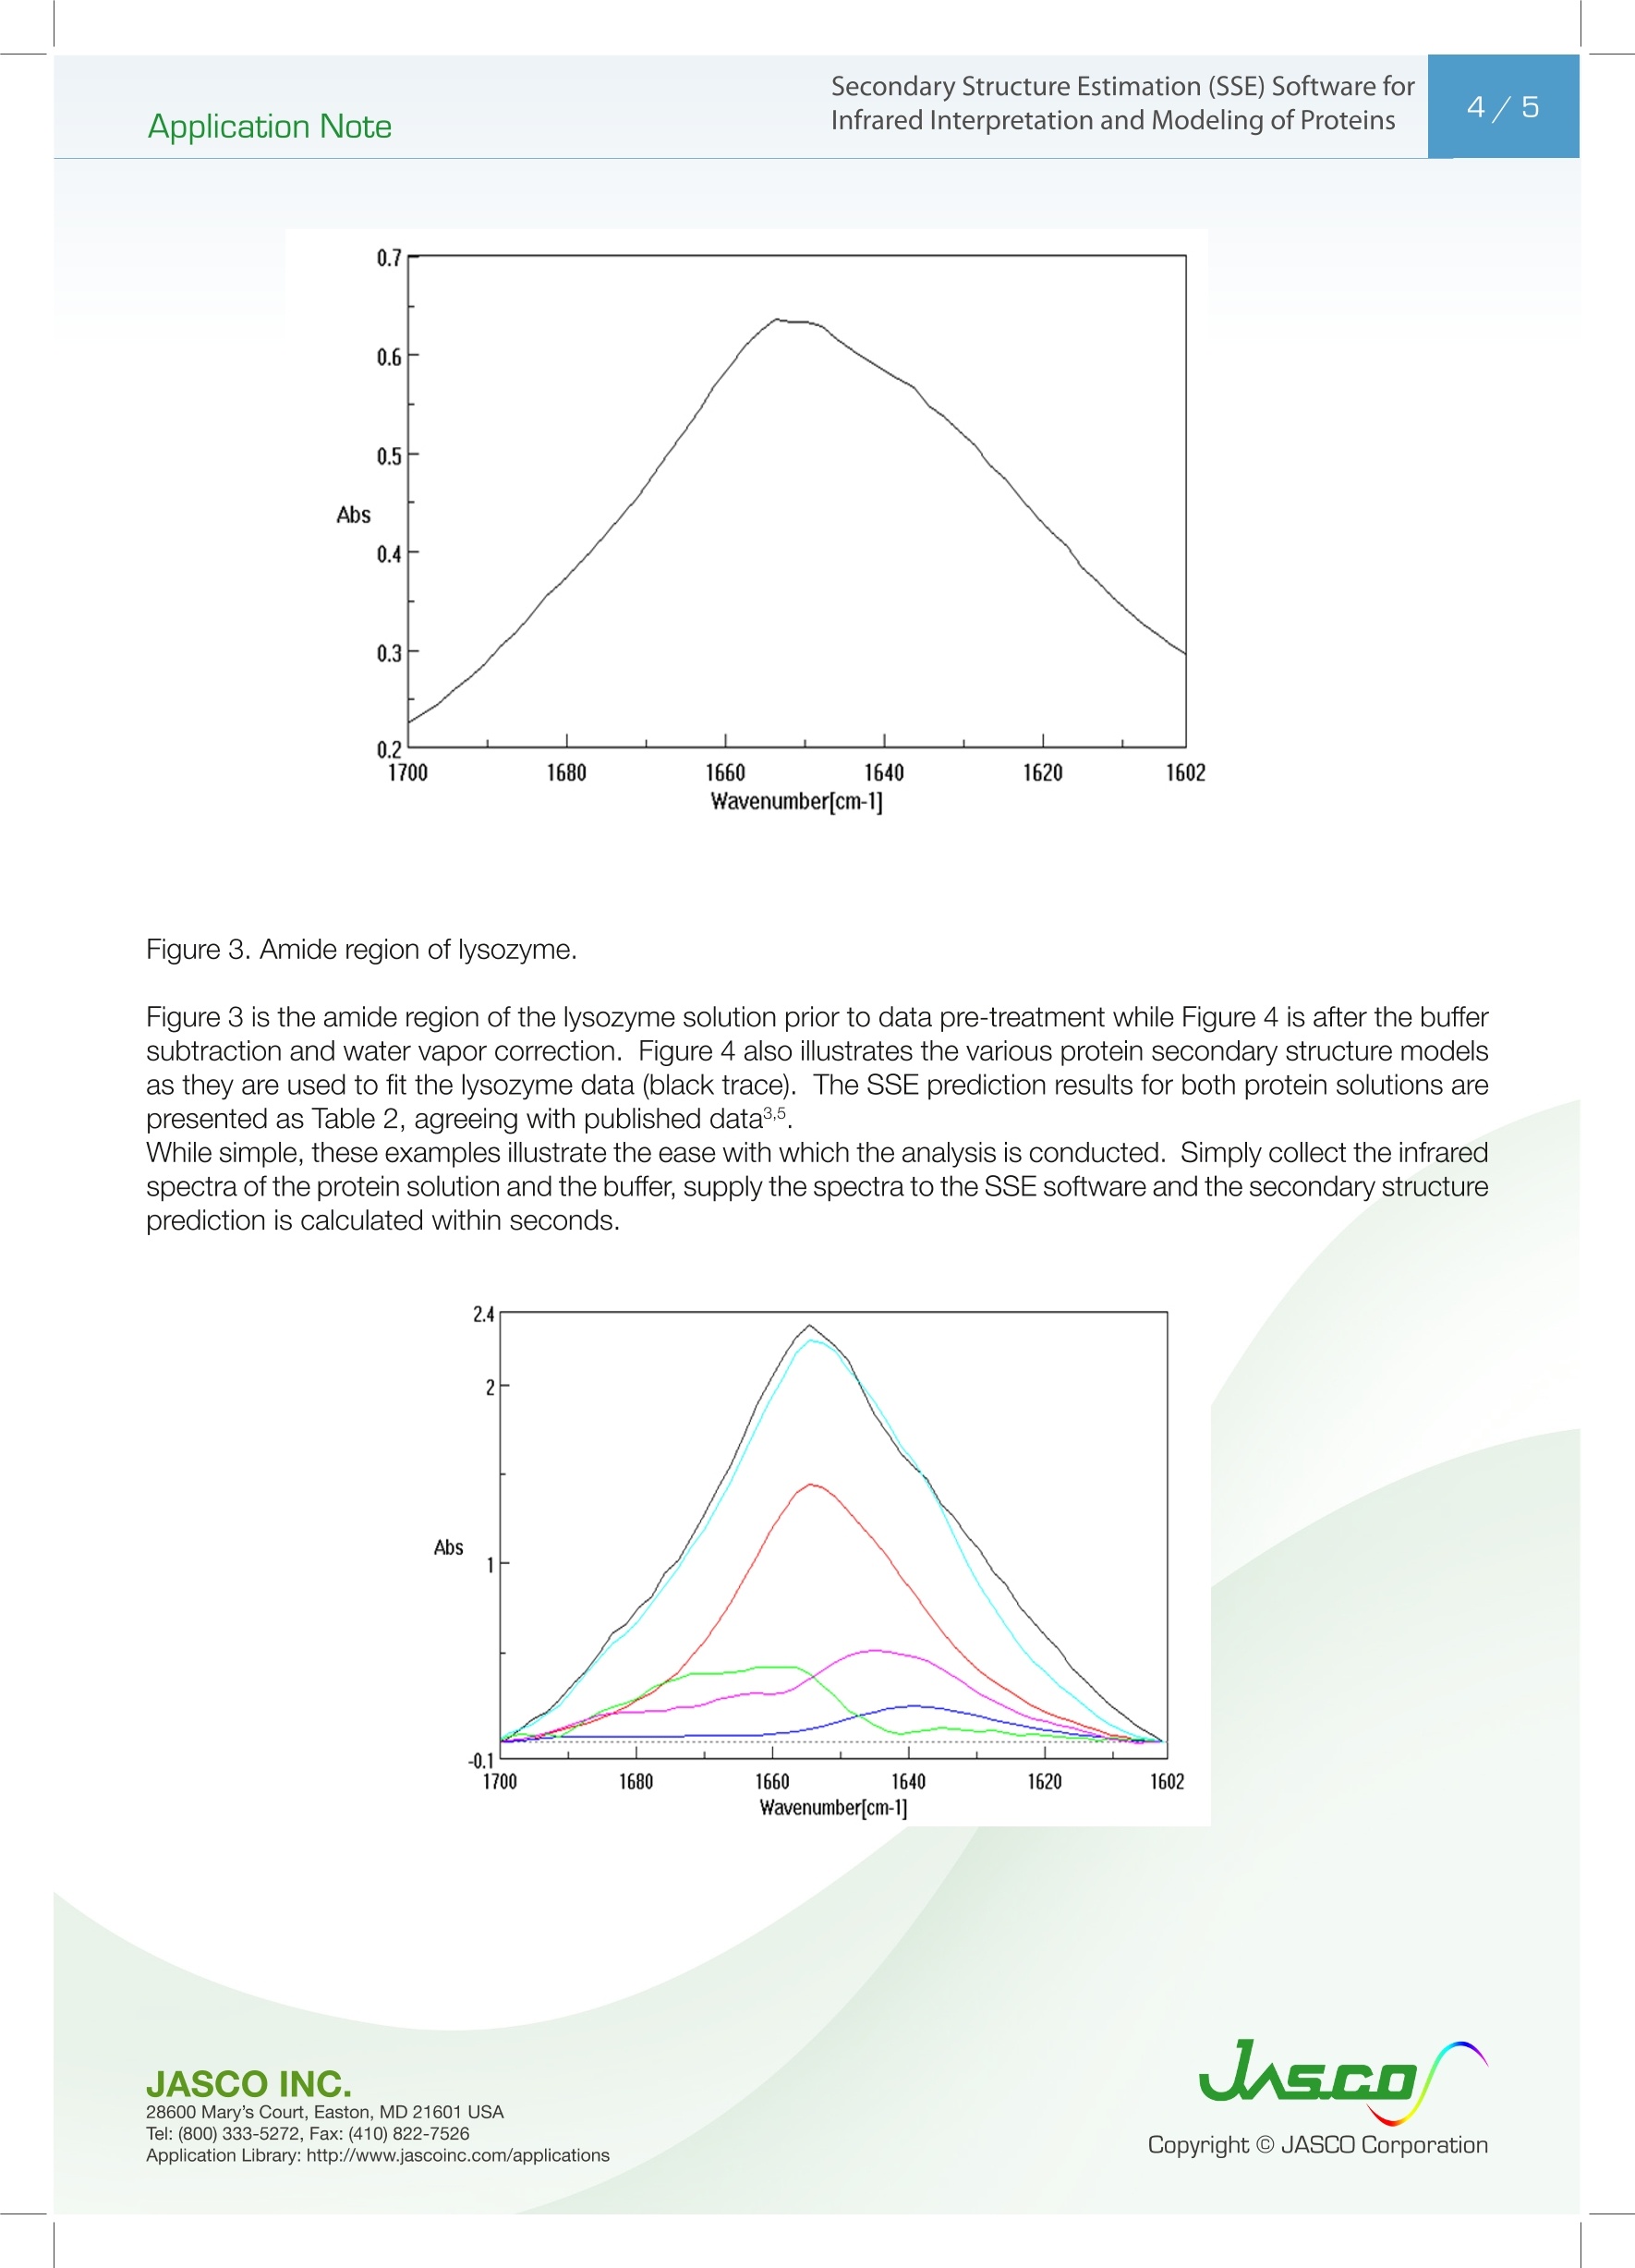
与简单的化学物质相反,蛋白质的三维结构是蛋白质反应性和功能性的固有部分。例如,肌肉纤维主要由具有特定物理结构的单一类型的蛋白质(纤维蛋白原)组成。在其他蛋白质中,物理构型的重排可以增强或限制蛋白质的功能性或反应性。因此,蛋白质的物理排列与氨基酸序列一样重要。核磁共振分析需要非常昂贵的仪器。相比之下,FT-IR分析在大多数实验室都很容易获得,对样品类型或方法几乎没有限制,价格低廉且操作简单。因此,红外蛋白质光谱的研究和解释已经在文献中得到了很好的证明。本应用说明经过示例、测量得出结论:SSE程序可能无法提供各种蛋白质结构的完整确认,但它是快速测定蛋白质二级结构的一个非常强大的工具。Secondary Structure Estimation (SSE) Software forInfrared Interpretation and Modeling of Proteins2/5Application Note Interpretation and Modeling of Proteins As the last strands of the human genome project unravel, the focus now turns to proteomics. There are several instrumental methods to analyze protein chemistry and there is particular i nterest in the functional act i vity that can be directly att r ibuted to the physical arrangement of a protein. As opposed to simple chemicals, the 3-dimensional structure of proteins is an inherent part of the protein react i vity and functionality. For i nstance, muscle f iber is composed primar i ly of a single type of protein (fibrinogen) with a specific physical structure. In other proteins, rearrangement of the physical configuration can enhance or restrict the protein functionality or reactivity. Thus, the physical arrangement of t he protein is as important as the sequence of amino acids. NMR analysis requires very expensive instrumentation. By contrast, FT-IR analysis is readily available in most laboratories, has few constraints on sample type or methodology, is inexpensive and simple to operate.As a result, the study and i nterpretation of i nfrared protein spectra has been well documented in the literature1-5. Although there are numerous vibrational i nteractions possible for crystalline proteins, in truth, most of them present infrared spectra much l ike synthetic polymers (Figure 1). Demonstrating C-H stretching and bending and some skeletal bands, protein spectra are quite simple in comparison to the complexity often presented by i ndividual chemical spectra. Because of the role played by the amide groups as the backbone for the amino acid residues, the amide vibrational data provides the critical information necessary to predict the secondary structure of the protein. But the variations in the amide band structures are subtle and can be difficult to i nterpret. Keywords: Protein Secondary Structure, FTIR, transmission cell,SSE determination, amide bands, alpha helix, beta sheet, beta turn, lysozyme, hemaglobin Table 1: Protein Structural Relationships Protein Structure Structure Determined bv Methods of Analysis Primary The amino acid sequence(Ala, Gly, lle, Tyr) amino acid cleavage, DNA analysis Secondary Local, ‘steric'structure, shape of peptidechains (a-helix, -sheet, B-turn, etc.) XRD, CD, FT-IR,NMR,Computer simulation Tertiary Actual 3-dimensional structure (hydrogenbonding,van-der-Waals forces, weak ringinteractions, salt bridges, etc.) XRD,NMR, computer simulation Quaternary Interaction between polypeptide units NMR, computer simulation The same common backbone, NH,-CHR-COOH, is present in all amino acids with R as one of the possible amino acid residues. The amino acids ‘polymerize'when a protein is formed, bonding the carbonyl group of one amino acid to the nitrogen of the amine in another while losing a molecule of water. The protein ‘polypeptide',is a repeating sequence of the amino acid residues. The various functional groups of the amino acids and the sequence defines the protein and specificity. However, the interaction of t he various amino acid groups amongst themselves also determines protein functionality with a direct influence on the protein’s physical structure. Proteins are so structurally complex, the 3-dimensional configuration can only be described using four ‘structures’(Table 1), defined as primary, secondary, tertiary and quaternary structure. Primary structure is simply the amino acid sequence, defined by the DNA template. Secondary structure is the physical arrangement of the peptide chains as they fold and bend around the various molecular and steric constraints of the amino acid residues. Tertiary and quaternary structure define the 3-dimensional arrangement of the peptide chains and are determined by the various ‘weak’ forces and the interact i on of the polypeptide units themselves. The secondary structure is of intense interest because the configuration determines the reactivity of the protein and will change under certain conditions. There are several methods of analysis used to determine secondary structure (Table 1), but XRD and CD analysis have limited application due to sampling requirements and instrumentation. The JASCO Secondary Structure Estimation (SSE) software uses a spectral modeling procedure for multivariate analysis of infrared protein spectra predict i ng the secondary structure based on a spectral database of analyzed proteins. Whether the protein is pr i marily composed of one type of secondary structure, e.g., a-helix, B-sheet,etc. or multiple structural elements, the SSE software can provide an answer. Figure 1. IR of a synthetic polymer material JASCO INC. Table 2: Predicted SSE for Protein Solutions Predicted Fit a-helix B-sheet B-turn Other Hemoglobin 85% 0% 7% 5% Lysozyme 36% 9% 36% 24% Experimenta l Resu l ts All spectra were collected using a Jasco FT/IR-4600 instrument system equipped with the Spectra Manager Ⅱsoftware suite and the optional Secondary Structure Estimation (SSE) software program. Protein spectra were collected using 64 scans at 4 cmresolution, co-added and averaged to obtain al l single-beam background and sample spectra . Sample spectra were analyzed with the SSE software after data collection. Figure 2. Lysozyme fingerprint region. Myoglobin and l ysozyme samples were dissolved into buffer solution then analyzed as a thin film between two ZnSe windows i n a liquid demountable cell. The fingerprint region of a spectrum of l ysozome solution is presented as Figure 2. JASCO INC. s.c o Copyrig h t O JASCO Co r por ati on Figure 3. Amide region of l ysozyme. Figure 3 is the amide region of t he lysozyme solution prior to data pre-treatment while Figure 4 i s after t he buffer subtraction and water vapor correction. Figure 4 also illustrates the various protein secondary structure models as t hey are used to f it the lysozyme data (black t race). T he SSE prediction results for both protein solutions are presented as Table 2, agreeing with published data3.5. While simple, these examples illustrate the ease wi t h which the analysis is conducted. Simply collect the infrared spectra of the protein solution and the buffer , supply the spectra to the SSE software and the secondary structure prediction i s calculated within seconds. JASCO INC. Figure 4. IR spectrum with corrections. In addition, the accuracy of the SSE program increases as corroborated protein spectra are added to your personal database. Supplied wi t h an i nitial database of over 50 proteins and their substantiated secondary structure, the SSE software package is ready and able to provide answers from the very start of data processing. Conclusions The SSE program may not be able to provide a complete confirmation of the various protein structures but i t is an extremely powerful tool for the rapid determination of protein secondary structure. 1.) Miyazawa , T.J. Chem. Phys., 32, 1657, 1960. 2.)Miyazawa, T., and Blout, E . R., J. Amer. Chem. Soc., 83, 712,1961. 3.)Krimm, S. and Bandekar, J., Advances in Protein Chemistry, 38, 181, 1986. 4.)“Spectroscopic Methods for Determining Protein Structure in Solution”, H. A. Havel, ed., VCH Weinheim,Germany, 1996. “Infrared Spectroscopy of Biomolecules", H. H. Mantsch and D. Chapman, eds. Wiley-Liss, New York, NY,1996. JASCO INC.
确定

还剩3页未读,是否继续阅读?

产品配置单

佳士科商贸有限公司为您提供《用于蛋白质红外解释和建模的二级结构分析(SSE)软件》,该方案主要用于其他中蛋白质、二级结构分析(SSE)软件检测,参考标准--,《用于蛋白质红外解释和建模的二级结构分析(SSE)软件》用到的仪器有JASCO傅立叶变换红外光谱仪FT/IR-6000
相关方案
更多
该厂商其他方案
更多