


方案详情
文
红外定量分析是分析实验室的日常需求。虽然液体溶液是一种常见的样品,但也存在粉状成分的混合物,通常希望获得不溶解到溶剂中的定量结果。本文概述了两种粉状混合物的定量分析方法的发展。
方案详情

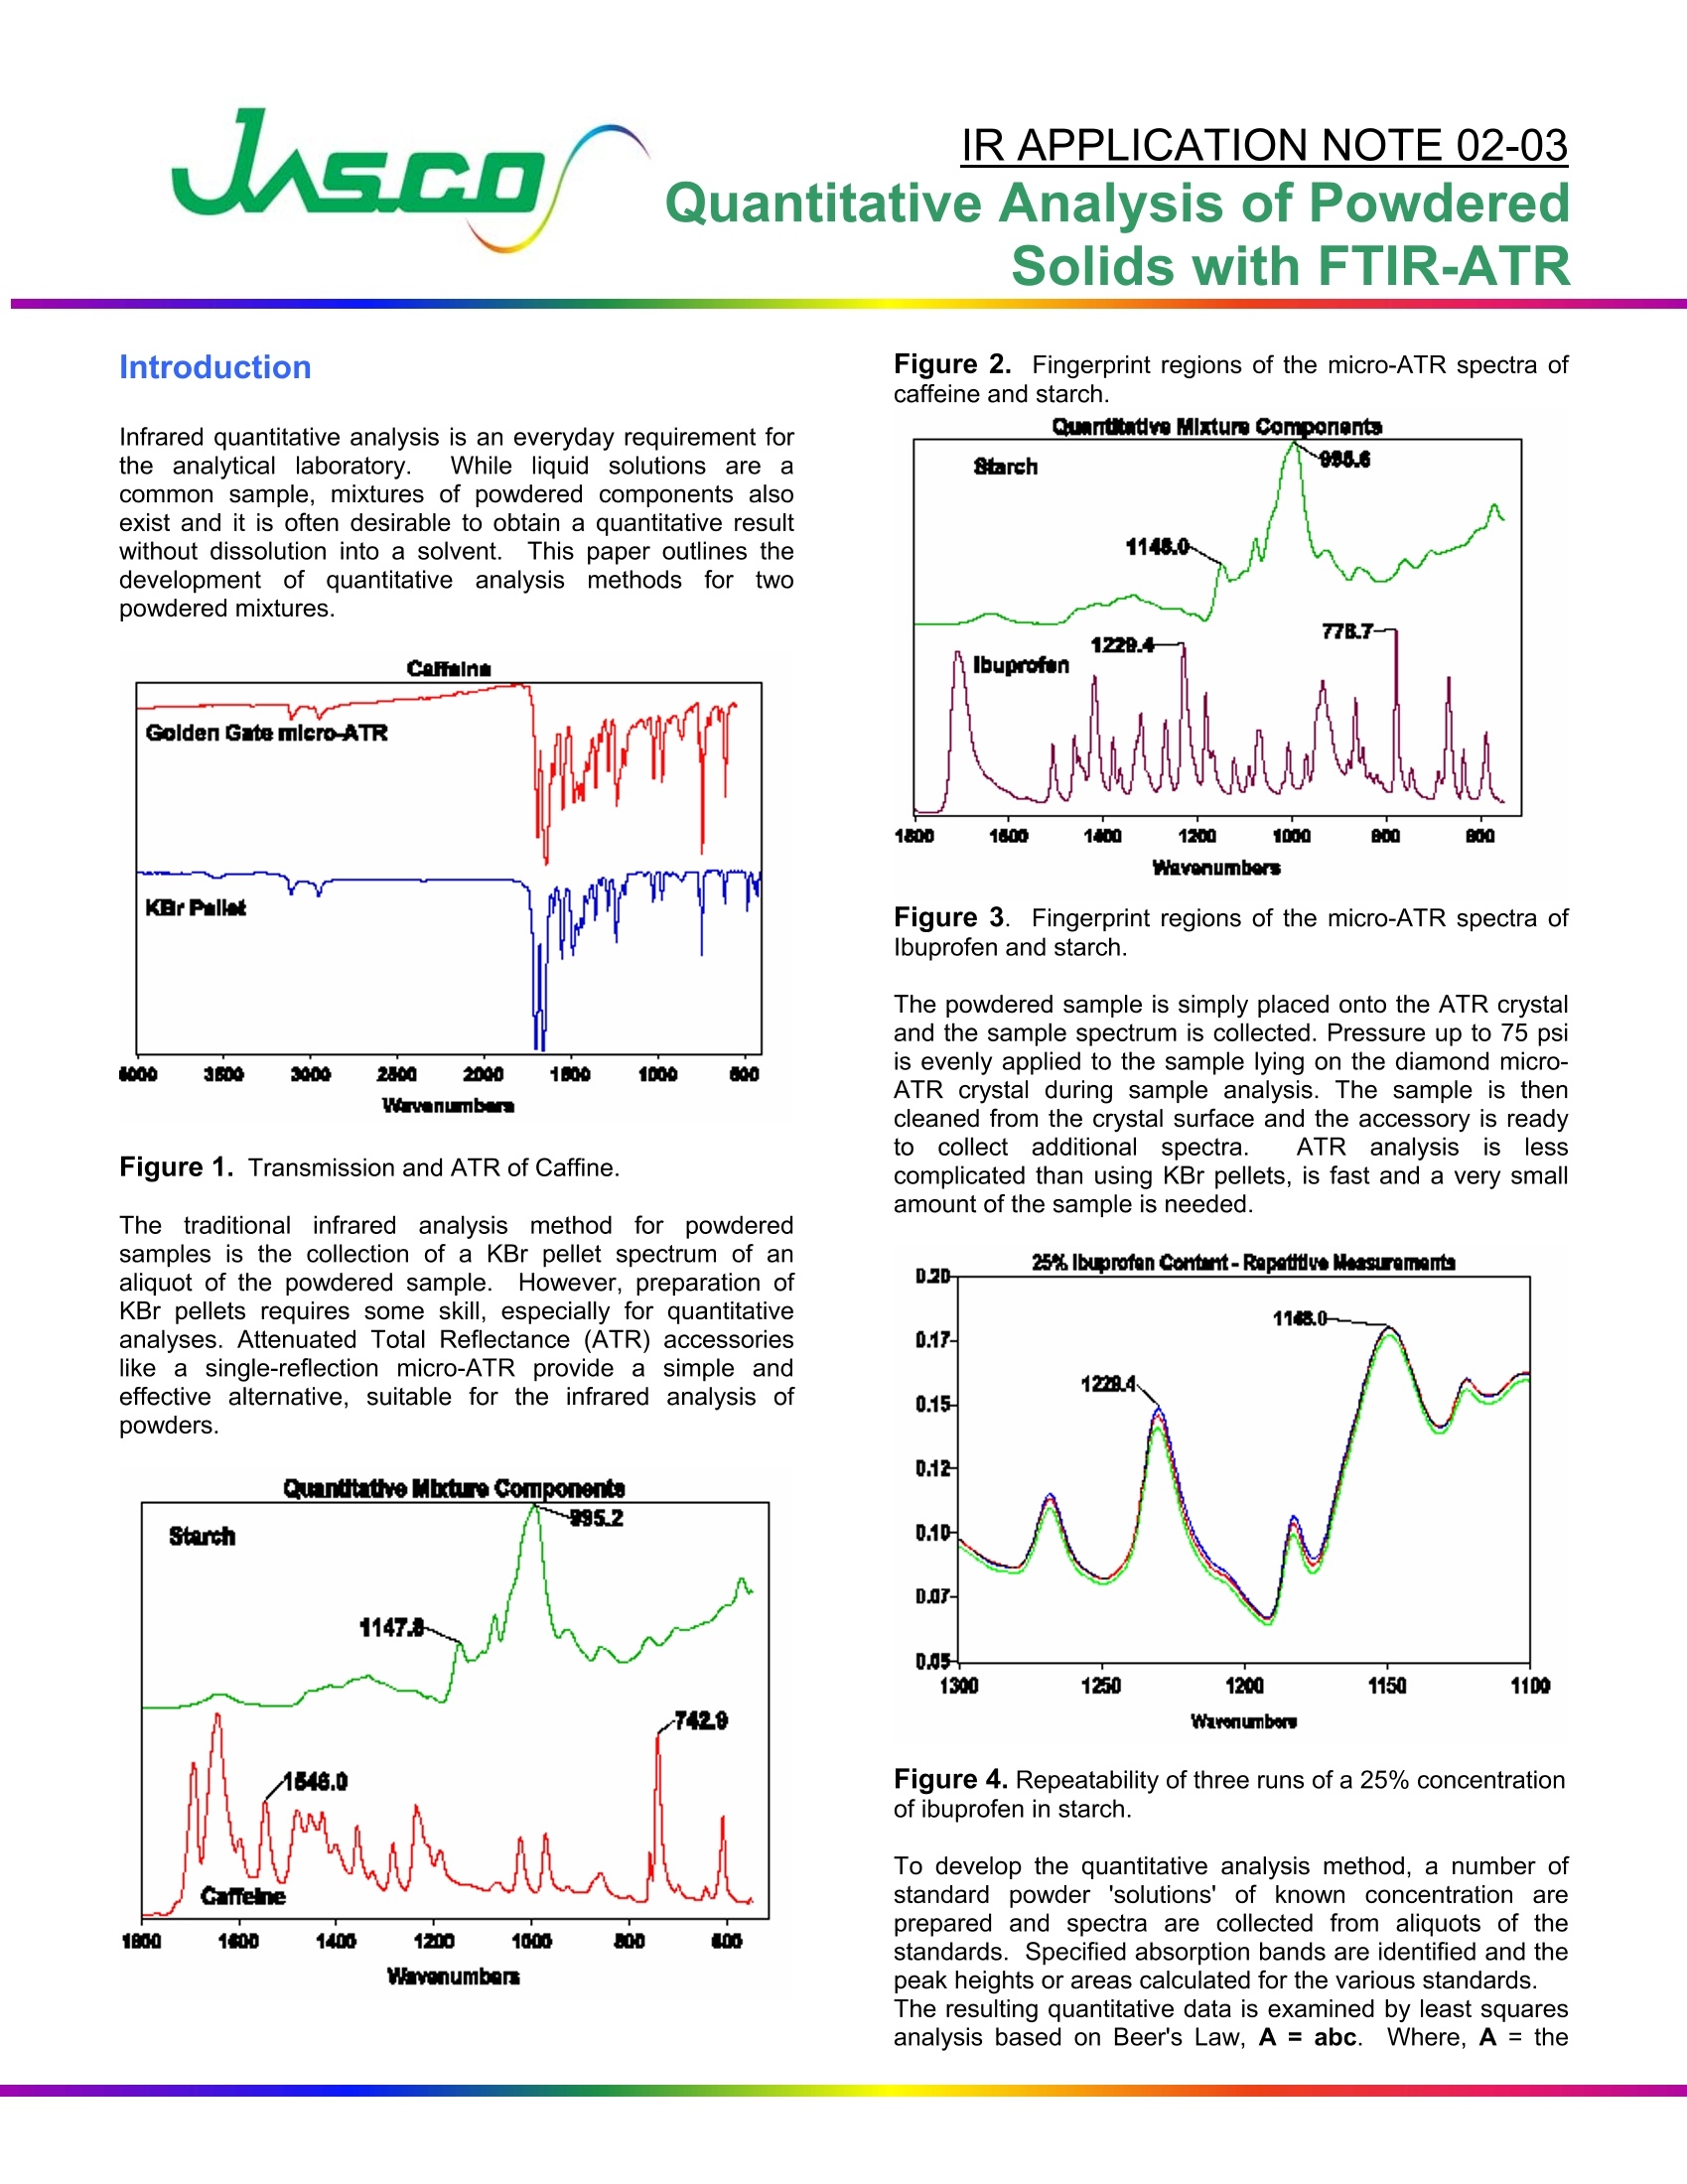
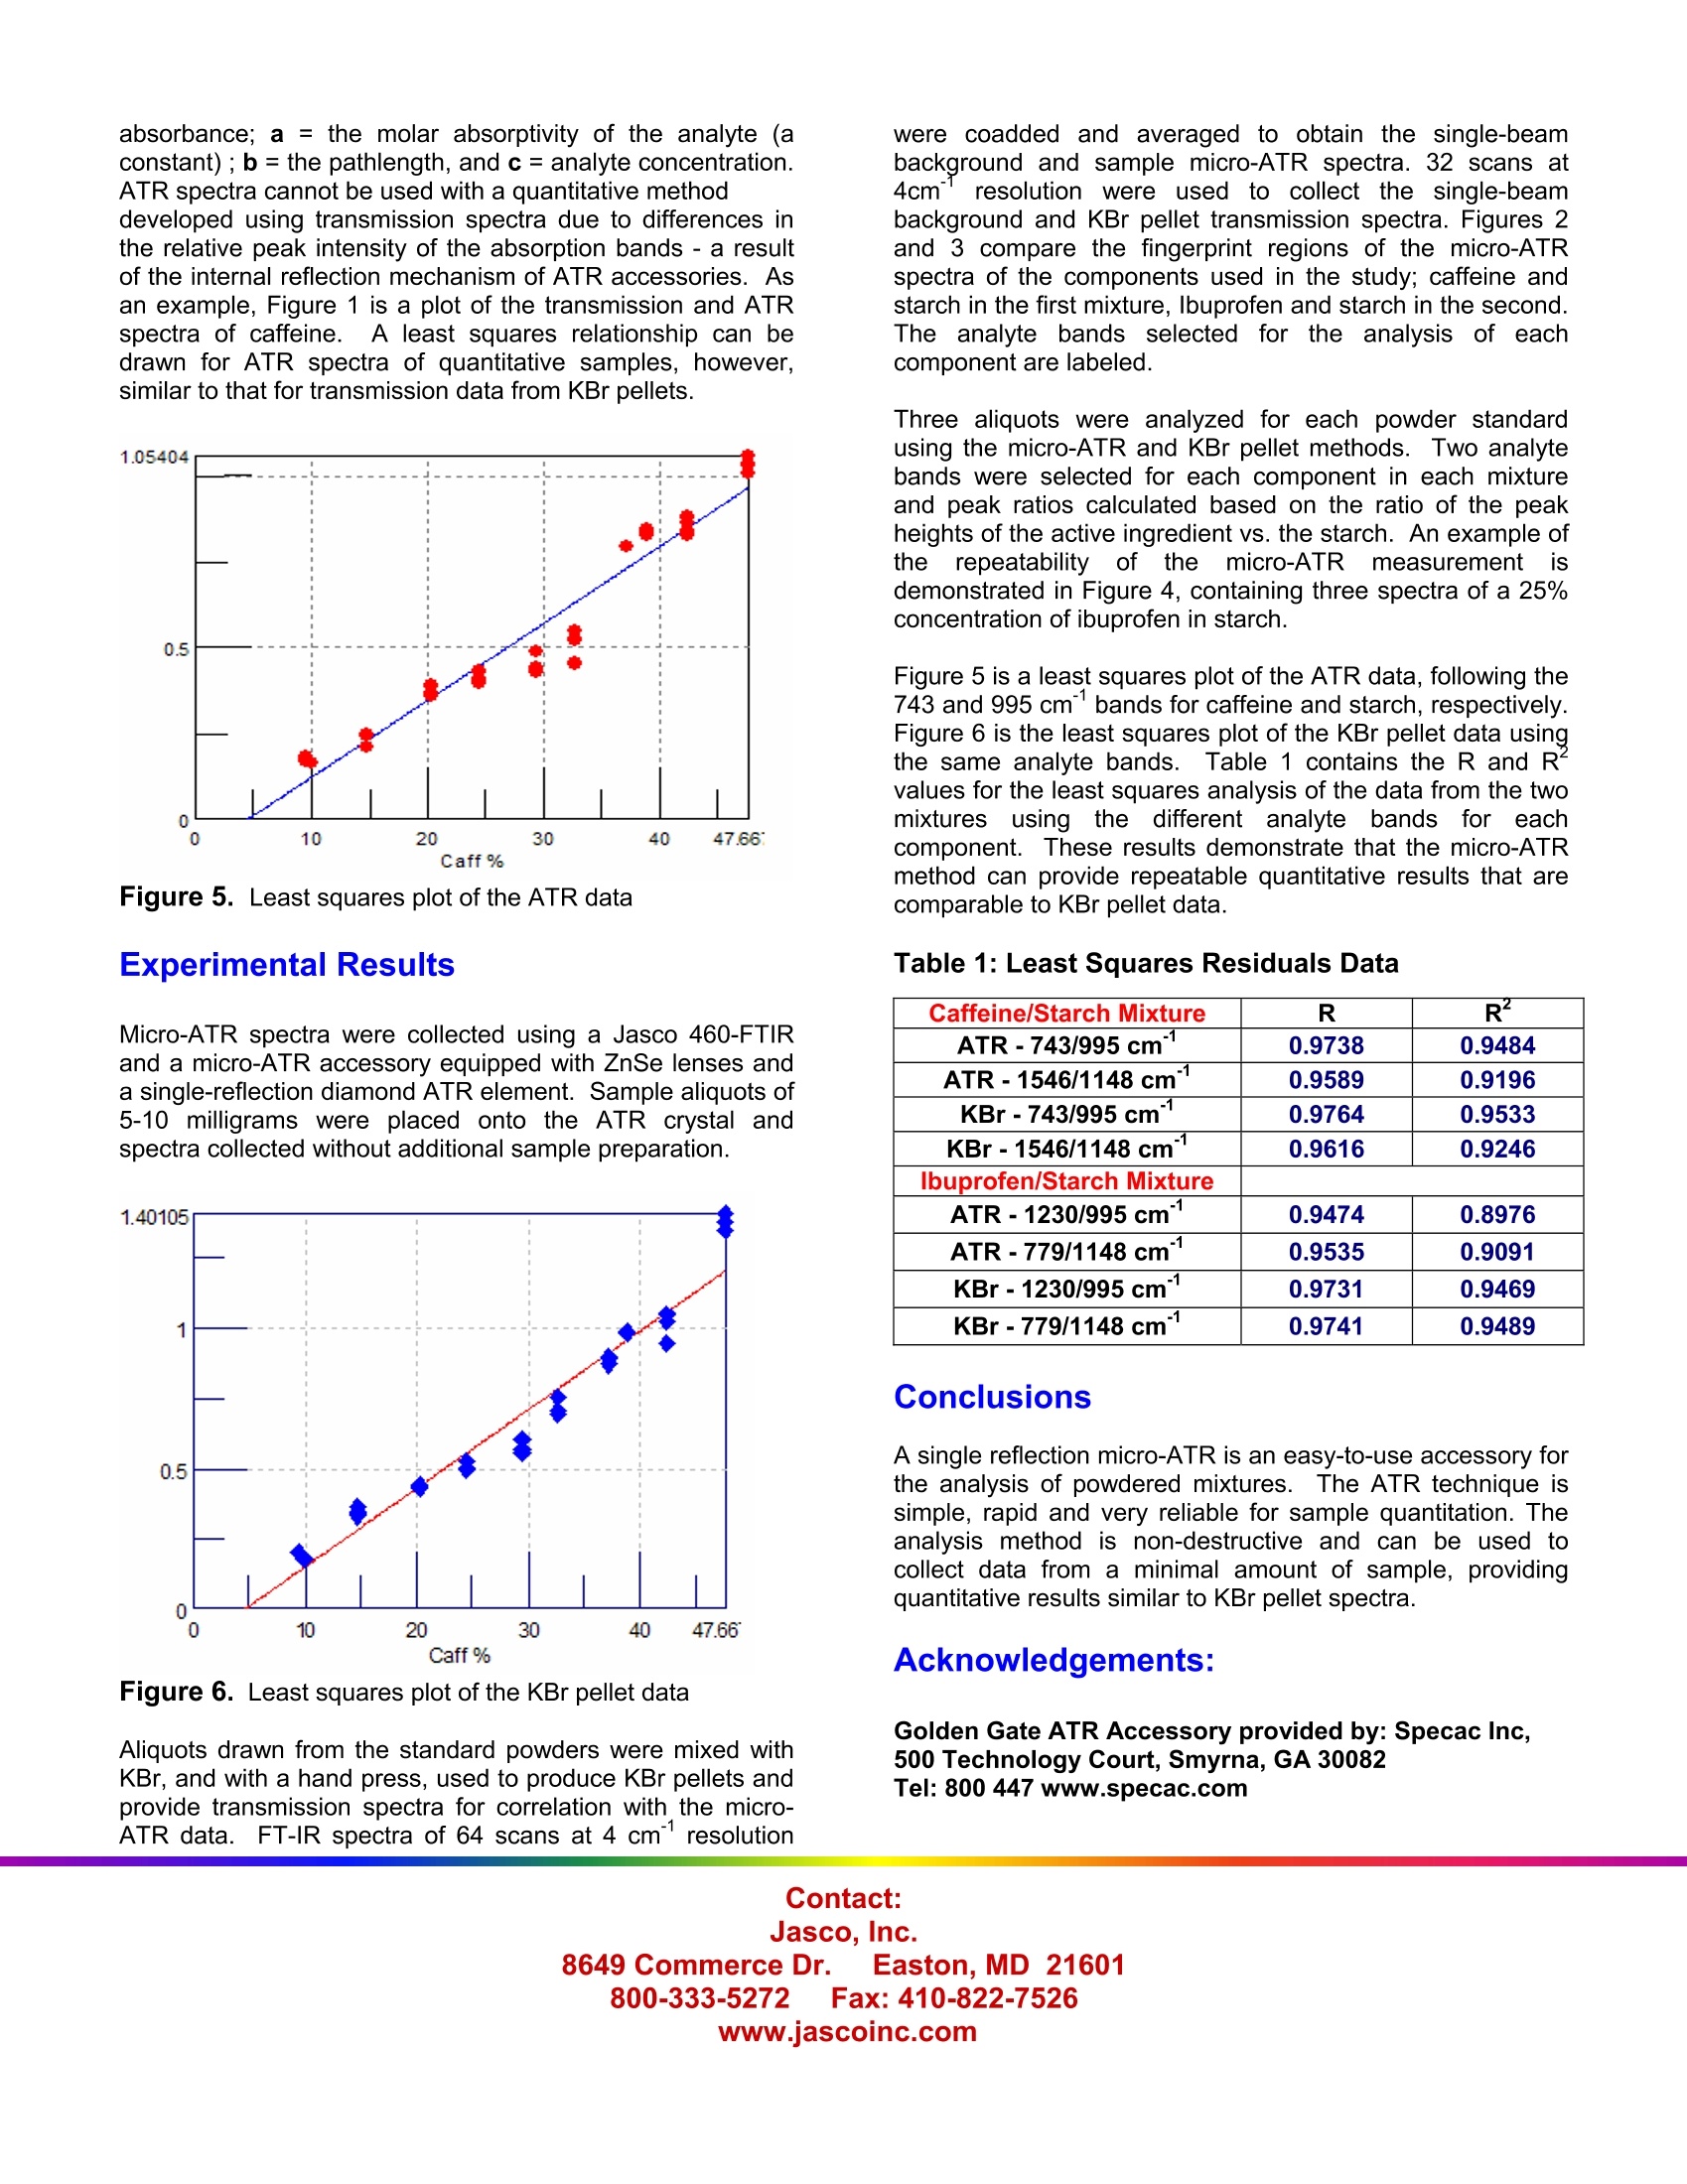
红外定量分析是分析实验室的日常需求。虽然液体溶液是一种常见的样品,但也存在粉状成分的混合物,通常希望获得不溶解到溶剂中的定量结果。本文概述了两种粉状混合物的定量分析方法的发展。粉末样品的传统红外分析方法是收集等份粉末样品的KBr颗粒光谱。然而,KBr颗粒的制备需要一些技巧,尤其是在定量分析方面。衰减全反射(ATR)配件,如单反射微型ATR,提供了一种简单有效的替代方案,适用于粉末的红外分析。将粉末状样品简单地放置在ATR晶体上,并收集样品光谱。在样品分析过程中,将高达75psi的压力均匀地施加到位于金刚石微ATR晶体上的样品上。然后从晶体表面清洁样品,并准备好配件来收集额外的光谱。ATR分析比使用KBr颗粒不那么复杂,速度快,并且需要非常少量的样品。本应用说明中示例显示结论:单反射微型ATR是一种易于使用的附件,用于分析粉末混合物。ATR技术简单、快速且非常可靠地用于样品定量。该分析方法是无损的,可用于从最少量的样品中收集数据,提供类似于KBr颗粒光谱的定量结果。IR APPLICATION NOTE 02-03Quantitative Analysis of PowderedSolids with FTIR-ATR Int r oduc t i o n Infrared quantitative analysis is an everyday requirement for the analytical laboratory.While liquid solutions are a common sample, mixtures of powdered components also exist and it is often desirable to obtain a quantitative result without dissolution into a solvent. This paper outlines the development of quantitative analysismethods for two powdered mixtures. Figure 1. Transmission and ATR of Caffine. The traditional infrared analysis method for powdered samples is the collection of a KBr pellet spectrum of an aliquot of the powdered sample. However, preparation of KBr pellets requires some skill, especially for quantitative analyses. Attenuated Total Reflectance (ATR) accessories like a single-reflection micro-ATR provide a simple and effective alternative, suitable for the infrared analysis of powders. W归yanumben Figure 2. Fingerprint regions of the micro-ATR spectra of caffeine and starch. Figure 3. Fingerprint regions of t he micro-ATR spectra of Ibuprofen and starch. The powdered sample is simply placed onto the ATR crystal and the sample spectrum is collected. Pressure up to 75 psi is evenly applied to the sample lying on the diamond micro-ATR crystal during sample analysis. The sample is then cleaned from the crystal surface and the accessory is ready to collect additional spectra. ATR analysis is less complicated than using KBr pellets, is fast and a very small amount of t he sample is needed. Figure 4. Repeatability of three runs of a 25% concentration of ibuprofen in starch. To develop the quantitative analysis method, a number of standard powder 'solutions’ of known concentration are prepared and spectra are collected from aliquots of the standards. Specified absorption bands are identified and the peak heights or areas calculated for the various standards.The resulting quantitative data is examined by least squares analysis based on Beer's Law, A = abc.Where, A = the absorbance; a = the molar absorptivity of the analyte (a constant); b= the pathlength, and c = analyte concentration.ATR spectra cannot be used with a quantitative method developed using transmission spectra due to differences in the relative peak intensity of the absorption bands - a result of the internal reflection mechanism of ATR accessories. As an example, Figure 1 is a plot of the transmission and ATR spectra of caffeine .. A least squares relationship can be drawn for ATR spectra of quantitative samples, however,similar to that for transmission data from KBr pellets. Figure 5. Least squares plot of the ATR data Experimental Results Micro-ATR spectra were collected using a Jasco 460-FTIR and a micro-ATR accessory equipped with ZnSe lenses and a single-reflection diamond ATR element. Sample aliquots of 5-10 milligrams were placed onto the ATR crystal and spectra collected without additional sample preparation. Figure 6. Least squares plot of the KBr pellet data Aliquots drawn from the standard powders were mixed with KBr, and with a hand press, used to produce KBr pellets and provide transmission spectra for correlation with the micro-ATR data.FT-IR spectra of 64 scans at 4 cmresolution were coadded and averaged to obtain the single-beam background and sample micro-ATR spectra. 32 scans at 4cm resolution were used to collect the single-beam background and KBr pellet transmission spectra. Figures 2and 3 compare the fingerprint regions of the micro-ATR spectra of the components used in the study; caffeine and starch in the first mixture, Ibuprofen and starch in the second.The analyte bands selected for the analysis of each component are labeled. Three aliquots were analyzed for each powder standard using the micro-ATR and KBr pellet methods. Two analyte bands were selected for each component in each mixture and peak ratios calculated based on the ratio of the peak heights of t he active ingredient vs. the starch. An example of the repeatability of the micro-ATRmeasurement is demonstrated in F i gure 4, containing three spectra of a 25%concentration of ibuprofen in starch. Figure 5 is a least squares plot of the ATR data, following the 743 and 995 cm'bands for caffeine and starch, respectively.Figure 6 is the least squares plot of the KBr pellet data using the same analyte bands. Table 1 contains the R and R values for the least squares analysis of t he data from the two mixtures using the different analyte bands for each component. These results demonstrate that the micro-ATR method can provide repeatable quantitative results that are comparable to KBr pellet data. Table 1: Least Squares Residuals Data Caffeine/Starch Mixture R R‘ ATR-743/995 cm-1 0.9738 0.9484 ATR-1546/1148 cm° 0.9589 0.9196 KBr-743/995cm-1 0.9764 0.9533 KBr-1546/1148 c-1m° 0.9616 0.9246 Ibuprofen/Starch Mixture ATR-1230/995 cm° 0.9474 0.8976 ATR-779/1148cm-1 0.9535 0.9091 KBr-1230/995 cm°-1 0.9731 0.9469 KBr-779/1148cm°-1 0.9741 0.9489 Conclusions A single reflection micro-ATR is an easy-to-use accessory for the analysis of powdered mixtures .The ATR technique is simple, rapid and very reliable for sample quantitation. The analysis method is non-destructive and can be used to collect data from a minimal amount of sample, providing quantitative results similar to KBr pellet spectra. Acknowledgements: Golden Gate ATR Accessory provided by: Specac Inc 500 Technology Court, Smyrna, GA 30082 Tel: 800 447 www.specac.com Contact: 8649 Commerce Dr.Easto n, MD 21601
确定
还剩1页未读,是否继续阅读?

产品配置单

佳士科商贸有限公司为您提供《用FTIR-ATR定量分析粉末状固体》,该方案主要用于其他中ATR定量分析检测,参考标准--,《用FTIR-ATR定量分析粉末状固体》用到的仪器有JASCO傅立叶变换红外光谱仪FT/IR-6000
相关方案
更多
该厂商其他方案
更多