


方案详情
文
在本申请说明中,使用IR和拉曼显微光谱依次分析了喷涂塑料颗粒的样品的成分分布。
关键词:拉曼显微镜、红外光谱显微镜、IQ Frame、QRi、图谱、微塑料、蛋白质
方案详情

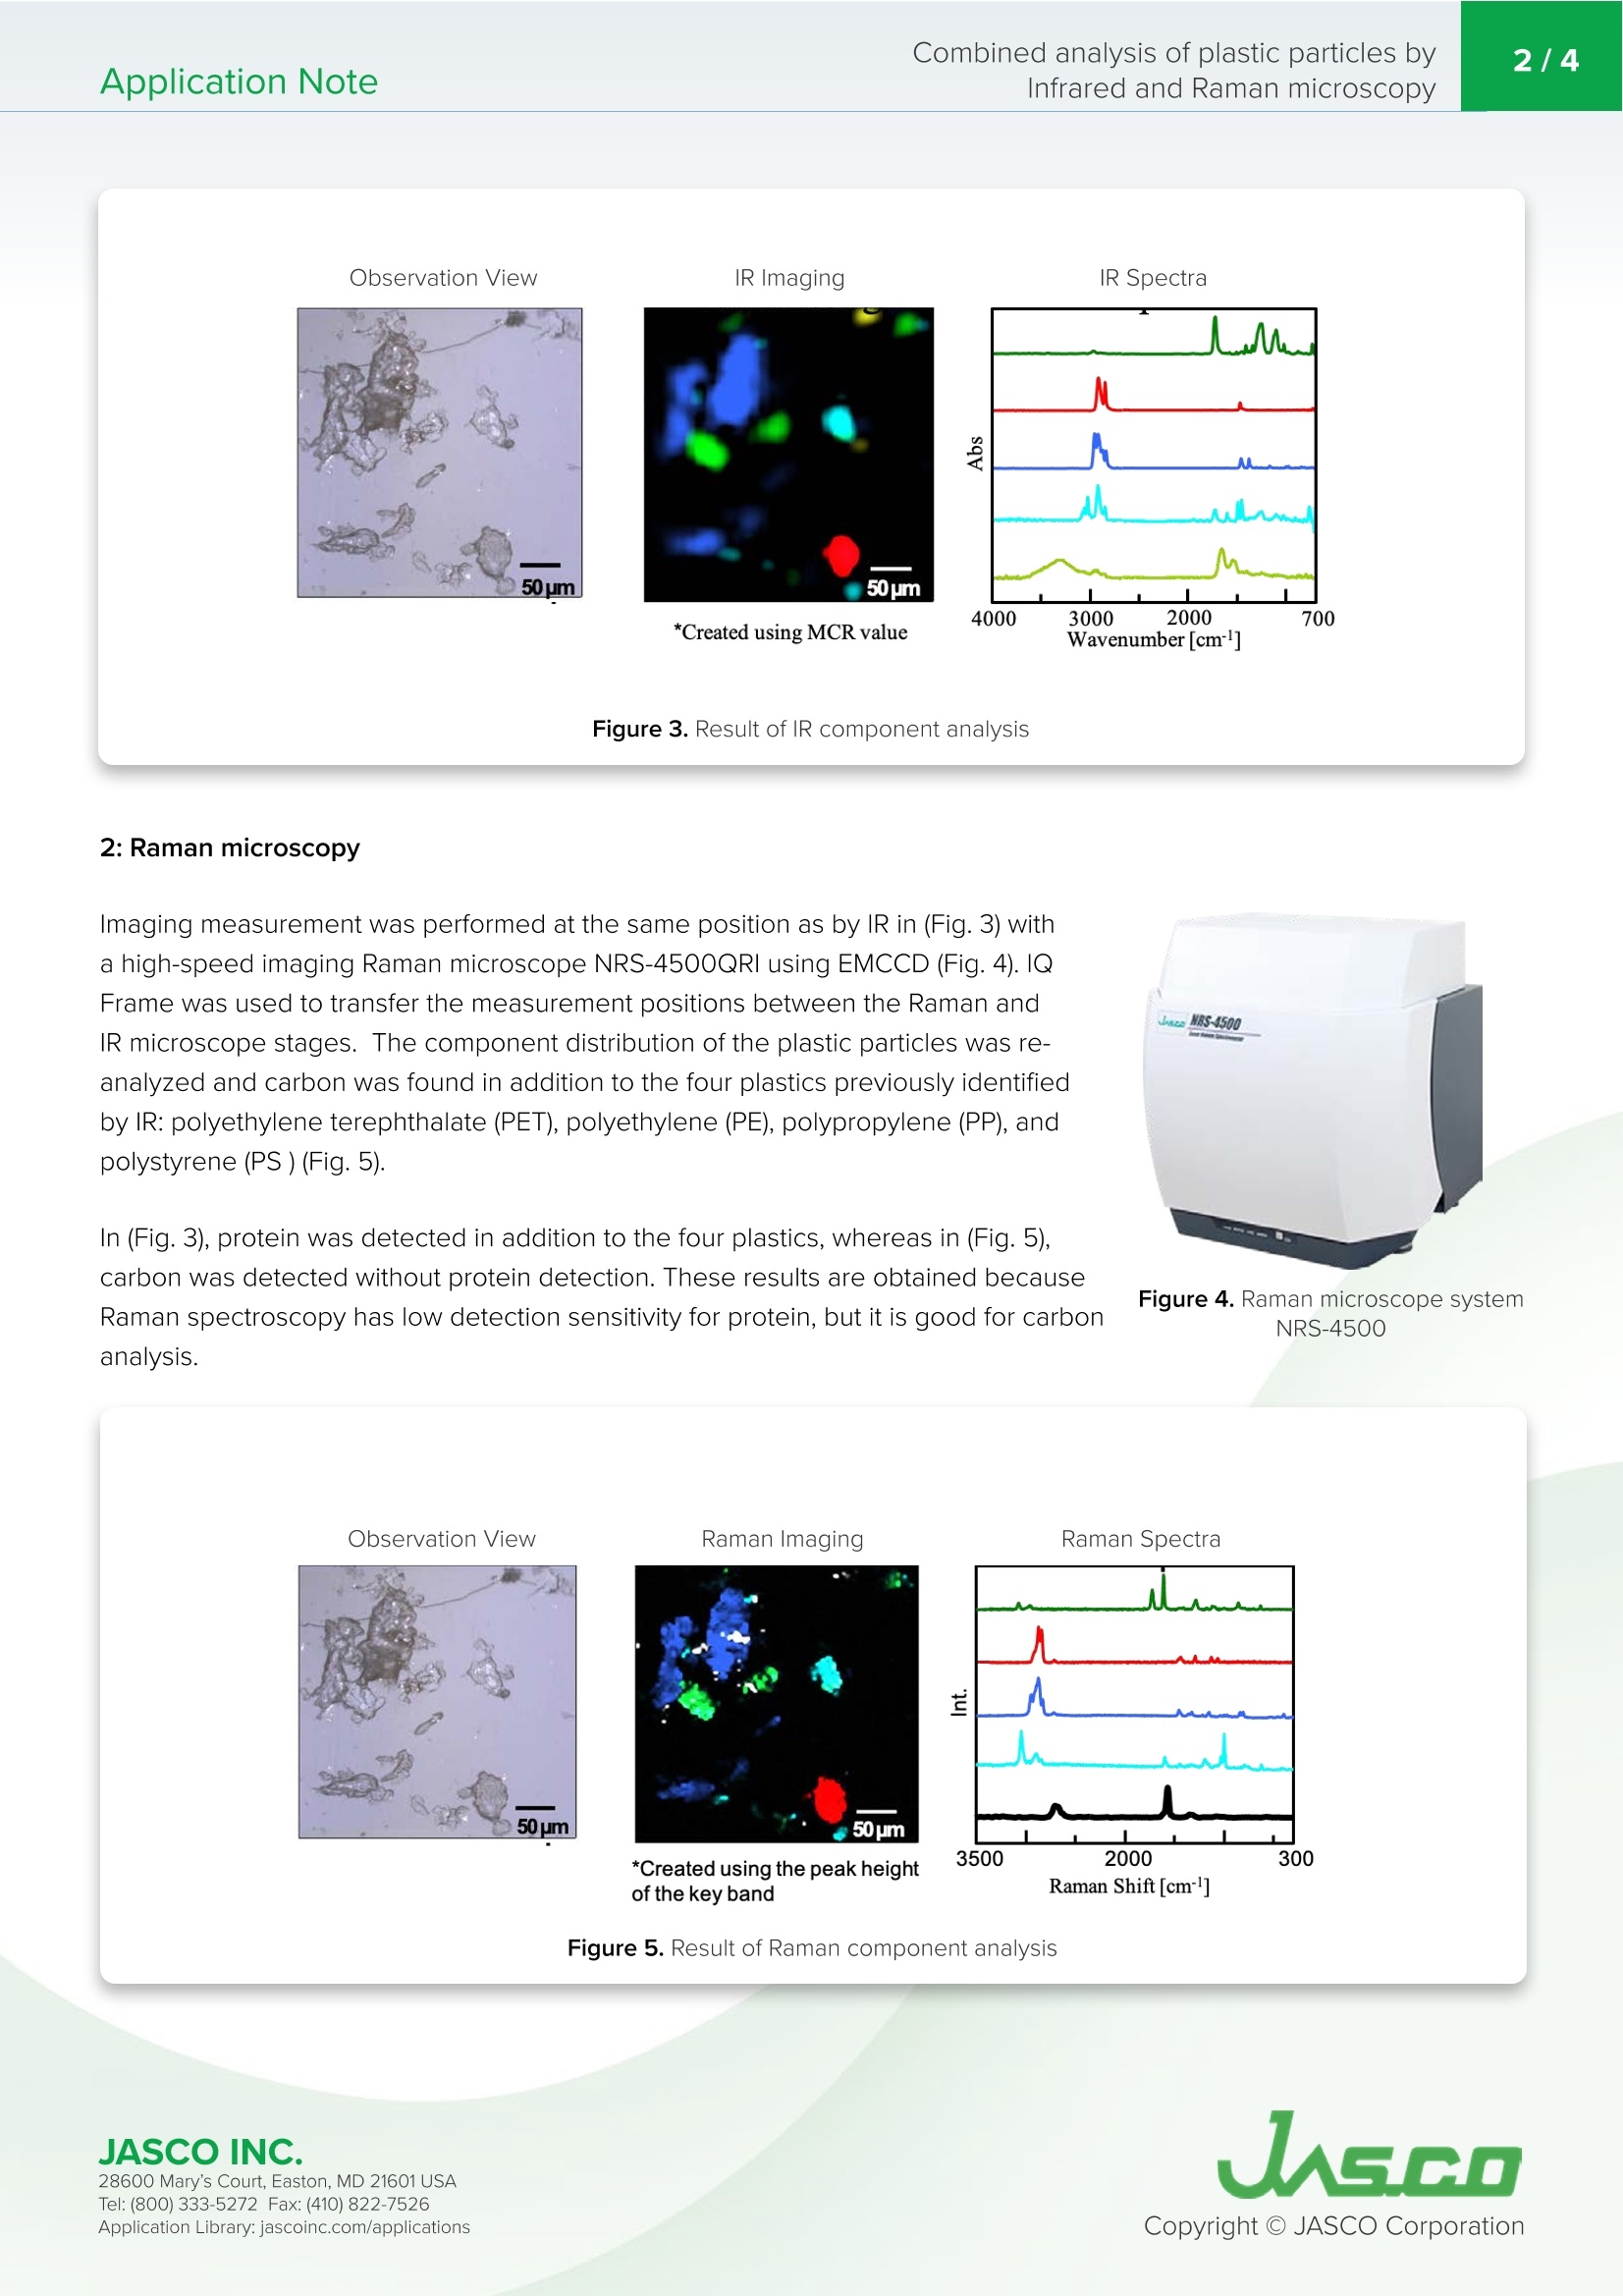
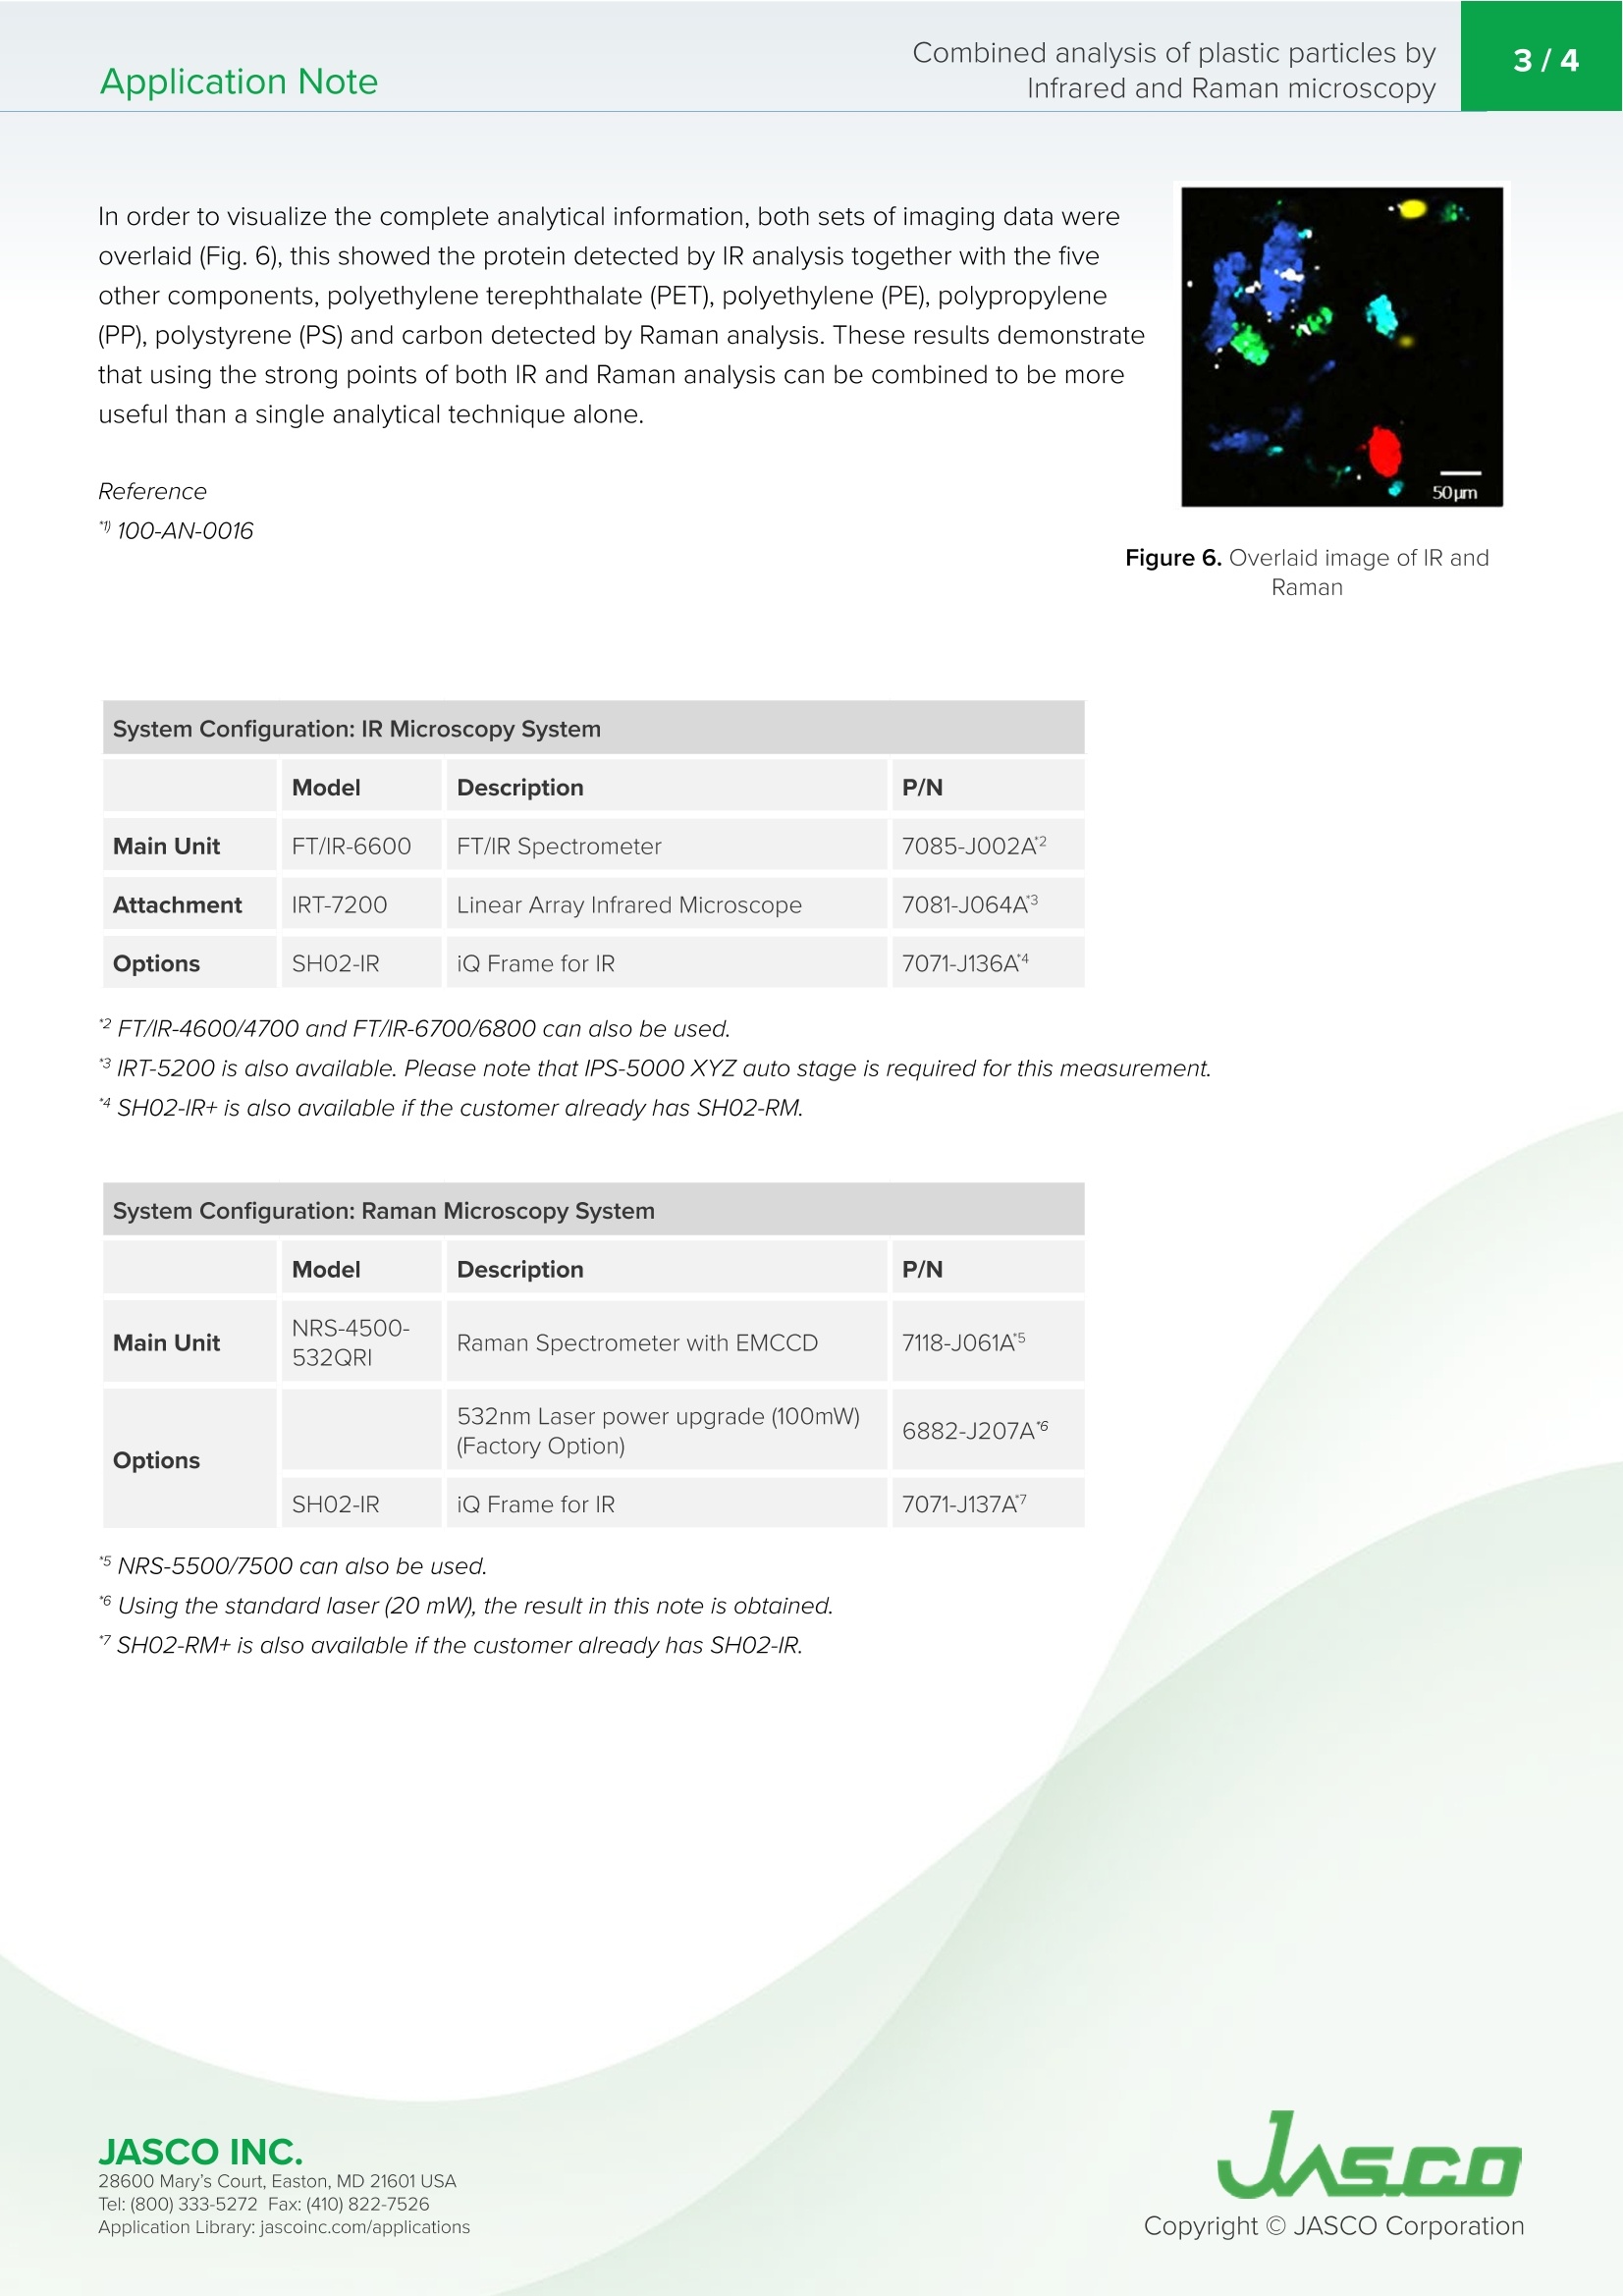
红外显微镜(IR)和拉曼显微镜是从分子振动中分析分子结构的优秀方法,这些分析方法都有其独特的优点。一方面,有一个大型的有机物质红外光谱数据库,这是用户在识别未知外来物质时的主要吸引力。红外也有助于用拉曼光谱分析更具有挑战性的蛋白质。另一方面,拉曼光谱非常适合于有机物、无机材料和碳基材料的分析,而红外分析则更加费力。通过结合这两种技术,可以获得比单独分析更详细的信息。新开发的IQ框架极大地提高了这种比较分析的准确性,该框架是一种附件,可以在完全相同的样品位置进行IR和拉曼测量(图1)。为了证明这一点,在本申请说明中,使用IR和拉曼显微光谱依次分析了喷涂塑料颗粒的样品的成分分布。Application Note100-AN-0028 Combined analysis of plastic particles byInfrared and Raman microscopy2/4Application Note Introduction Infrared microscopy (IR) and Raman microscopy are excellent methods for the analysis of molecular structure from molecular vibrations, each of these analytical method has i ts own distinct merits. On the one hand, there is a l arge database of IR spectra for organic substances, a major attraction to users when identifying unknown foreign materials . IR is also useful for the analysis of proteins that are more challenging by Raman spectroscopy. On the other hand, Raman spectroscopy is well suited to the analysis of organics, inorganic and carbon-based materials, which can be more arduous by IR. Figure 1. IQ Frame By combining both techniques it i s possible to obtain much more detailed information than from either analysis by i tself. The accuracy of this comparative analys i s has been dramatically improved by the newly developed IQ frame *1),an accessory i n which IR and Raman measurement can be performed at exactly the same sample position (Fig. 1). To demonstrate this, i n this application note, the component distribution of a sample sprayed with plastic particles was sequent i ally analyzed using both IR and Raman micro-spectroscopy. K ey words Raman microscopy, FTIR microscopy, IQ Frame, QRi, mapping, microplastics, protein Experimental 1: IR microscopy As a result of analyzing the component distr i bution of plastic particles using an FT/IR-7200 high-speed imaging linear-array IR microscope (Fig.2), protein was found in addit i on to four plastics: polyethylene terephthalate (PET ),polyethylene (PE), po l ypropylene (PP), and polystyrene (PS ) (Fig. 3). Figure 3. R es u lt of I R co mp on ent a n al y sis 2: Raman microscopy Imaging measurement was performed at the same position as by IR i n (Fig . 3) with a high-speed imaging Raman microscope NRS-4500QRI using EMCCD (Fig . 4). IQ Frame was used to transfer the measurement positions between the Raman and IR microscope stages. The component distribution of the plastic part i cles was re-analyzed and carbon was found in addition to the four plastics previously identi f ied by IR: polyethylene terephthalate (PET), polyethy l ene (PE), polypropylene (PP), and polystyrene (PS ) (Fig.5). In (Fig. 3), protein was detected in addition to the four plastics, whereas i n (Fig. 5),carbon was detected without protein detection . These results are obtained because Raman spectroscopy has low detection sensi t ivity for protein, but it is good for carbon analysIs. Figure 4. R a m a n mic r o s c op e sy stem NRS -4500 Figure 5. R esul t of R am an c ompo n en t an al ysis In order to visualize the complete analytical information, both sets of i maging data were overlaid (Fig. 6), this showed the protein detected by IR analysis together with t he five other components, polyethylene terephthalate (PET), polyethylene (PE), polypropylene (PP), polystyrene (PS) and carbon detected by Raman analysis. These results demonstrate that using the strong points of both IR and Raman analysis can be combined to be more useful than a single analytical technique alone. Reference ”100-AN-0016 Figure 6. Ove r laid i m a ge of I R a n d R am an System Configuration: IR Microscopy System Model Description P/N Main Unit FT/IR-6600 FT/IR Spectrometer 7085-J002A2 Attachment IRT-7200 Linear Array Infrared Microscope 7081-J064A3 Options SHO2-IR iQ Frame for IR 7071-J136A4 2FT/IR-4600/4700 and FT/IR-6700/6800 can also be used. 3/RT-5200 is also available. Please note that IPS-5000 XYZ auto stage is required for this measurement. 4SH02-/R+ is also available if the customer already has SH02-RM. System Configuration: Raman Microscopy System Model Description P/N Main Unit NRS-4500-532QRI Raman Spectrometer with EMCCD 7118-J061A Options 532nm Laser power upgrade (100mW)(Factory Option) 6882-J207A6 SHO2-IR iQ Frame for IR 7071-J137A' 5NRS-5500/7500 can also be used. 6 Using t he standard laser (20 mW, the result i n this note is obtained. JASCO IN C. 28600 Mary's Cour t , E asto n, MD 21601US A T el : (800) 333-5272 F ax: (410) 822-7526 A ppli c a tio n Lib r ary: jasc o i n c.com /appli c ati o ns Measurement Conditions: IR Microscopic System Mode Transmission mode (16x Cassegrain objective) Resolution 8cm² Accumulation x1 Measurement Area 400 um x 400 um (12.5 umx12.5 um/pixel) Measurement Points 32x 32 points (1024 points,measurement time: approx. 10 seconds) Measurement Conditions: Raman Microscopic System Objective Lens 20x Exposure Time 0.5 secs Accumulation x1 Measurement Area 348 um x 368 um (4 umx4 um interval) Measurement Points 88 points x 93 points (8184 points, measurement time: approx. 70 min.) In this note, only t he area used for analysis i s displayed from the measured area. JASCO IN C. 28600 Mary's Cour t , E asto n, MD 21601US A T el : (800) 333-5272 F ax: (410) 822-7526A ppli c a tio n Lib r ary: jasc o i n c.com /appli c ati o ns
确定
还剩2页未读,是否继续阅读?

产品配置单
佳士科商贸有限公司为您提供《塑料颗粒的红外和拉曼显微镜联合分析》,该方案主要用于生物药品药物研发中塑料颗粒、成像、成分分布检测,参考标准--,《塑料颗粒的红外和拉曼显微镜联合分析》用到的仪器有JASCONRS5000/7000共聚焦激光拉曼光谱仪
相关方案
更多
该厂商其他方案
更多