


方案详情
文
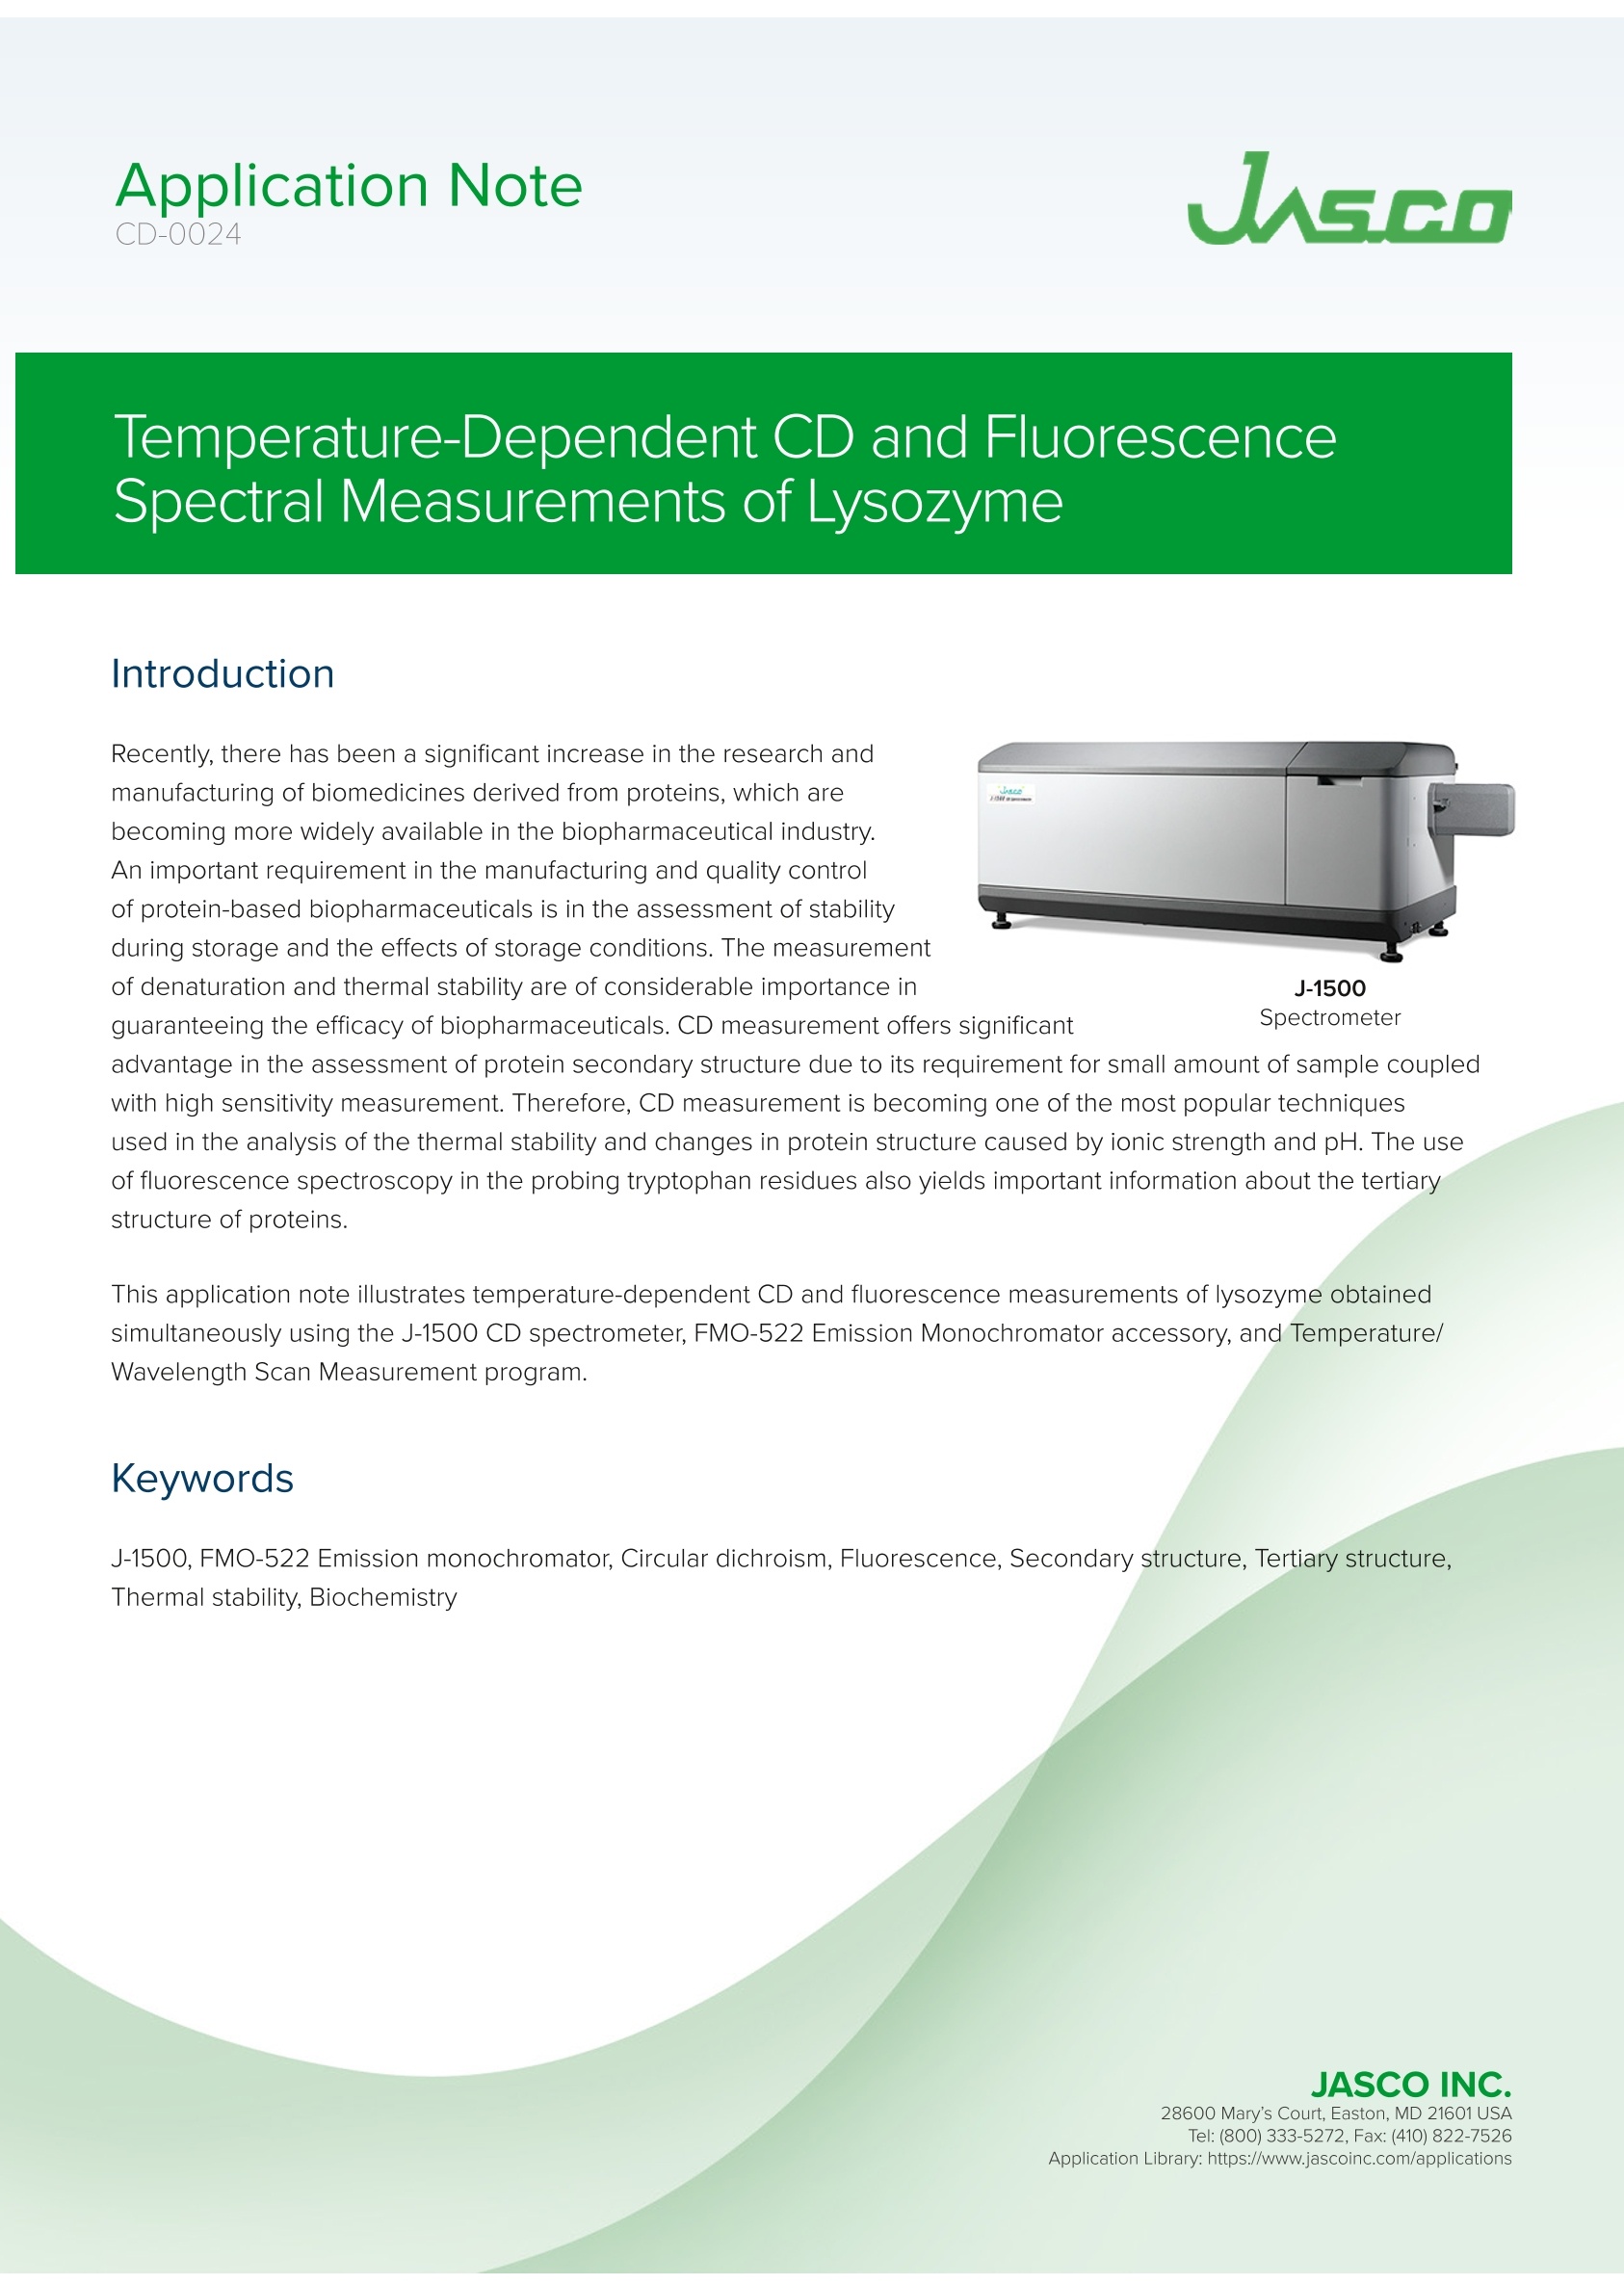
本申请说明说明了使用J-1500 CD光谱仪、FMO-522发射单色仪附件和温度/波长扫描测量程序同时获得的溶菌酶的温度相关CD和荧光测量结果。
关键词:J-1500,FMO-522发射单色仪,圆二色性,荧光,二级结构,三级结构,热稳定性,生物化学
方案详情

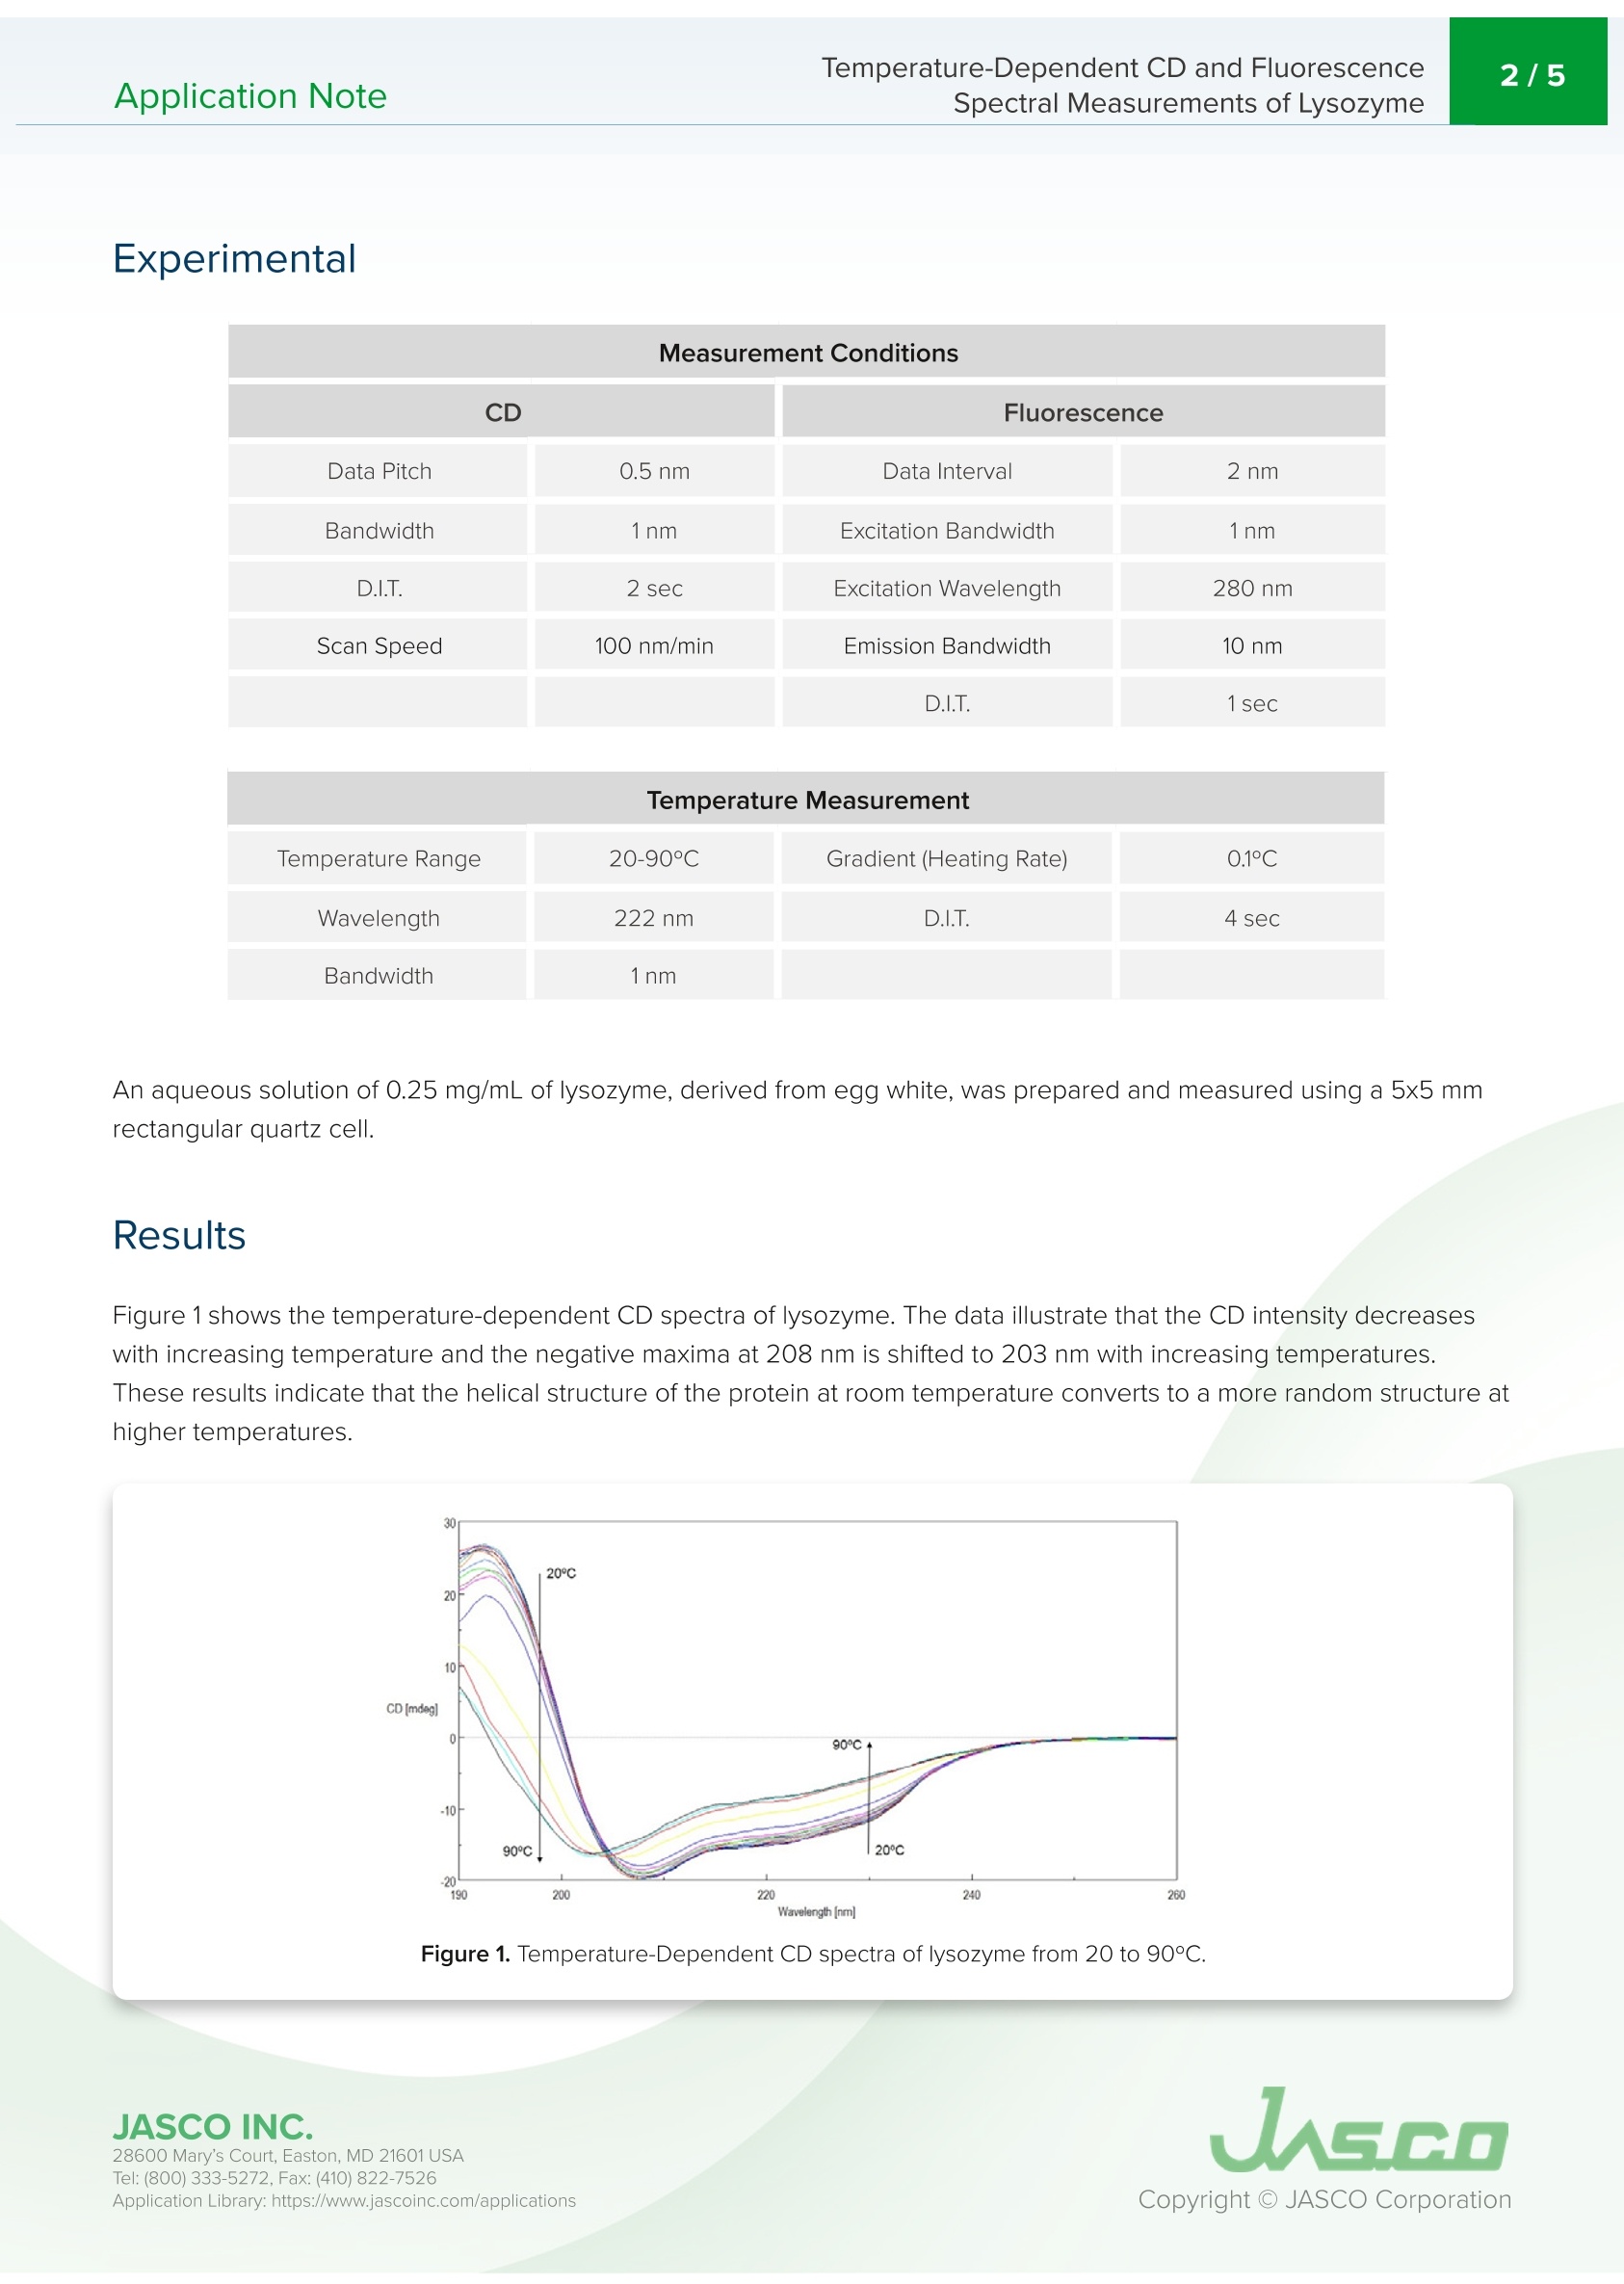
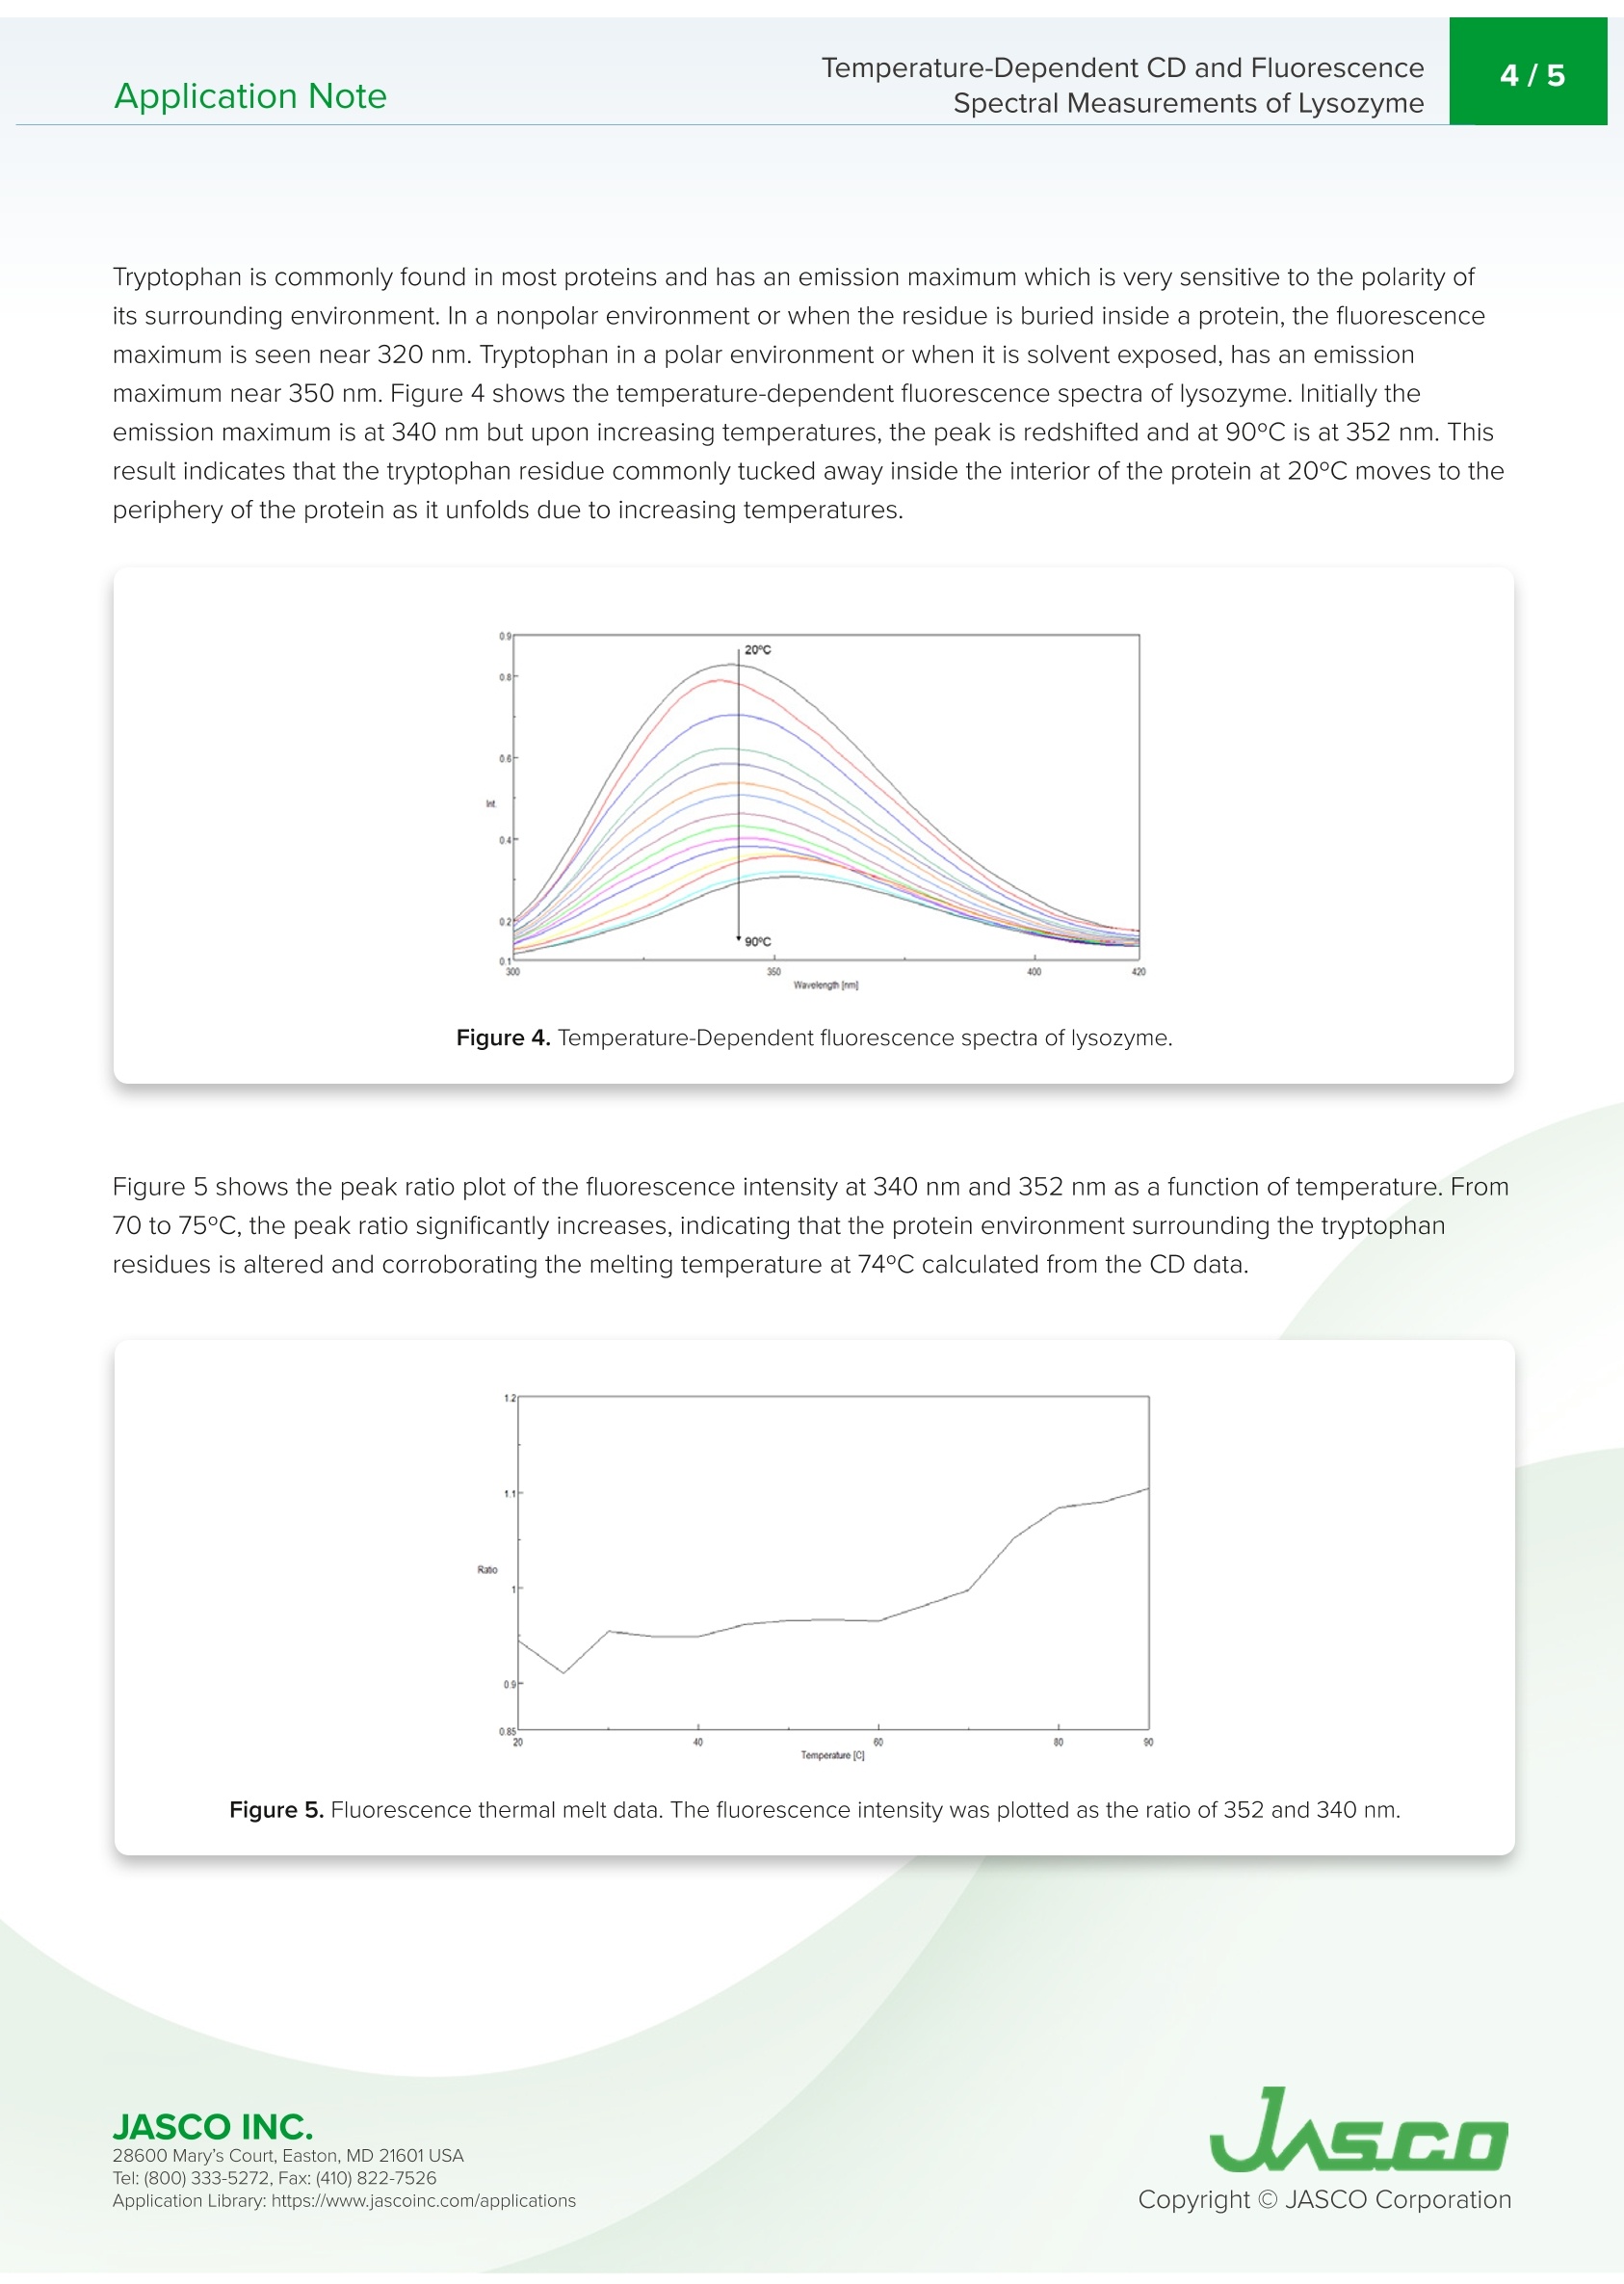
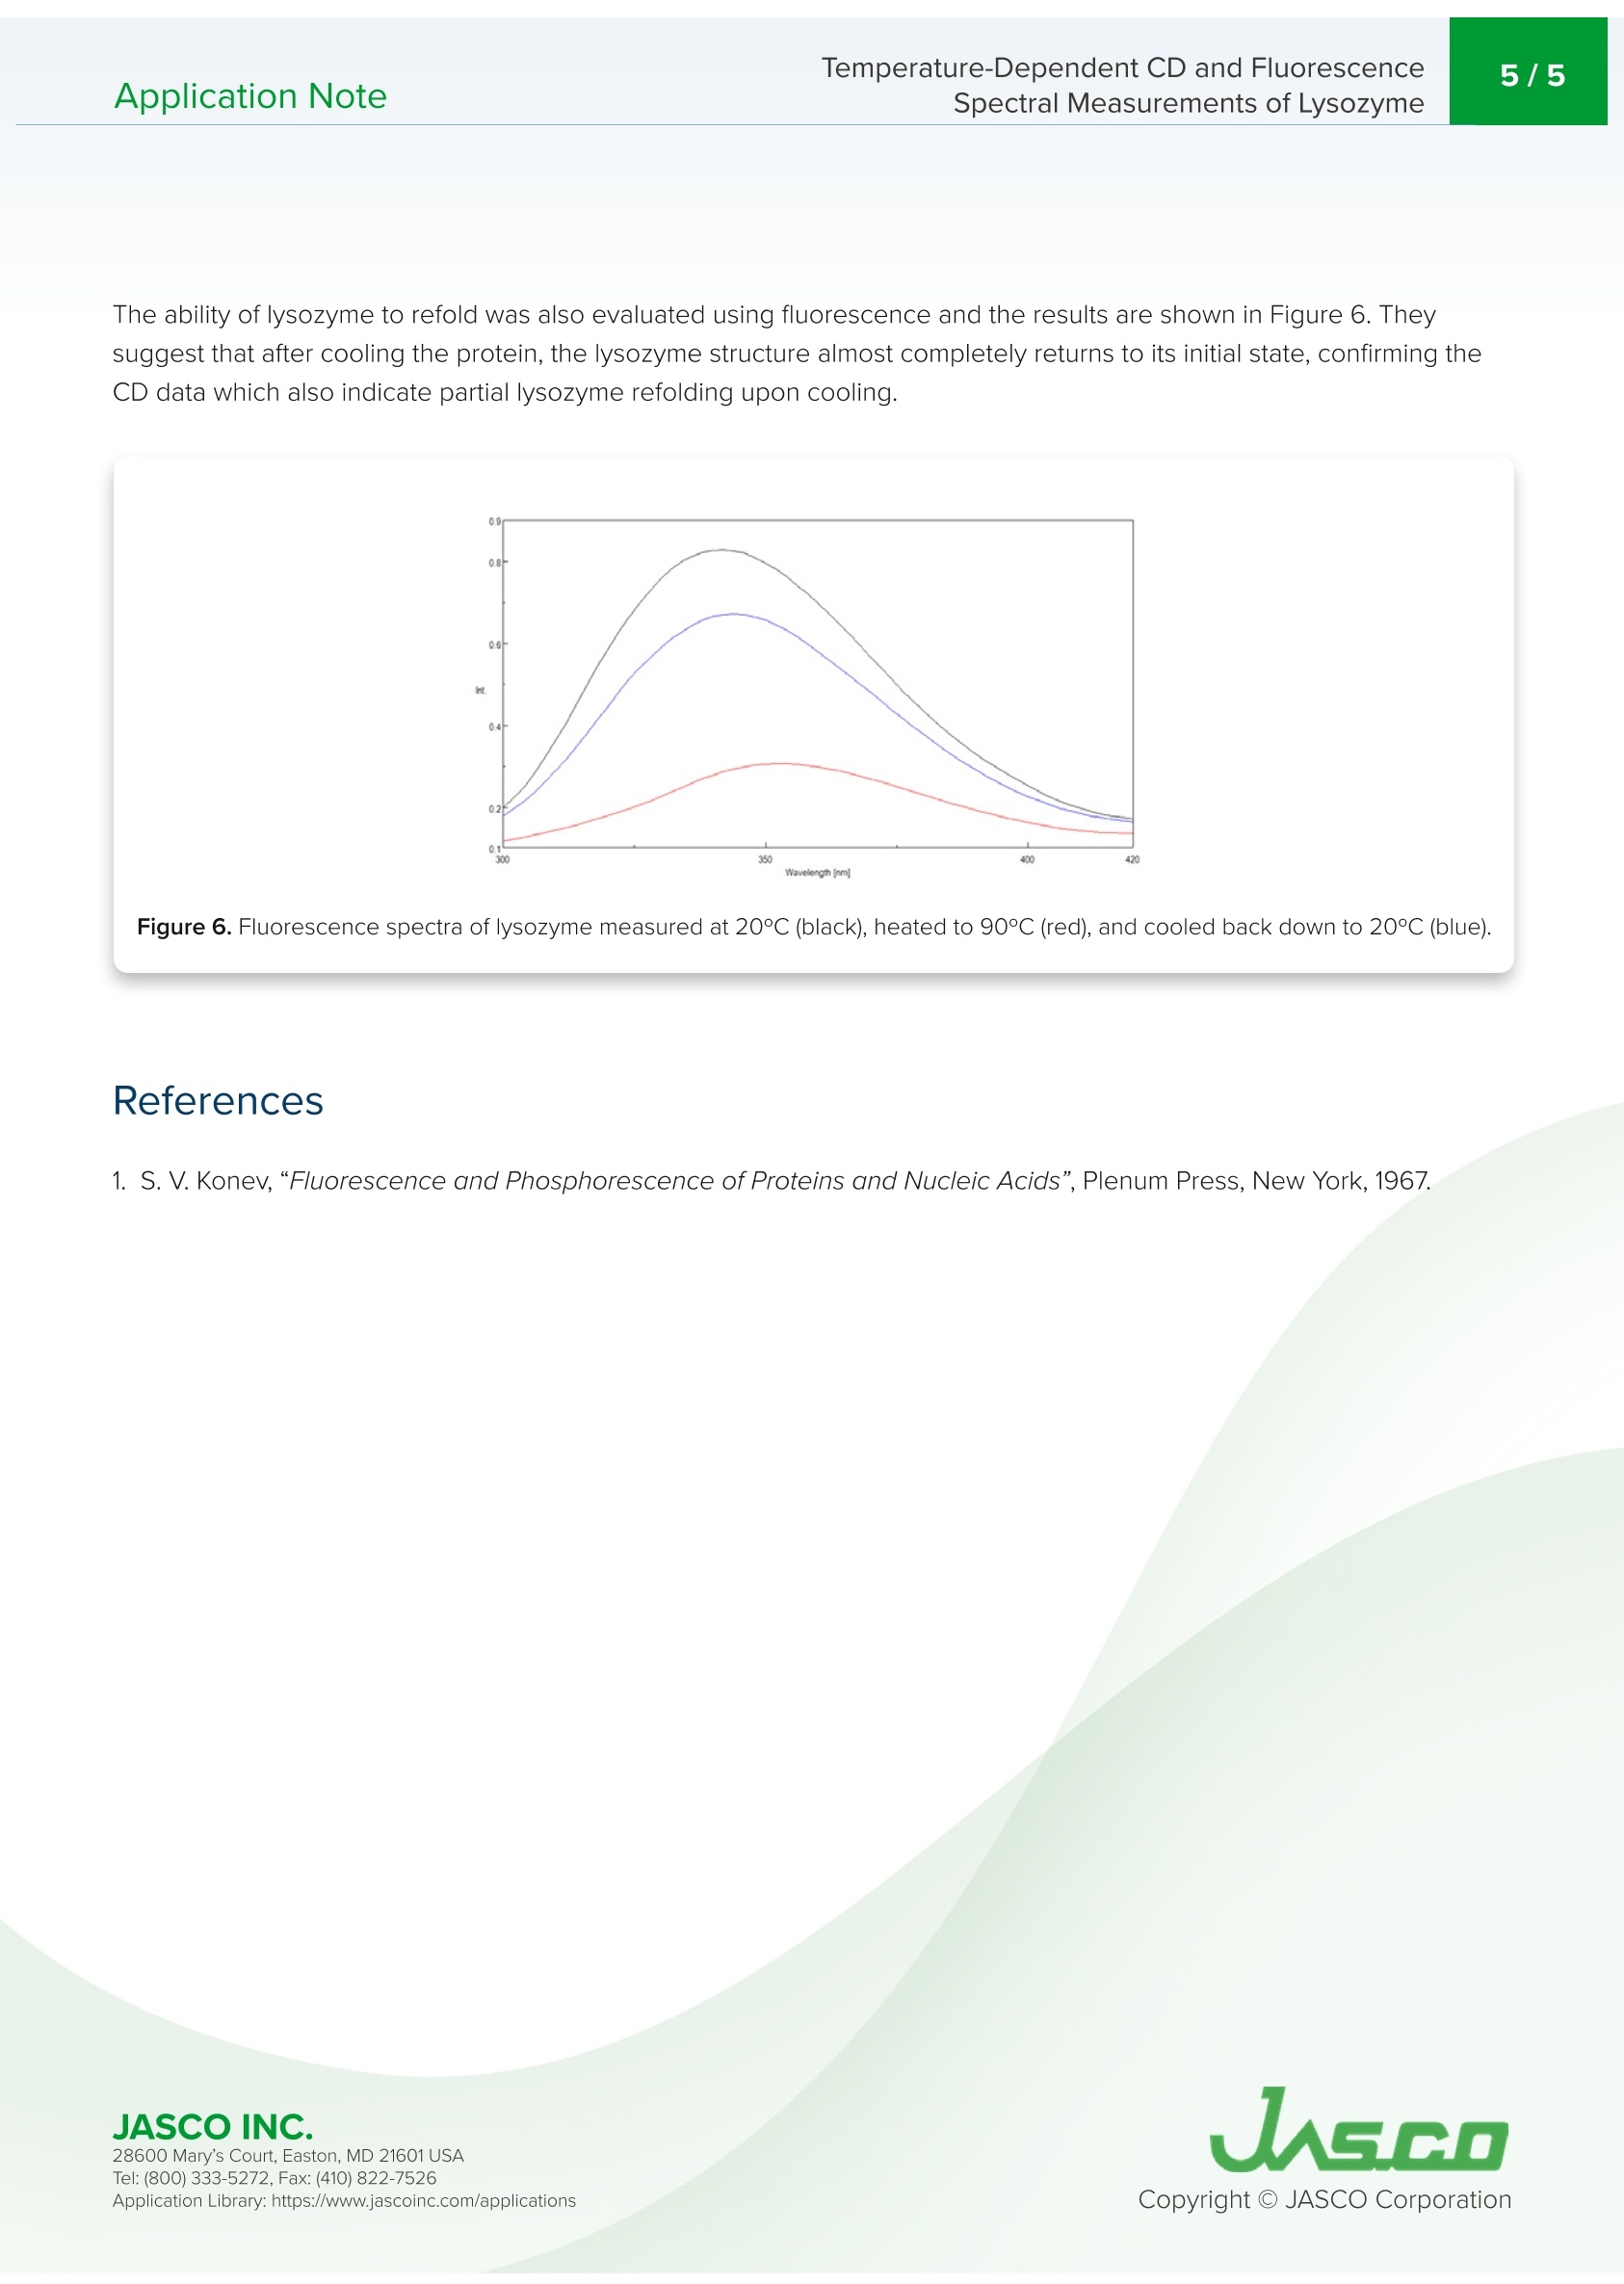
最近,蛋白质衍生的生物医药的研究和制造显著增加,这些药物在生物制药行业中越来越广泛。基于蛋白质的生物制药的制造和质量控制的一个重要要求是评估储存过程中的稳定性和储存条件的影响。变性和热稳定性的测量对于保证生物药物的功效具有相当重要的意义。CD测量在蛋白质二级结构的评估中提供了显著的优势,因为它需要少量的样品和高灵敏度的测量。因此,CD测量正成为分析离子强度和pH引起的蛋白质结构的热稳定性和变化的最流行技术之一。在探测色氨酸残基中使用荧光光谱也产生了关于蛋白质三级结构的重要信息。Application NoteCD-0024 2/5 Temperature-Dependent CD and Fluorescence Spectral Measurements of Lysozyme I ntroduction Recently, there h as been a significant inc r ease i n the r esearch and ma n ufacturing of biomedicin e s de r ived from protein s , w h i c h are becoming more widely available in the biophar m aceutical i ndustry.An i mportant requiremen t in t h e manufactur i ng and quality cont r ol of p rote i n-bas e d biopharmaceu ti c a ls i s i n th e a s ses sm e nt of st a bil it y during storage and the effects of storage conditio n s. The measureme n t of de n aturat i on and thermal stability are of considerable i mportance in J-1500 guaranteei n g th e eff i cacy o f biopharmaceuticals. CD meas u r ement of f e r s significant S p ectromete r advantage in the assessme n t of protein secondary structure d u e to its requiremen t for small amount of sample coupled wi t h high sen s it i vity meas u rement . The r efore, CD measureme n t i s b ecomi n g o n e of the most p opular techniques used in the a n a l ysis of the thermal stability and changes in p rotei n structure caused by i on i c st r ength and pH. The u s e of f l uorescence spectroscopy in the probing t r yptophan residues also y i el d s i mportant i nformation about the tertia r y st ru ctu r e of p rote i n s. T h is application n ote illust r ates t e mpe r at u re -depe n de n t CD a nd f l uor e sc e nc e m e asurement s of lyso z yme obtai n ed simu l taneously using the J -1500 CD spectrometer, FMO-522 Emission Monoc h romator accessory,and Temperature/Wavele n gt h Sca n Measu r ement program. K eywords T emperature-Dependent CD and Fluorescence Application Note Spectral Measurements of L ysozyme Measurement Conditions CD Fluorescence Data Pitch 0.5nm Data Interval 2nm Bandwidth 1nm Excitation Bandwidth 1nm D.I.T. 2 sec Excitation Wavelength 280nm Scan Speed 100 nm/min Emission Bandwidth 10nm D.I.T. 1sec Temperature Measurement Gradient (Heating Rate) 0.1°C Wavelength 222nm D.I.T. 4 sec Bandwidth 1nm An aqueous so l u tio n of 0.25 mg/mL of lysozyme, derived from egg wh i te, was prepared a n d m easured using a 5x5 mm r ect a ngu la r quartz cell. Resu l ts Figure 1 shows t h e tempe r ature-depende n t CD spectra of l ysozyme. The d a ta il l ustrate t h at the CD i ntensity decreases wit h i n c r easing temperature and the negat i ve maxima at 208 nm i s sh if ted to 203 nm wit h increasing temperatures.T hese re s ults indic a te th a t the he li c a l str u ctur e of t h e prot e i n at r oom temperatu r e convert s to a more r a ndom struct u re a t higher temperatu r es. Figure 1. Tempe r a ture-Depe n de n t CD spec t ra of l ys oz yme f rom 20 to 90℃. T empe r ature-Dependent CD and Fluo r escence Application Note Spectral Measurements of L ysozyme To determ i ne the transition temperature of the seconda r y structu r e conversion , the CD sig n al was monitored at 222 nm as a funct i on of temperature . F i gure 2 illustra t e s th a t from 70 to 80°C, th e CD i nte n sity d r a s t i cally dec r eases and t h e melt i ng temperature (Tm ) was calculated t o be 74.38°C. Figure 2. CD t her m al melt d a ta of lysozyme at 222 nm. Once the initial melt was com p lete, the lysozyme solution was coo l ed bac k down to 20°C, to verify f olding was reversible.F i gure 3 shows the CD spect r um of the i n itial 20℃ spectrum (black) compared with the spectrum measured at 90°℃ (red)a n d a t 20°℃ a ft e r th e melt (b lu e). The sp e ct r a before and a f ter a re very similar, indic a ti n g t h at t he p rotein does r e fold o n ce the tempe r at u re is r educed , however, t he refolding process is not complete. Figure 3. C D spect r a of lysozyme measured at 20°C (black), heated to 90°C (red), a n d cooled b ac k d o wn to 20°℃ (b l ue). 28600 Mar y 's C o ur t , Eas t o n, M D 21601US A T emperature-Dependent CD and Fluorescence Application Note Spectral Measurements of L ysozyme Tryptophan is commonly fou n d in most prote i ns and has an emission maximum whic h is very sensiti v e to the polarity of i ts surrou n ding e nvi r onment . In a n onpolar enviro n ment or w h en th e r e sidue is b uri e d i nsid e a prote i n, th e f l uoresc e n ce maximu m is see n n ear 320 n m . Tryptophan i n a polar environme n t o r whe n i t is solvent exposed, h as an emission maximum nea r 350 n m. Figure 4 shows the tempe r ature-dependent f l uorescence spectra of l ysozyme. Initially the e mis s ion maximum i s at 340 n m but upo n incr e as i ng t e mperatures, t h e peak is r e dsh i f ted and at 90°℃ is at 352 nm. T his r esult i ndicates that t he tryptophan residue commonly tucked away inside the interior o f t h e protei n at 20°℃ moves to t h e periphery of the prote i n a s it u n folds due to i nc r ea s i n g temperatures. Figure 4. Te mp e r ature -Depende n t f l uo r escence sp e ctra of lysozyme. Figu r e 5 shows the peak ratio plot of the f l uorescence intens i ty at 340 nm and 352 n m as a funct i on of temperature. F r om 70 to 75°C, the peak ratio sig n if i cantly in cr e ases, in dicating that th e prot e i n environment surround i ng the tryptophan r esidues i s alte r ed and corrobora ti ng t h e me l t in g t empera tu re a t 74°C calc u lated from t h e CD data. Figure 5. F l uo r e s cen c e t h erma l mel t da t a. T h e f luo rescen c e inten s i t y was p lotted as the rat i o of 352 and 340 n m. JASCO INC. 28600 Mar y 's C o ur t , Eas t o n, M D 21601US A T empe r ature-Dependent CD and Fluo r escence Application Note Spectral Measurements of L ysozyme The ability of lysozyme to refold was also evaluated usi n g f lu o rescence a n d t h e results a r e shown i n Figure 6. They s u ggest that after cool i n g t h e p rotein , t he lysozyme struct u re almost completely ret urn s to i ts i ni t ial state, conf i rmi n g t h e CD data whic h also i ndicate partial lysozyme refold i ng upon cooling . Figure 6. F lu oresce n ce spectra of l ysozy m e measu r ed at 20°C (b lack), h eated to 90°c (r ed ), a n d coo l ed back down to 20°C (bl u e). Refe r ences 28600 Mar y 's C o ur t , Eas t o n, M D 21601US A
确定

还剩3页未读,是否继续阅读?

产品配置单


佳士科商贸有限公司为您提供《溶菌酶的温度相关CD和荧光光谱测量》,该方案主要用于生物药品药物研发中特殊物质和基团检测,参考标准--,《溶菌酶的温度相关CD和荧光光谱测量》用到的仪器有JASCO圆二色光谱仪CD J-1500、JASCOFP-8000系列荧光光谱仪
该厂商其他方案
更多