


方案详情
文
在本申请说明中,我们使用颗粒分析软件评估了金刚石抛光片中金刚石的分布。
关键词:拉曼光谱,QRi,图谱,颗粒分析,金刚石
方案详情

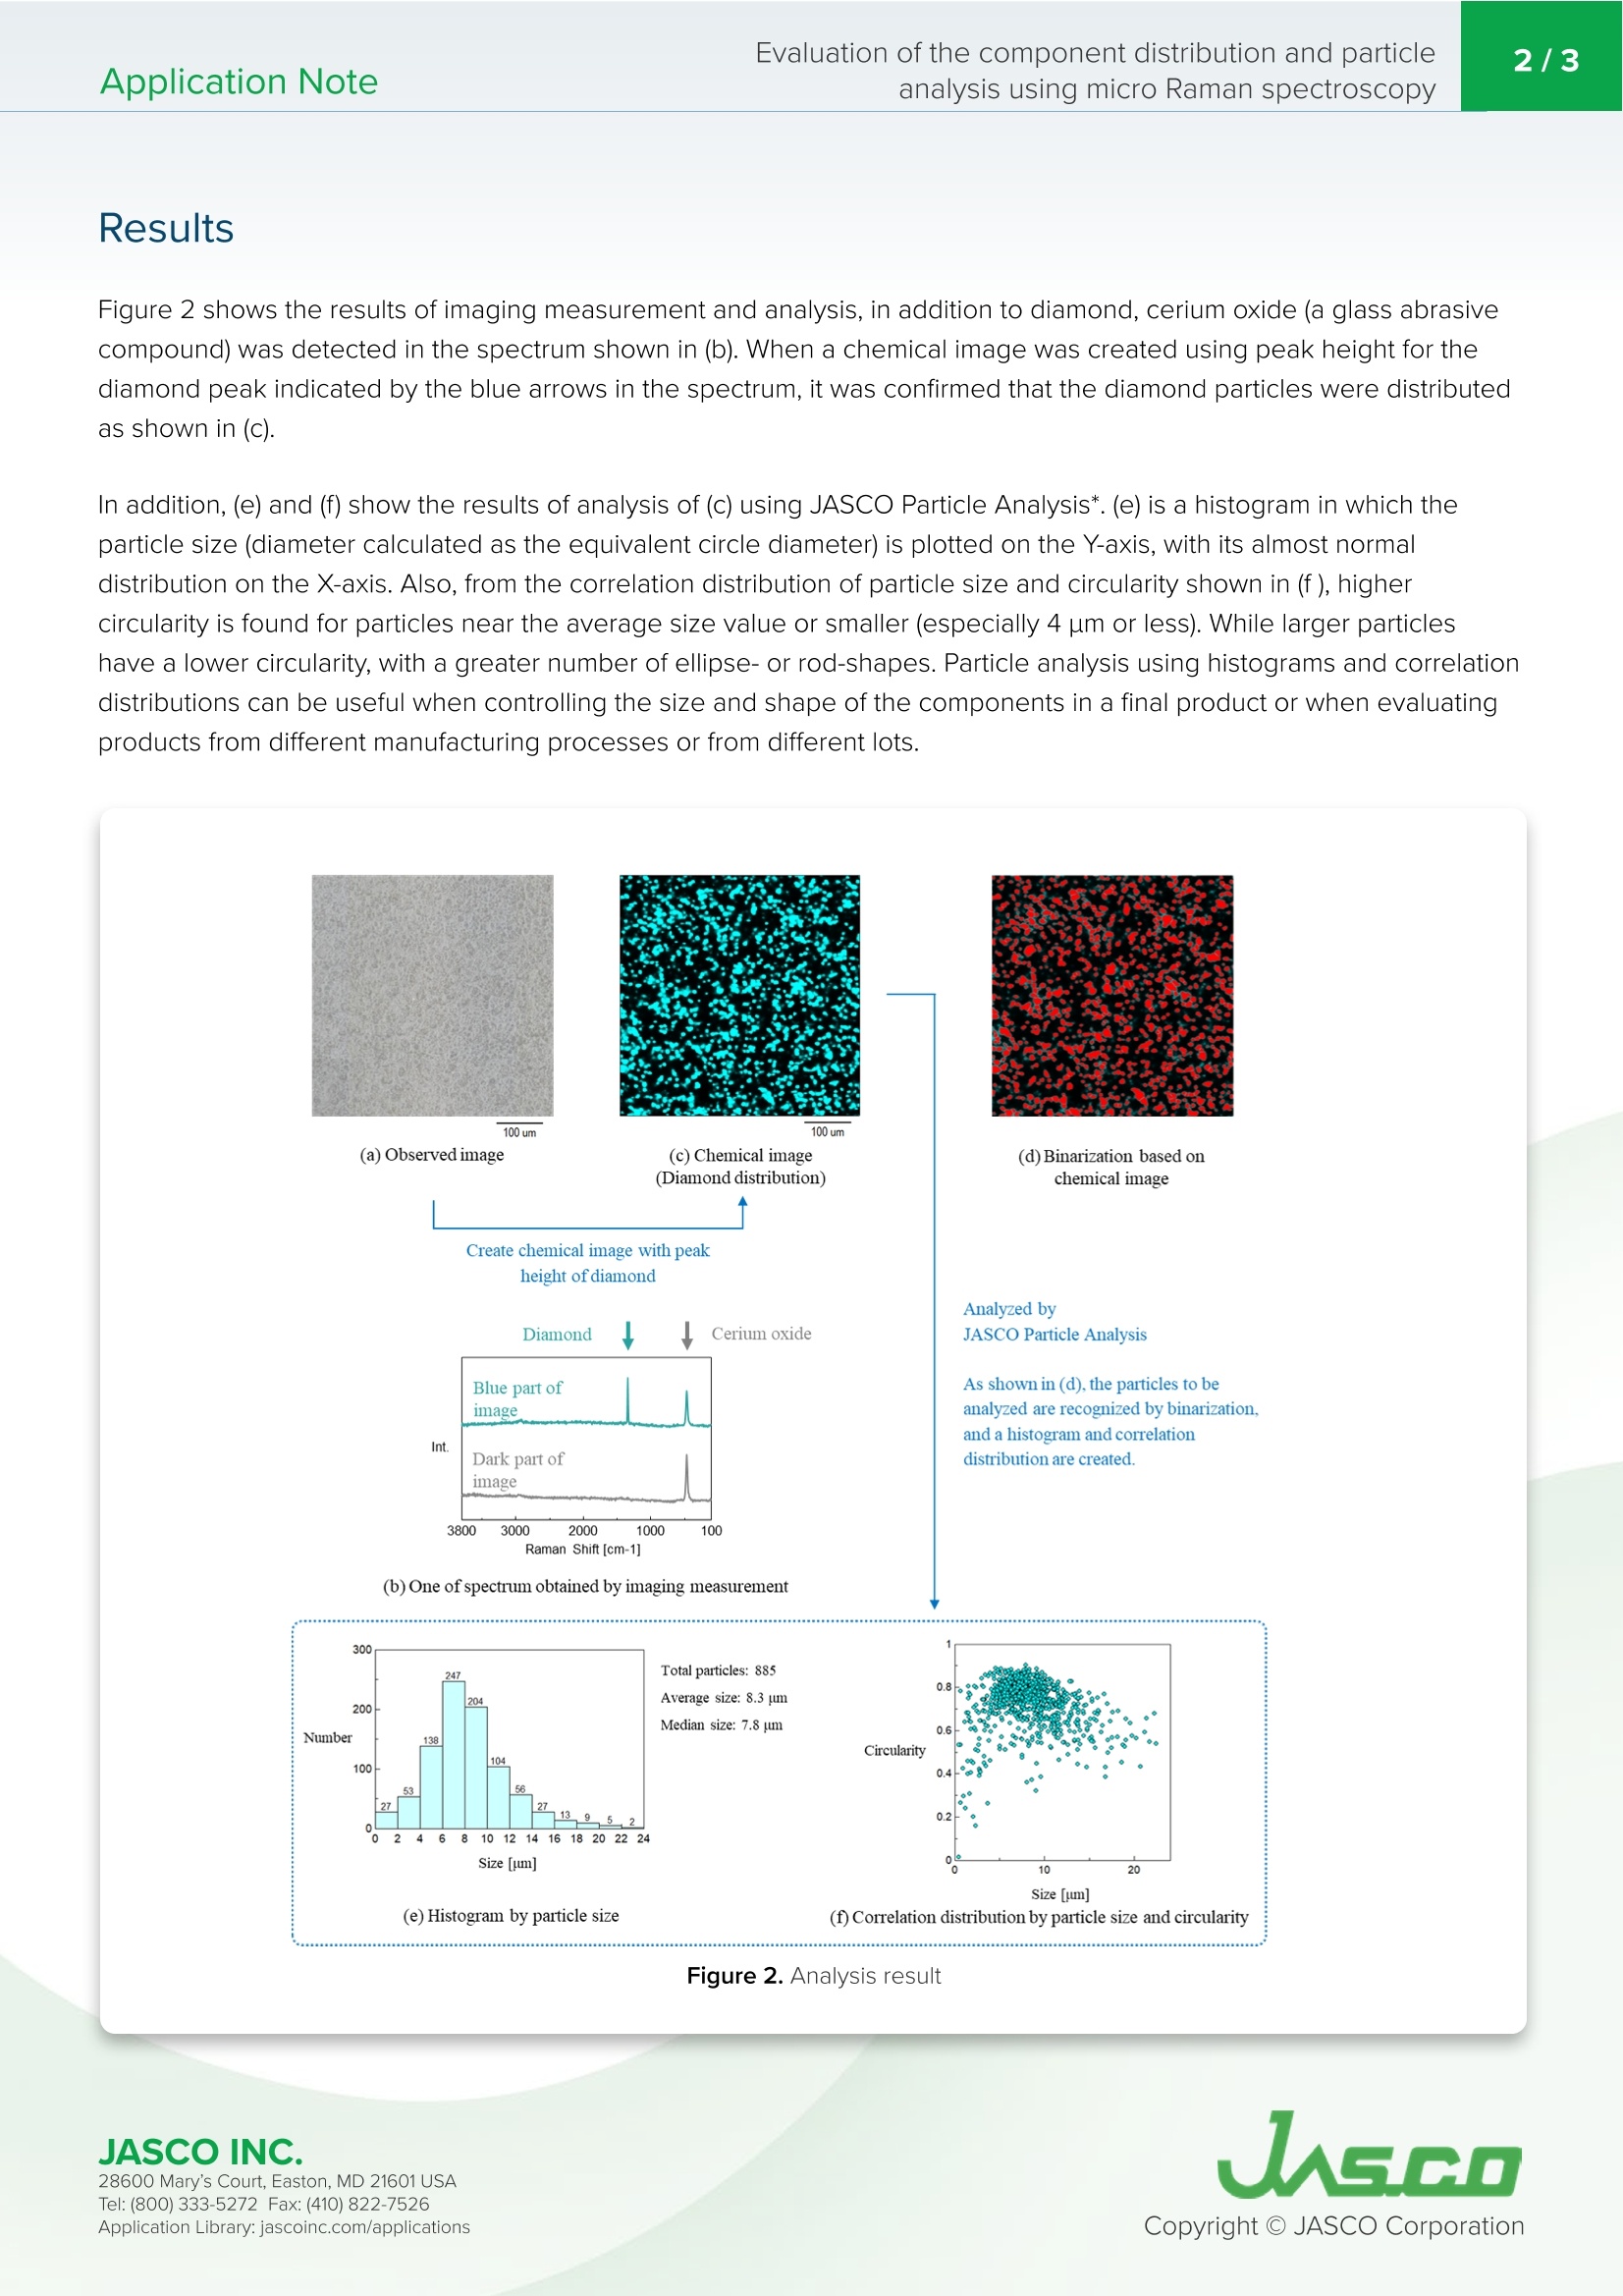
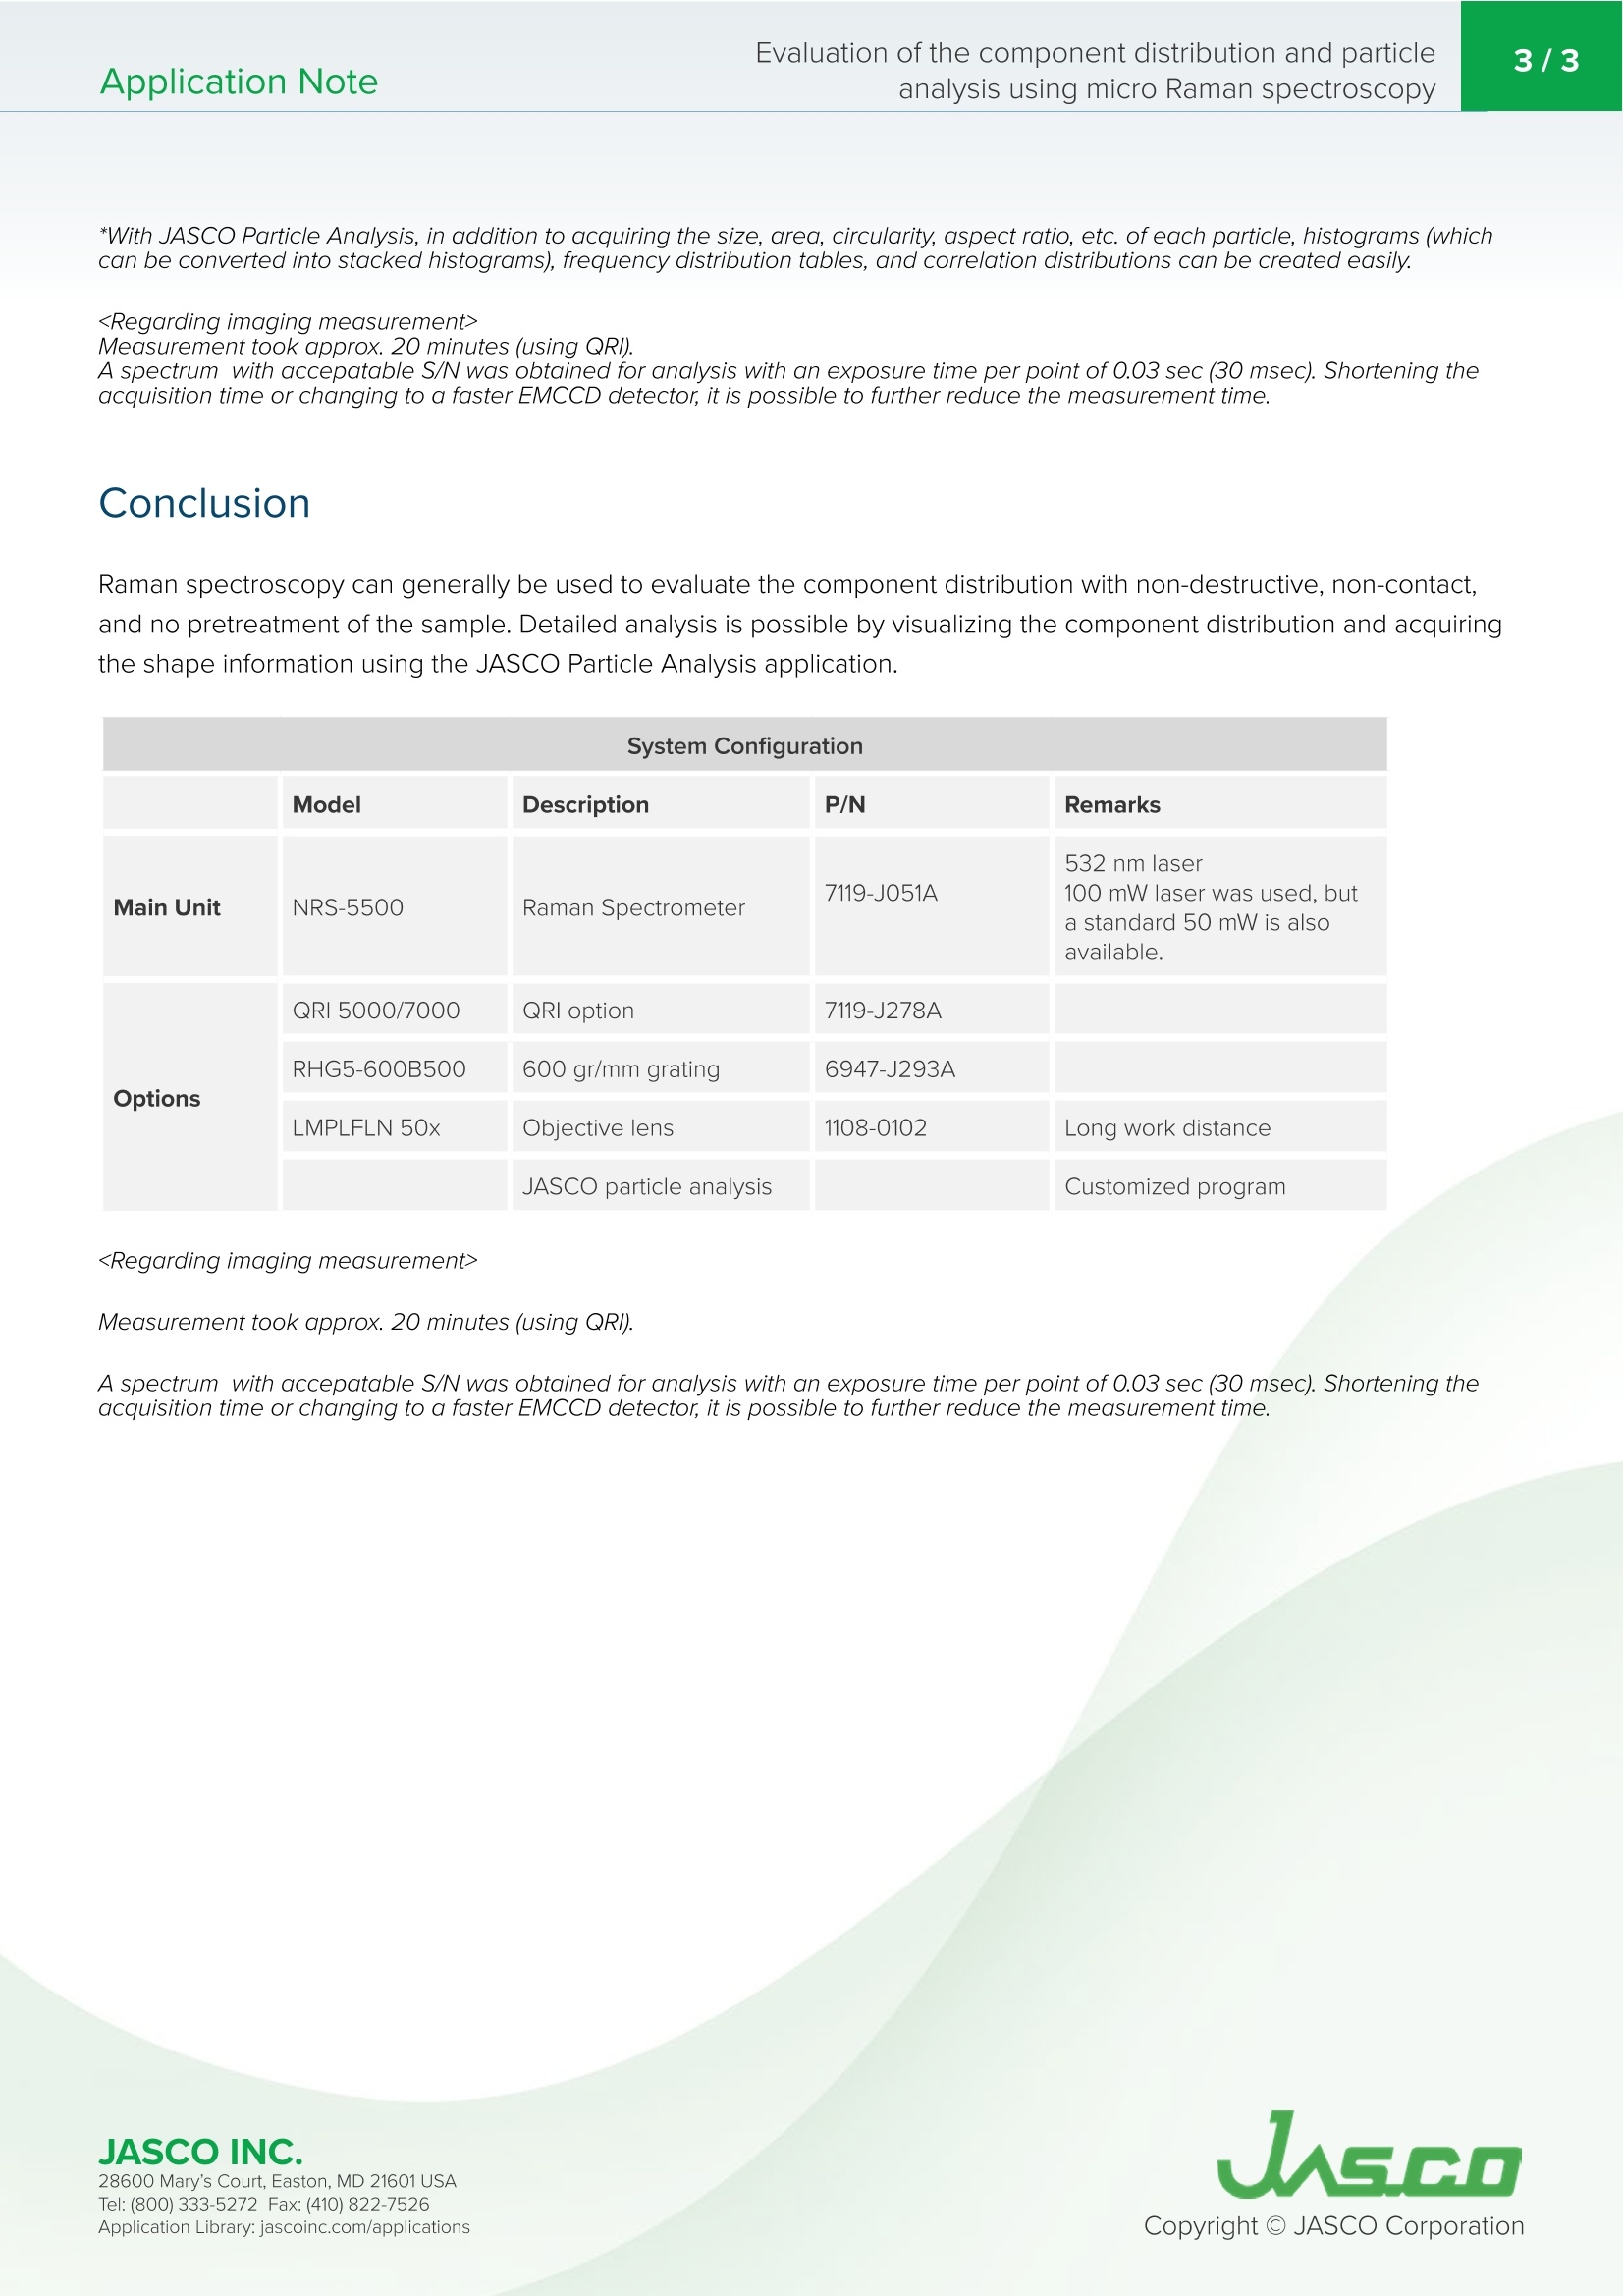
使用拉曼分光光度计进行分析通常不需要任何样品预处理;可以在没有直接接触的情况下无损地进行测量。因此,可以在保持样品完整性的同时评估成分分布。此外,通过JASCO颗粒分析程序,还可以评估颗粒尺寸和形状等的变化。颗粒尺寸分布可以与来自观察图像的样本形状信息一起显示为直方图,并与化学图像相结合。这种方法特别适用于分析各种不同的材料,如树脂、食品、药品和微塑料。本应用结论中拉曼光谱一般可用于评价样品在无损、不接触、不进行预处理时的组分分布。通过使用JASCO粒子分析应用程序可视化组件分布和获取形状信息,可以进行详细的分析。Application Note170-AN-0025 Evaluation of the component distribution and particleanalysis using micro Raman spectroscopy2/3Application Note Evaluation of the component distribution and particl e analysis using micro Raman spectroscopy Introd u ction Analysis using Raman a spectrophotometer does not typically require any sample pretreatment; measurement can be performed non-destructively and without direct contact. Therefore, it is possible to evaluate the component distr i bution while maintaining the sample integrity. I n addition, with the JASCO Particle Analysis program i t is also possible to evaluate the variation in par t icle size and shape, etc. The particle size distribution can be displayed as a histogram together with sample shape information from the observed i mage, combined with the chemical images. This method is particularly useful for the analysis of a variety of different materials such as resins, foods, pharmaceuticals, and microplastics . Figure 1. N RS -5500 R a man Spect rom e ter In this application note, we evaluated the dist r ibution of diamond in a diamond polishing sheet using particle analysis software. Keywords Raman spectroscopy, QRi, mapping, partic l e analysis, diamond Experimental A diamond polishing sheet was placed on the stage for i maging measurement. Measurement Conditions Main unit 170x170 points NRS-5500 Raman spectrometer Measurement points (Approx.500x500 um) Ex wavelength 532nm Measurement interval 3um Exposure time 0.03 seconds Accumulation 1 Objective lens 50x Long working distance Results Figure 2 shows the results of imaging measurement and analysis, in addition to diamond, cerium oxide (a glass abrasive compound) was detected in t he spectrum shown i n (b). When a chemical i mage was created using peak height for the diamond peak indicated by the blue arrows i n the spectrum, it was confirmed that the diamond particles were distr i buted as shown in (c). I n addition,(e) and (f ) show the results of analysis of (c) using JASCO Par ti c l e Analysis*. (e) i s a histogram in which the particle size (diameter calculated as the equivalent circle diameter ) is plotted on the Y-axis, with its almost normal distribution on the X-axis. Also, from the correlation distr i bution of part i c l e size and c i rcularity shown i n (f), highei c i rcularity is found for particles near the average size value or smaller (espec i ally 4 um or less). Whi l e larger particles have a lower circular i ty, with a greater number of ellipse-or rod-shapes. Particle analysis using histograms and correlation distributions can be useful when controlling the size and shape of the components in a final product or when evaluating products from different manufactur i ng processes or from different lots. 100u m 100 u m (a) Observe d i mage (c) Chemical image (Diamond distribution) (d) Binarization based on chemical image Cre a te ch e mical i mag e w i th pe a k height of d iamond D ia mon d ↓ ↓Ce r ium o x i de A naly z ed by JASCO Particle A naly s i s B lu e p a r t of ima g e In t D ark p a r t o f A s shown i n (d). t h e partic l es to be analy z ed are rec o gni z ed by binari z ation,an d a hi s t o g ram and correlat i on di s tri b ution are c reated. image 3800 3000 2000 1000 100 R aman S h i f t [cm -1] (b) One o f s pectrum obtained by i maging measurement Figure 2. An al y s i s res u lt *With JASCO Par t icle Analysis, in addition to acquiring the size, area, circularity, aspect ratio, etc. of each particle, histograms (which can be converted i nto stacked histograms), frequency dis t ribution tables, and correlation distributions can be created easily. Measurement took approx. 20 minutes (using QRI). A spectrum with accepatable S/N was obtained for analysis with an exposure t ime per point of 0.03 sec (30 msec). Shortening t he acquisition time or changing to a faster EMCCD detector, i t is possible to further reduce the measurement time. Conclusion Rama n spectroscopy can generally be used to evaluate the component distribut i on with non-destructive, non-contact,and no pret r eatment of the sample. Detailed analysis is possible by visualizing the component distribution and acquiring the shape in formation using the JASCO Particle Analysis appl i cation. Model Description P/N Remarks Main Unit NRS-5500 Raman Spectrometer 7119-JO51A 532 nm laser 100 mW laser was used, buta standard 50 mW is also available. Options QRI 5000/7000 QRI option 7119-J278A RHG5-600B500 600 gr/mm grating 6947-J293A LMPLFLN 50x Objective lens 1108-0102 Long work distance JASCO particle analysis Customized program Measurement took approx. 20 minutes (using QRI). A spectrum with accepatable S/N was O o I btained for analysis with an exposure time per point of 0.03 sec (30 msec). Shortening the acquisition time or changing to a faster EMCCD detector, i t i s possible to further reduce the measurement time. JASCO IN C. 28600 Mary's Cour t , E asto n, MD 21601US A T el : (800) 333-5272 F ax: (410) 822-7526 A ppli c a tio n Lib r ary: jasc o i n c.com /appli c ati o ns
确定

还剩1页未读,是否继续阅读?

产品配置单
佳士科商贸有限公司为您提供《用显微拉曼光谱法评估组分分布和颗粒分析》,该方案主要用于生物药品药物研发中金刚石、颗粒分析、拉曼光谱检测,参考标准--,《用显微拉曼光谱法评估组分分布和颗粒分析》用到的仪器有JASCONRS5000/7000共聚焦激光拉曼光谱仪
相关方案
更多
该厂商其他方案
更多