


方案详情
文
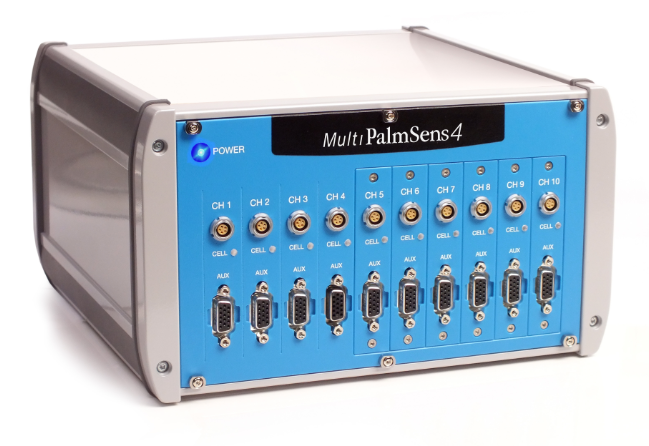
在微流控芯片器官系统中,3D组织模型通过MultiPalmSens4多通道电化学分析仪施加电化学信号,其作用方式就像微芯片上微型的器官。这样,生理过程——例如肿瘤的生长——就可以在人体外重现和观察。该研究小组创建了一个集成微传感器和微流体的芯片设计,可以直接原位测量细胞的代谢物。在他们的系统中,从单个干细胞中培育出乳腺癌微型肿瘤,并使用电化学传感器在一周的时间内监测细胞氧气和葡萄糖消耗以及乳酸的产生。
方案详情

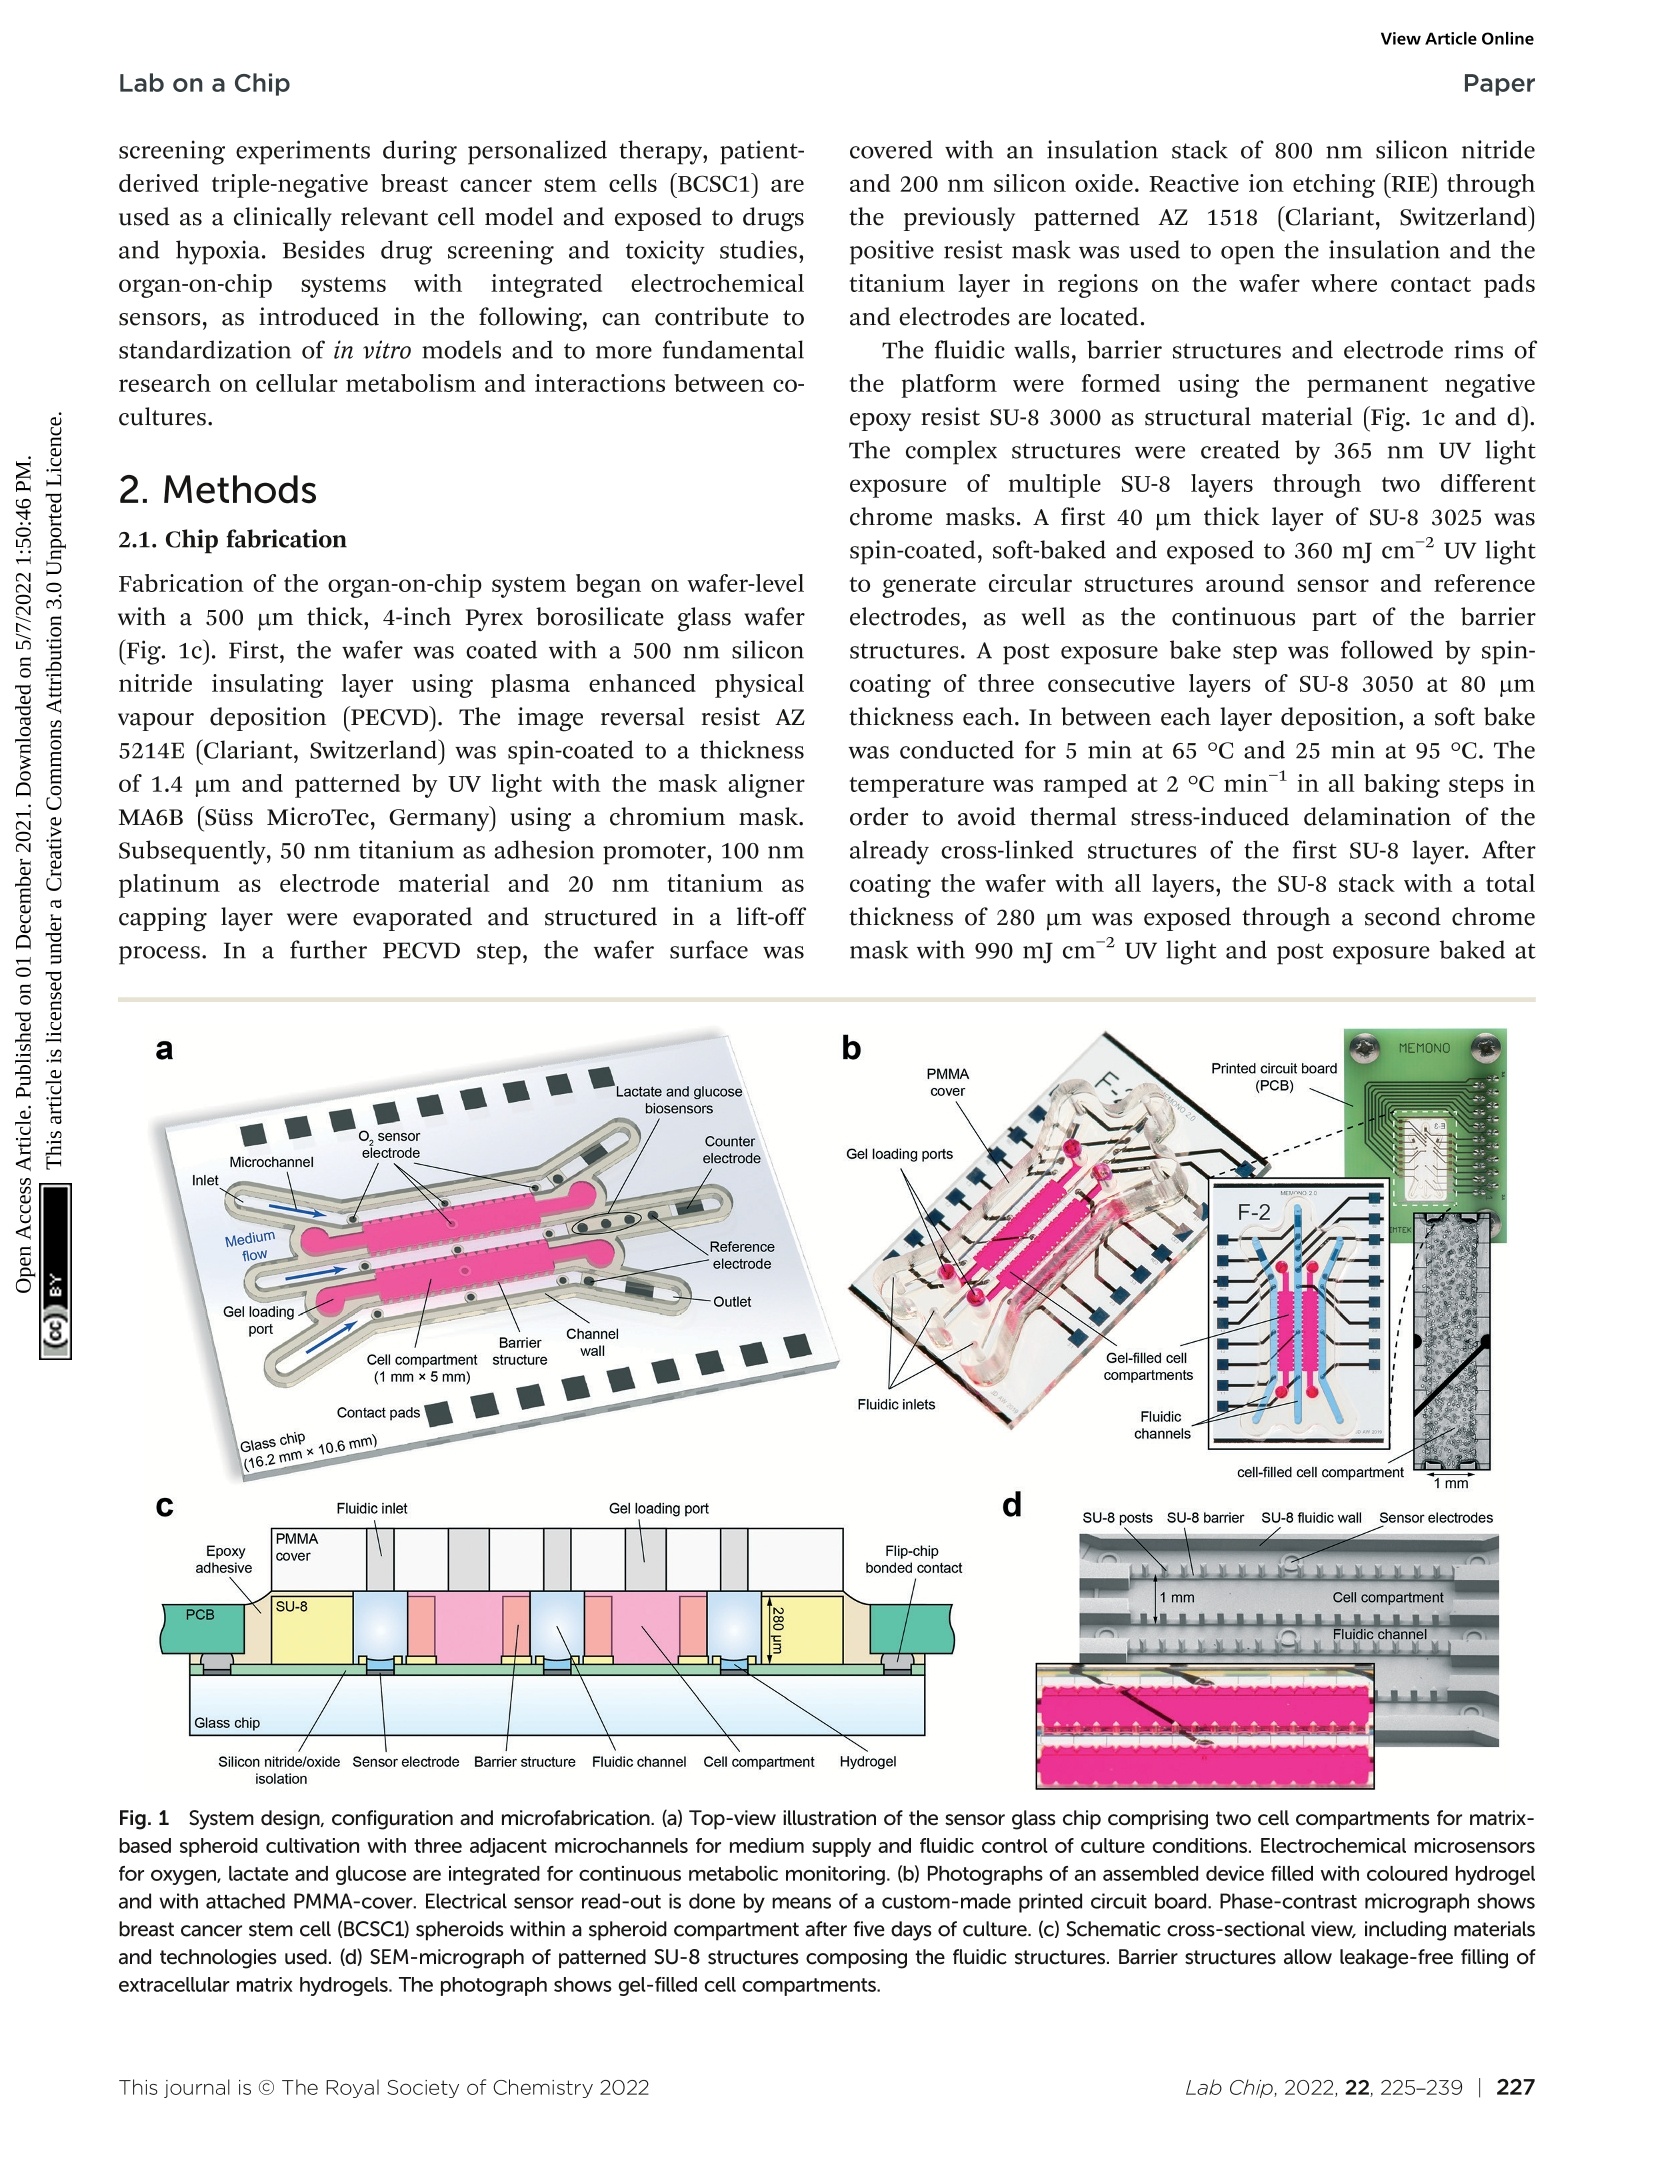
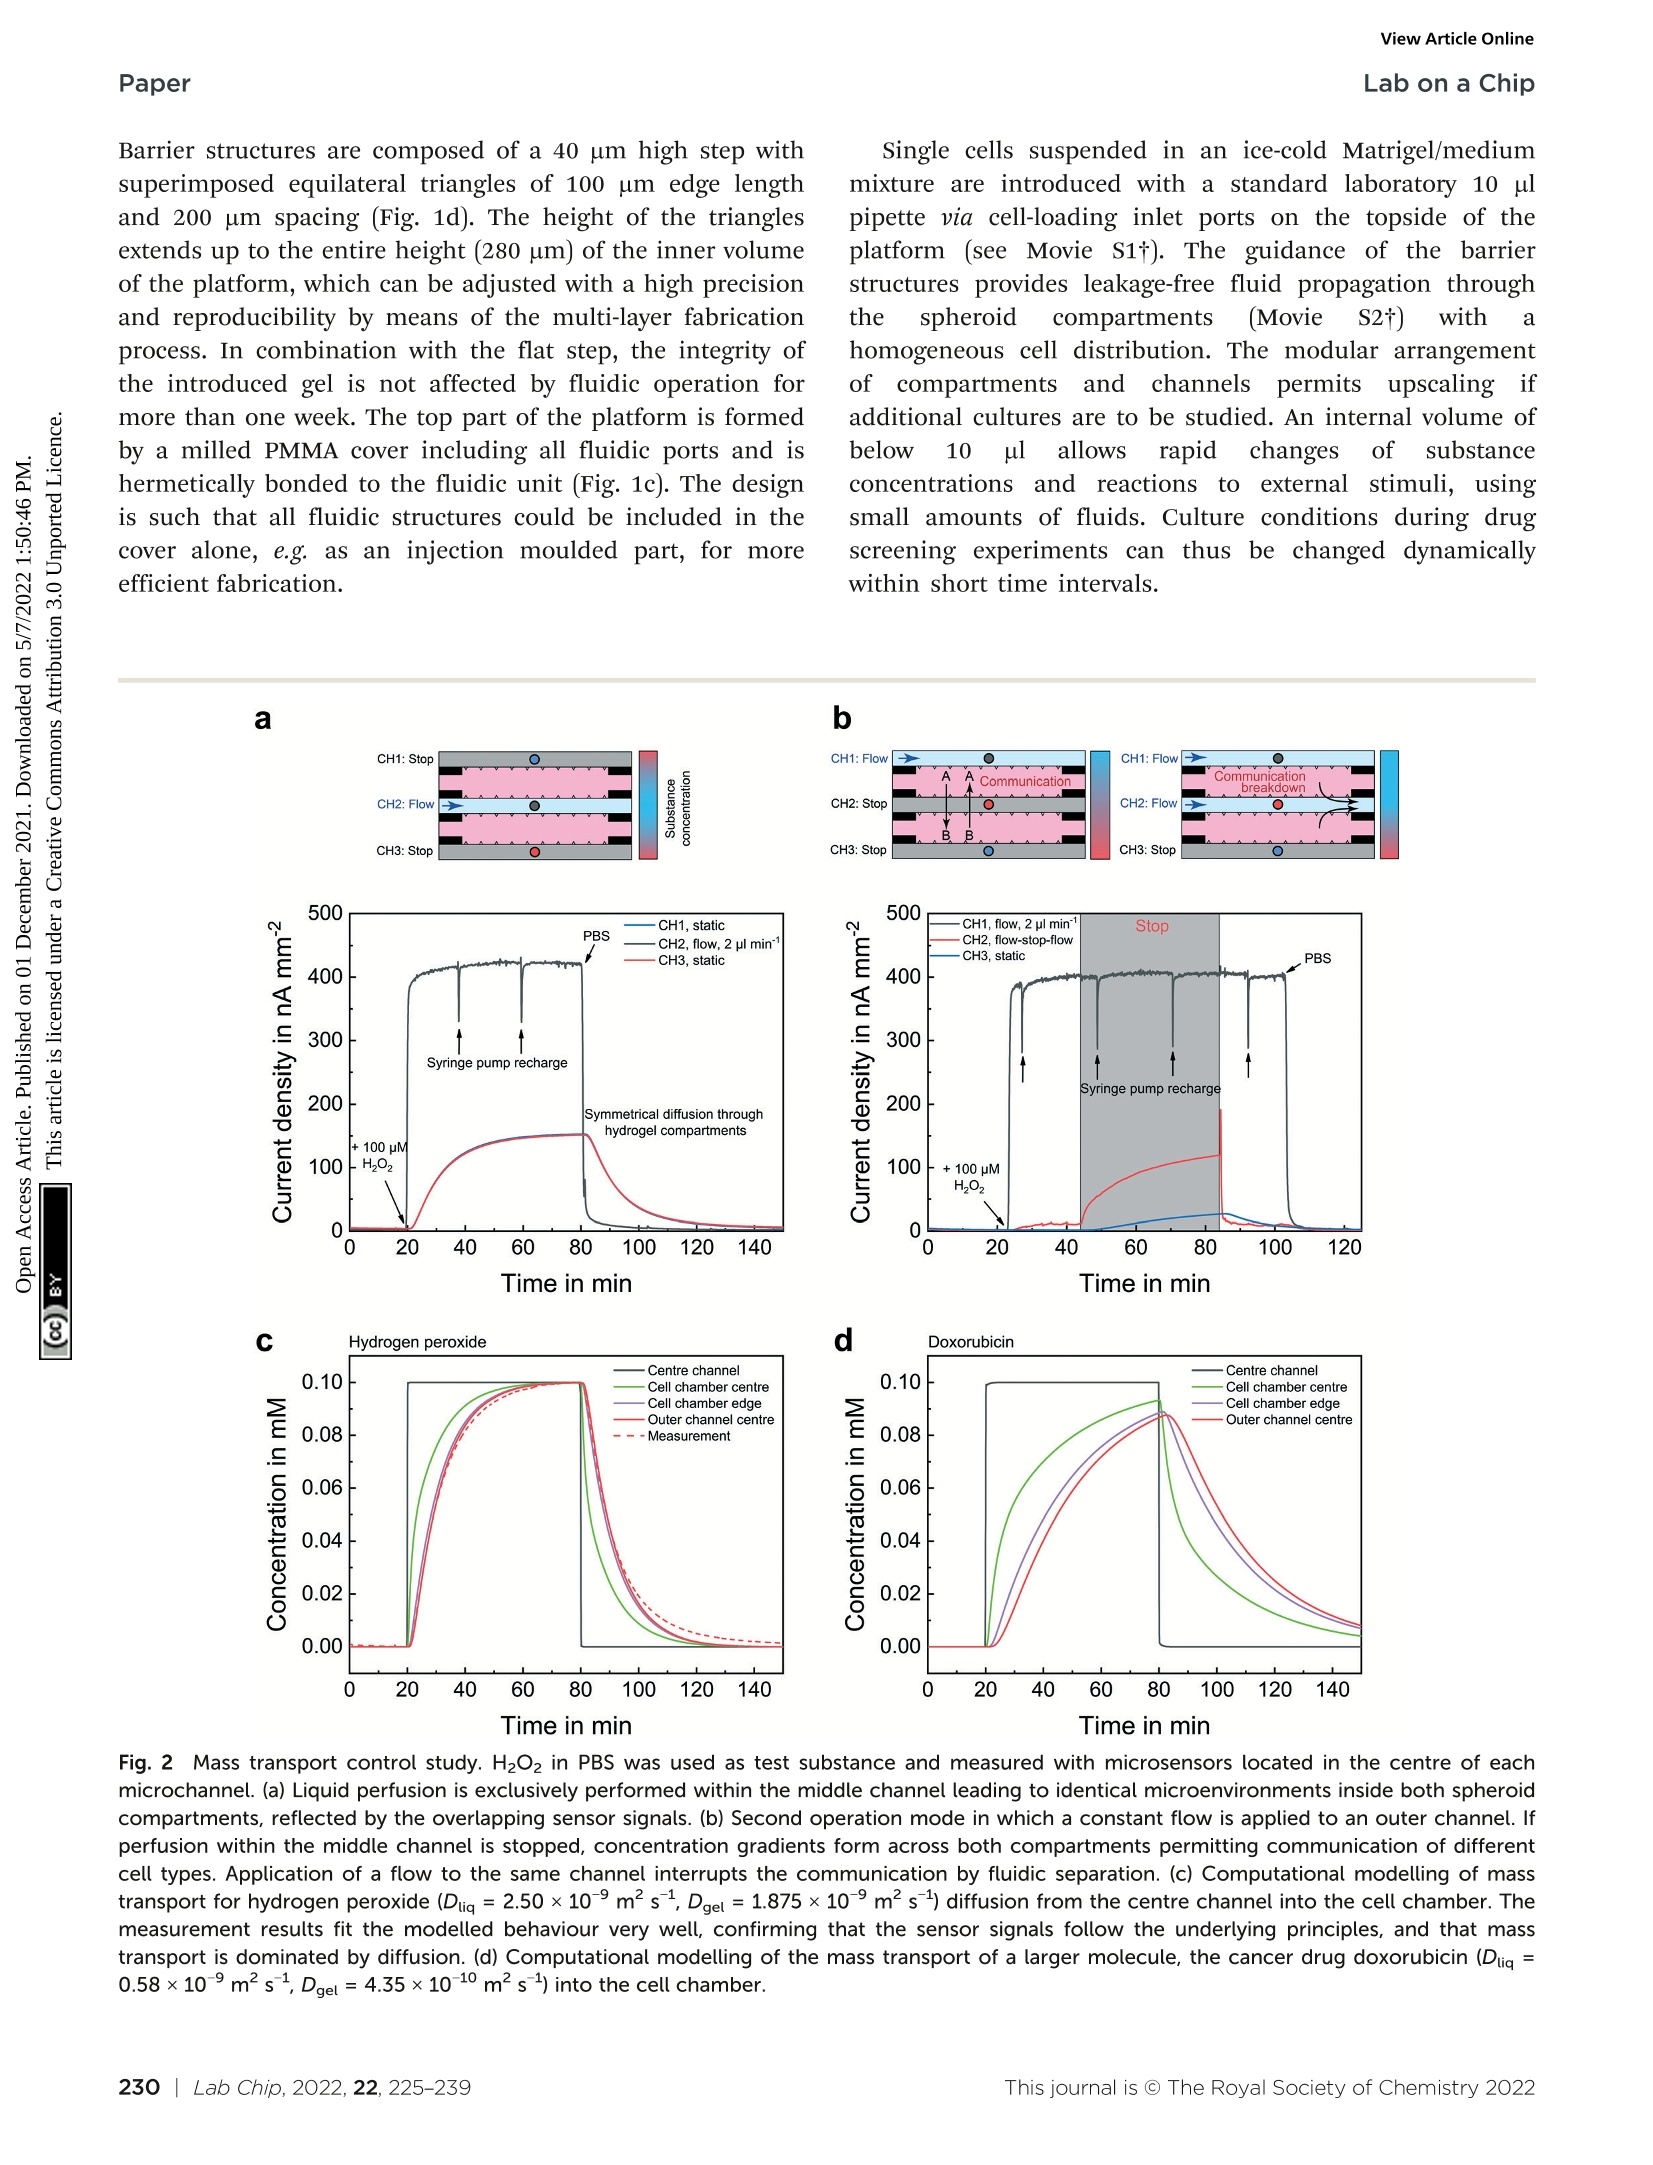
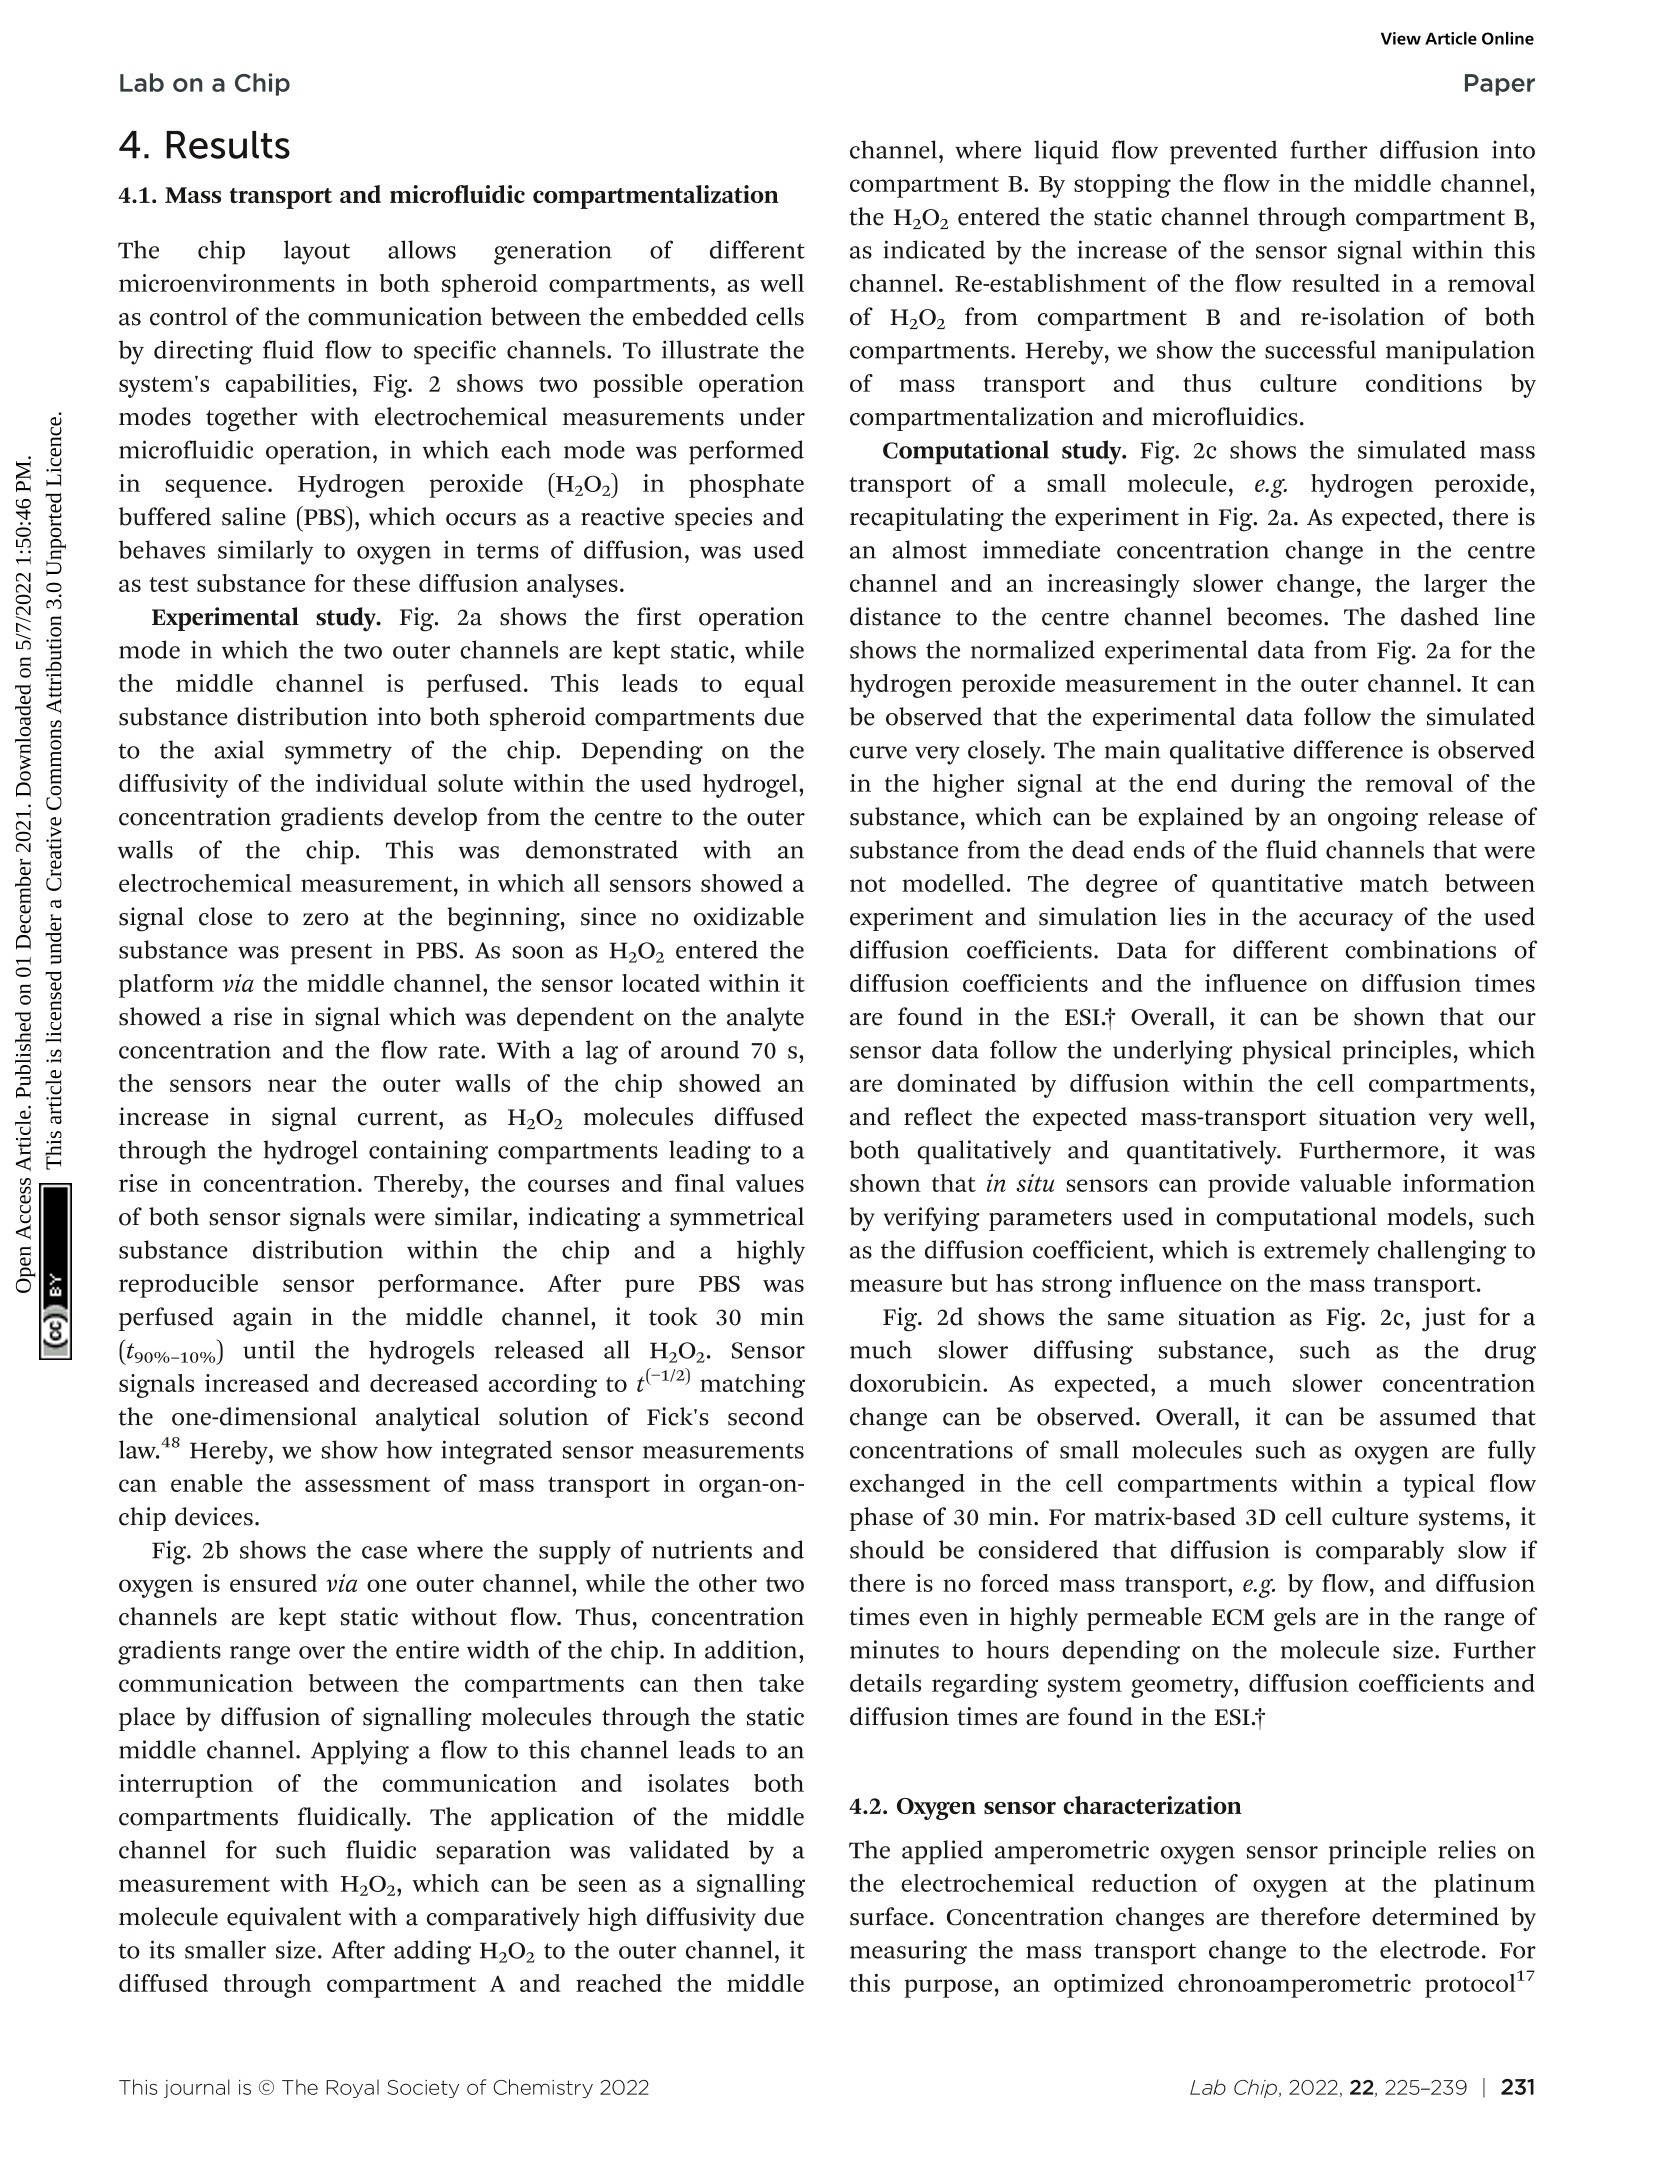
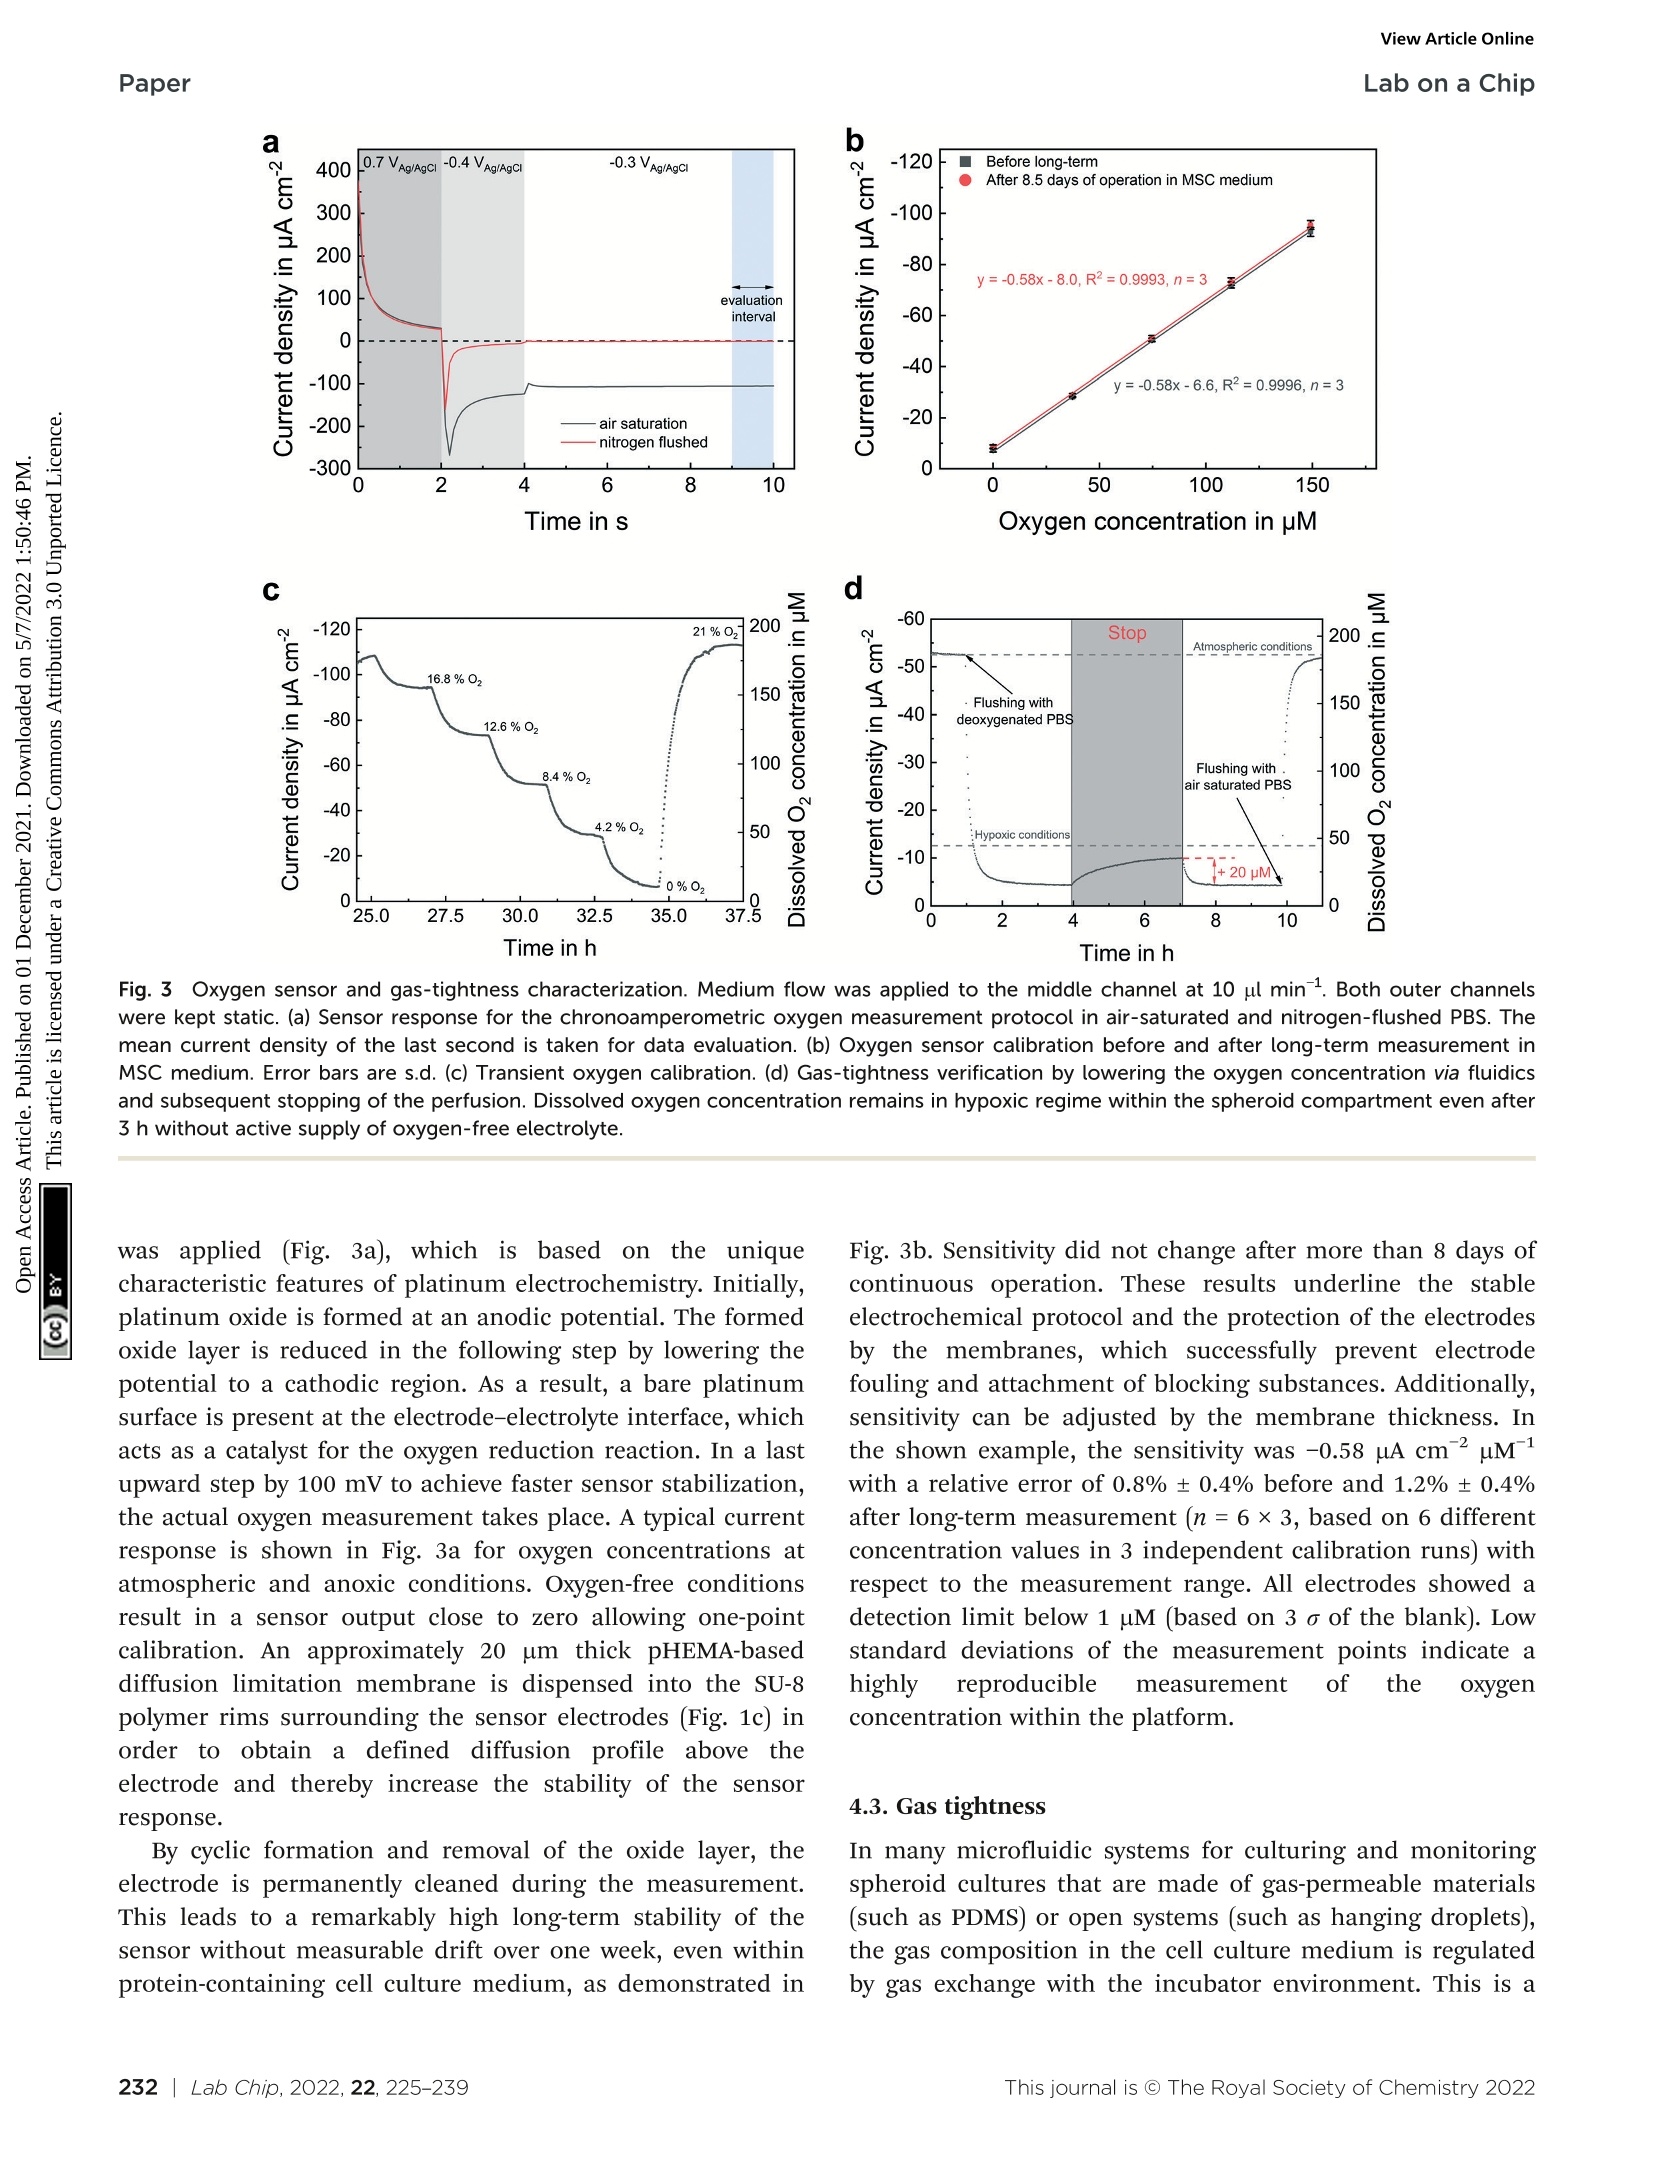
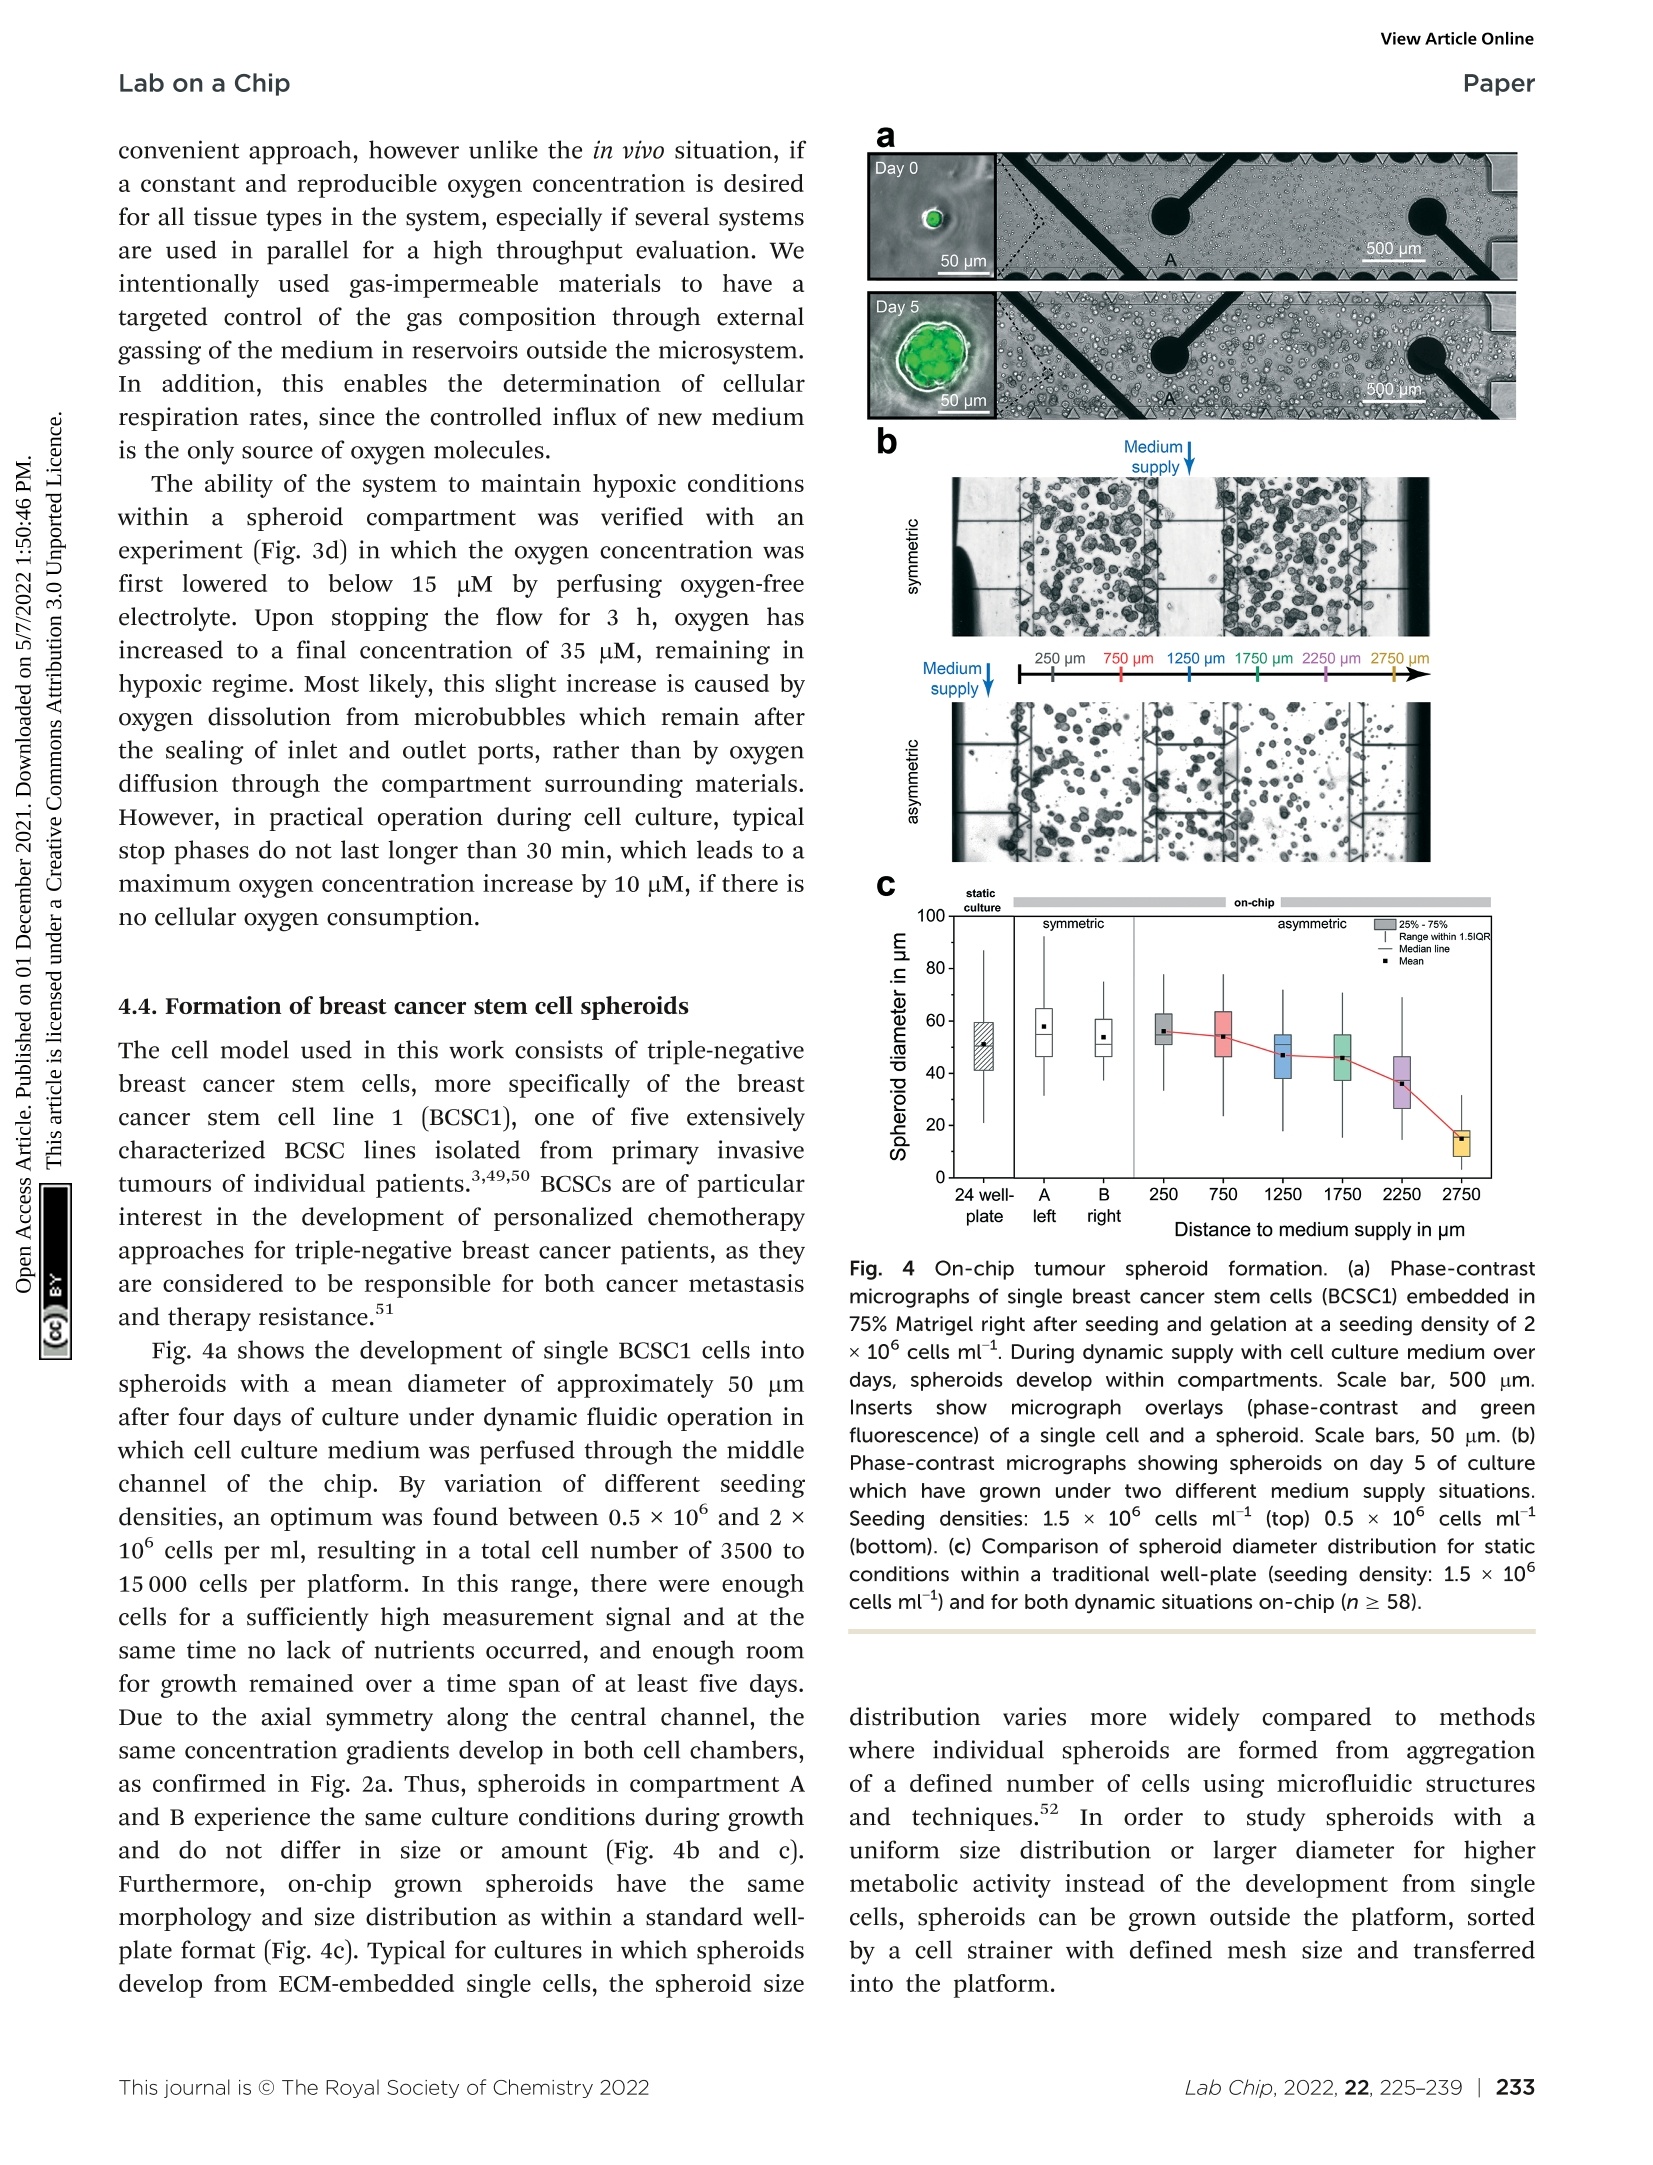
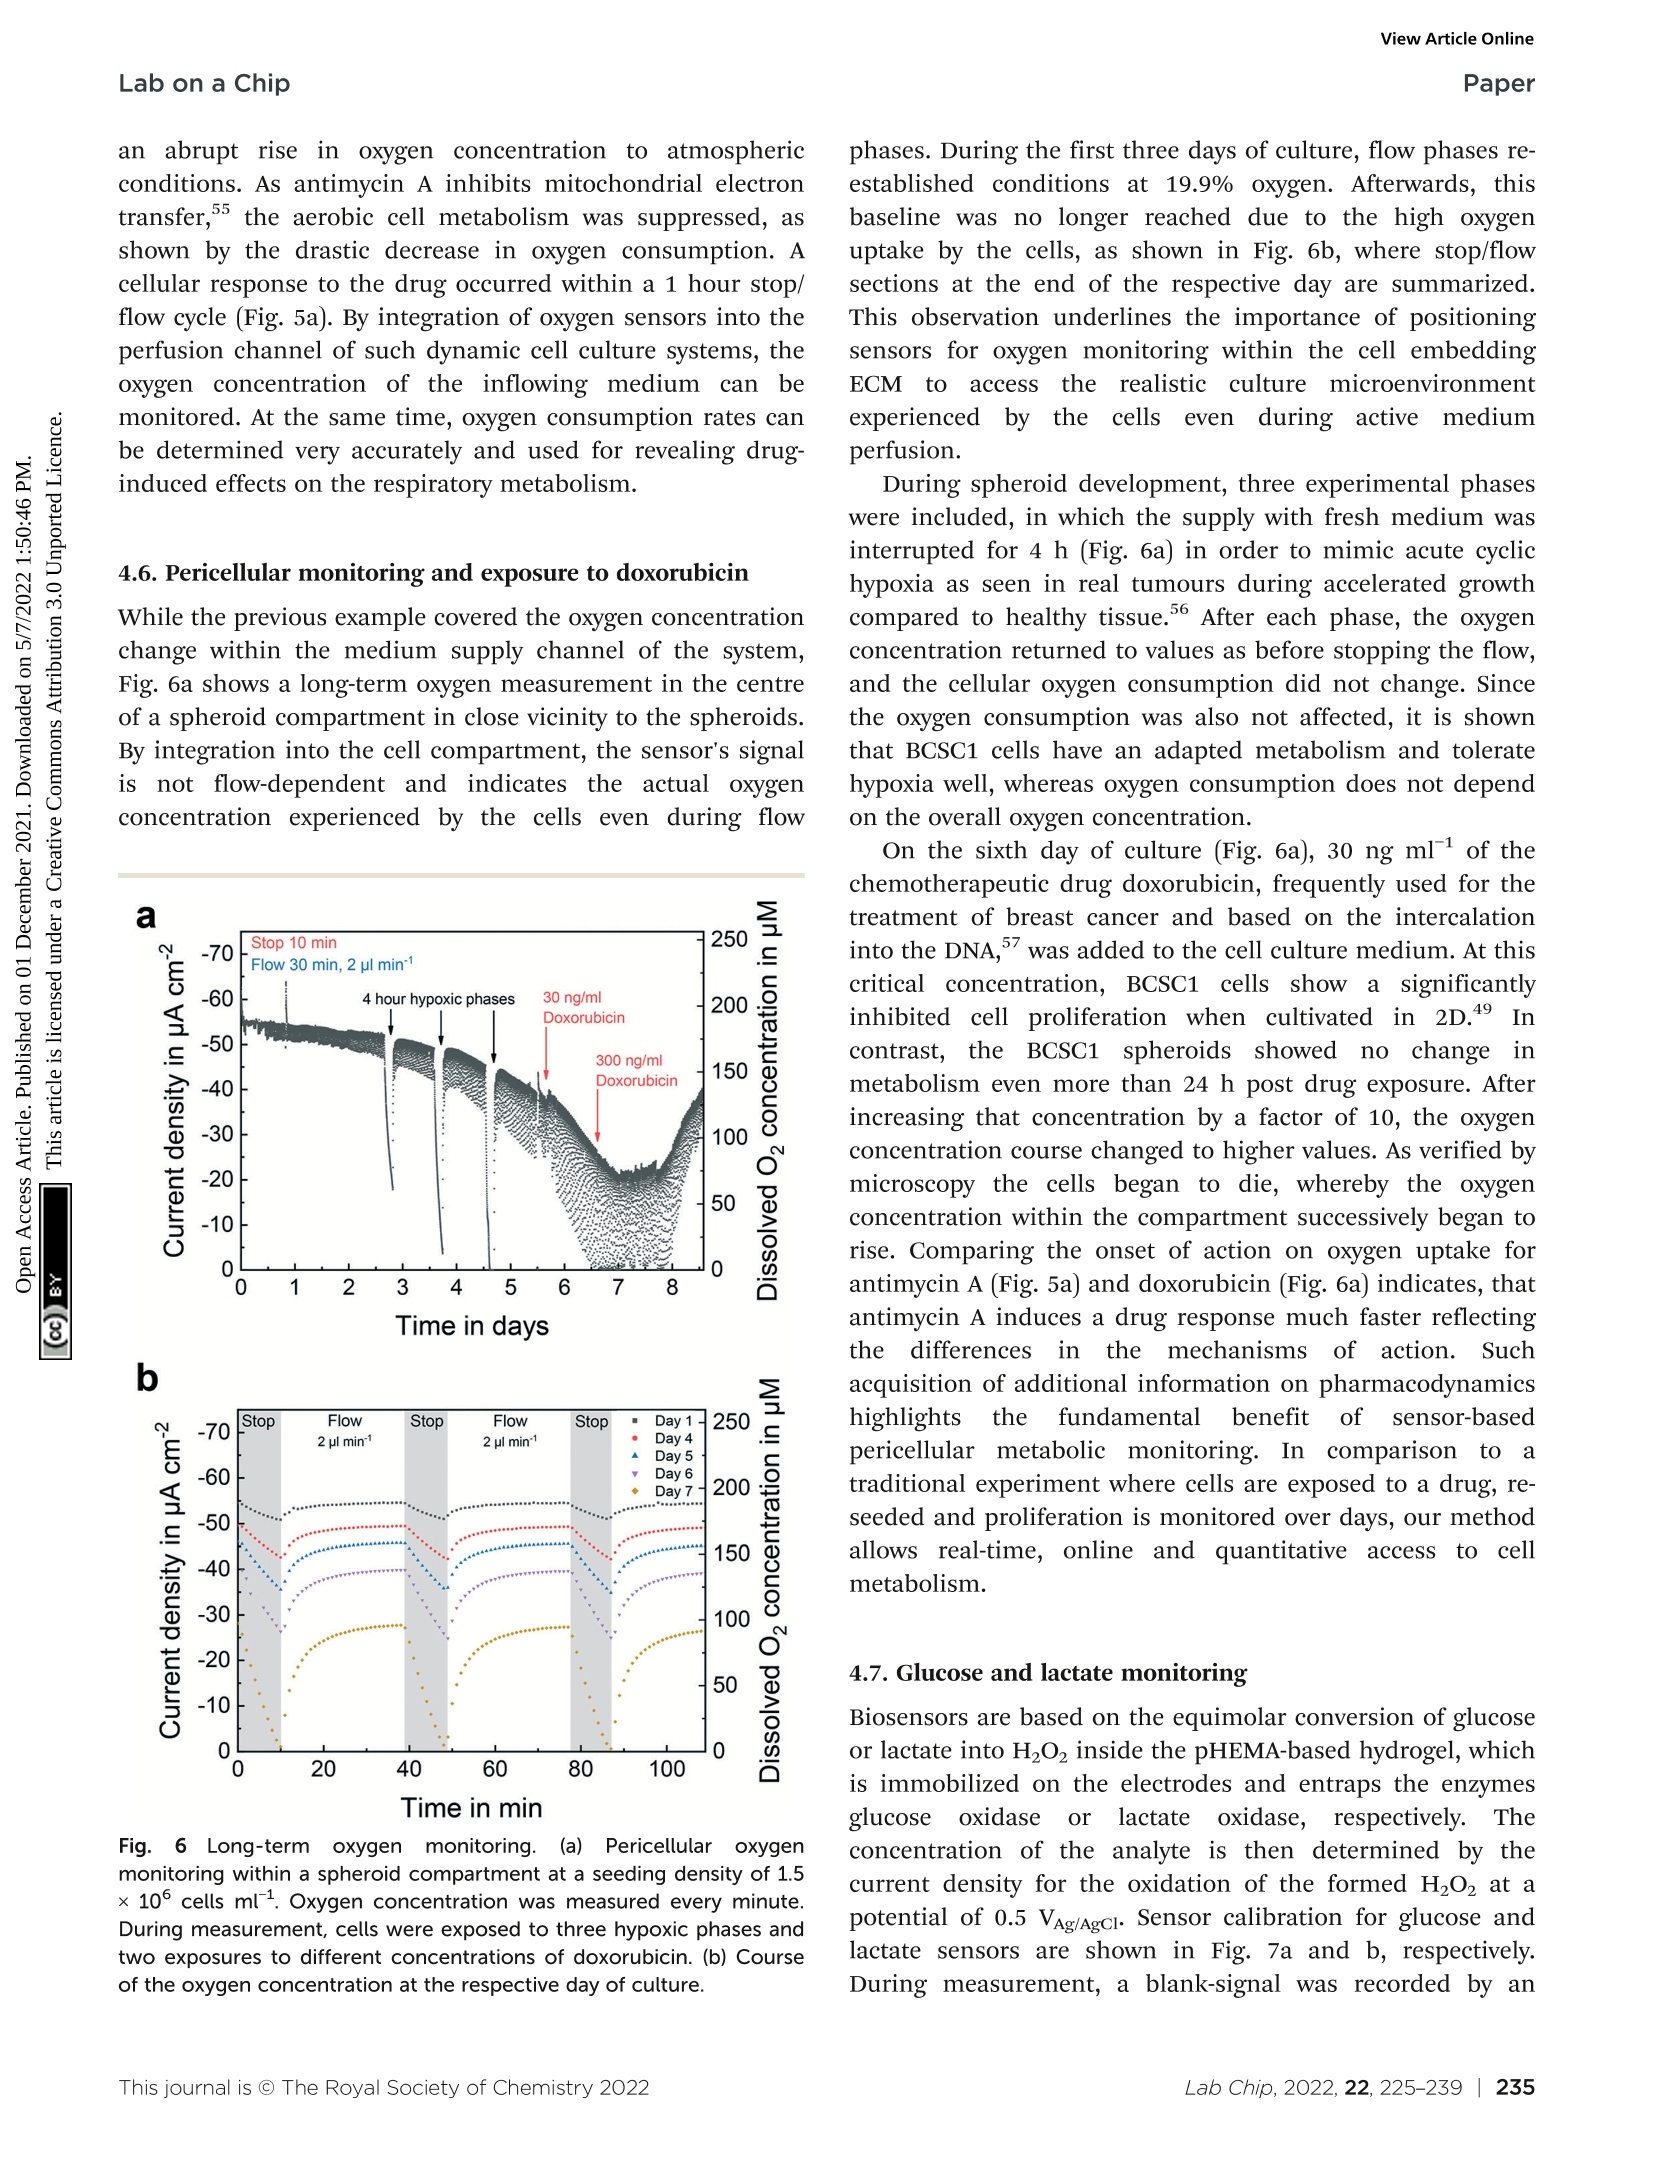
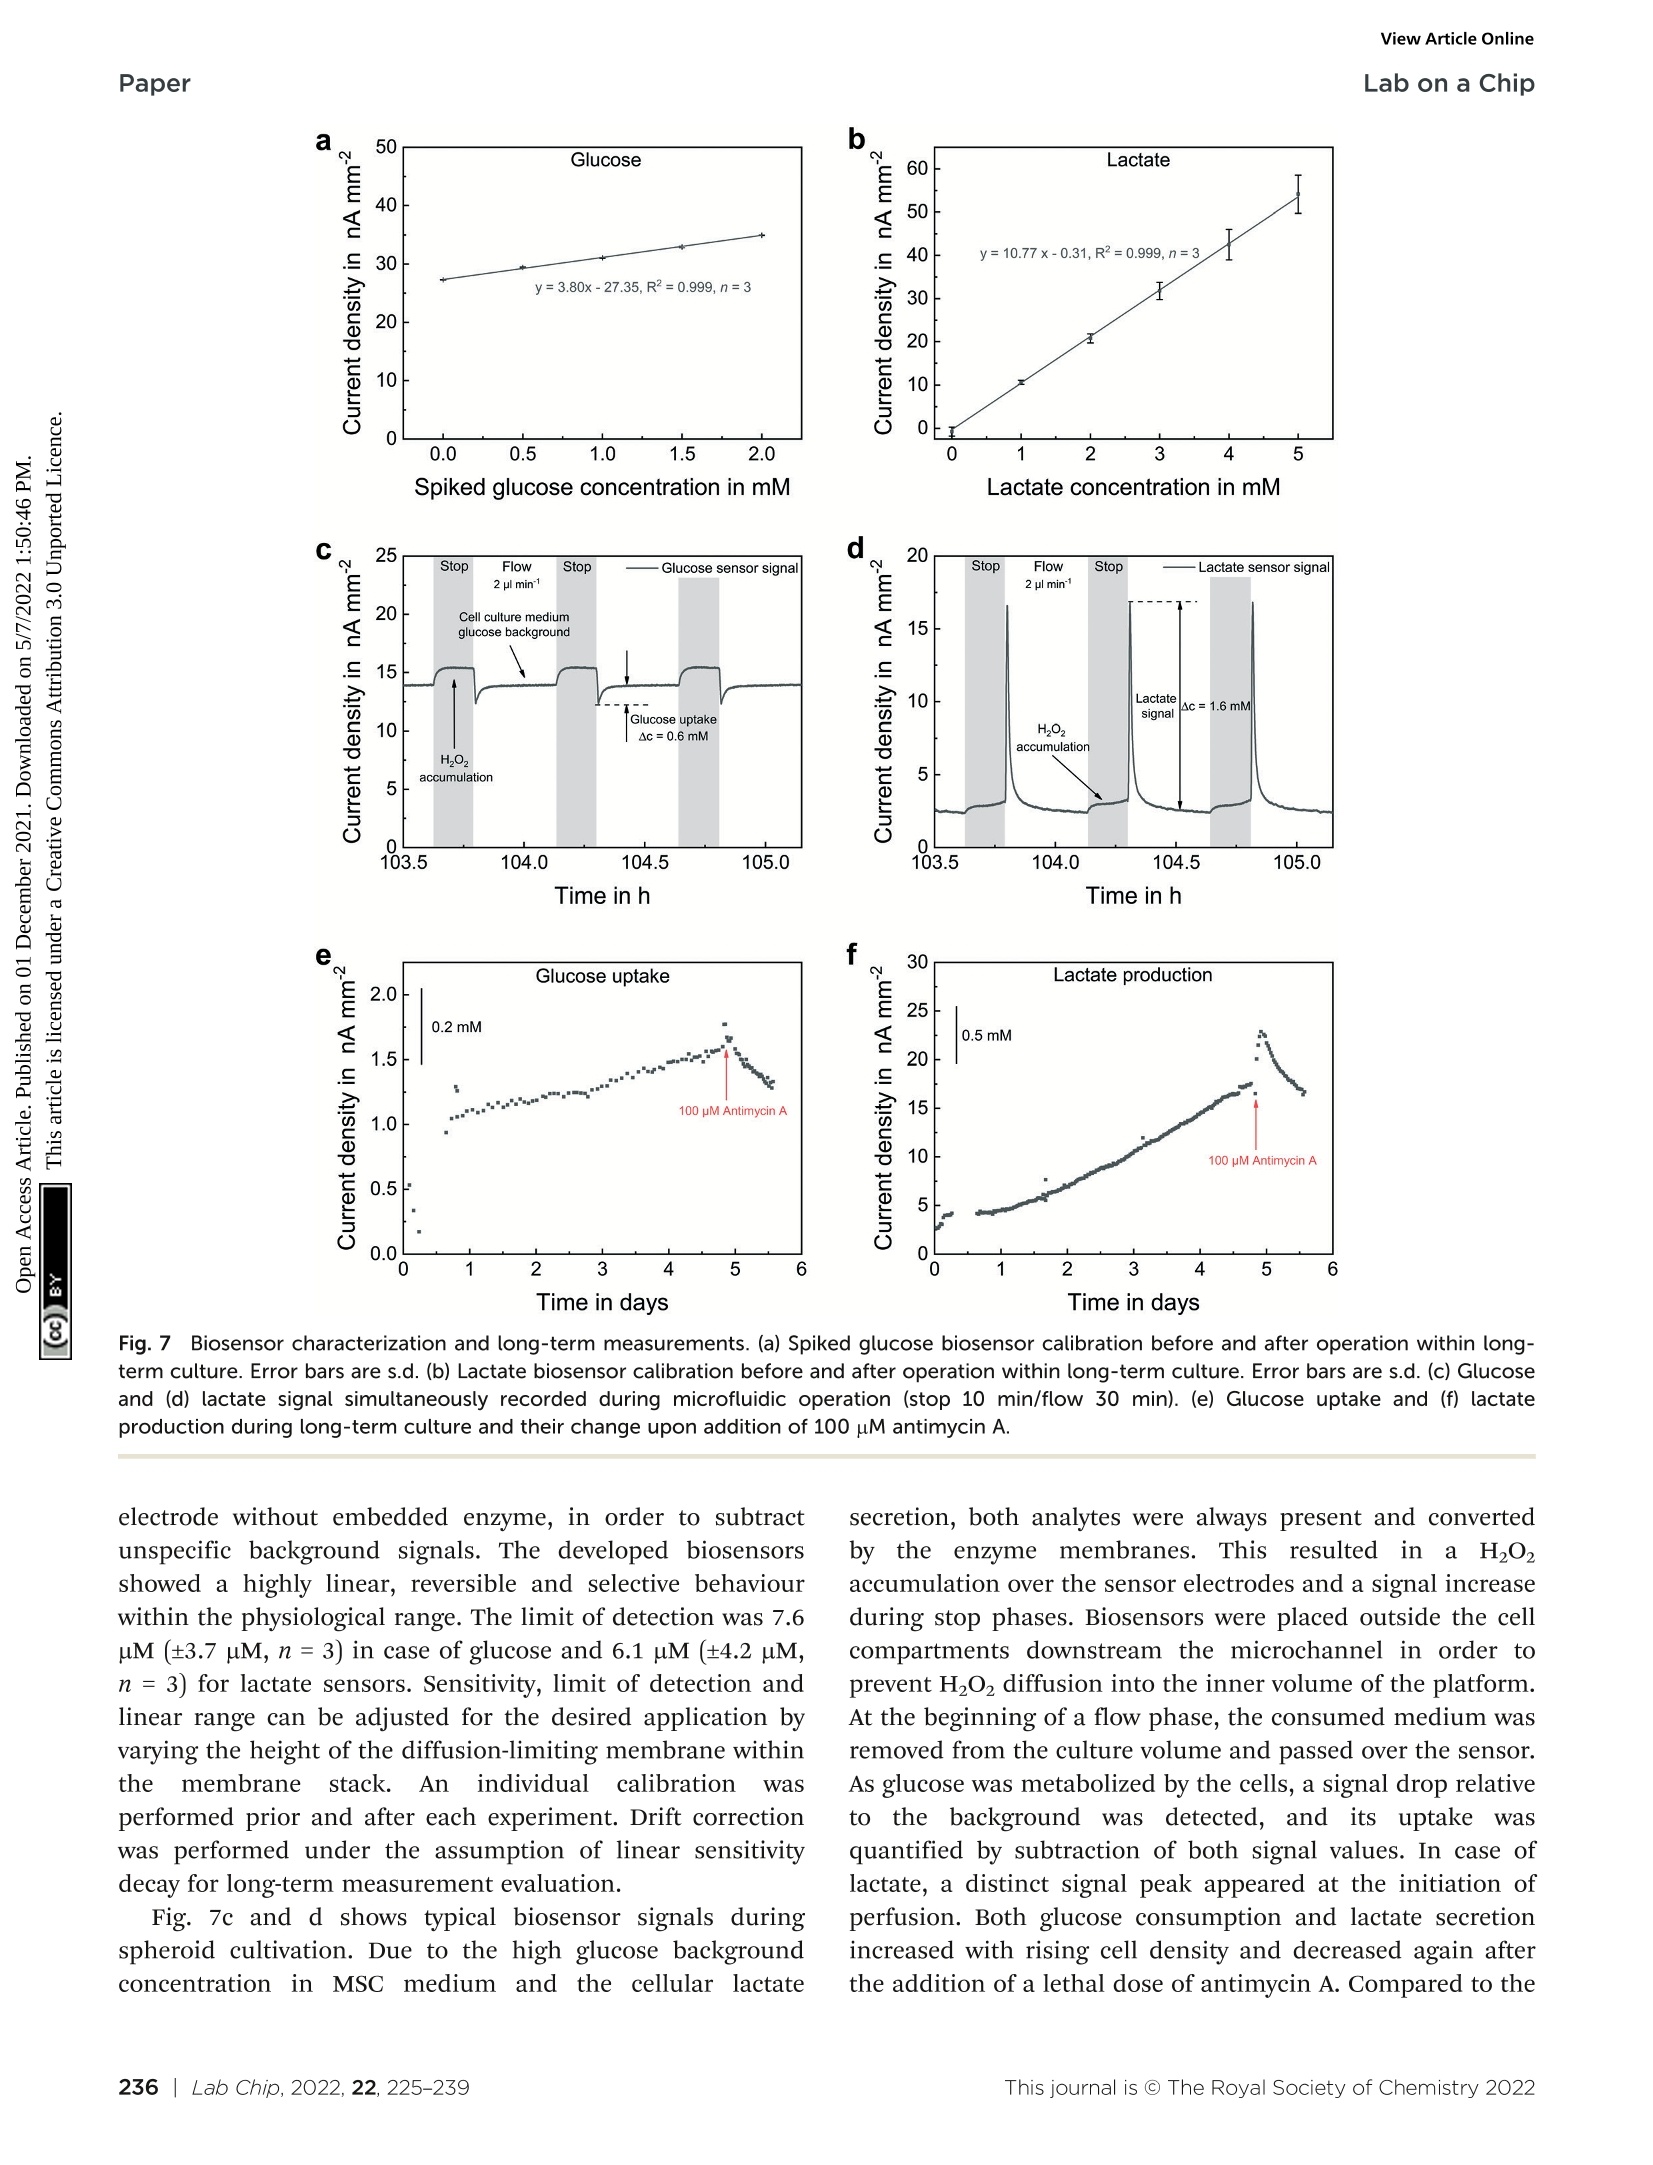
3D细胞培养物已成为必不可少的体外模型,例如在癌症研究和药物开发中。近期研究开发了一种器官芯片系统,可以通过微传感器随时测量和控制细胞的培养条件和代谢率,精确监测体外3D肿瘤组织。平台能够实现肿瘤类器官的动态3D培养,还可以用来检测药物对细胞代谢的影响。在微流控芯片器官系统中,3D组织模型通过MultiPalmSens4多通道电化学分析仪施加电化学信号,其作用方式就像微芯片上微型的器官。这样,生理过程——例如肿瘤的生长——就可以在人体外重现和观察。该研究小组创建了一个集成微传感器和微流体的芯片设计,可以直接原位测量细胞的代谢物。在他们的系统中,从单个干细胞中培育出乳腺癌微型肿瘤,并使用电化学传感器在一周的时间内监测细胞氧气和葡萄糖消耗以及乳酸的产生第一作者、博士生Johannes Dornhof说:“我们的平台能够实现肿瘤类器官的动态3D培养,而直到现在,静态2D培养经常被使用,但它只能在有限的程度上概括肿瘤的复杂微环境。”此外,芯片系统还可以用来检测药物对细胞代谢的影响——例如,化疗药物的细胞效应可以在癌症研究的背景下进行定量和实时的记录。 原文链接DOI: 10.1039/d1lc00689d 本文中进行电化学测试的仪器为荷兰PalmSens,型号:MultiPalmSens4多通道电化学分析仪。需要了解更多电化学方面的知识,请关注我们或进入PalmSens中文网站:“http://www.palmsens.cn/”。ROYAL SOCIETYOF CHEMISTRYLab on a Chip View Article OnlinePaperLab on a Chip V ol ume 22 Nu mber 221 J anu a ry 2022P age s 203-414 Lab on a Chip Devices an d a p pl i c a tions a t the m icro- and n a noscale rsc .li /l oc 9 8 EMO NO 2.0 JD AW 2019 AW211 I SS N 1473-0197 Joh a n ne s D o rn ho f a n d A n dre as We lt i n e t al.Mic rof l u i dic o r ga n -o n -chip sys tem f or mu lti-a n alyt e mon i t o ri n g o f me t a bol i tes i n 3D ce l l c ulture s Check for updates Cite this: Lab Chip,2022, 22,225o w o o o o 一 d Received 3rd August 2021,Accepted 3rd November 2021 DOI: 10.1039/d1lc00689d rsc.l i/loc 1. Introduction Microfluidic organ-on-chip system for multi-analyte monitoring of metabolites in 3D cell culturest Johannes Dornhof f .,iD d Jochen Kieninger,iD Harshini Muralidharan,°Jochen Maurer. Gerald A. Urban and Andreas Weltin *a Three-dimensional cell cultures using patient-derived stem cells are essential in vitro models for a more efficient and individualized cancer therapy. Currently, culture conditions and metabolite concentrations,especially hypoxia, are often not accessible cont i nuously and in situ within microphysiological systems.H owever, understanding and standardizing the cellular microenvironment are the key to successful in vitro models. We developed a microfluidic organ-on-chip platform for matrix-based, heterogeneous 3D cultures with fully integrated electrochemical chemo - and biosensor arrays for the energy metabolites oxygen,lactate, and glucose. Advanced microstructures allow straightforward cel l matrix integration with standard laboratory equipment, compartmentalization, and microfluidic access. Single, patient -derived, t riple -negative breast cancer stem cells develop into tumour organoids in a heterogeneous spheroid culture on-chip. Our system allows unprecedented control of culture conditions, including hypoxia , and simultaneous ver i f i cation by i ntegrated sensors. Beyond previous works,, our results demonstrate precise and reproducible on-chip mul t i-analyte metabol i te monitoring under dynamic conditions from a matrix -based culture over more than one week. Responses to alterations in culture conditions and cancer d r ua exposure, such as metabo l ite consumption and production rates, could be accessed quantitat i vely and in real-t i me, i n contrast to endpoint analyses. Our approach highl i ghts the importance of continuous, i n situ metabolite monitoring i n 3D ce l l cultures regardi n g the standardization and control of culture conditions,and drug screening in cancer research. Overall, the results underl i ne the poten t ial of microsensors i n organ-on-chip systems for successful application, e.g. in personal i zed medicine. Three dimensional (3D) cell cultures have become essent i al in vitro models, e.g. in cancer research and drug development.Microfluidic organ-on-chip platforms allow patterning and compartmentalization of 3D cultures to study responses to stimuli such as drug exposure a t minimal volumes, control of culture conditions,and 1cellular r interactions. Integrated microsensors f for real -time monitoring of both culture conditionssand cell metabolismpromis S e e unprecedented insight into these complex in vitro models. In cancer research, “Laboratory for Sensors, IMTEK - Department of Microsy s tems Engineering, University of Freiburg, Georges-Kohler-Allee 103, 79110 Freiburg, Germany. E -mail : welt i n@imtek.de; Tel:+49 761 203-7263 "Molecular Gynecology, Clinic for Gynecology and Obstetrics, University Hospital RWTH Aachen, PauwelsstraBe 30, 52074 Aachen, Germany +Electronic supplementary information (ESI)avai l able: Describi n g the computational modelling of mass transport.Video oS1: f illing of C cell compartment with st a ndard l aboratory pipette. Video S2: microscopic v i ew of microstructure-guided f i l ling of cell compartment with Matr i gel. See DOI :10.1039/d1lc00689d the use of patient-derived stem cells that recapitulate the original patient's tumour from aa single stem cell leve onwards promises truly individualized medicine.,2 Such models are of particular importance in the development of new and personalized medications,as 1they offer the possibility for fast, cost-effective and parallel i zed testing of potential drug candidates in vitro, without negative side effects for the patient and with the perspective to also reduce animal experiments. The triple-negative breast cancer stem cell (BCSC ) model used in this study cons i sts of isolated cells from individuall patients after undergoing chemotherapy.Focus on such stem cells is essential because they drive metastasis and are therapy resistant , meaning traditional treatments may not be effective. In current practice, in order to test e.g. the ef f icacy of a chemotherapeutic drug, cells are cultured in microtiterplates S ,,then nC exposed to the chemotherapeutic agent, and then cultured again while cell viability i 1s S tracked by e.g.spheroid growth or staining methods. In some cases, cell s are transplanted into mice as xenografts in order to recapitulate the original tumour. Such procedures are ti me and resource consuming, aside from the ethical concerns of animal models. It would therefore be beneficial to perform some of these analyses on-chip. One central aspect is hypoxia as the cells are typical l y cultured in hypoxia incubators, although i t is not often clear which exact oxygen concentration occurs within the 3D matrix. In a stop/flow regimen wi t hin an organ-on-chip system, e.g. oxygen consumption as a quantitative measure for cell viability can be determined within minutes from a small cell number in a minimal volume. Besides continuous and online tracking of metabolic C parameters,microfluidic C systems S allow an advanced level of control of culture conditions including in situ verification thereof. Along with the extensive effort put into improvement of in vitro models in order to make them resemble the in vivo situation as closely as Spossible, it became evident that traditional 2DDcultures consisting of adherent cell monolayers can replicate the complex real it y within the human body only to a limited extent . It has been shown that cells of the same typebehave fundamentally different depending on how they are cultured. Within a 2D culture,cell 1interaction 1s S (occur only laterally across the cel membranes and through signalling molecules that spread within the comparably large volume of cell culture medium.Within static 3D cultures, however, cells are embedded within an artificial extracellular matrix (ECM) and develop into spherical structures called spheroids, in which cell -cell interactions and concentration gradients of metabolites and waste products are found as under physiological conditions..6 Furthermore, 3D models were equipped with medium supply channels for act i ve’8 or passive ,10 perfusion in order to mimic the dynamic situation and concentration gradients s within living tissue even better. In such microfluidic platforms , the ECM is partitioned from medium channels by means of photolithographic ECM patterning or specific barrier structures, manufactured in a wide range of dimensions and shapes.10-14 Trietsch et al. introduced their concept of stratified cell culture, in which ECM-gels are separated from f l uid channels by microstructured phaseguides S in a microtiter plate1format.10ECM-free spheroid generation approaches have been elaborated, based on the agglomeration of cells, rather than their formation from single cells, within round-bottom ultralow attachment plates, spinning bioreactors, hanging droplets,microengineered traps, magnetic levitation and fluidically generated droplets.15 Such approaches accelerate spheroid formation, but, self-assembly of cells into patient-specific tumour organoids cannot be studied in more detail under these accelerated conditions. Characterization of the cel l state has traditionally been dominated by optical methods such as staining, combined with microscopy and endpoint analysis. In recent years, i t has been shown.that tthe monitoring of 1metabolic parameters and culture conditions by means of embedded sensors can provide many benefits i n terms of information content and quality of drug screening experiments, as well as fundamental metabolic characteristics of tissues.16 Sensors formany different parameters such as oxygen,17-27superoxide,28 nitric oxide (NO),29 DH.20,25,27,30-32transepithelial electrical resistance (TEER),33-36lactate,19,23,31,37 glucose19,31,37 and1otherr b biochemicallv relevant substances were developed and used for examination of static and dynamic 2D and 3D in vitro models. Optica sensors measure variationsin optical properties, e.g.luminescence of sensing l a yer, caused bby y2analyte concentrationnc changes. Thei i r r limitationsinclude e thei undef i ned zero-point, integration capabi li ty into ful l -wafe fabrication processes and inherent tnon-linearr transfer function, which restricts themn from use at low concentrations. Deposition of microelectrodes by means of thin-f ilm technology established in microfabrication , on the other hand, enables the integration of sensor arrays with a high spatial resolution within a miniaturized environment .Besides rathe e r rbasic electrical sensors for rimpedance measurement to assess barrier properties of adherent cells,this approach allows the integration of electrochemical sensors for measurement of a variety of different dissolved species at micromolar concentrations and second-by-second temporal resolution. Their successful integration into both static17,24,25,38and dynamic 2D cell culture, as well as hanging droplet systems, has already been demonstrated.Bavli et al. showed luminescence-based oxygen sensor beads integrated into multiple spheroids in a bioreactor, togethe with externalc downstream electrochemical glucose and lactate biosensors. Misun et al. integrated glucose and lactate biosensors in their hanging droplet system to measure single spheroid metabolism in situ over hours. Both approaches include isolated spheroids i n an open or gas-permeable system environment. Microsensor integration into platforms for dynamic, matrix-based cultivation of cells in 3D, on the other hand, is rather challenging. Compartments for reliable cel l -laden gel integration have to be formed. Dynamic,reliable and efficient fluidic access has to be provided to supply the cells with medium, and meaningful measurement signals have to be extracted from the heterogeneous culture by integrated sensors or via microfluidics. In this work, we introduce a transparent, state-of-the-art organ-on-chip platform for matrix-based organoid cul t ivatior from single cells with integrated highly sensitive and long term n stabl l e e electrochemical l microsensors for real-time measurement of oxygen, lactate and glucose. Cel l cultivatior is S performed within culture compartments enclosing the ECM,separatedd by structured microchannels t to enable medium perfusion, introduction of externa a l l stimuli;anc different microfluidic c operation 1modes.The presentec technology links microsensors with compartmentalized cell culture, allowing culture conditions, including hypoxia, to be specifically adjusted and monitored. Besides optica inspection 1of spheroid d (development,the transparent platform m e en nables determination of cellular oxygen 1anc glucose consumption as well as lactate production with stable sensors over a relevant period of more than one week.To underline the utility of such a technology for drug screening experiments during personalized therapy, patient-derived t r iple-negative breast cancer stem cells (BCSC1) are used as a clinically relevant cell model and exposed to drugs and hypoxia. Besides drug screening and toxicity studies,organ-on-chipp systems with integrated electrochemical sensors, as introduced in the following, can contribute to standardization of in vitro models and to more fundamental research on cellular metabolism and interactions between co-cultures. 2.Methods 2.1. Chip fabrication Fabrication of the organ-on-chip system began on wafer-level with a 500 um thick, 4-i nch Pyrex borosilicate glass wafer (Fig. 1c). First, the wafer was coated with a 500 nm si l icon nitride insulatingg1layer using plasma enhanced physical vapour depos it ion (PECVD). The image reversal resist AZ 5214E (Clariant, Switzerland) was spin-coated to a thickness of 1.4 pm and patterned by UV light with the mask aligner MA6B (Suss MicroTec, Germany) using a chromium mask.Subsequently, 50 nm titanium as adhesion promoter, 100 nm platinum as electrode material and 20 nm titanium as capping layer were evaporated and structured in a lift-off process. In a further PECVD step, the wafer surface was covered with an insulation stack of 800 nm silicon nitride and 200 nm sil i con oxide. React i ve i on etching (RIE) through the previously patterned AZ 1518(Clariant, Switzerland)positive resist mask was used to open the insulation and the titanium layer in regions on the wafer where contact pads and electrodes are located. The fluidic walls, barrier structures and electrode rims of the platform were formed using the permanent negative epoxy resis t SU-8 3000 as structural material (Fig. 1c and d)The complex structures were created by 365 nm UV ligh exposure of multiple eSU-8layers through h two different chrome masks. A first 40 um thick layer of SU-8 3025 was spin-coated, soft -baked and exposed to 360 mJ cm’Uv light to generate circular structures around sensor and reference electrodes, as well as the continuous part of the barrier structures. A post exposure bake step was followed by spin coating of three consecutive layers of SU-8 3050 at 80 um thickness each. In between each layer deposition, a soft bake was conducted for 5 min at 65 °C and 25 min at 95 °C. The temperature was ramped at 2 ℃ min in all baking steps in order to avoid thermal stress-induced delamination of the already cross-linked structures of the first SU-8 layer. After coating the wafer with al l layers, the SU-8 stack with a total thickness of 280 um was exposed through a second chrome mask with 990 mJ cm ’Uv l ight and post exposure baked at Fig.11System design, configuration and microfabrication. (a) Top-view illustration of the sensor glass chip compris i ng two cell compartments for matrix-based spheroid cult i vation with three adjacent microchannels for medium supply and fluidic control of culture conditions. Electrochemical microsensors for oxygen, l actate and glucose are integrated for continuous metabolic monitoring. (b) Photographs of an assembled device f i lled with coloured hydrogel and with attached PMMA-cover. Electrical sensor read-out i s done by means of a custom-made printed circuit board. Phase-contrast micrograph shows breast cancer stem cell (BCSC1) spheroids within a spheroid compartment after f ive days of culture. (c) Schematic cross-sectional view, including mater i als and technologies used. (d) SEM-micrograph of patterned SU-8 structures composing the fluidic structures. Barrier structures allow leakage-free filling of extracellular matrix hydrogels. The photograph shows gel-filled cell compartments. 65 °C for 5 h. This step patterns the fluidic walls as well as the t riangular shaped barrier structures. Development in 1-methoxy-2-propanol acetate (Sigma-Aldrich, USA) for 75 min on an orbital shaker revealed the cross-linked structures by dissolving unexposed SU-8, which were finally hard baked for 3 h at 150°C. 2.2. Sensor electrode modification Silver/silver chloride reference electrodes were fabricated by electroplating of a 10 um thick silver layer at -16 mA cm for 10 min in Arguna S solution (Umicore Galvanotechnik,Germany). This layer was then partially converted to silver chloride in 0.1 M KCl solution at 1.6 mA cmfor 20 min.The last fabrication step on wafer-level was the deposition of a permselective membrane onto the biosensor electrodes.Therefore,m-poly(phenylenediamine) Was deposited by electropolymerization during cyclic voltammetry using a 3mM 7m-phenylenediamine ((Sigma-Aldrich,,USA)S solution.Wafer dicing separated the 20 chips per wafer. Electrical connection to the system was ensured by flip-chip bonding to a printed c i rcuit board with the electrical l y conductive adhesive Polytec EC 242 (Polytec PT, Germany) and curing at 100 °C for 20 min. Since al l subsequent fabrication steps were carried out at room temperature, electrodes could now be further equipped with hydrogels, which partly contain temperature-sensitive enzymes. Oxygen sensor electrodes were modifiedthrough deposition of a diffusion-limiting membrane by manual dispensing and subsequent UV-curing of poly(2-hydroxyethyl methacryl a te) (pHEMA)).. The pHEMA P precursor solution consisted of 28% HEMA, 26% pHEMA, 42% ethylene glycol,3%triethylene glycol dimethacrylate (TEGDMA) and 1%Irgacure 651inn water. Circular SU-8rims aroundd the electrodes define the volume and protect the membrane during microfl u idic operation. Platinum counter electrodes were left untreated. For biosensor fabrication, pHEMA with entrapped 1l :actate oxidase (Sekisui Chemical, Japan) or glucose oxidase (BBI Solutions, UK) was dispensed onto the previously applied electropolymer membrane. If an increase of the linear range of the sensor was necessary, an additional diffusion-limiting pHEMA membrane without embedded enzymes was applied. Blank electrodes consisted of exact l y the same configuration but without lactate oxidase or glucose oxidase in the first pHEMA membrane. 2.3. Device assembly and electrical read-out The final fabrication step was the permanent attachment of a computer numerical Ccontrol1 (CNC) milled poly-(methylmethacry l ate) (PMMA) cover (2 mm thickness ) to the fluidic unit (Fig. 1b and c). The cover contained all fluidic in-and outlet ports and was placed manually on the f luidic walls using a stereo microscope. Both components of the system were at t ached by underfill i ng of the biocompa t ible epoxy-based adhesive Epo-Tek 302-3M (Epoxy Technology, USA)and subsequent curing at room temperature for 24 h. The same approach was used to seal the electrical connections between glass chip and PCB (Fig. 1b). The multi-channel potentiostat MultiPalmSens4(Palmsens, The Netherlands) was used in all electrochemica measurements in a 3-electrode setup using on-chip reference and(counter electrodes. Oxygen S sensor operation 1Was performed at an acquisition rate of 10 Hz using the following three-step chronoamperometric protocol: (1) 0.7 VAg/Agc i for 2s, (2) -0.4 VAg/Agc i for 2 s, (3) -0.3 VAg/Agc i for 6 s. Each measurement cycle was ended at open circuit conditions,whose duration defined the time between n two oxyger concentration readings and lasted 50 s or 110 s, depending on the experiment. Biosensors were operated at a constant potential of 0.5 VAg/Agcl and an acquisition rate of 2 Hz. 2.4. Cell culture The fluorescent -labelled breast cancer stem cell line 1 (BCSC 1eGFP) was ut i lized for al l cell-related experiments. Passage 30-40 cells were cultured in a 2D environment in mammary stem cell (MSC) medium with 2% Matrigel (Corning, USA) at 37 °C inside a hypoxia box (Billups-Rothenberg, USA) and low oxygen conditions (3% 02,5% CO2, 92%Nz). The cell culture medium consisted of mammary epithelial basal medium (Lonza Group, Switzerland) and was supplemented with 2%B27 (Gibco-BRL, USA), 1% amphotericin B (Sigma Aldrich,USA), 1% penicillin/streptomycin (Sigma-Aldrich, USA), 20 ng ml epidermal growth factor (PeproTech, USA), 4 ug ml heparin (Sigma-Aldrich, USA), 20 ng mlfibroblast growth factor (PeproTech, USA), 35 ng mlgentamic i n (Gibco, USA)and 500 nM rho kinase inhibitor H-1152 (Calbiochem, USA)Cells were split as soon as the confluence reached 70%. In order to isolate single cells from the 2D cell culture,cells were incubated with accutase (Life Technologies, USA for 20 min at 37 °C. After cell counting, the desired cell number was suspended in 25% MSC medium and 75%Matrigel on ice. A volume of 3.5 ul of the suspension was filled into each cell compartment through the gel loading ports using a 10 pl pipette and pre-cooled tips. The cell-lader chip was incubated at 37 °C for additional 30 min to let the Matrigel solidify. The polyimide tape HB830 (Hi-Bond Tapes,UK) was used in order to seal al l ports in a gas-tight manner on the top side of the platform which are not connected during microfluidic operation. Drug exposure experiments were performed using doxorubicin hydrochloride (Actavis,USA) and ant i mycin A (Sigma Aldrich, USA). 2.5. Microfluidic measurements Demonstration of fluidicCcompartment separation Was performed with spheroid compartments containing 0.5%agarose (Sigma-Aldrich, USA). Depending on the scenario,either pure phosphate-buffered saline (PBS) or PBS with 100uM H202 (Perhydrol, Merck, Germany) was perfused at 2 pl min through the respective channelby means of two precision syringe pumps ((PHD 2000Infusion/Withdraw, Harvard Apparatus, USA and Cavro XL 3000, Tecan Group,Switzerland). Throughout all cell-based and sensor-related measurements, the programmable syringe pump Cavro XL 3000 was used. Pump protocols were implemented with the software bioMON 4 (Jobst Technologies, Germany). Oxygen calibration was performed in PBS at 37°℃ and Matrigel-filled spheroid compartments. The electrolyte reservoir was purged with a mixture of air and nitrogen using the gas mixing station GMix41(Hitec-Zang,Germany).Biosensors were calibrated before and after an experiment usingaliquots S Cof f MSC medium containing g different concentrations of sodium L-lactate (Sigma-Aldrich, USA) and D-(+)-glucose-monohydrate (Honeywel l Fluka, USA). After platform seeding with the desired cell density, the system was placed in an oven at 37 °C and electrically connected to the potentiostat. Unless otherwise stated, the inlet of the middle channel was connected to a reservoir filled with 15 ml MSC medium via microfluidic tubing. An atmosphere consisting of 95% air and 5% CO, supplied by the gas mixing station was created within the reservoir. A syringe pump was connected to the same channel 's outlet in order to aspirate the cell culture medium in stop/flow (2pl min ) cycles. The i nverted microscope Nikon Eclipse TE2000-U (Nikon, Japan) was used to acquire phase-contrast and f luorescence images. 2.6. Computational modelling of mass transport We performed computationa a l ln modelling of the mass transport in the microfluidic organ-on-chip system using finite element analysi i s s with COMSOL Multiphysics S4.2(COMSOL, USA). The physics interface“Transport of Diluted Species” bearing Fick’s law was chosen under the assumption of diffusion limited mass transport t within thee two-dimensional model. No further interaction of the molecule with the hydrogel wasassumed. Concentration changes within the supply ychannel were implemented with a transition time of 20 s. Hydrogen peroxide and doxorubicin,with diffusion coefficients in water modelled as 2 × 10°m²s(re f . 39, 40) and 0.58 × 10°m²s -1,41 respect i vely, were used as representative substances for small and larger molecules..Diffusion coefficients S for th 1e e S substances in 75% Matrigel in the cell chambers are not available in the literature. Based on our own measurements, we estimated the diffusion coefficients in 75% Matrigel to be 25% lower than in water, which 1is in goodagreement with the literature 42 for 100% Matrigel. Additional analyses for various diffusion coefficients, chip locations and diffusion times can be found in the ESI.t 3. System concept and design The presented microsystem is designed for three-dimensional l .,I matrix-basedC cell cultivation and sensor-assisted characterization of the metabolic microenvironment.Preliminary results were introduced earlier.43Simple, microstructure-guided gel integration allows the embedment of art i ficial extracellular matrices (ECM) commonly used for in vitro cell cultivation 44 into the closed pla t form, such as Mat r igel, but also agarose or polyethylene glycol (PEG).Within these compartments, single cells of mono-or co-cultures develop into organoids with heterogeneous 3D structures during microfluidic operation, while cell culture medium is supplied via adjacent microchannels (Fig. 1a and b). The same channels permit the targeted control of culture conditions, insertion of external stimuli such as drugs or hypoxia, and a fluidic separation of culture compartments for investigation of cell -cell interactions. In contrast to open systems such as hanging droplet platforms or systems made of PDMS, an accurate control of the Ire dissolved gas composition and the ability to measure cel l ulai respiration rates is enabled by the gas-tight sealing of the culturing milieu.. Electrochemical microsensorS S .,(directl integratedinto the culture env i ronment, monitor both culture conditions and cellular metabolism. The metabolic parameter C s S Coxygen,lactat c e e a and glucos S e e are measured cont i nuously in a stop/flow perfusion concept for renewal of the medium without exposing ce l ls to flow-induced shear stress. Additionally, the design also a l lows passive pumping schemes , e.g. by gravity. The fluidic unit of the system is disposed on a 16.2×10.6mm’ Pyrex borosilicate glass chip using microfabrication processes and consists of two 1.4 ul cell compartments surrounded by three 500 um wide microchannels (Fig. 1a)Within the platform, electrochemical microsensors are integrated 11into the e bottom of thieeg glass S chip.Three amperometric oxygen sensor electrodes (0 200 um) are located in each of the three channels in close vicinity of the compartments. In another design variation, oxygen sensors are additionally located in the spheroid compartments bottom in order to access pericellular oxygen levels. Three enzyme-based biosensor electrodes for glucose, lactate and the bl a nk signal are present downstream the middle channel Biosensors are located just outside the ce ll culture area so that the occurring reactions do not influence the cells , but close enough that undiluted low-volume medium can be measured. Additionally, the biosensor technology allows the potential detection of additional molecules such as pyruvate,glutamate45or superoxide28 by changing the embedded enzyme. Each microchanne l has a downstream rectangular shaped counter (0.35 mm2) and circular silver/silver chloride (Ag/AgCl ) reference electrode in order to measure the analytes in a 3-electrode setup. Biosensor and reference electrodes have a diameter of 300 um. Based on previous studies of Bohl et al.46 and Rubehn et al.,47 a mult i -layer rphoto-lithographyy process Was elaborated to pattern the structures which form the fluidi unit from permanent epoxy photoresist (SU-8). The interface between compartment and microchannel, which is defined by barrier structures that guide l eakage-free filling of the liquid cell/matrix suspension, ensures diffusion of dissolved molecules into and out of the compartments during culture. Barr i er structures are composed of a 40 um high step with superimposed equilateral triangles of 100 um edge length and 200 um spac i ng (Fig. 1d). The height of the triangles extends up to the ent i re height (280 um) of the inner volume of the pl a tform, which can be adjusted with a high precision and reproducibi l ity by means of the mult i-layer fabrication process. In combination with the flat step, the integrity of the introduced gel is not affected by fluidic operation for more than one week. The top part of the platform is formed by a mi l led PMMA cover including all fluidic ports and is hermetically bonded to the fluidic unit (Fig. 1c). The design is such that all fluidic structures could be included in the cover alone, e.g. as an injection moulded part, for more efficient fabrication. Single cells suspended in an ice-cold Matrigel/medium mixture are i ntroduced with a standard laboratory 10 pl pipette via cell-loading inlet ports on the topside of the platform ((s s e e e e M Movie S1t). The guidance of the barrier structures provides leakage-free fluid propagation through the spheroid compartments (Movie S2t) with a homogeneous cell distribution. The modular arrangement of compartments and(channels permit L s S upscaling if additional cultures are to be studied. An internal volume of below 10 allowsrapid changes of substance concentrations andreactions to externa al S stimuli, using small amounts of fluids. Culture condi t ions dur i ng drug screening experiments can thus be changed dynamically within short time intervals. Fig. 2Mass transport control study. H202 in PBS was used as test substance and measured with microsensors located in the centre of each microchannel .(a) Liquid perfusion is exc l usively performed within the middle channel leading to ident i cal microenvironments i nside both spheroid compartments, reflected by the overlapping sensor signals. (b) Second operation mode in which a constant flow is applied to an outer channel. If perfusion within the middle channel is stopped, concentration gradients form across both compartments permitting communication of different cell types. Application of a flow to the same channel interrupts the communication by fluidic separation. (c) Computational modelling of mass transpor t for hydrogen peroxide (Duig= 2.50×10’m²s -, Dge=1.875×10-’m²s -l) diffusion from the centre channe l i nto the cell chamber . The measurement results fit the modelled behaviour very well, confirming that the sensor signals follow the underlying principles, and that mass transpor t is dominated by diffusion. (d) Computational model l ing of the mass transport of a larger molecule, the cancer drug doxorubicin (Dlig =0.58×10’m²s 1, Dge l =4.35×10⁻¹⁰ m²s-l ) into the cell chamber. 4.1. Mass transport and microfluidic compartmentalization The C chip layout allows generation of different microenvironments in both spheroid compartments, as wel l as control of the communication between the embedded cells by directing fluid flow to speci f ic channels. To illustrate the system's capabi l ities, Fig. 2 shows two possible operation modes together with electrochemical measurements under microfluidic operation, in which each mode was performed in Ssequence. Hydrogen 1peroxide (H202)i in P phosphate buffered saline (PBS), which occurs as a reactive species and behaves similarly to oxygen in terms of diffusion, was used as test substance for these diffusion analyses. Experimental study. Fig. 2a shows the first operation mode in which the two outer channels are kept static, while the emiddle echannel is perfused. This leads t t C o equal substance distribution into both spheroid compartments due to the axial symmetry of the chip. Depending on the diffusivity of the individual solute within the used hydrogel,concentration gradients develop from the centre to the outer walls s of th 1e e chip.. This Was demonstratedwith an electrochemical measurement, in which all sensors showed a signal close to zero at the beginning, since no oxidizable substance was present in PBS. As soon as H02 entered the platform via the middle channel, the sensor located within it showed a rise in signal which was dependent on the analyte concentration and the flow rate. With a lag of around 70 s,the sensors near the outer walls of the chip showed an increase in signal current, asH202 molecules diffused through the hydrogel containing compartments leading to a rise in concentration. Thereby, the courses and final values of both sensor signals were similar, indicating a symmet r ical substance distribution within the chip and a highly reproducible sensor performance. After purePBS Was perfused again in the middle channel, it took 30 min (t90%-10%)until the hydrogels released all H202. Sen signals increased and decreased according to t(-1/2) matching the one-dimensional analytical solution of Fick's second law.48 Hereby, we show how i ntegrated sensor measurements can enable the assessment of mass transport in organ-on-chip devices. Fig. 2b shows the case where the supply of nutrients and oxygen is ensured via one outer channel, while the other two channels are kept static without flow. Thus, concentration gradients range over the entire width of the chip. In addition,communication between the compartments can then take place by diffusion of signalling molecules through the static middle channel. Applying a flow to this channel leads to an interruption1of the communication1andisolatesboth compartments fluidically. The application of the middle channel for such fluidic separation was S validated by a measurement with H202, which can be seen as a signalling molecule equivalent with a comparatively high diffusiv i ty due to its smaller size. After adding H202 to the outer channel, it diffused through compartment A and reached the middle channel, where liquid flow prevented further diffusion into compartment B. By stopping the f low in the middle channel,the H202 entered the static channel through compartment B as indicated by the increase of the sensor signal within this channel . Re-establishment of the flow resulted in a removal of H202 from compartment B and re-isolation of both compartments. Hereby, we show the successful manipulation of mass transportandd t thus culture conditions by compartmentalization and microfluidics. Computational study. Fig. 2c shows the simulated mass transport of a a Ssmall molecule, e.g.hydrogen peroxide recapitulat i ng the experiment in Fig. 2a. As expected, there is an almost immediate concentration change in the centre channel and an increasingly slower change, the larger the distance to the centre channel becomes. The dashed line shows the normalized experimental data from Fig. 2a for the hydrogen peroxide measurement in the outer channel. It can be observed that the experimental data follow the simulated curve very closely. The main qualitative difference is observec in the higher signal at the end during the removal of the substance, which can be expl a ined by an ongoing release of substance from the dead ends of the fluid channels that were not modelled. The degree of quantitative match between experiment and s i mulation lies in the accuracy of the used diffusion coefficients. Data for different combinations of diffusion coefficients and the influence on diffusion times are found in the ESI.t Overall, i t can be shown that our sensor data follow the underlying physical principles, which are dominated by diffusion within the cell compartments,and reflect the expected mass-transport situation very well,both qualitatively and quantitatively. Furthermore, i t was shown that in situ sensors can provide valuable informatior by verifying parameters used in computational models, s uch as the diffusion coef f icient, which is extremely challenging to measure but has strong influence on the mass transport. Fig. 2d shows the same situation as Fig. 2c, just for a much slower diffusing substance, such as the drug doxorubicin. As expected, a much 1 slower concentration change can be observed. Overall , it can be assumed tha concentrations of small molecules such as oxygen are fully exchanged in the cell compartments within a typical flow phase of 30 min. For matrix-based 3D cel l culture systems, it should be considered that diffusion is comparably slow if there i s no forced mass transport , e.g. by flow, and diffusion times even in highly permeable ECM gels are in the range of minutes to hours depending on the molecule size. Further details regarding system geometry, diffusion coefficients and diffusion times are found in the ESI.t 4.2. Oxygen sensor characterization The applied amperometric oxygen sensor principle relies on the electrochemical reduction of oxygen at the platinum surface. Concentration changes are therefore determined by measuring the mass transport change to the electrode. Fo this purpose , an opt i mized chronoamperometric protocol Time in h Fig. 3 Oxygen sensor and gas-tightness characterization. Medium flow was applied to the middle channel at 10 ul min. Both outer channels were kept static. (a) Sensor response for the chronoamperometric oxygen measurement protocol in air-saturated and nitrogen-flushed PBS. The mean current density of the last second is taken for data evaluation. (b) Oxygen sensor calibration before and after long-term measurement in MSC medium. Error bars are s.d. (c) Transient oxygen calibration. (d) Gas-tightness verification by lowering the oxygen concentration via fluidics and subsequent stopping of the perfusion. Dissolved oxygen concentration remains in hypoxic regime within the spheroid compartment even after 3 h without active supply of oxygen-f ree electrolyte. Was applied (Fig g ..33a), which h is based on the unique characteristic features of platinum electrochemistry. Initially,platinum oxide is formed at an anodic potential. The formed oxide layer is reduced in the following step by lowering the potential to a cathodic region. As a result , a bare platinum surface is present at the electrode-electrolyte interface, which acts as a catalyst for the oxygen reduction reaction. In a last upward step by 100 mV to achieve faster sensor stabi l ization,the actual oxygen measurement takes place. A typical current response is shown in Fig. 3a for oxygen concentrations at atmospheric and anoxic conditions. Oxygen-free conditions result in a sensor output close to zero allowing one-point calibration. An approximately 20 um thick pHEMA-based diffusion limitation membrane is dispensed into the SU-8polymer rims surrounding the sensor electrodes (Fig. 1c) in order to obtain a de f ined diffusion profile above the electrode and thereby increase the stabi l ity of the sensor response. By cyclic formation and removal of the oxide layer, the electrode is permanently cleaned during the measurement.This leads to a remarkably high long-term stability of the sensor without measurable drift over one week, even within protein-containing cell culture medium, as demonstrated in Fig. 3b. Sensit i vity did not change after more than 8 days of continuous operation. These results underline the stable electrochemical protocol and the protection of the electrodes by the membranes, which successfully prevent electrode fouling and attachment of blocking substances. Additionally sensitivity can be adjusted by the membrane thickness. In the shown example, the sensit i vity was -0.58 p uA cmuM with a relative error of 0.8%±0.4% before and 1.2%±0.4%after long-term measurement (n = 6 × 3, based on 6 different concentration values in 3 independent calibration runs) witl respect to the measurement range. All electrodes showed a detection limit below 1 uM (based on 3 o of the bl a nk). Low standard deviations of the measurement points indicate highly reproducible measurement of the oxygen concentration within the platform. 4.3. Gas tightness In many microfluidic systems for culturing and monitoring spheroid cultures that are made of gas-permeable materials (such as PDMS) or open systems (such as hanging droplets),the gas composition in the cell culture medium is regulatec by gas exchange with the incubator environment. This is a convenient approach, however unlike the in vivo situation, i f a constant and reproducible oxygen concentration is desired for al l tissue types in the system, especial l y if several systems are used in parallel for a high throughput evaluation. We intentionally used gas-impermeable materials s to have a targeted control of the gas composition through external gassing of the medium in reservoirs outside the microsystem.In addition, this S enables the determination of cellular respiration rates, since the controlled influx of new medium is the only source of oxygen molecules. The ability of the system to maintain hypoxic conditions withinna S spheroid d compartment Was verifiedwith an experiment (Fig. 3d) in which the oxygen concentration was first lowered to below 15 uMby perfusing oxygen-free electrolyte. Upon stopping the flow for 3 h, oxygen has increased to a final concentration of 35 uM, remaining in hypoxic regime. Most likely, this slight increase is caused by oxygen dissolution from microbubbles which remain after the sealing of inlet and outlet ports, rather than by oxygen dif f usion through the compartment surrounding materials.However , in practical operation during cell culture, typical stop phases do not last longer than 30 min, which leads to a maximum oxygen concentration increase by 10 uM, if there is no cellular oxygen consumption. 4.4. Formation of breast cancer stem cell spheroids The cel l model used in this work consists of triple-negative breast cancer stem cells, more specifically of the breast cancer stem cell line 1 (BCSC1), one of five extensively characterized BCSC lines isolated from primary invasive tumours of individual patients.3,49,50 BCSCs are of particular interest in the development of personalized chemotherapy approaches for triple-negative breast cancer patients, as they are considered to be responsible for both cancer metastasis and therapy resistance. Fig. 4a shows the development of single BCSC1 cells into spheroids with a mean diameter of approximately 50 um after four days of culture under dynamic f l uidic operation in which cel l culture medium was perfused through the middle channel of the chip. By variation of different seeding densit i es, an optimum was found between 0.5 ×10 and 2×10° cells per ml, resulting in a total cell number of 3500 to 15000 cells per pl a tform. In this range, there were enough cells for a sufficiently high measurement signal and at the same time no lack of nutrients occurred, and enough room for growth remained over a time span of at least five days.Due to the axial symmetry along the central channel, the same concentration gradients develop in both cell chambers,as confirmed in Fig. 2a. Thus, spheroids in compartment A and B experience the same culture conditions during growth and do not differ in size or amount (Fig. 4b and c).Furthermore,on-chip )grownn S spheroids have the same morphology and size distribution as within a standard wel l -plate format (Fig. 4c). Typica l for cultures in which spheroids develop from ECM-embedded single cells, the spheroid size b M e diumI supply E E > 750 p m 1750 p m 2250 p m 2750 p m Mediuml 250 p m 1250 p m 175 C static Distance to medium supply i n pm Fig.. 4 On-chip tumour spheroid formation. (a)) Phase-contras micrographs of single breast cancer stem cells (BCSC1) embedded in 75% Matrigel right after seeding and gelation at a seeding density of 2x10° cells ml. During dynamic supply with cell culture medium over days, spheroids develop within compartments. Scale bar, 500 um.Inserts show W microgra ap p h h o o verlays(phase-contrast a and green fluorescence) of a single cel l and a spheroid. Scale bars, 50 um. (b)Phase-contrast micrographs showing spheroids on day 5 of culture which have grown under two different medium supply situations.Seeding densities: 1.5 × 10 cells ml -1(top) 0.5 ×10 cells ml-1(bottom). (c) Comparison of spheroid diameter distribution for static conditions within a traditional well-plate (seeding density: 1.5×10°cells ml l ) and f or both dynamic situations on-chip (n ≥58). distribution 1varies s morewidelyy comparedto 1methods where individual spheroids s are formed from aggregation of a def i ned number of cells using microf l uidic structures andt techniques.52I In n order to study spheroids with a uniform size distribution or l arger diameter for highe metabolic activity instead of the development from single cells, spheroids can be grown outside the platform, sorted by a cell strainer with defined mesh size and transferred into the platform. The lower micrograph of Fig. 4b shows an example where the whole inner volume of the platform was f i lled with cell-laden Matrige l , with the exception of one outer channe which was used for medium perfusion. This asymmetr i c supply with fresh medium results in substance gradients across the ent i re width of the platform, as demonstrated in Fig. 2b. Previous studies demonstrated for adherent cell monolayers and matrix-embedded cancer cells4 that such gradients lead to nutrient-dependent metabolic profiles and ce ll viabi l ity. Consequently, spheroids developing closer to the e supply were e exposed too moree f favourable growth conditions than cells growing more distant , as reflected in their structure. This i 1s S a also evident from the spheroid diameter (see Fig. 4c), which was significant l y smaller when the spheroids were located more than 1.75 mm from the supply channel. Since in all experiments we observed that BCSC1 spheroids grew l argely independent of the oxygen concentration, we speculate that other factors such as the accumulation of wasteproducts leads to inhibition of spheroid growth. These f indings underline the importance of selecting appropriate scaling of cell culture environments,considering the diffusion properties of nutrients and cellular waste products within the used ECM, and verifying culture condi t ions in situ with integrated sensors. 4.5. Measurement of cellular oxygen consumption Fig. 5 shows the signal of an oxygen sensor located in the centre of the perfusion channel, in between of both cell compartments. During growth, the culture medium 1Was aspirated through the platform in stop/flow cycles with each phase lasting for 30 min. In the stop phases, act i ve supply of medium with atmospheric oxygen concentration Was stopped. The change in oxygen concentration within the chip was then solely caused by the cel l s and showed a steady decrease over time (Fig. 5b). Oxygen sensor consumption during a stop phase was only 0.3% with respect to the overall oxygen content within the chip and can ttherefore be neglected. During flow phases, cells were re-supplied with oxygen-r ich medium, which passed over the sensor at 2 ul min , bringing its signal back to baseline. Since the signal is superimposed by a flow-dependent offset, the sensor showed a higher oxygen concentration than the expected 188.7 uM at atmospheric conditions (19.9%02,5% CO2). The gap in the oxygen measurement after addition of the drug resulted from electrical disconnection of the system from the potentiostat to characterize the state of the cells under the microscope and subsequent recalibration of the biosensors. Over time, the oxygen demand of the cel l s increased, due to proliferation and exponential growth of the cell number within the forming spheroids. This is also reflected in the decrease of oxygen concentration during the stop phases in the course of culture time (Fig. 5a). After 3.75 days, all available oxygen molecules were metabolized during the stop phases, as indicated by a sensor current of -1.2 uA cm ,which represents 1.5% of atmospheric conditions matching a b Time i n h Time in h Fig. 5In-line oxygen monitoring. Oxygen monitoring in the central perfusion channel during the formation of breast cancer stem cell (BCSC1) spheroids at a seeding density of 2× 10 cells ml-. MSC cell culture medium Was perfused in stop/flow (cycles. Oxygen concentration Was measured every 2 minutes. (a) Oxygen measurement over 6days dur i ng spheroid formation including exposure to the metabolism alter i ng drug antimycin A. (b) Section over 4 hours on day 3 of the same measurement. Each measurement point represents the oxygen concentration at the given time. (c) Oxygen consumption over t ime, whereby the slopes of the l inear fits of the last 5 concentration values of each stop phase were taken for data evaluation. the sensor output at anoxic conditions during calibration (Fig. 3a). Oxygen consumption increased with a doubling time of 21.7 h (Fig. 5c). After 4 days of culture, 100 uM antimycin A was added to the cel l cul t ure medium leading to an abrupt rise in oxygen concentration to atmospheric condi t ions. As ant i mycin A inhibits mitochondrial electron transfer,5 the aerobic cell metabolism was suppressed, as shown by the drastic decrease in oxygen consumption. A cellular response to the drug occurred within a 1 hour stop/flow cycle (Fig. 5a). By integration of oxygen sensors into the perfusion channel of such dynamic cell culture systems, the oxygen concentration of the inflowing medium can be monitored. At the same time, oxygen consumption rates can be determined very accurately and used for revealing drug induced effects on the respiratory metabolism. 4.6. Pericellular monitoring and exposure to doxorubicin While the previous example covered the oxygen concentration change within the medium supply channel of the system,Fig. 6a shows a long-term oxygen measurement in the centre of a spheroid compartment in close vicinity to the spheroids.By integration into the cell compartment, the sensor’s signal isnot flow-dependent and indicates t the actual oxygen concentration experienced by the cells even during flow b 3 4 5Time in days Stop Flow Time in min Fig. 6Long-term oxygen monitoring.(a) Pericellular oxygen monitoring within a spheroid compartment at a seeding density of 1.5×10° ce l ls ml =1. Oxygen concentration was measured every minute.During measurement, cells were exposed to three hypoxic phases and two exposures to different concentrations of doxorubicin. (b) Course of the oxygen concentration at the respective day of culture. phases. Dur i ng the first three days of culture, flow phases re-established conditions at 19.9% oxygen. Afterwards, this baseline was no longer reached due to the high oxygen uptake by the cel l s, as shown in Fig. 6b, where stop/flow sections at the end of the respect i ve day are summarized This observation underlines the importance of positioning sensors for oxygen monitoring within the cell embedding ECM to)access the realisticc culture microenvironment experienced by thee cells even during active medium perfusion. During spheroid development, three experimental phases were incl u ded, in which the supply with fresh medium was interrupted for 4 h (Fig. 6a) in order to mimic acute cycl i c hypoxia as seen in real tumours during accelerated growth compared to healthy tissue.6 After each phase, the oxygen concentration returned to values as before stopping the f l ow and the cellular oxygen consumption did not change. Since the oxygen consumption was also not affected, it is showr that BCSC1 cells have an adapted metabolism and tolerate hypoxia well , whereas oxygen consumption does not depend on the overall oxygen concentration. On the sixth day of culture (Fig. 6a), 30 ng mlof the chemotherapeutic drug doxorubicin, frequently used for the treatment of breast cancer and based on the intercalation into the DNA,was added to the cell culture medium. At this cri t ical concentration, BCSC1 cel l s show a a S significantly inhibited cell proliferation when cultivated d in 2D.499contrast,the BCSC1spheroidsshowed 1no change metabolism even more than 24 h post drug exposure. Afte increasing that concentration by a factor of 10, the oxygen concentration course changed to higher values. As verified by microscopy the cells began to die, whereby the oxygen concentration within the compartment successively began to rise. Comparing the onset of action on oxygen uptake for antimycin A (Fig. 5a) and doxorubicin (Fig. 6a ) indicates, that antimycin A induces a drug response much faster reflect i ng thee differences in th L e e mechanismsSC of f action. Such acquisition of additiona l information on pharmacodynamics highlights t the fundamental benefit of sensor-based pericellular metabolic monitoring g.. In comparison to a tradi t ional experiment where cells are exposed to a drug, re-seeded and proliferation is monitored over days, our method allows real-time, online andquantitativeaccess to cel l metabolism. 4.7. Glucose and lactate monitoring Biosensors are based on the equimolar conversion of glucose or lactate into H202 inside the pHEMA-based hydrogel, which is immobilized on the electrodes and entraps the enzymes glucose e oxidase OI lactate e (oxidase,, respectively.The concentration of the analyte is then determined by the current density for the oxidation of the formed H02 at a potent i al of 0.5 VAg/Agc i . Sensor calibration for glucose and lactate sensors are shown in Fig. 7a and b, respectively Duringmeasurement , a blank-signal was recorded by ar Spiked glucose concentration in mM f T i me i n days Time in days Fig. 77Biosensor characterization and long-term measurements. (a) Spiked glucose biosensor calibration before and after operation within long-term culture. Error bars are s.d. (b) Lactate biosensor calibration before and after operation within long-term culture. Error bars are s.d. (c) Glucose and (d) lactate signal simultaneously recorded during microfluidic operation (stop 10 min/flow 30 min). (e) Glucose uptake and (f) lactate production during long-term culture and their change upon addition of 100 uM antimycin A. electrode without embedded enzyme, in order to subtract unspecific background signals. The developed biosensors showed a highly l i near, reversible and selective behaviour within the physiological range. The limit of detection was 7.6uM (±3.7 uM, n = 3) in case of glucose and 6.1 uM (±4.2 uM,n = 3) for lactate sensors. Sensitivity, l i mit of detection and linear range can be adjusted for the desired application by varying the height of the diffusion-li mi t ing membrane within the e membrane stack. An individual calibration Was performed prior and after each experiment. Drift correction was performed under the assumption of linear sensitivity decay for long-term measurement evaluation. Fig. 7c and d shows typical biosensor signals during spheroid cultivation. Due to the high glucose background concentration1in MSC medium and the cellular lactate secretion, both analytes were always present and converted by the e enzyme membranes.This resulted in a HO2accumulation over the sensor electrodes and a signal increase during stop phases. Biosensors were placed outside the cell compartments downstream the microchannel in order to prevent H202 diffusion into the inner volume of the platform.At the beginning of a flow phase, the consumed medium was removed from the culture volume and passed over the sensor.As glucose was metabolized by the cells, a signal drop relative to the background wa a s S detected, and d iits S uptake e Was quant i fied by subtrac t ion of both signal val u es. In case of lactate, a distinct signal peak appeared at the initiation of perfusion. Both glucose consumption and lactate secretion increased with rising cell density and decreased again afte the addition of a lethal dose of antimycin A. Compared to the example in Fig. 5, the stop phase duration was reduced to 10minutes, so that oxygen-rich medium was perfused more frequently. Consequently, the oxygen concentration was within the normoxic range throughout the ent i re culturing duration (Fig. 6a). However, a remarkably high lactate signal was measured indicating that the cells show a substantial nonoxidative e1metabolism of glucosebesides aerobic respiration, as known to o be 2a t typical 1characteristic of cancerous tissue.58 Regarding the r ratioof glucose consumption (Fig. 6e) to lactate production (Fig. 6f), we observed a slightly lower glucose consumption than a 1:2ratio. It has to be noted that the absolute quant i fication of pericel l ular levels in the matrix-based culture by microfluidic measurement isS highly complex. Glucose 上 has a slower diffusion in comparison to lactate because it is the larger molecule, and glucose is supplied with the medium while lactate is only produced by the cells. During the stop phase,exchange of the medium with the gel compartments occurs only near the gel16edges. Therefore,our glucose measurements may represent a slight underestimation of the actual cellular consumption. Stil l , a quantitative comparison of the two metabolite concentrations is possible. Further, we have demonstrated for the first time that a quantitative and online on-chip measurement of these parameters from heterogeneous matrix-based dc cultures i1sS possible using biosensors that are located outside the cell culture areas. 5. Conclusions We have developed a microfluidic organ-on-chip platform with1integrated electrochemical microsensor arrays for compartmentalized matrix-based organoid cultivation from single stem cell I s s for acquisition of relevant metabolic parameters in real-time. The developed transparent technology is based on a multi-layer microfabrication process for an advanced, modular microfluidic unit on a glass chip.Any matrix-based culture can be integrated by simple, barrier structure-guided filling of the microliter-scale cell compartments with standard laboratory equipment.Introduction of single triple-negative breast cancer stem cells into the low-volume microsystem results in a heterogeneous spheroid culture from a small cell number of less than 15 000cells during microfluidic operation. These patient-derived stem cell s s recapi t ulate the individua a l l patient 's S tumour in vitro and are therefore an ideal model for testing both drug efficacy and tolerance towards individualized chemotherapy.In many organ-on-chip systems culture conditions and cel l metabolism are not accessible on a pericellular level, and can be neither controlled nor verified in situ. The chip design, comprising two cell compartments with adjacent microchannels, permits the incorporation of co-cultures in C combination with individual microfluidic accessibi l ity. Notably , unlike PDMS-based or open systems,our gas-tight system allows the generation of hypoxia on-chip and the control of culture conditi i o on n s s e e n n t t irely via the medium. Such a design enables replication of a microenvironment as found in tumours. We demonstrated the flow-controlled fluidic separation of the compartments whichican uti l ized,e.g., for investigation of the be intercellularcommunication. Computational modelling conf i rmed that sensor signals precisely reflect the mass transport by y diffusion. Hereby y ,, we have shown I how integrated sensors can contribute to design considerations of organ-on-chip systems. Hypoxia is essential in cancer, and we have shown how culture conditions can influence spheroid growth on chip. Integrated sensors can deliver important real-time information n (culture conditions Sand 1cell metabolism, which is currently st i l l underrepresented in the increasingly popular microphysiological and organ-on-chip systems. We developed precise and long-term stable electrochemical sensors for oxygen, lactate and gl u cose and successfully applied them over more than one week of culture. While other systems h have focused on single or multiple spheroids, we have now demonstrated that it is possible to determine consumption and production rates from heterogeneous, matrix-based 3D culture reversibly and absolute quantitat i vely, enabl i ng conclusions about cell state in real-time. Unlike classical macroscopic cell culture models the high ratio of cell number to medium volume resulted in high concentration changes of metabolites within short time intervals. This provides a higher temporal resolution of cellular metabolic changes and, e.g. the exponential growth phase of the spheroids can be determined direct l y, beyond microscopy and optical inspection. Our results also show the implications for sensor locations in matrix-culture. Sensor integration into perfusion channe l s can be e used f for controlling the oxygen concentration of the medium supply Sensors in the cell chambers measure pericellular values,while sensors in the microfluidics monitor the medium supply but also can be used to extract meaningful metaboli signals, especial l y biosensors which are preferably located outside the cell compartments. Besides monitoring of culture conditions, sensor array measurements can reveal cellular effects to drug exposure Su b stantial differences in drug resistance of spherically grown patient-derived, triple-negative breast cancer stem cell s compared to t their r two-dimensional equivalents were observed based on cellular I metaboli I c C activity measured by embedded 1sensors.s The ability to perform such investigationsi essential in the development of personalized treatment options. In contrast to endpoint analyses, cell metabolism can be observed continuously Since culture conditions s i gnificant l y affect the propert i es of(cancerra and d (other cells.S standardization nof f their microenvironment is essenti a l and can be great l y enhancec by meansof such sensorintegration. In n summary, by accurate monitoring of metabolic parameters in a clinically relevant tumour organoid model, we have shown how our sensor-integrated organ-on-chip platform extends the state of-the-art in the context of patient-specific chemotherapy towards personalized medicine. Author contributions Conceptualization: JD, JK, JM, AW; investigation: JD, HM,AW; writing - original draft preparation: JD; writing - review & editing: JD, JK, HM, JM, GAU, AW; visualization: JD, A W;supervision: JK, JM, GAU, AW. Conflicts of interest The Baden-Wirttemberg Stiftung gGmbH has f iled a patent application related to this work. AW, JD, JK, JM and GAU are co-inventors of this patent application. Acknowledgements Financing by Baden-Wurttemberg St i ftung within the projec t MIVT-1, MEMONO, is gratefully acknowledged. References 1 A. van den Berg, C. L. Mummery, R. Passier and A. D. van der Meer, Lab Chip, 2019, 19, 198-205. 2 V. van Duinen, S. J. Trietsch, J. Joore, P. Vulto and T.Hankemeier, Curr. Opin. Biotechnol., 2015, 35,118-126. 3E. Metzger , S. S. Stepputtis, J. Strietz, B. T. Preca, S. Urban,D. Willmann, A. Allen, F. Zenk, N. Iovino, P. Bronsert, A.Proske , M. Follo, M. Boerries, E. Stickeler, J. Xu, M. B.Wallace, J. A. Stafford, T. Kanouni, J. Maurer and R. Schile,Cancer Res., 2017,77,5900-5912. 4L. A. Low, C. Mummery, B. R. Berridge, C. P. Austin and D. A. Tagle, Nat. Rev. Drug Discovery, 2021, 20, 345-361. 5 M. Kapalczynska, T. Kolenda, W. Przybyla , M. Zajaczkowska,A. Teresiak, V. Filas, M. Ibbs , R. Blizniak, L. Luczewski and K. Lamperska, Arch. Med. Sci., 2018,14,910-919. 6 A. Sontheimer-Phelps, B. A. Hassell and D. E. Ingber, Nat .Rev. Cancer, 2019,19,65-81. 7 C. K. Byun, K. Abi-Samra, Y. K. Cho and S. Takayama,Electrophoresis, 2014,35,245-257. 8 K. Renggli, N. Rousset , C. Lohasz, O. T. P. Nguyen and A.Hierlemann, Adv. Biosyst.,2019,3,1900018. 9 J. H. Sung, C. Kam and M. L. Shuler, Lab Chip, 2010, 10,446-455. 10 S. J. Trietsch, G. D. Israels, J. Joore, T. Hankemeier and P.Vulto, Lab Chip, 2013,13,3548-3554. 11C. P. Huang, J. Lu, H. Seon, A. P. Lee, L. A. Flanagan, H. Y.Kim, A. J. Putnam and N. L. Jeon, Lab Chip, 2009, 9,1740-1748. 12 Y. C. Toh, C. Zhang, J. Zhang, Y. M. Khong, S. Chang, V. D.Samper, D. van Noort, D. W. Hutmacher and H. Yu, Lab Chip,2007, 7,302-309. 13Y. Wang, L. Wang, Y. Zhu and J. Qin, Lab Chip, 2018, 18,851-860. 14 I. K. Zervantonakis, S. K. Hughes-Alford, J . L. Charest, J . S.Condeelis, F . B. Gertler and R. D. Kamm, Proc. Natl. Acad.Sci. U. S. A., 2012,109,13515-13520. 15 D. Liu, S. Chen and M. Win Naing, Biotechnol. Bioeng.,2021,118,542-554. 16 J. Kieninger, A. Weltin, H. Flamm and G. A. Urban, Lab Chip 2018,18,1274-1291. 17J. Kieninger, K. Aravindalochanan, J. A. Sandvik, E. O.Pettersen and G. A. Urban, Cell Proliferation, 2014,47,180-188. 18Y. S. Zhang, J. Aleman, S. R. Shin, T. Kil i c, D. Kim, S. A. M.Shaegh, S. Massa, R. Riahi, S. Chae, N. Hu, H. Avci, W Zhang, A. Silvestri, A. S. Nezhad, A. Manbohi, F. De Ferrari,A. Polini, G. Calzone, N. Shaikh, P. Alerasool , E. Budina, J Kang, N. Bhise, J. Ribas, A. Pourmand , A. Skardal, T. Shupe C. E.Bishop,M. R. Dokmeci i .,A 1..Atala and Khademhosseini, Proc . Natl. Acad. Sci. U. S. A., 2017, 114,E2293-E2302. 19D. Bav l i, S. Prill, E . Ezra, G. Levy, M. Cohen, M. Vinken, J Vanfleteren, M. Jaeger and Y . Nahmias, Proc. Natl. Acad. Sci.U. S. A., 2016, 113,E2231-E2240. 20C. Wenzel, B. Riefke , S. Gruindemann, A. Krebs, S. Christian F. Prinz, M. Osterland, S. Golfier, S. Rase, N. Ansari, M Esner, M. Bickle, F. Pampaloni, C. Mattheyer, E. H. Stelzer K. Parczyk, S. Prechtl and P. Steigemann, Exp. Cell Res.,2014,323,131-143. 211C. J. Ochs, J. Kasuya, A. Pavesi and R. D. Kamm, Lab Chip,2014,14,459-462. 22 H. Zirath, M. Rothbauer, S. Spitz, B. Bachmann, C. Jordan,B. Muller, J. Ehgartner , E. Priglinger , S. Muhleder, H. Redl,W. Holnthoner, M. Harasek, T . Mayr and P. Ertl, Front .Physiol., 2018,9, 815. 23A. Weltin, S. Hammer, F . Noor, Y. Kaminski, J. Kieninger and G. A. Urban, Biosens. Bioelectron.,2017, 87,941-948. 24 J.Marzioch, J. Kieninger, A.V Weltin, H.Flamm 1,,]K.Aravindalochanan, J . A. Sandvik, E. O. Pettersen, Q. Peng and G. A. Urban, Lab Chip, 2018, 18,3353-3360. 25P. Mestres and A. Morguet, Expert Opin. Drug Discovery,2009,4,785-797. 26 C. Gehre, M. Flechner, S. Kammerer, J . H. Kuipper, C. D Coleman, G. P . Piischel , K. Uhlig and C . Duschl, Sci. Rep.2020,10,13700. 27E. Tanumihardja, R. H. Slaats, A. D. van der Meer, R.Passier, W. Olthuis and A. van den Berg, ACS Sens., 2021, 6,267-274. 28H. Flamm, J. Kieninger, A. Weltin and G. A. Urban, Biosens Bioelectron., 2015,65,354-359. 29 E. Tanumihardja, A. P. Rodriguez, J. T . Loessberg-Zahl, B Mei, W. Olthuis and A. van den Berg, Sens . Actuators, B,2021,334,129631. 30T. Liang, C. Gu, Y. Gan, Q. Wu, C. He,J. Tu, Y. Pan, Y. Qiu L . B. Kong, H. Wan and P. Wang, Sens. Actuators, B 2019,301,127004. 31A. Weltin, K. Slotwinski, J . Kieninger , I. Moser, G. Jobst, M Wego, R. Ehret and G. A..Urban, Lab Chip, 2014, 14138-146. 322F. Hafner, Biosens. Bioelectron., 2000,15,149-158. 33O. Y. F . Henry, R. Villenave, M. J. Cronce, W. D. Leineweber,M. A. Benz and D. E. Ingber, Lab Chip, 2017, 17,2264-2271. 34 B. M. Maoz, A. Herland, O. Y. F. Henry, W. D. Leineweber M.Yadid, J. Doyle, R.Mannix,V. J. Kujala,E. A. Fitzgerald, K. K. F Parker and D. E. Ingber, Lab Chip,2017,17,2294-2302. 35E. Naumovska, G . Aalderink, C. W. Valencia, K. Kosim, A .Nicola s , S. Brown, P. Vulto, K. S. Erdmann and D. Kurek, Int.J. Mol. Sci., 2020, 21, 4964. 36L. M. Griep, F. Wolbers, B. de Wagenaar, P. M. ter Braak,B. B. Weksler, I. A. Romero, P. O. Couraud, I. Vermes, A. D.van der Meer and A. van den Berg, Biomed. Microdevices,2013,15,145-150. 37P. M. Misun, J. Rothe , Y. R. F. Schmid, A. Hierlemann and O.Frey, Microsyst. Nanoeng.,2016,2,16022. 38J. Kieninger, Y. Tamari, B. Enderle, G. Jobst, J. A. Sandvik,E. O. Pettersen and G. A. Urban, Biosensors, 2018, 8, 44. 39 S. A. M. van Stroe-Biezen, F. M. Everaerts, L. J. J. Janssen and R. A. Tacken, Anal. Chim. Acta, 1993,273,553-560. 40 A. J . van Stroe and L. J. J. Janssen, Anal. Chim. Acta,1993,279,213-219. 41 M. A. Nejad, P. Umstatter and H. M. Urbassek, J. Mol.Model., 2020, 26, 54. 42 A. Colom, R. Galgoczy, I. Almendros, A. Xaubet, R. Farre and J. Alcaraz, J J ..Biomed.Mater.Res.,Part A, 2014,102,2776-2784. 43J. Dornhof, J . Kieninger, J . Maurer, G. A. Urban and A.Weltin,, in 20th International Conference eon Solid-State Sensors, Actuators and Microsystems and Eurosensors XXXIII,(Transducers and Eurosensors XXXIII, 2019, pp. 1106-1108. 44H. Liu, Y. Wang, K. Cui, Y. Guo, X. Zhang and J. Qin, Adv.Mater., 2019,31,1902042. 45A. Weltin, J . Kieninger, B. Enderle, A. K. Gellner, B. Fritsch and G. A. Urban, Biosens. Bioelectron., 2014,61,192-199. 46B. Bohl, R. Steger, R. Zengerle and P. Koltay, J. Micromech.Microeng., 2005, 15,1125-1130. 47B. Rubehn, S. B. E. Wolff , P. Tovote, A. Liithi and T. Stieglitz Lab Chip, 2013, 13, 579-588. 48Y. T. Kim, S. Bohjanen, N. Bhattacharjee and A. Folch, Lab Chip, 2019, 19, 3086-3093. 49X. Li, J. Strietz, A. Bleilevens, E. Stickeler and J. Maurer, Int.J. Mol. Sci., 2020,21,404. 50J. St r ietz, S. S. Stepputti s , M. Fol l o, P. Bronsert, E. Stickeler and J. Maurer, Int. J. Mol. Sci., 2021,22,1808. 51T . Reya, S. J. Morrison, M. F . Clarke and I . L. Weissman, Nat.Rev. Cancer , 2001,414,105-111. 52K. Moshksayan, N. Kashaninejad, M. E. Warkiani, J . G. Lock H. Moghadas, B. Firoozabadi , M. S. Saidi and N. T. Nguyen,Sens. Actuators, B, 2018, 263,151-176. 53S. Perottoni, N. G. B. Neto, C. Di Nitto, R. I . Dmit r iev, M. T .Raimondi 12and d M. G. Monaghan, Lab Chip, 2021, 21,1395-1408. 54 J. M. Ayuso, M. Virumbrales-Mufioz, A. Lacueva, P. M.Lanuza, E. Checa-Chavarria, P. Botella, E. Fernández, M Doblare, S. J . Allison, R. M. Phillips,J . Pardo, L . J . Fernandez and I. Ochoa, Sci. Rep., 2016, 6,36086. 55S. Tzung, K. M. Kim, G . Basanez, C. D. Giedt, J. Simon, J.Zimmerberg, K. Y. J . Zhang and D. M. Hockenbery, Nat. Cell Biol., 2001,3,183-191. K. Saxena and M. K. Jol l y , Biomolecules, 2019, 9,339. 57 C. J . Lovitt, T . B. Shelper and V. M. Avery, BMC Cancer,2018,18,41. 58 R. A. Gatenby and R. J. G i llies, Nat. Rev. Cancer, 2004, 4,891-899.
确定
还剩14页未读,是否继续阅读?

产品配置单
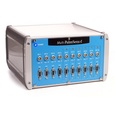
雷迪美特中国有限公司为您提供《【MultiPalmSens4电化学应用】微流控芯片器官系统,3D细胞培养中代谢产物监测的多重分析》,该方案主要用于其他中生化检验检测,参考标准--,《【MultiPalmSens4电化学应用】微流控芯片器官系统,3D细胞培养中代谢产物监测的多重分析》用到的仪器有MultiPalmSens4多通道电化学工作站(EIS)
相关方案
更多
该厂商其他方案
更多