


方案详情
文
刺荨麻叶片中脂肪酸测定的样品制备方法如下:
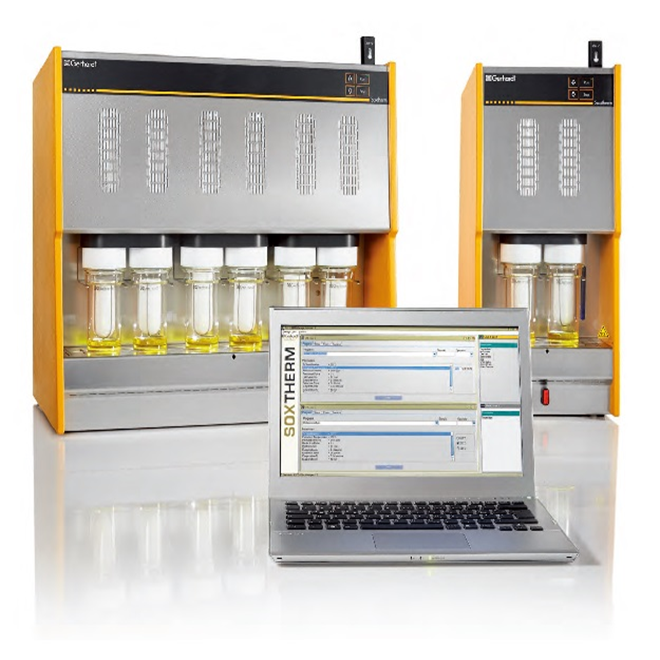
在格哈特公司全自动快速索氏提取系统:索克森SOXTHERM中使用100ml石油醚在150摄氏度的条件下提取一定重量(5 g)的刺荨麻叶片2小时。
方案详情

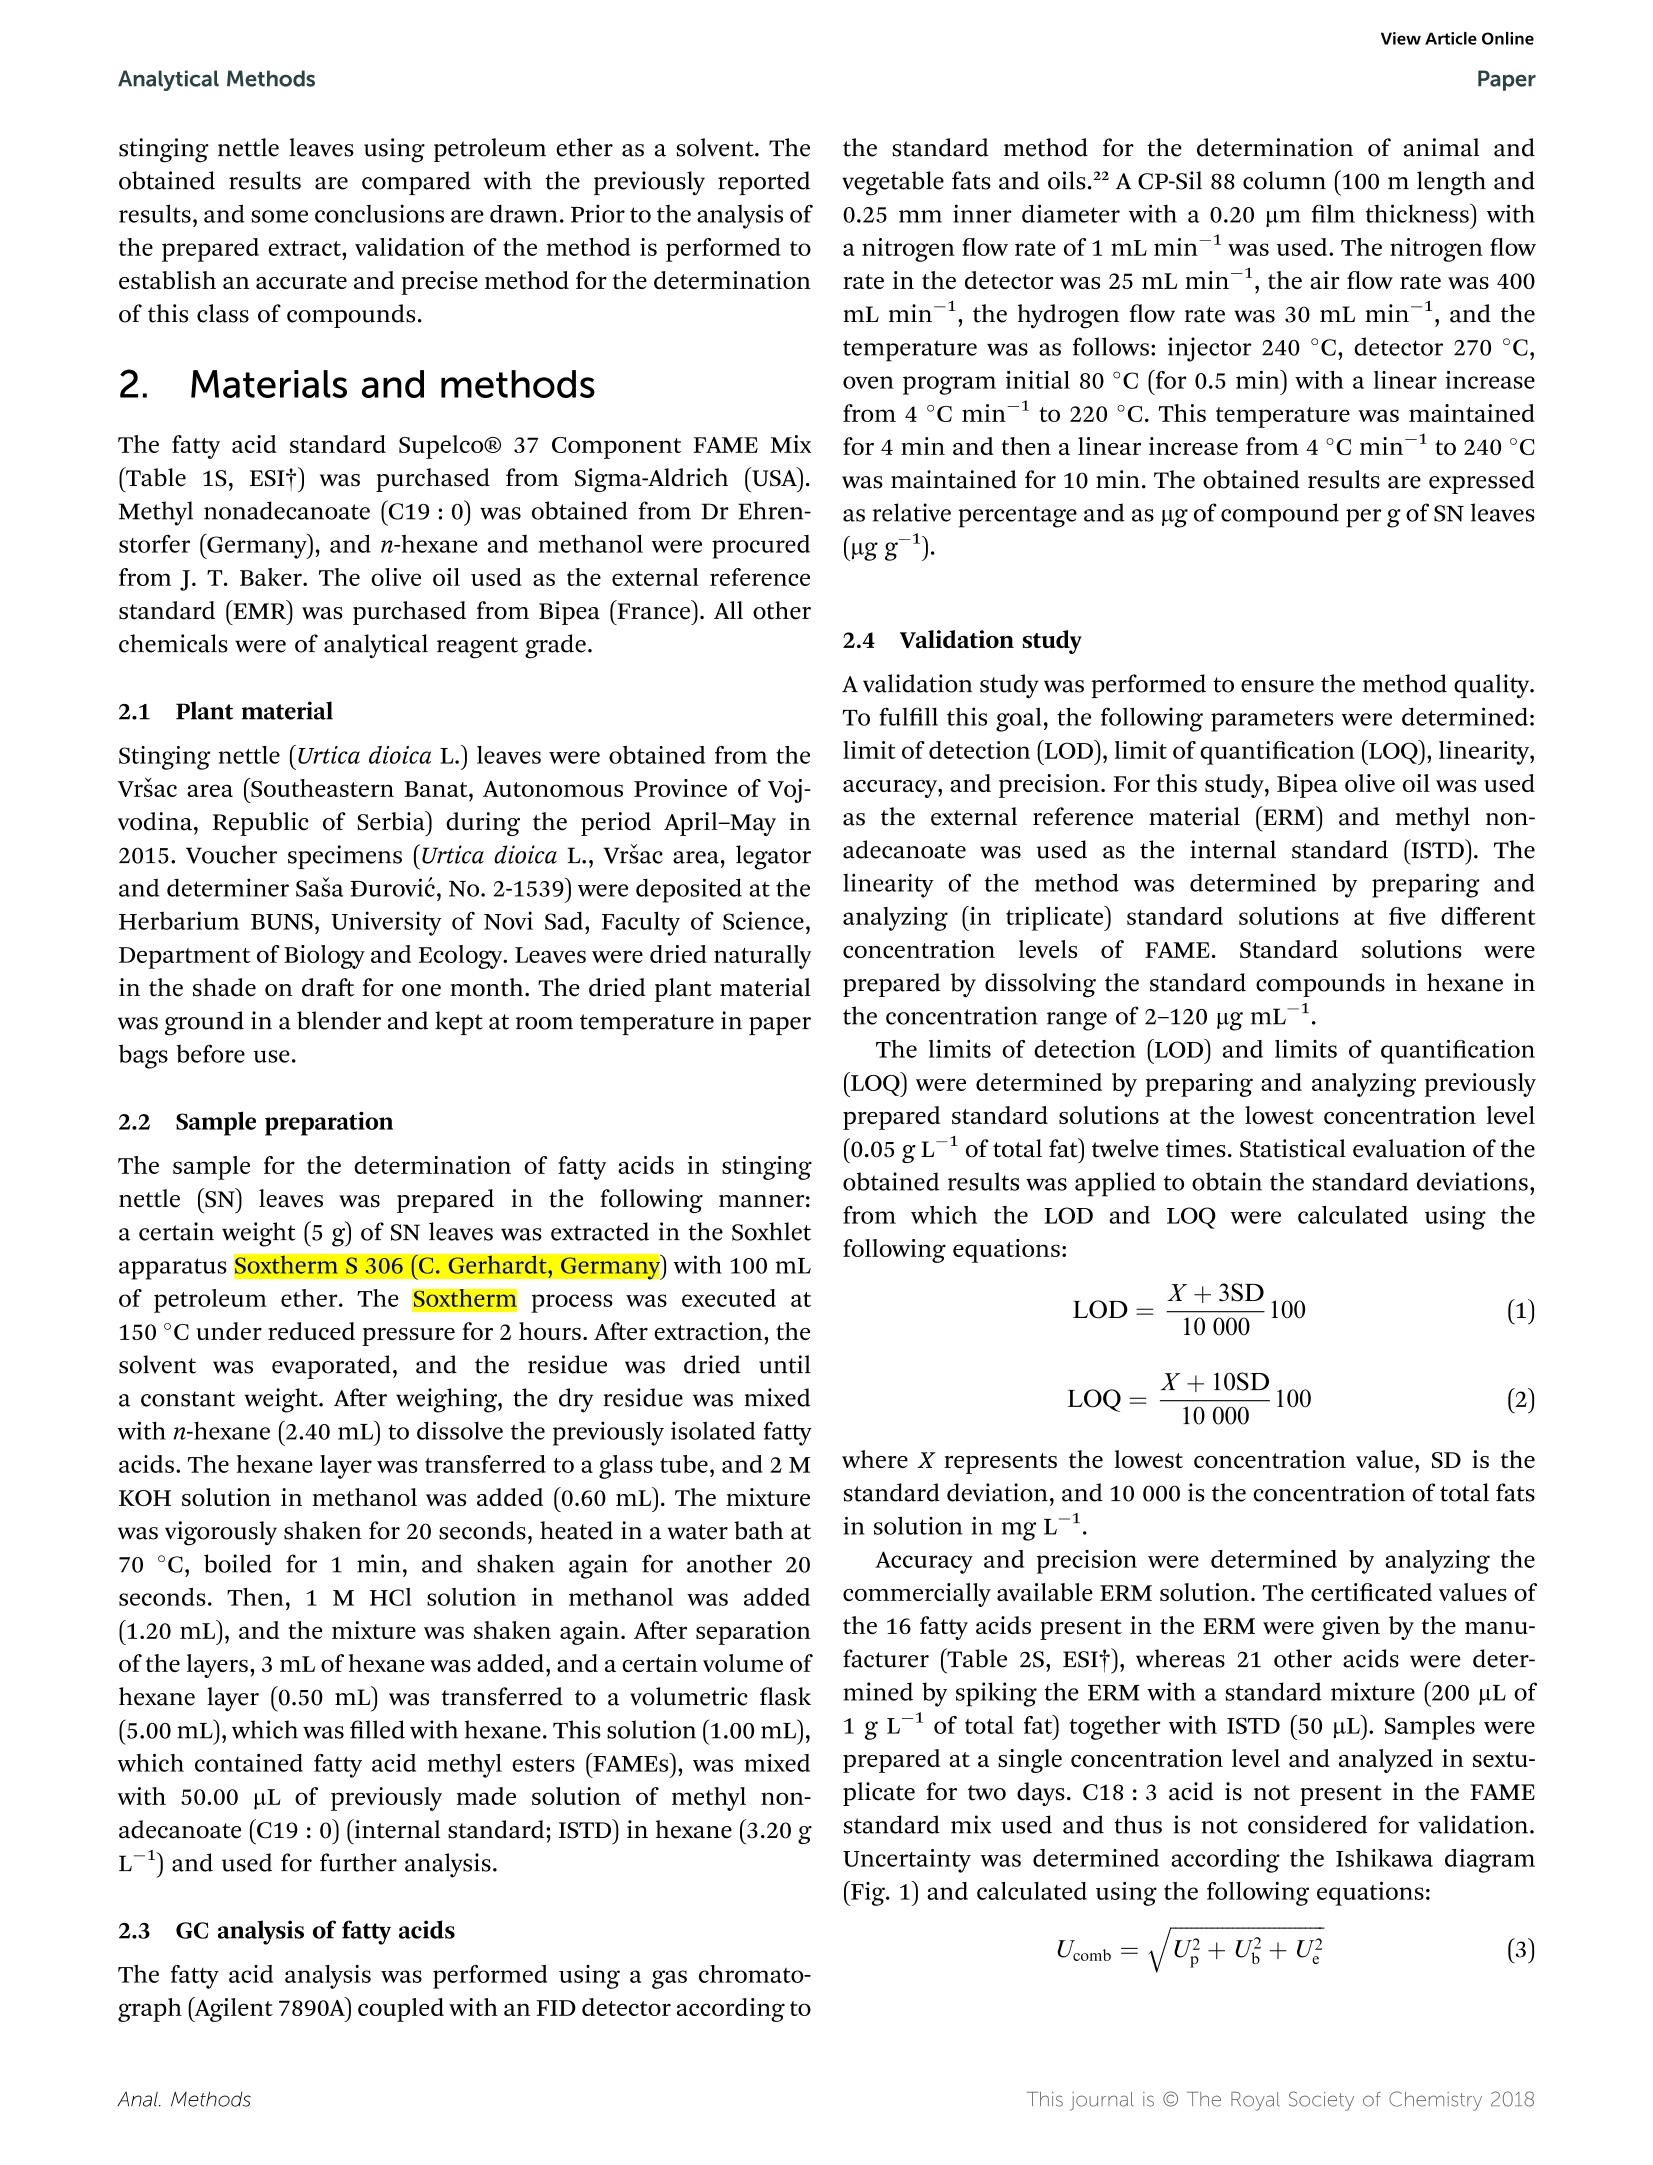
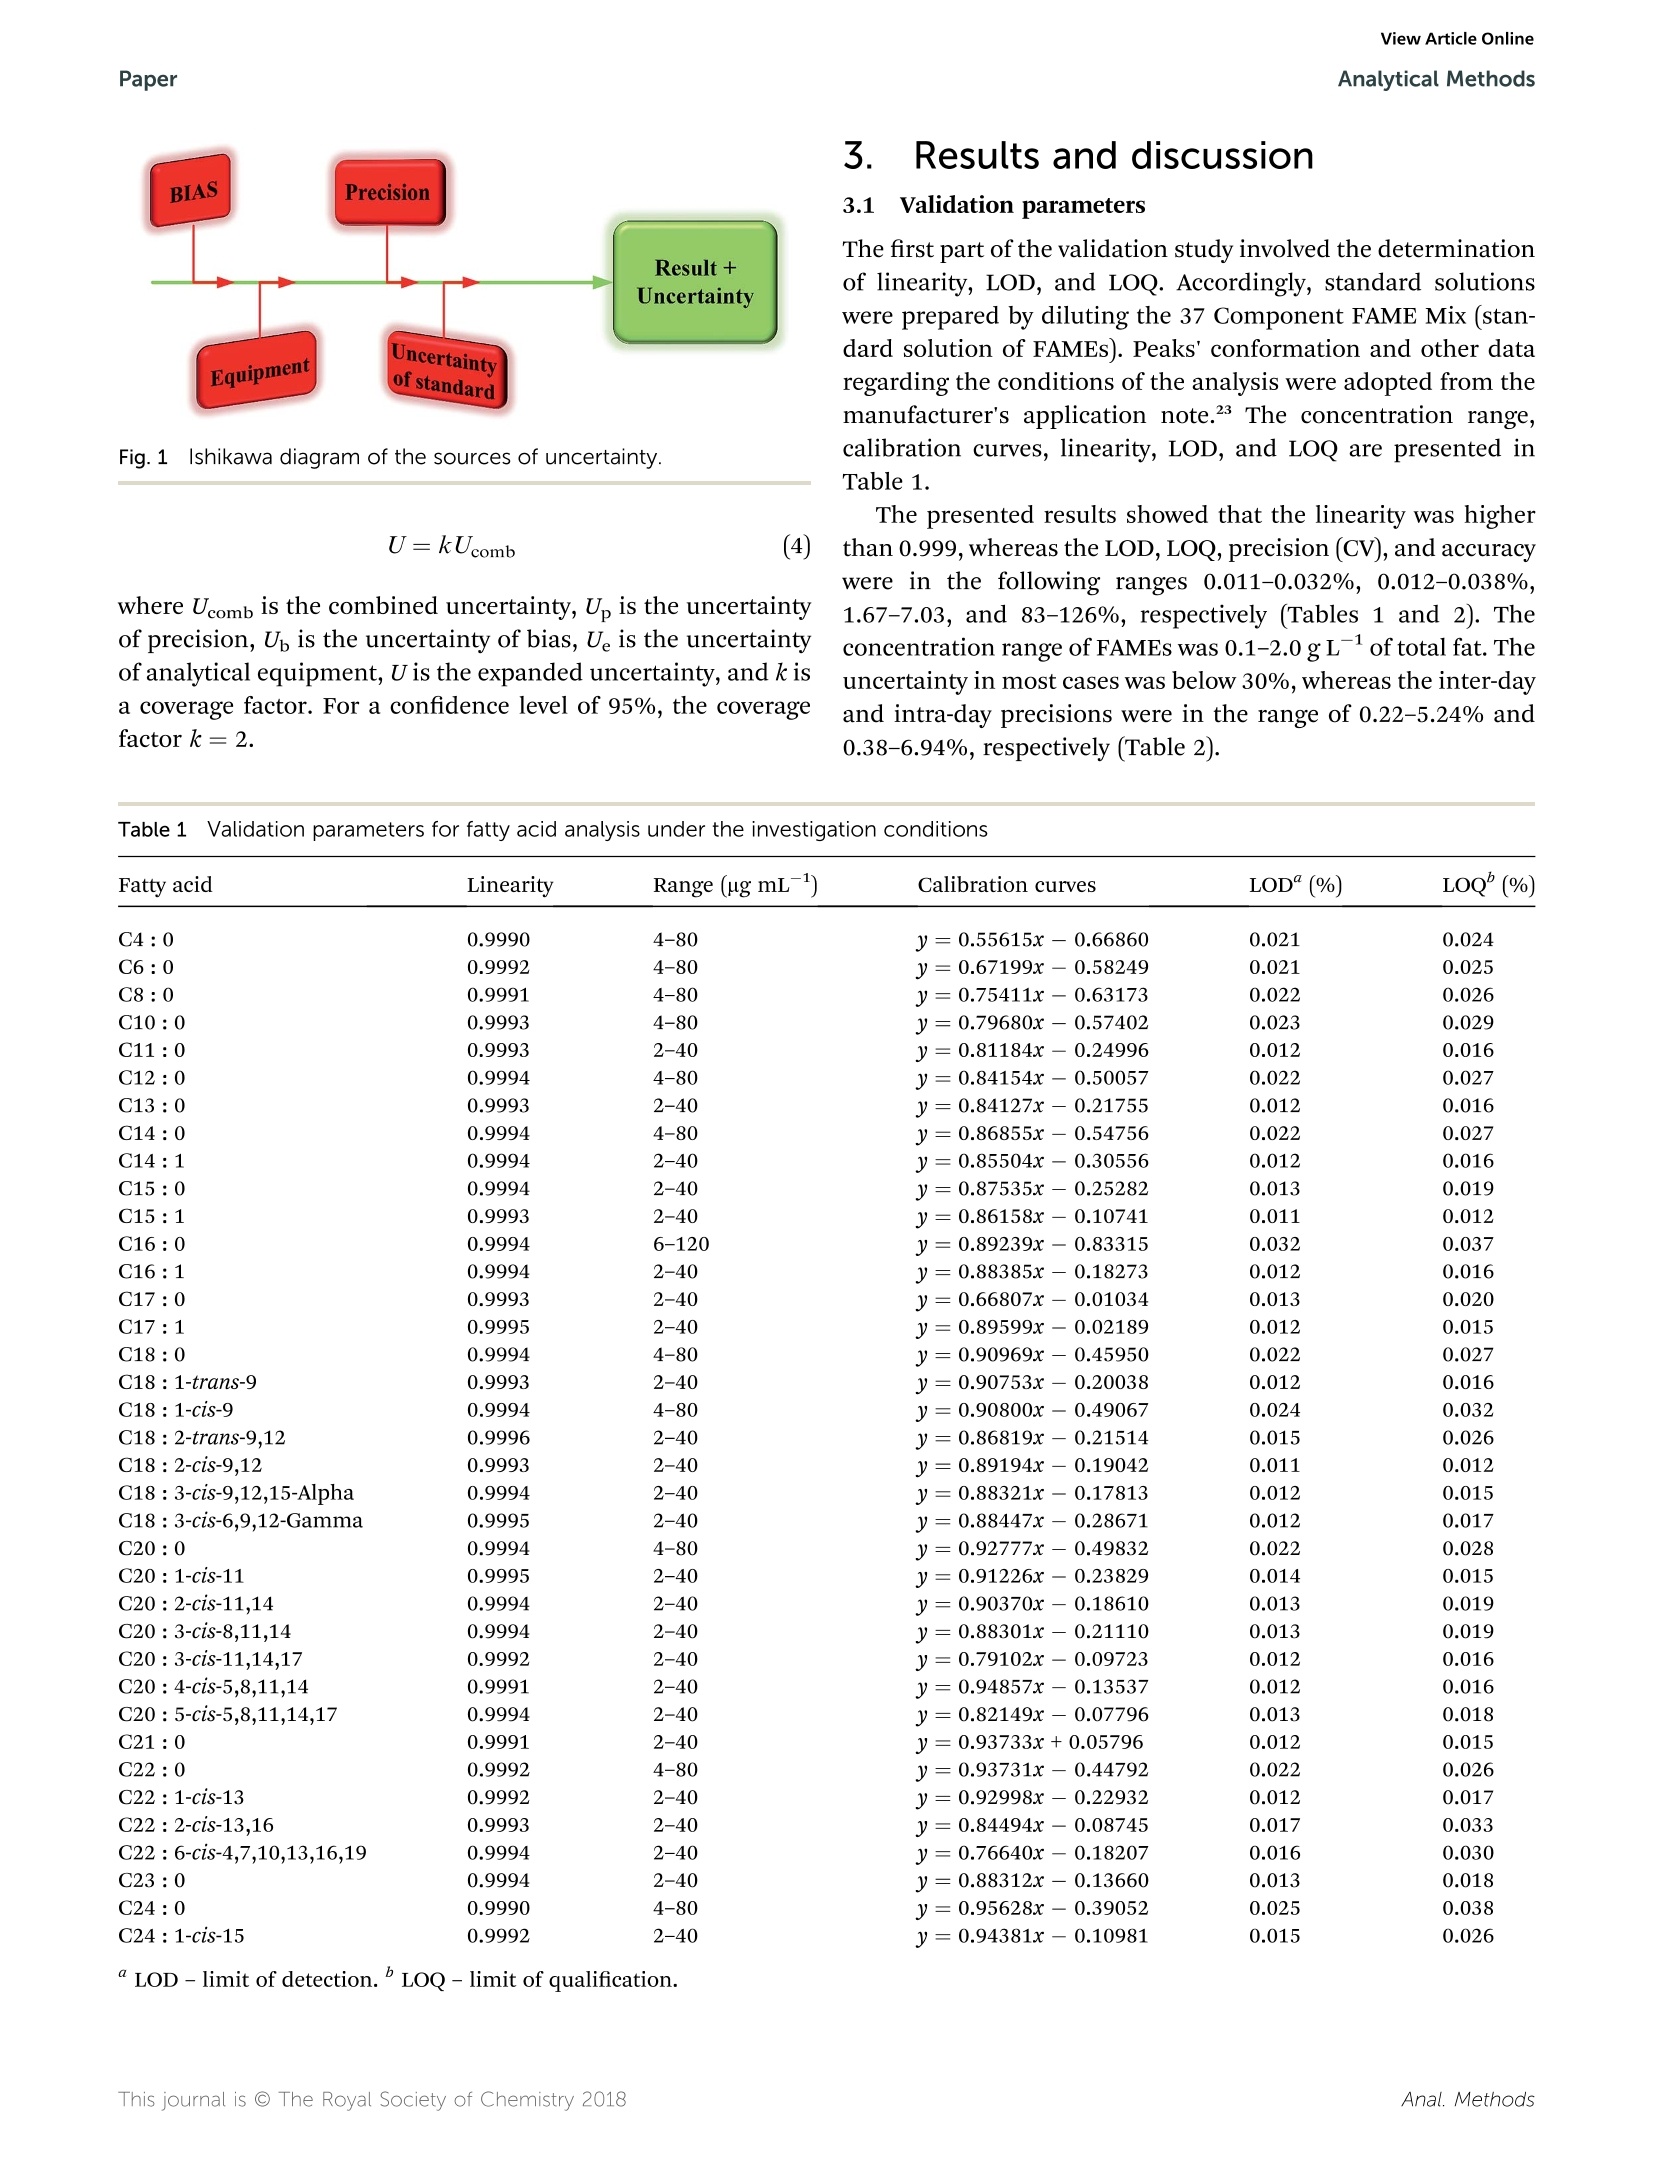
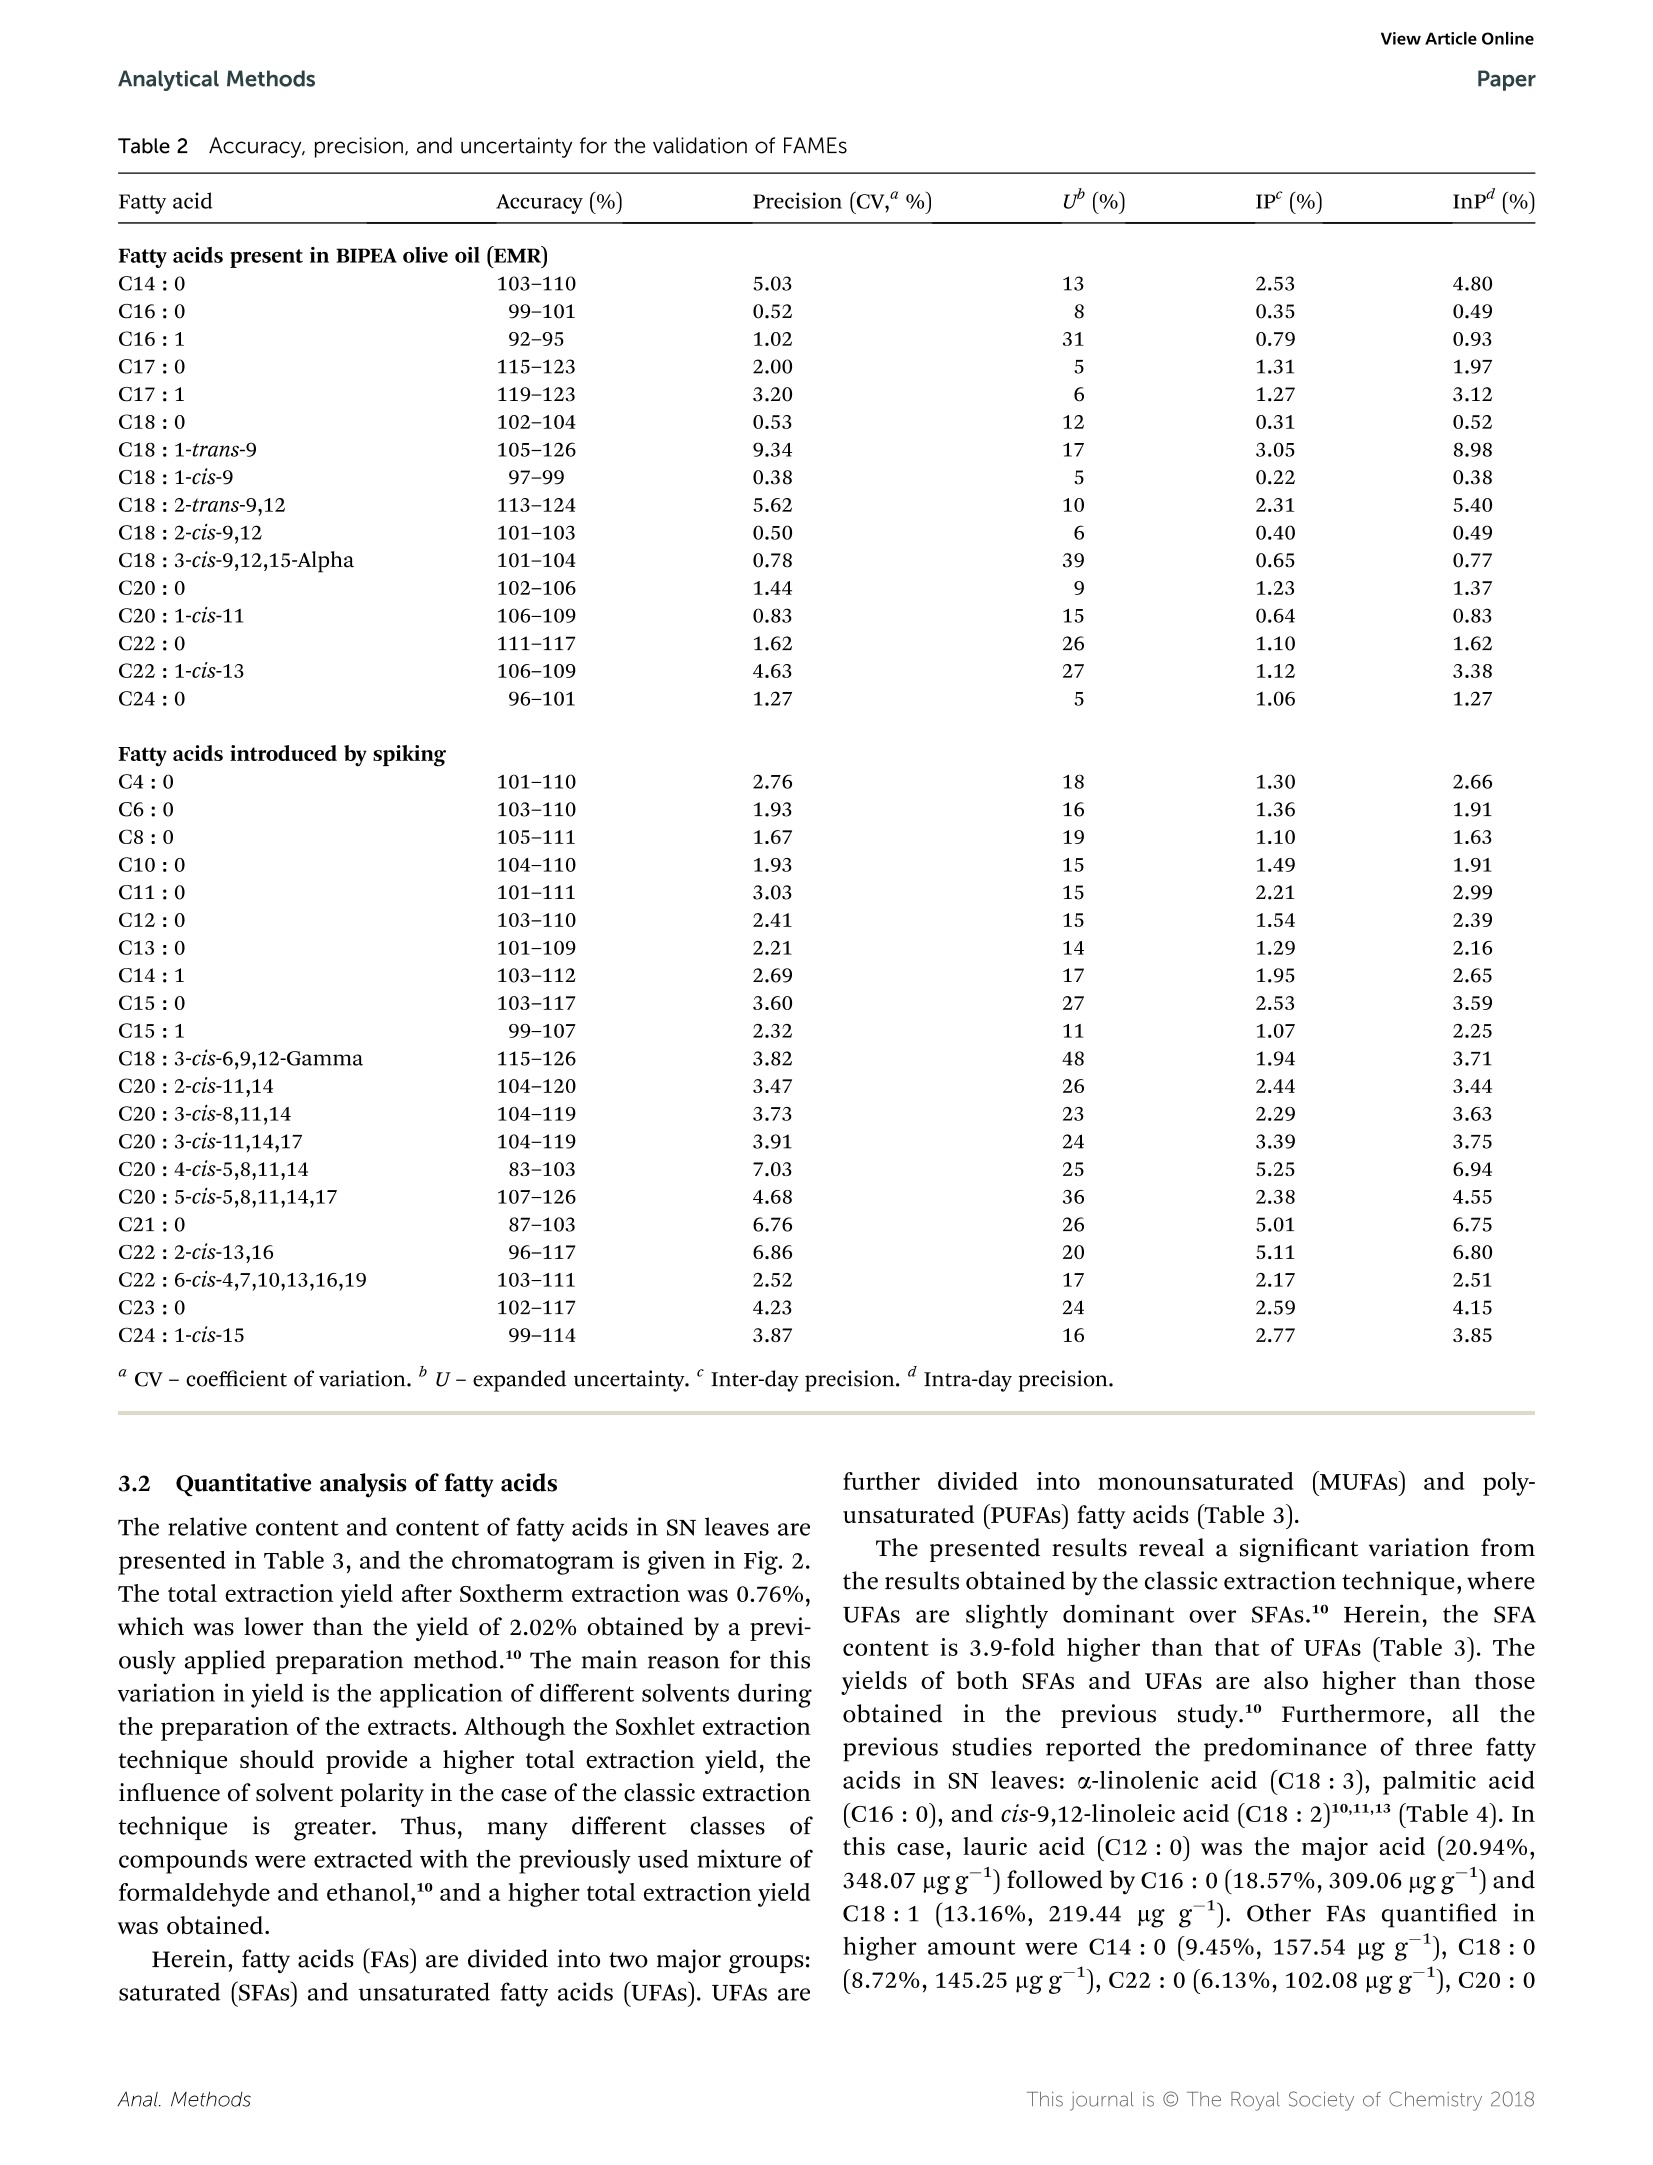
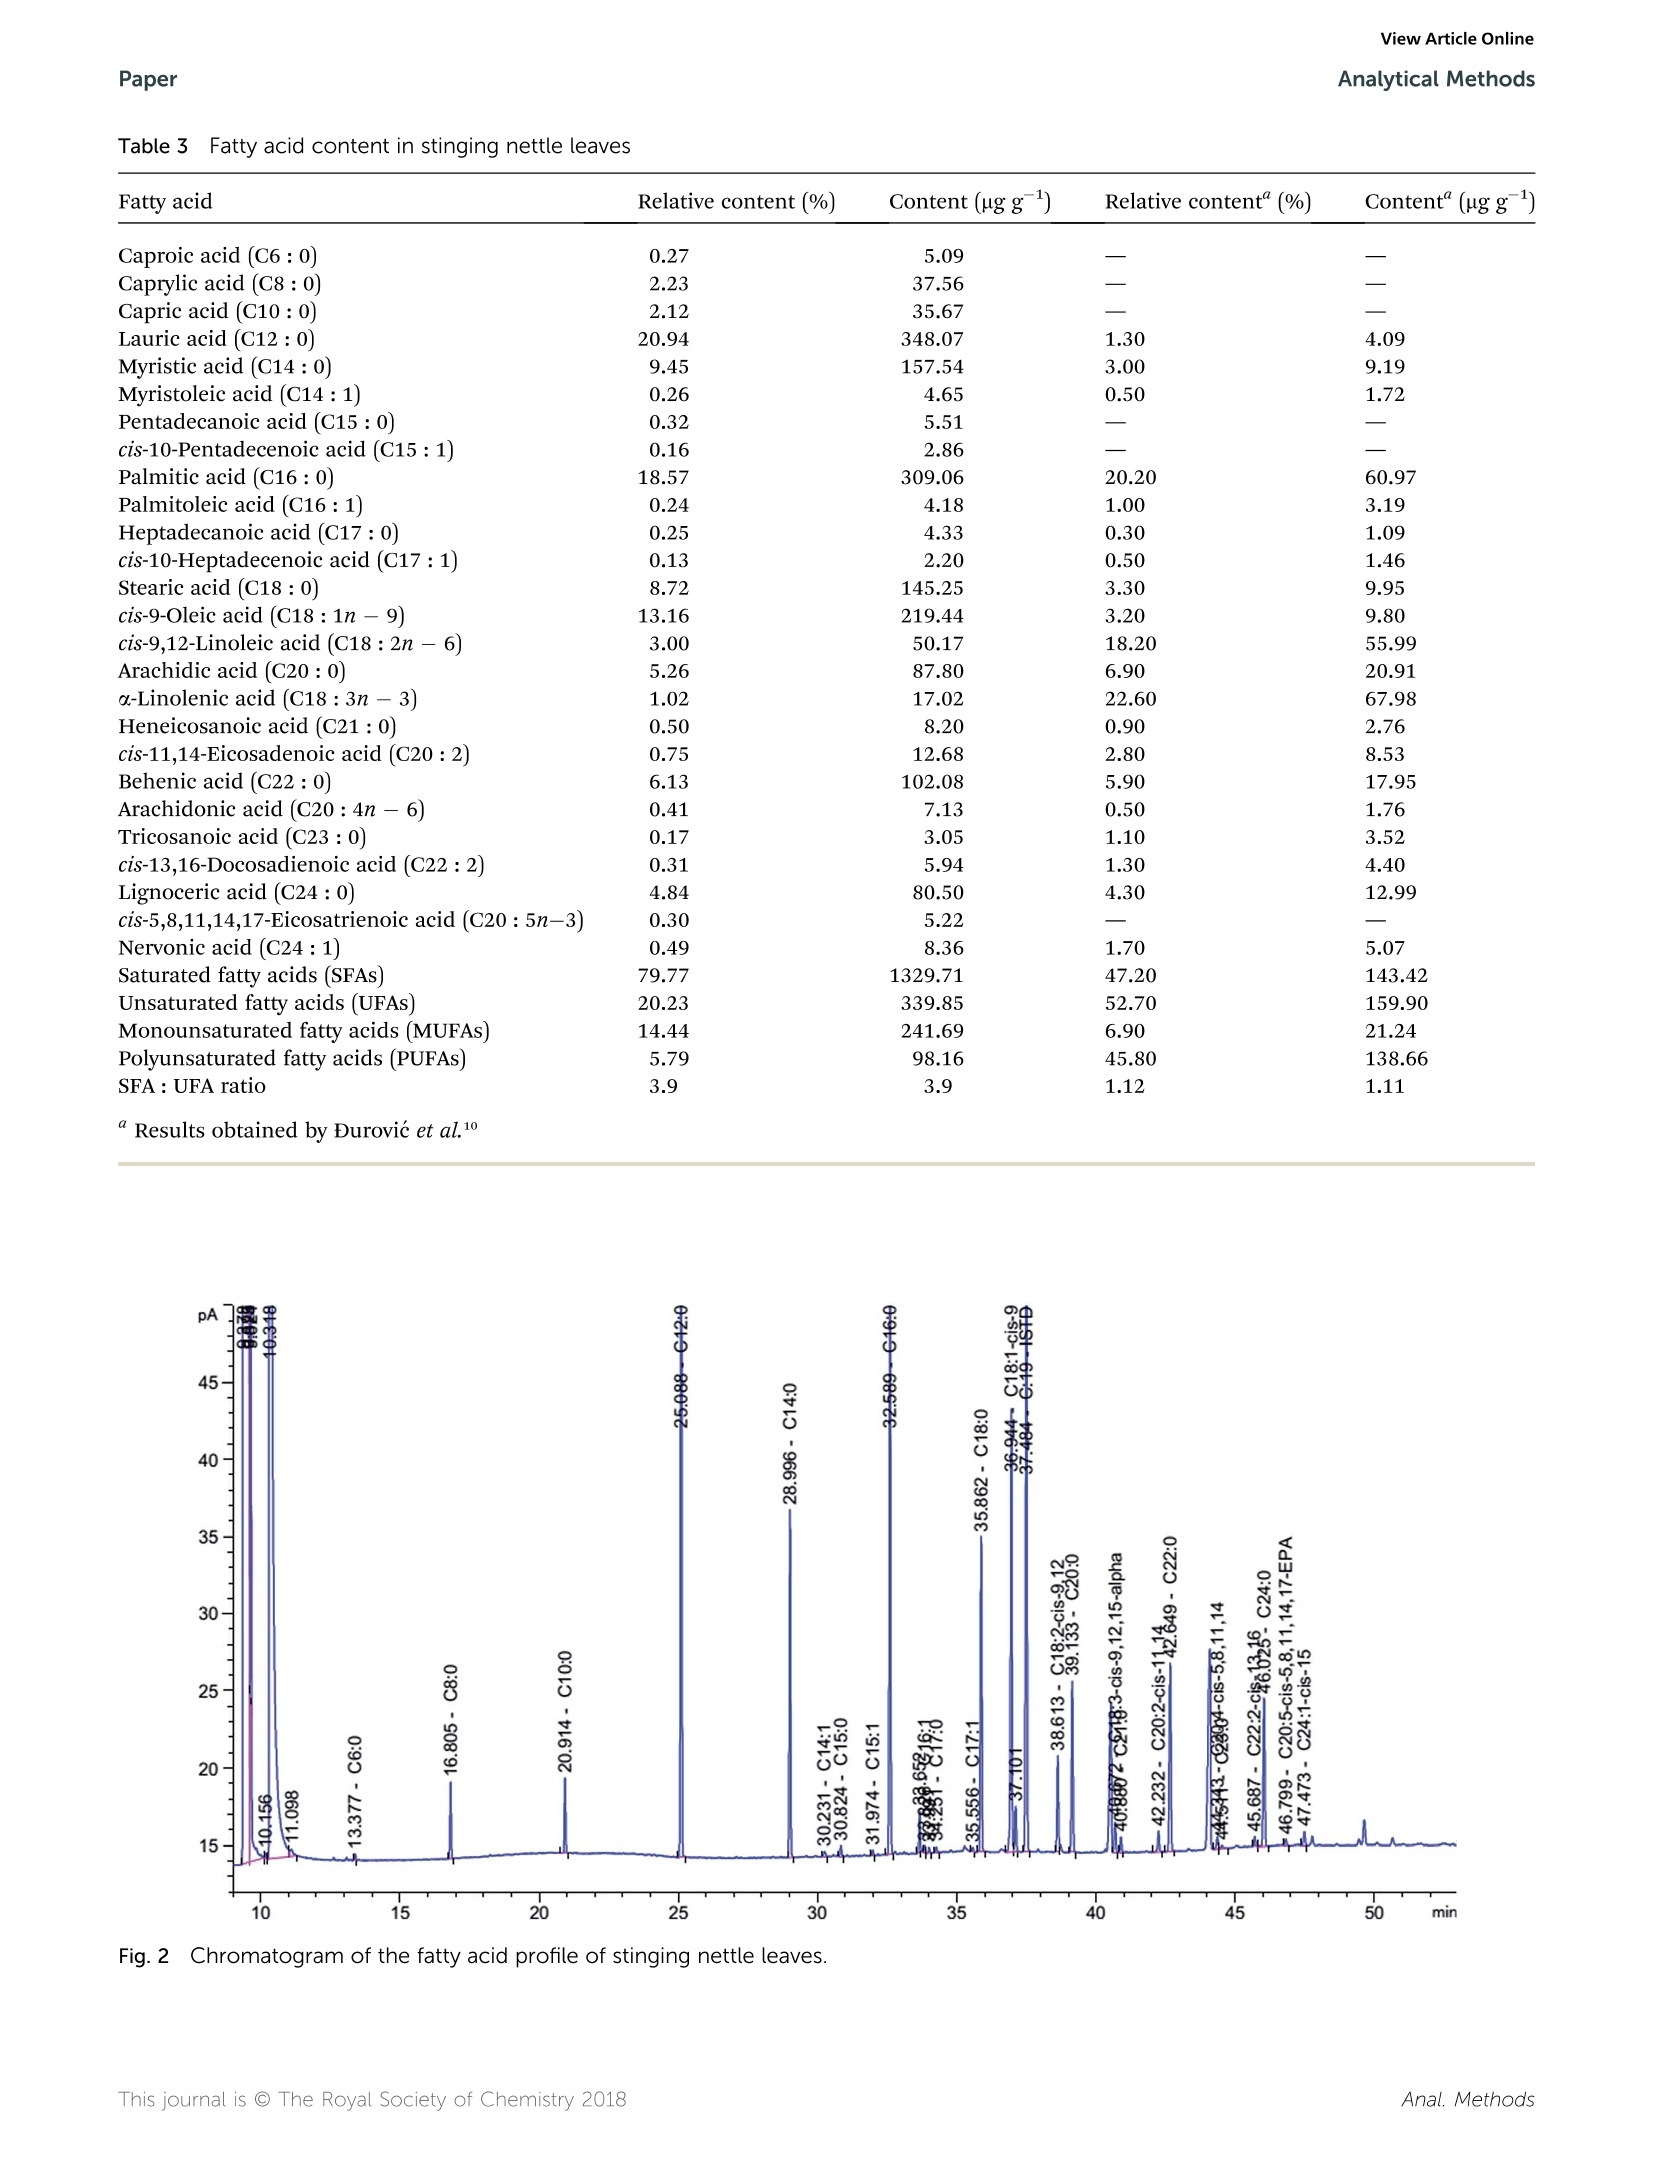
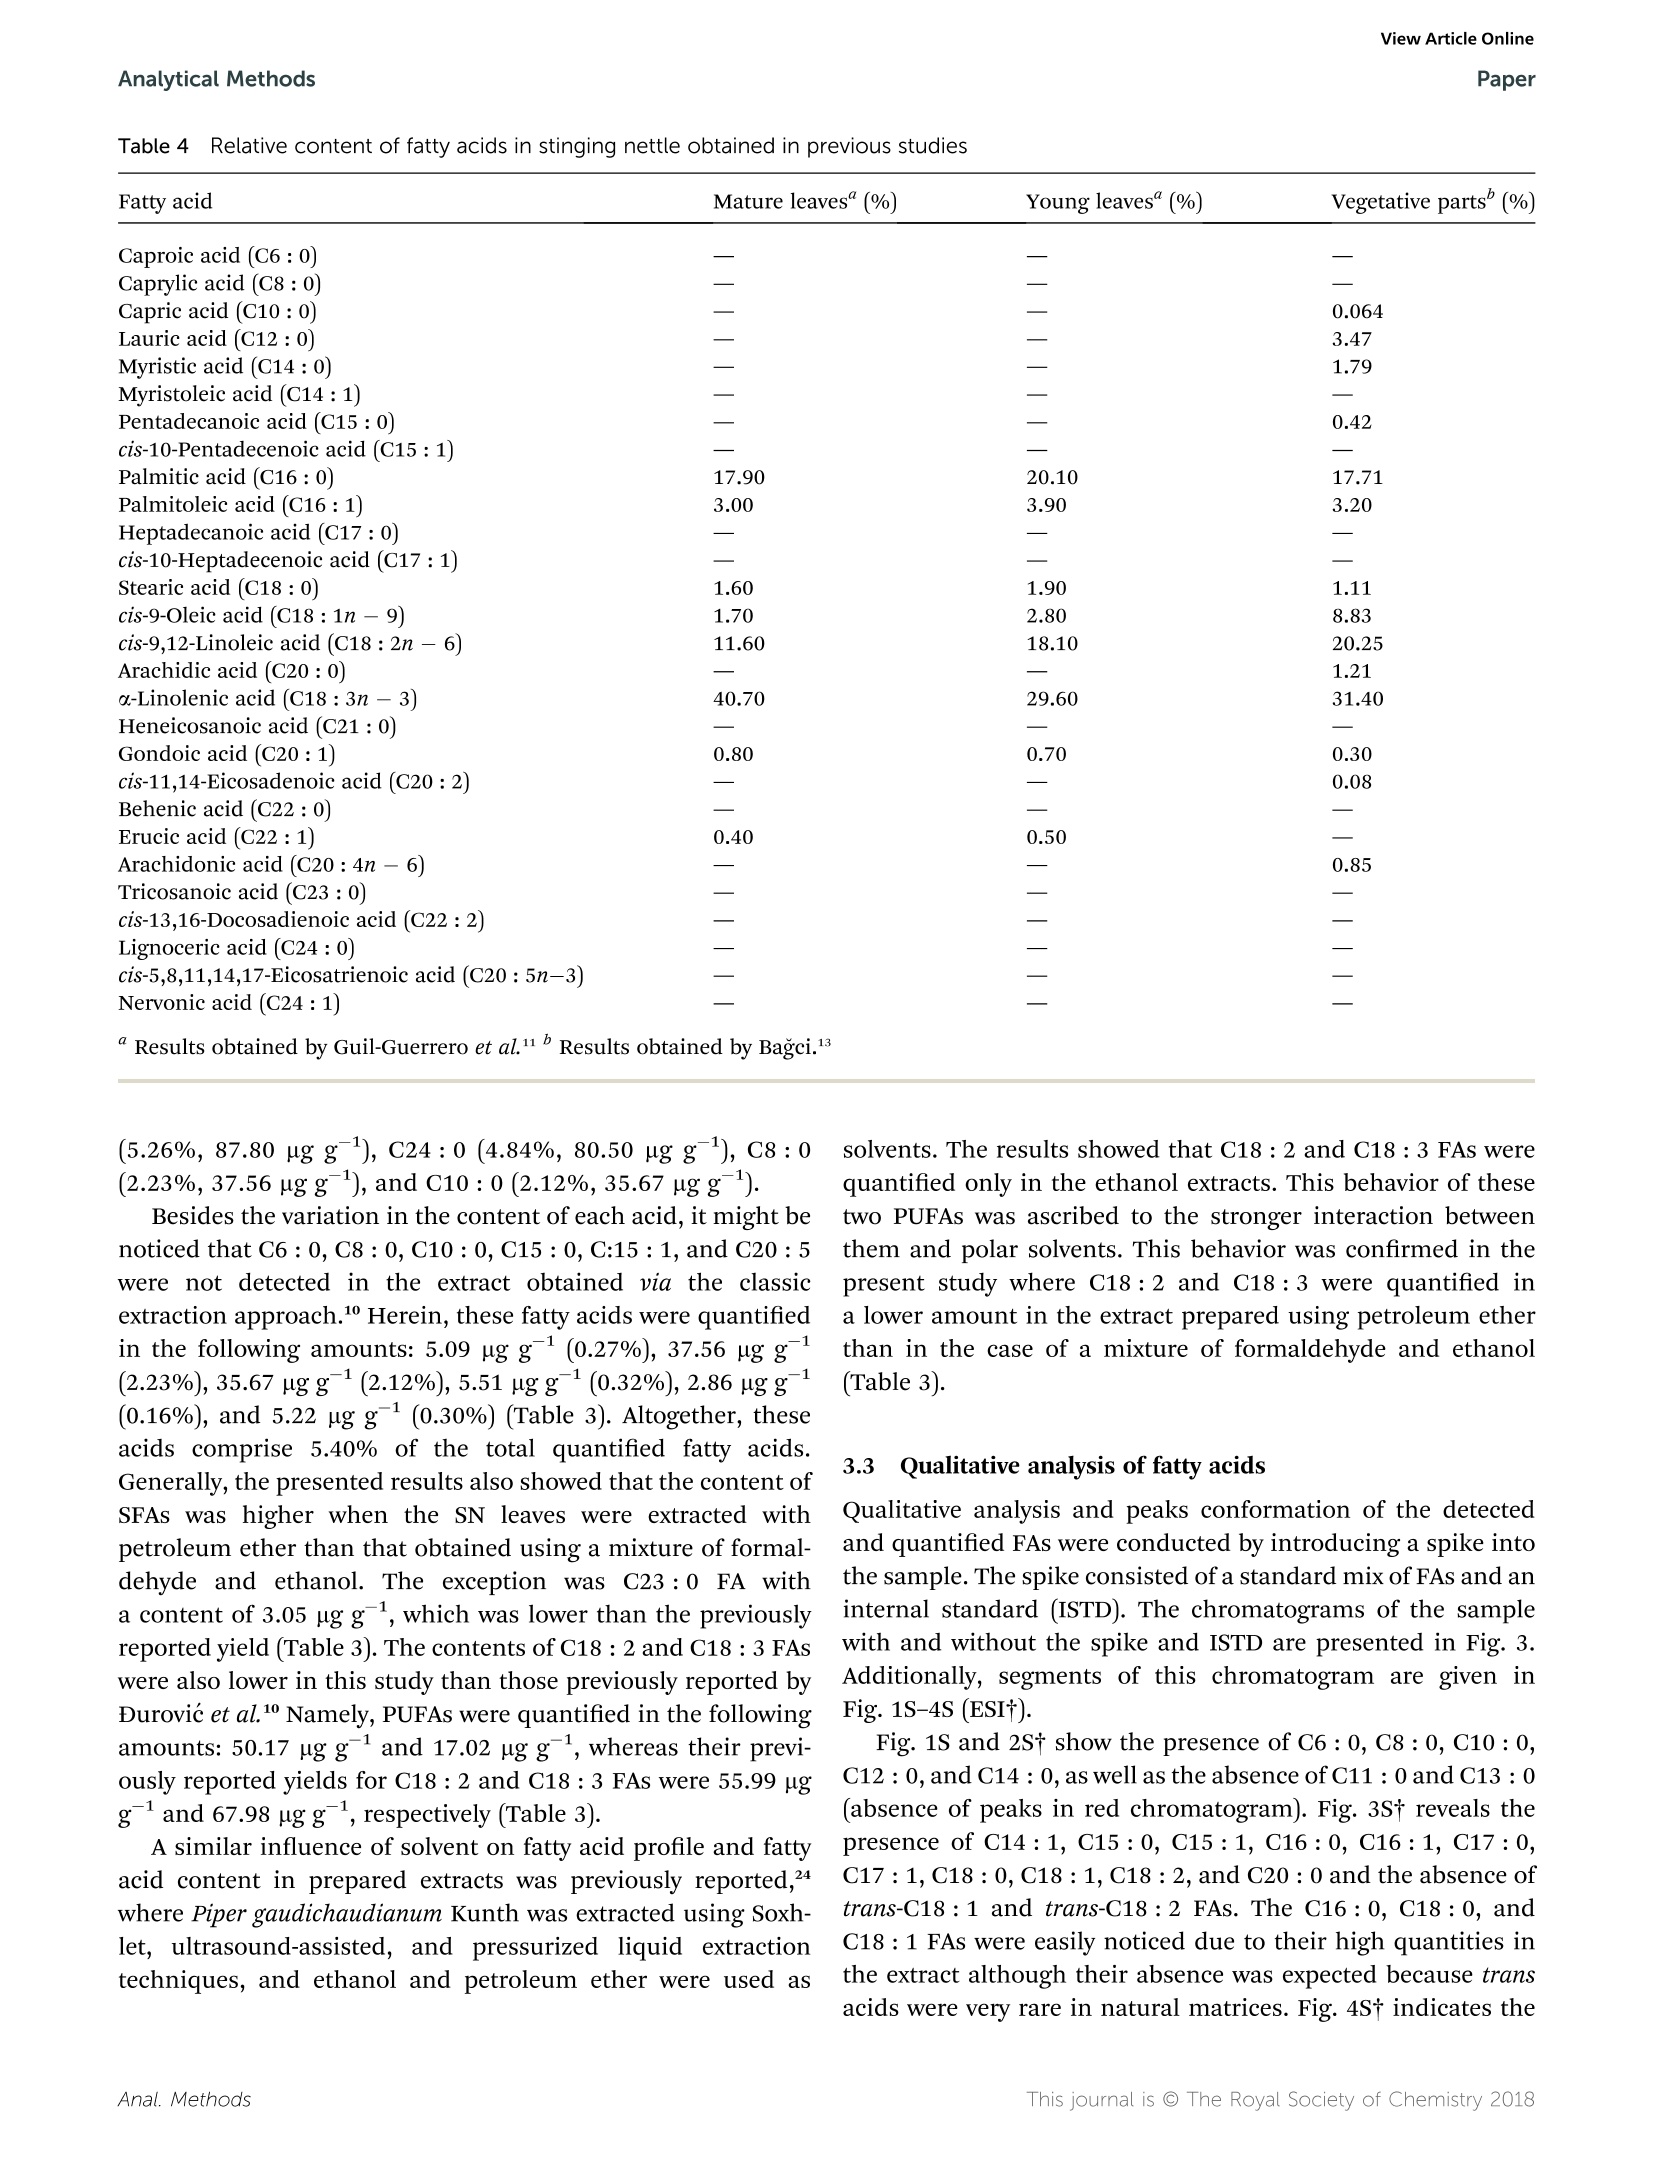
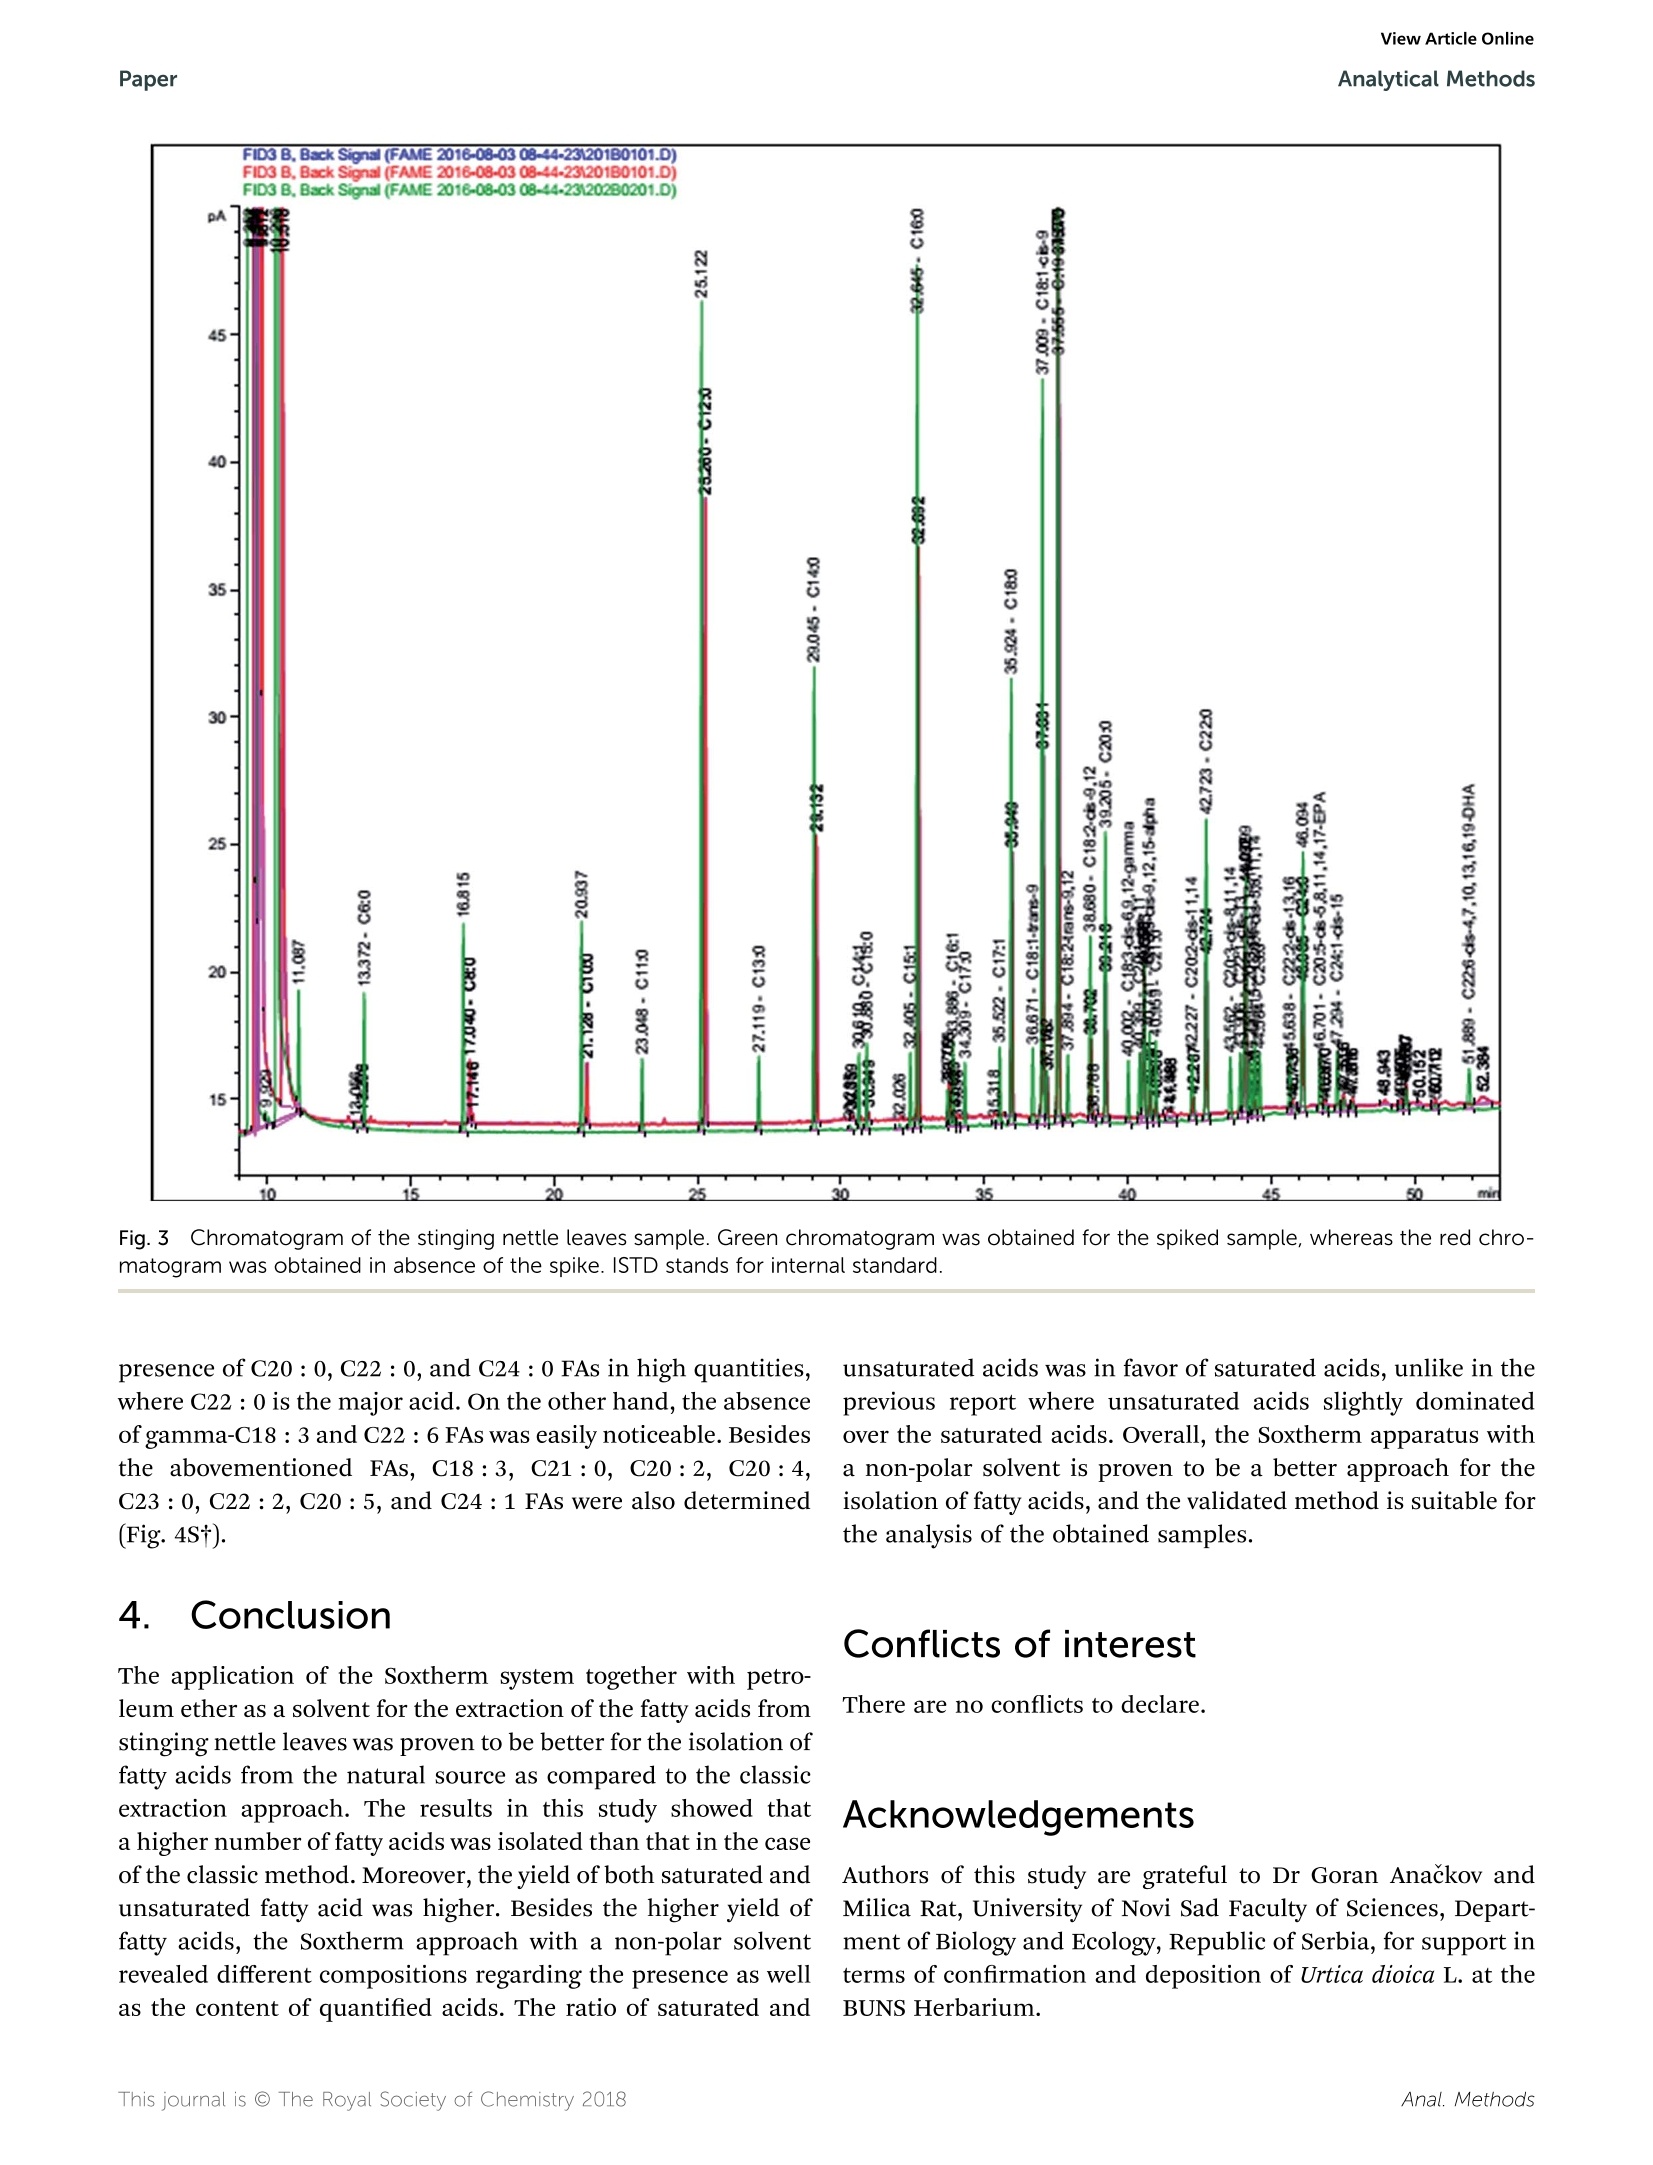
刺荨麻叶片中脂肪酸测定的样品制备方法如下:在格哈特公司全自动快速索氏提取系统:索克森SOXTHERM中使用100ml石油醚在150摄氏度的条件下提取一定重量(5 g)的刺荨麻叶片2小时。后续脂肪酸处理过程略。脂肪酸分析采用带FID检测器的气相色谱仪(安捷伦7890A)进行。ROYAL SOCIETYOF CHEMISTRYAnalyticalMethodsView Article OnlineView Journal View Article OnlineAnalytical MethodsPaper PAPER 刺荨麻叶的脂肪酸分布:现代分析方法在样品制备和分析中的应用 Check for updates Cite this: DOI: 10.1039/c7ay02559a Fatty acid profile of stinging nettle leaves:application of modern analytical procedures forsample preparation and analysist Sasa Durovic,iDD*ab Zoran Zekovic, Sasa Sorgic, D·Sasa Popov, Milena Vujanovicaand Marija Radojkovic Received 31st October 2017Accepted 5th February 2018 DOI: 10.1039/c7ay02559a rsc.li/methods Stinging nettle is a perennial plant with significant biological activity and a long history of application in folkmedicine and as food. Its activity is ascribed to its chemical composition. Its leaves contain different classesof compounds including fatty acids. This study deals with the isolation of fatty acids in stinging nettle leavesusing a rapid extraction system for solid-liquid extraction (Soxtherm) with petroleum ether as the solventThe obtained results indicate that the saturated fatty acids are more abundant than unsaturated fatty acids.The most abundant fatty acids are C12:0 (20.94%, 348.07 ng g-l), C16 : 0 (18.57%, 309.06 ug g-),and C18:1 (13.16%,219.44 ug g-l), whereas the fatty acid with the lowest content is C17:1 (0.13%,2.20 ug g-). Prior to analysis, the method is validated to obtain accurate and precise results. The limit ofdetection and limit of quantification are 0.012-0.038% and 1.67-7.03%, whereas the precision andaccuracy are 83-126% and 1.67-7.03%, respectively. The validation parameters are >0.999, 0.011-0.032%, 0.012-0.038%,1.67-7.03%, 83-126%, 0.22-5.24%, and 0.38-6.94% for linearity, limit ofdetection, limit of quantitation, precision, accuracy, inter-day precision, and intra-day precision,respectively, confirming the suitability of this method for fatty acid analysis 1 Introduction Urtica dioica L. (stinging nettle) is a perennial plant belongingto the Urticaceae botanical family. It is native to Europe, Asia,North Africa, and North America and is commonly used infolk medicine1,2 for the treatment of various diseases anddisorders. Additionally, numerous studies have demonstratedits antioxidant, anti-microbial, anti-inflammatory, anti-ulcer,and analgesic properties.3-7 Stinging nettle is also harvestedcommercially due to its high content of chlorophyll (greencoloring agent, E140) as well as its use as food and in thepreparation of tea.8 Elucidation of the chemical profile of stinging nettlerevealed the presence of different classes of compounds suchas terpenoids,9,10 chlorophylls, and carotenoids including B-carotene, neoxanthin, violaxanthin, lutein, and lycopene,4,10-12fatty acids with palmitic acid, cis-9,12-linoleic acid, anda-linolenic acid being the major acids,10,11,13 phenolic acids "University of Novi Sad, Faculty of Technology, Department of Biotechnology andPharmaceutical Engineering, Bulevar Cara Lazara 1, 21000 Novi Sad, Serbia.E-mail: sasatfns@uns.ac.rs; Fax: +381 21 450413; Tel:+381 65 9577200 Institute of General and Physical Chemistry, Studentski Trg 12/V, 11158, Belgrade,Serbia Oenological Laboratory, Heroja Pinkija 49, 26300 Vrsac, Serbia 十 Electronic supplementary information (ESI) available. See DOI:10.1039/c7ay02559a and polyphenolic compounds,2,10,14,15 essential amino acids,vitamin C, vitamin K, B vitamins, tannins, carbohydrates,sterols, polysaccharides, isolectins,4,11,16 and various elementsand minerals.10,17,18 Fatty acids are one of the essential classes of compounds forlife. In humans, they act as building blocks of lipid membranesin the form of phospholipids, are a form of energy storingcompounds, play a role in proper brain function, are involved insignal transduction as diacylglycerols, etc.1 Besides the aforementioned roles, fatty acids exhibit anti-inflammatory, antithrombotic, antiarrhythmic, hypolipidemic, and vasodilatoryproperties.2° N-3 fatty acids exhibit a positive influence asa secondary preventer of coronary heart disease, hypertensiontype 2 diabetes mellitus, renal disease, rheumatoid arthritisulcerative colitis, Crohn's disease, and chronic obstructivepulmonary disease.20 They also decrease the risk of heartdiseases and cancer.21 It is also worth mentioning that fattyacids such as linoleic acid and arachidonic acid are essentialbecause they cannot be synthesized by human body. Conse-quently, they have to be acquired from food.19 Although the presence of certain fatty acids in stinging nettleleaves was previously reported, 11,13 Durovic et al. (2017) were thefirst to perform a deep analysis of the fatty acids in the leaves ofthis plant using classic extraction for sample preparation usinga mixture of formaldehyde and ethanol as the solvent. Herein,a rapid extraction system for solid-liquid extraction (Soxthermis applied for the first time for the isolation of fatty acids from stinging nettle leaves using petroleum ether as a solvent. Theobtained results are compared with the previously reportedresults, and some conclusions are drawn. Prior to the analysis ofthe prepared extract, validation of the method is performed toestablish an accurate and precise method for the determinationof this class of compounds. 2. Materials and methods The fatty acid standard Supelco@ 37 Component FAME Mix(Table 1S, ESIt) was purchased from Sigma-Aldrich (USA).Methyl nonadecanoate (C19:0) was obtained from Dr Ehren-storfer (Germany), and n-hexane and methanol were procuredfrom J. T. Baker. The olive oil used as the external referencestandard (EMR) was purchased from Bipea (France). All otherchemicals were of analytical reagent grade. 2.1 Plant material Stinging nettle (Urtica dioica L.) leaves were obtained from theVrsac area (Southeastern Banat, Autonomous Province of Voj-vodina, Republic of Serbia) during the period April-May in2015. Voucher specimens (Urtica dioica L., Vrsac area, legatorand determiner Sasa Durovic, No. 2-1539) were deposited at theHerbarium BUNS, University of Novi Sad, Faculty of Science,Department of Biology and Ecology. Leaves were dried naturallyin the shade on draft for one month. The dried plant materialwas ground in a blender and kept at room temperature in paperbags before use. 2.2 Sample preparation The sample for the determination of fatty acids in stingingnettle (SN) leaves was prepared in the following manner:a certain weight (5 g) of SN leaves was extracted in the Soxhletapparatus Soxtherm S 306 (C. Gerhardt, Germany) with 100 mLof petroleum ether. TheSoxthermprocess was executed at150°C under reduced pressure for 2 hours. After extraction,thesolvent was evaporated, and the residue was dried untila constant weight. After weighing, the dry residue was mixedwith n-hexane (2.40 mL) to dissolve the previously isolated fattyacids. The hexane layer was transferred to a glass tube, and2MKOH solution in methanol was added (0.60 mL). The mixturewas vigorously shaken for 20 seconds, heated in a water bath at70 °C, boiled for 1 min, and shaken again for another 20seconds. Then, 1 M HCl solution in methanol was added(1.20 mL), and the mixture was shaken again. After separationof the layers,3 mL of hexane was added, and a certain volume ofhexane layer (0.50 mL) was transferred to a volumetric flask(5.00 mL), which was filled with hexane. This solution (1.00 mL),which contained fatty acid methyl esters (FAMEs), was mixedwith 50.00 uL of previously made solution of methyl non-adecanoate (C19 : 0) (internal standard; ISTD) in hexane (3.20 gL-1) and used for further analysis. 2.3 GC analysis of fatty acids The fatty acid analysis was performed using a gas chromato-graph (Agilent 7890A) coupled with an FID detector according to the standard method for the determination of animal andvegetable fats and oils.2 A CP-Sil 88 column (100 m length anc0.25 mm inner diameter with a 0.20 um film thickness) witha nitrogen flow rate of 1 mL min-was used. The nitrogen flowrate in the detector was 25 mL min-, the air flow rate was 400mL min-, the hydrogen flow rate was 30 mL min-, and thetemperature was as follows: injector 240 °C, detector 270 °C,oven program initial 80 °C (for 0.5 min) with a linear increasefrom 4°C min-to 220 °C. This temperature was maintainedfor 4 min and then a linear increase from 4°C min-to 240°Cwas maintained for 10 min. The obtained results are expressecas relative percentage and as ug of compound per g of SN leaves(ugg). 2.4 Validation study A validation study was performed to ensure the method quality.To fulfill this goal, the following parameters were determined:limit of detection (LOD), limit of quantification (LOQ),linearity,accuracy, and precision. For this study, Bipea olive oil was usecas the external reference material (ERM) and methyl nonadecanoate was used as the internal standard (ISTD). Thelinearity of the method was determined by preparing andanalyzing (in triplicate) standard solutions at five differentconcentration levels of FAME. Standarddsolutioniss wereprepared by dissolving the standard compounds in hexane inthe concentration range of 2-120 ug mL-. The limits of detection (LOD) and limits of quantification(LOQ) were determined by preparing and analyzing previouslyprepared standard solutions at the lowest concentration level(0.05 g L- of total fat) twelve times. Statistical evaluation of theobtained results was applied to obtain the standard deviationsfrom which the LOD and LOQ were calculated using thefollowing equations: where X represents the lowest concentration value, SD is thestandard deviation, and 10 000 is the concentration of total fatsin solution in mgL. Accuracy and precision were determined by analyzing thecommercially available ERM solution. The certificated values ofthe 16 fatty acids present in the ERM were given by the manu-facturer (Table 2S, ESIt), whereas 21 other acids were deter-mined by spiking the ERM with a standard mixture (200 pL of1 g L- of total fat) together with ISTD (50 pL). Samples wereprepared at a single concentration level and analyzed in sextuplicate for two days. C18: 3 acid is not present in the FAMEstandard mix used and thus is not considered for validation.Uncertainty was determined according the Ishikawa diagram(Fig. 1) and calculated using the following equations: Fig.1 Ishikawa diagram of the sources of uncertainty. where Ucomb is the combined uncertainty, U is the uncertaintyof precision, U, is the uncertainty of bias, U is the uncertaintyof analytical equipment, U is the expanded uncertainty, and k isa coverage factor. For a confidence level of 95%, the coveragefactor k =2. 3. Results and discussion 3.1 Validation parameters The first part of the validation study involved the determinationof linearity, LOD, and LOQ. Accordingly, standard solutionswere prepared by diluting the 37 Component FAME Mix (standard solution of FAMEs). Peaks’ conformation and other dataregarding the conditions of the analysis were adopted from themanufacturer's application note.23 The concentration range,calibration curves, linearity, LOD, and LOQ are presented inTable 1. The presented results showed that the linearity was higherthan 0.999, whereas the LOD, LOQ, precision (CV), and accuracywere in the following ranges 0.011-0.032%,0.012-0.038%1.67-7.03, and 83-126%, respectively (Tables 1 and 2). Theconcentration range of FAMEs was 0.1-2.0 gLof total fat. Theuncertainty in most cases was below 30%,whereas the inter-dayand intra-day precisions were in the range of 0.22-5.24% and0.38-6.94%, respectively (Table 2). Table 1Validation parameters for fatty acid analysis under the investigation conditions Fatty acid Linearity Range (ug mL-) Calibration curves LOD“(%) LOQ(%) C4:0 0.9990 4-80 y=0.55615x-0.66860 0.021 0.024 C6:0 0.9992 4-80 y= 0.67199x- 0.58249 0.021 0.025 C8:0 0.9991 4-80 y=0.75411x- 0.63173 0.022 0.026 C10:0 0.9993 4-80 y=0.79680x- 0.57402 0.023 0.029 C11:0 0.9993 2-40 y=0.81184x- 0.24996 0.012 0.016 C12:0 0.9994 4-80 y= 0.84154x- 0.50057 0.022 0.027 C13:0 0.9993 2-40 y=0.84127x- 0.21755 0.012 0.016 C14:0 0.9994 4-80 y=0.86855x-0.54756 0.022 0.027 C14:1 0.9994 2-40 y=0.85504x- 0.30556 0.012 0.016 C15:0 0.9994 2-40 y=0.87535x-0.25282 0.013 0.019 C15:1 0.9993 2-40 y=0.86158x- 0.10741 0.011 0.012 C16:0 0.9994 6-120 y=0.89239x- 0.83315 0.032 0.037 C16:1 0.9994 2-40 y= 0.88385x - 0.18273 0.012 0.016 C17:0 0.9993 2-40 y=0.66807x- 0.01034 0.013 0.020 C17:1 0.9995 2-40 y=0.89599x- 0.02189 0.012 0.015 C18:0 0.9994 4-80 y= 0.90969x- 0.45950 0.022 0.027 C18 : 1-trans-9 0.9993 2-40 y=0.90753x- 0.20038 0.012 0.016 C18 : 1-cis-9 0.9994 4-80 y=0.90800x- 0.49067 0.024 0.032 C18 : 2-trans-9.12 0.9996 2-40 y=0.86819x-0.21514 0.015 0.026 C18 : 2-cis-9,12 0.9993 2-40 y= 0.89194x - 0.19042 0.011 0.012 C18 : 3-cis-9,12,15-Alpha 0.9994 2-40 y=0.88321x- 0.17813 0.012 0.015 C18 : 3-cis-6,9,12-Gamma 0.9995 2-40 y=0.88447x-0.28671 0.012 0.017 C20: 0 0.9994 4-80 y=0.92777x-0.49832 0.022 0.028 C20: 1-CLS-11 0.9995 2-40 y=0.91226x- 0.23829 0.014 0.015 C20 : 2-cis-11,14 0.9994 2-40 y=0.90370x- 0.18610 0.013 0.019 C20 : 3-cis-8,11,14 0.9994 2-40 y= 0.88301x- 0.21110 0.013 0.019 C20 : 3-cis-11,14,17 0.9992 2-40 y=0.79102x- 0.09723 0.012 0.016 C20 : 4-ctS-5,8,11,14 0.9991 2-40 y=0.94857x-0.13537 0.012 0.016 C20 : 5-cis-5,8,11,14,17 0.9994 2-40 y=0.82149x- 0.07796 0.013 0.018 C21:0 0.9991 2-40 y= 0.93733x+0.05796 0.012 0.015 C22:0 0.9992 4-80 y=0.93731x- 0.44792 0.022 0.026 C22 : 1-Cis-13 0.9992 2-40 y= 0.92998x - 0.22932 0.012 0.017 C22 : 2-cis-13,16 0.9993 2-40 y=0.84494x - 0.08745 0.017 0.033 C22 : 6-cis-4,7,10,13,16,19 0.9994 2-40 y=0.76640x- 0.18207 0.016 0.030 C23 :0 0.9994 2-40 y=0.88312x- 0.13660 0.013 0.018 C24:0 0.9990 4-80 y=0.95628x- 0.39052 0.025 0.038 C24: 1-CiS-15 0.9992 2-40 y= 0.94381x- 0.10981 0.015 0.026 Table 2 Accuracy, precision, and uncertainty for the validation of FAMEs Fatty acid Accuracy (%) Precision (CV,“ %) U(%) IP (%) InP(%) Fatty acids present in BIPEA olive oil (EMR) C14:0 103-110 5.03 13 2.53 4.80 C16:0 99-101 0.52 8 0.35 0.49 C16:1 92-95 1.02 31 0.79 0.93 C17:0 115-123 2.00 5 1.31 1.97 C17:1 119-123 3.20 6 1.27 3.12 C18:0 102-104 0.53 0.31 0.52 C18: 1-trans-9 105-126 9.34 3.05 8.98 C18: 1-CLS-9 97-99 0.38 5 0.22 0.38 C18 : 2-trans-9,12 113-124 5.62 2.31 5.40 C18: 2-cis-9,12 101-103 0.50 6 0.40 0.49 C18 : 3-cis-9,12,15-Alpha 101-104 0.78 39 0.65 0.77 C20: 0 102-106 1.44 9 1.23 1.37 C20: 1-cis-11 106-109 0.83 0.64 0.83 C22: 0 111-117 1.62 1.10 1.62 C22 : 1-C1S-13 106-109 4.63 1.12 3.38 C24:0 96-101 1.27 5 1.06 1.27 Fatty acids introduced by spiking C4:0 101-110 2.76 1.30 2.66 C6:0 103-110 1.93 1.36 1.91 C8:0 105-111 1.67 1.10 1.63 C10:0 104-110 1.93 1.49 1.91 C11:0 101-111 3.03 2.21 2.99 C12:0 103-110 2.41 1.54 2.39 C13:0 101-109 2.21 1.29 2.16 C14:1 103-112 2.69 1.95 2.65 C15:0 103-117 3.60 2.53 3.59 C15: 1 99-107 2.32 1.07 2.25 C18 : 3-cis-6,9,12-Gamma 115-126 3.82 1.94 3.71 C20 : 2-cis-11,14 104-120 3.47 2.44 3.44 C20 : 3-cis-8,11,14 104-119 3.73 招巧巧巧幻铝巧 2.29 3.63 C20 : 3-cis-11,14,17 104-119 3.91 3.39 3.75 C20: 4-CiS-5,8,11,14 83-103 7.03 5.25 6.94 C20 : 5-cis-5,8,11,14,17 107-126 4.68 2.38 4.55 C21:0 87-103 6.76 5.01 6.75 C22 : 2-cis-13,16 96-117 6.86 5.11 6.80 C22 : 6-ctS-4,7,10,13,16,19 103-111 2.52 2.17 2.51 C23 :0 102-117 4.23 2.59 4.15 C24: 1-C1S-15 99-114 3.87 2.77 3.85 3.2 Quantitative analysis of fatty acids The relative content and content of fatty acids in SN leaves arepresented in Table 3, and the chromatogram is given in Fig. 2.The total extraction yield after Soxtherm extraction was 0.76%,which was lower than the yield of 2.02% obtained by a previ-ously applied preparation method.1 The main reason for thisvariation in yield is the application of different solvents duringthe preparation of the extracts. Although the Soxhlet extractiontechnique should provide a higher total extraction yield, theinfluence of solvent polarity in the case of the classic extractiontechnique is greater. Thus, many different classesSOtcompounds were extracted with the previously used mixture offormaldehyde and ethanol, and a higher total extraction yieldwas obtained. Herein, fatty acids (FAs) are divided into two major groups:saturated (SFAs) and unsaturated fatty acids (UFAs). UFAs are further divided into monounsaturatedd(MUFAs) and polyunsaturated (PUFAs) fatty acids (Table 3). The presented results reveal a significant variation fromthe results obtained by the classic extraction technique,whereUFAs are slightly dominant over SFAs.1 Herein, the SFAcontent is 3.9-fold higher than that of UFAs (Table 3). Theyields of both SFAs and UFAs are also higher than thoseobtained in the previous study.10 Furthermore, all theprevious studies reported the predominance of three fattyacids in SN leaves: a-linolenic acid (C18 : 3), palmitic acid(C16 :0), and cis-9,12-linoleic acid (C18 :2)10,11,13 (Table 4). Inthis case, lauric acid (C12:0) was the major acid (20.94%348.07 ugg) followed by C16 : 0 (18.57%, 309.06 ugg)andC18:1 (13.16%,219.44 g g ). Other FAs quantified inhigher amount were C14: 0 (9.45%, 157.54 ugg), C18:0(8.72%,145.25ugg), C22 : 0 (6.13%,102.08 uggg), C20: 0 Fatty acid Relative content (%) Content (ugg) Relative content"(%) Content" (ug g}) Caproic acid (C6:0) 0.27 5.09 Caprylic acid (C8:0) 2.23 37.56 Capric acid (C10:0) 2.12 35.67 Lauric acid (C12 :0) 20.94 348.07 1.30 4.09 Myristic acid (C14: 0) 9.45 157.54 3.00 9.19 Myristoleic acid (C14: 1) 0.26 4.65 0.50 1.72 Pentadecanoic acid (C15: 0) 0.32 5.51 cis-10-Pentadecenoic acid (C15 : 1) 0.16 2.86 Palmitic acid (C16:0) 18.57 309.06 20.20 60.97 Palmitoleic acid (C16: 1) 0.24 4.18 1.00 3.19 Heptadecanoic acid (C17 :0) 0.25 4.33 0.30 1.09 cis-10-Heptadecenoic acid (C17:1) 0.13 2.2( 0.50 1.46 Stearic acid (C18:0) 8.72 145.25 3.30 9.95 cis-9-Oleic acid (C18: 1n-9) 13.16 219.44 3.20 9.80 cis-9,12-Linoleic acid (C18 : 2n-6) 3.00 50.17 18.20 55.99 Arachidic acid (C20:0) 5.26 87.80 6.90 20.91 a-Linolenic acid (C18: 3n -3) 1.02 17.02 22.60 67.98 Heneicosanoic acid (C21 :0) 0.50 8.20 0.90 2.76 cis-11,14-Eicosadenoic acid (C20:2) 0.75 12.68 2.80 8.53 Behenic acid (C22: 0) 6.13 102.08 5.90 17.95 Arachidonic acid (C20 : 4n -6) 0.41 7.13 0.50 1.76 Tricosanoic acid (C23:0) 0.17 3.05 1.10 3.52 cis-13,16-Docosadienoic acid (C22:2) 0.31 5.94 1.30 4.40 Lignoceric acid (C24:0) 4.84 80.50 4.30 12.99 cis-5,8,11,14,17-Eicosatrienoic acid (C20 : 5n-3) 0.30 5.22 Nervonic acid (C24:1) 0.49 8.36 1.70 5.07 Saturated fatty acids (SFAs) 79.77 1329.71 47.20 143.42 Unsaturated fatty acids (UFAs) 20.23 339.85 52.70 159.90 Monounsaturated fatty acids (MUFAs) 14.44 241.69 6.90 21.24 Polyunsaturated fatty acids (PUFAs) 5.79 98.16 45.80 138.66 SFA : UFA ratio 3.9 3.9 1.12 1.11 “ Results obtained by Durovic et al.10 Fig.22 Chromatogram of the fatty acid profile of stinging nettle leaves. Table 4 Relative content of fatty acids in stinging nettle obtained in previous studies Fatty acid Mature leaves“(%) Young leaves" (%) Vegetative parts" (%) Caproic acid (C6 :0) 一 一 一 Caprylic acid (C8 :0) 一 一 一 Capric acid (C10:0) 二一 二一 0.064 Lauric acid (C12 :0) 一 一 3.47 Myristic acid (C14:0) 1.79 Myristoleic acid (C14: 1) 一 一 一 Pentadecanoic acid (C15: 0) 一 一 0.42 cis-10-Pentadecenoic acid (C15:1) 一 一 Palmitic acid (C16:0) 17.90 20.10 17.71 Palmitoleic acid (C16:1) 3.00 3.90 3.20 Heptadecanoic acid (C17 : 0) 一 一 一 cis-10-Heptadecenoic acid (C17:1) 一 一 一 Stearic acid (C18:0) 1.60 1.90 1.11 cis-9-Oleic acid (C18:1n-9) 1.70 2.80 8.83 cis-9,12-Linoleic acid (C18: 2n -6) 11.60 18.10 20.25 Arachidic acid (C20:0) — 1.21 α-Linolenic acid (C18:3n-3) 40.70 29.60 31.40 Heneicosanoic acid (C21: 0) 一 Gondoic acid (C20:1) 0.80 0.70 0.30 cis-11,14-Eicosadenoic acid (C20:2) 一 0.08 Behenic acid (C22:0) 一 一 一 Erucic acid (C22 :1) 0.40 0.50 一 Arachidonic acid (C20:4n-6) 0.85 Tricosanoic acid (C23 :0) 一 一 — cis-13,16-Docosadienoic acid (C22:2) 一 一 Lignoceric acid (C24:0) 一 cis-5,8,11,14,17-Eicosatrienoic acid (C20 :5n-3) 一 一 一 Nervonic acid (C24:1) 一 “Results obtained by Guil-Guerrero et al.11 Results obtained by Bagci.13 (5.26%,87.80 ug g ), C24: 0 (4.84%, 80.50 ug g), C8: 0(2.23%,37.56 ugg ), and C10:0 (2.12%,35.67 ngg). Besides the variation in the content of each acid, it might benoticed that C6 : 0,C8:0, C10: 0,C15: 0,C:15 : 1, and C20 : 5were not detected in the extract obtained via the classicextraction approach. Herein, these fatty acids were quantifiedin the following amounts: 5.09 ug g(0.27%),37.56 ngg1(2.23%),35.67 ugg(2.12%), 5.51 ugg-(0.32%),2.86 ugg(0.16%), and 5.22 rg g(0.30%) (Table 3). Altogether, theseacids comprise 5.40% of the total quantified fatty acids.Generally, the presented results also showed that the content ofSFAs was higher when the SN leaves were extracted withpetroleum ether than that obtained using a mixture of formal-dehyde and ethanol. The exception was C23:0 FA witha content of 3.05 ug g, which was lower than the previouslyreported yield (Table 3). The contents of C18 : 2 and C18 :3 FAswere also lower in this study than those previously reported byDurovic et al.1 Namely, PUFAs were quantified in the followingamounts: 50.17 rg g and 17.02 ng g, whereas their previ-ously reported yields for C18 : 2 and C18: 3 FAs were 55.99 uggand 67.98ugg , respectively (Table 3). A similar influence of solvent on fatty acid profile and fattyacid content in prepared extracts was previously reported,24where Piper gaudichaudianum Kunth was extracted using Soxh-let, ultrasound-assisted, and pressurized liquid extractiontechniques, and ethanol and petroleum ether were used as solvents. The results showed that C18 : 2 and C18 : 3 FAs werequantified only in the ethanol extracts. This behavior of thesetwo PUFAs was ascribed to the stronger interaction betweerthem and polar solvents. This behavior was confirmed in thepresent study where C18:2 and C18:3 were quantified ina lower amount in the extract prepared using petroleum ethethan in the case of a mixture of formaldehyde and ethanol(Table 3). 3.3 Qualitative analysis of fatty acids Qualitative analysis and peaks conformation of the detectedand quantified FAs were conducted by introducing a spike intothe sample. The spike consisted of a standard mix of FAs and aninternal standard (ISTD). The chromatograms of the samplewith and without the spike and ISTD are presented in Fig. 3.Additionally, segments of this chromatogram are given inFig. 1S-4S (ESIT). Fig. 1S and 2St show the presence of C6 :0, C8 :0, C10 :0,C12 : 0,and C14 : 0, as well as the absence of C11 : 0 and C13 : 0(absence of peaks in red chromatogram). Fig. 3St reveals thepresence of C14 :1, C15 : 0, C15 : 1, C16 : 0, C16 : 1, C17: 0,C17 : 1, C18 :0, C18 : 1, C18: 2, and C20 : 0 and the absence oftrans-C18:1 and trans-C18:2 FAs. The C16 : 0, C18 : 0, andC18 : 1 FAs were easily noticed due to their high quantities inthe extract although their absence was expected because transacids were very rare in natural matrices. Fig. 4St indicates the Fig.3 Chromatogram of the stinging nettle leaves sample. Green chromatogram was obtained for the spiked sample, whereas the red chro-matogram was obtained in absence of the spike. ISTD stands for internal standard. presence of C20 : 0, C22 : 0, and C24 : 0 FAs in high quantities,where C22 : 0 is the major acid. On the other hand, the absenceof gamma-C18 : 3 and C22 :6 FAs was easily noticeable. Besidesthe abovementioned FAs, C18:3, C21: 0, C20: 2, C20: 4,C23: 0, C22: 2, C20: 5, and C24: 1 FAs were also determined(Fig. 4S*). unsaturated acids was in favor of saturated acids, unlike in theprevious report where unsaturated acids slightly dominatedover the saturated acids. Overall, the Soxtherm apparatus witha non-polar solvent is proven to be a better approach for theisolation of fatty acids, and the validated method is suitable forthe analysis of the obtained samples. 4. Conclusion Conflicts of interest The application of the Soxtherm system together with petro-leum ether as a solvent for the extraction of the fatty acids fromstinging nettle leaves was proven to be better for the isolation offatty acids from the natural source as compared to the classicextraction approach. The results in this study showed thata higher number of fatty acids was isolated than that in the caseof the classic method. Moreover, the yield of both saturated andunsaturated fatty acid was higher. Besides the higher yield offatty acids, the Soxtherm approach with a non-polar solventrevealed different compositions regarding the presence as wellas the content of quantified acids. The ratio of saturated and There are no conflicts to declare. Acknowledgements Authors of this study are grateful to Dr Goran Anackov andMilica Rat, University of Novi Sad Faculty of Sciences, Department of Biology and Ecology, Republic of Serbia, for support interms of confirmation and deposition of Urtica dioica L. at theBUNS Herbarium. References 1 L. P. Stanojevic, M. Z. Stankovic, D. J. Cvetkovic, M. D. Cakic,D. P. Ilic, V. D. Nikolic and J. S. Stanojevic, Sep. Sci. Technol.,2016,51,1817-1829. 2 D. Orcic, M. Franciskovic, K. Bekvalac, E. Svircev, I. Beara,M. Lesjak and N. Mimica-Dukic, Food Chem., 2014, 143,48-53. 3 R. Upton, J. Herb. Med., 2013,3,9-38. 4 Z. Kukric, L. Topalic-Trivunovic, B. Kukavica, S. Matos,S. Pavicic, M. Boroja and A. Savic, Acta Period. Technol.,2012,257-272. 5 T. A. Johnson, J. Sohn, W. D. Inman, L. F. Bjeldanes andK. Rayburn, Phytomedicine, 2013,20,143-147. 61. Giilcin, O. i. Kufrevioglu, M. Oktay andM. E. Biiyuikokuroglu,J. Ethnopharmacol.,2004,90,205-215. 7 K. K. Ghaima,N. M. Hashim and S. A. Ali, J. Appl. Pharm. Sci.,2013,3,96-99. 8 D. Brown, Encyclopedia of herbs and their uses, DorlingKindersley, London, 1995. 9 S. Gul, B. Demirci, K. H. C. Baser, H. A. Akpulat and P. Aksu,Bull. Environ. Contam. Toxicol., 2012, 88, 666-671. 10 S.Durovic, B. Pavlic, s. Sorgic, s. Popov, S.Savic,M.Pertonijevic, M. Radojkovic,A.(Cvetanovic andZ. Zekovic, J. Funct. Foods, 2017,32,18-26. 11J. L.Guil-Guerrero,M. M. Rebolloso-Fuentes andM. E. T. Isasa, J. Food Compos. Anal., 2003, 16,111-119. 12 S. E. Kudritsata, G. M. Filman, L. M. Zagorodskaya andD. M. Chikovanii, Chem. Nat. Compd., 1986, 22,604-605. 13 E. Bagci, in Biodiversity, ed. B. Sener, Springer US, Boston,MA, 2002, pp. 323-327. 14 P. Pinelli, F. Ieri, P. Vignolini, L. Bacci, S. Baronti ancA. Romani, J. Agric. Food Chem., 2008, 56, 9127-9132. 15 S. Otles and B. Yalcin, Sci. World J.,2012,2012,1-12. 16 M. Sajfrtova, H. Sovova, L. Opletal and M. Bartlova,J. Supercrit. Fluids, 2005, 35, 111-118. 17 F. Tack and M. Verloo, Sci. Total Environ., 1996, 192,31-39.18 D. Kara, Food Chem., 2009, 114,347-354. 19 G. D. Lawrence, The fats of life: essential fatty acids in healthand disease, Rutgers University Press, New Jersey, 2010. 20 A. P. Simopoulos, Am. J. Clin. Nutr., 1999,70, 560S-569S. 21 H. Iso,S. Sato,U. Umemura, M. Kudo, K. Koike, A. Kitamura,H. Imano, T. Okamura, Y. Naito and T. Shimamoto, Stroke2002,33,2086-2093. 22 Institute for standardization of Serbia, SRPS EN ISO5508:2009: Animal and vegetable fats and oils - Analysis bygas chromatography of methyl esters of fatty acids (ISO5508:1990), 2009. 23 Thomae and Schwendig-Radke, Separation of Fatty AcidMethyl Esters (FAME) on an Agilent J&W Select CP-Sil 88 forFAME GC Column, 2010. 24 V. F. Péres, J. Saffi, M. I. S. Melecchi, F. C. Abad, R. de AssisJacques, M. M. Martinez, E. C. Oliveira and E. B. Caramao,J. Chromatogr. A, 2006, 1105,115-118.
确定
还剩6页未读,是否继续阅读?

产品配置单


中国格哈特为您提供《刺荨麻叶的脂肪酸分布:现代分析方法在样品制备和分析中的应用 塞尔维亚诺维萨德大学》,该方案主要用于中药材和饮片中特殊物质和基团检测,参考标准--,《刺荨麻叶的脂肪酸分布:现代分析方法在样品制备和分析中的应用 塞尔维亚诺维萨德大学》用到的仪器有格哈特全自动快速索氏提取SOXTHERM、滤纸筒、德国移液器MM
该厂商其他方案
更多