


方案详情
文
使用格哈特公司杜马森Dumatherm N pro杜马斯定氮仪测定饲料、肉鸡蛋白质含量,使用格哈特公司海卓森Hydrotherm全自动超级酸水解结合索克森Soxtherm全自动快速索氏提取仪测定饲料、肉鸡总脂肪含量,使用格哈特公司费博森Fibretherm全自动纤维测定仪测定饲料粗纤维含量。
方案详情

final body weight of broilers at 40 days of age. The digestive capacity of newly hatched chicks is quite low, and increases with age to support growth. By meeting the nutritional requirements of the young chick, broiler performance may be improved throughout the production cycle by means of carryover effects. Not only will this increase the return of investment on feed costs but will also reduce the negative environmental effects that result from broiler production. Despite models using 21 day old birds having proven to yield better estimates of nutritional requirements during the early feeding phase, birds older than 40 days of age are still widely used in models for determination thereof. This trial was conducted in an effort to identify the optimal dietary energy (metabolisable energy) to protein ratio (expressed on the basis of total lysine) for Ross 308 broiler chicks from 0 to 21 days of age. Birds were provided with 12 treatments comprising of three metabolisable energy (ME) levels (11.31, 12.13 and 12.97 MJ/kg) in combinations with four total lysine (TLys) levels (1.3%, 1.4%, 1.6% and 1.7%). Each treatment was replicated 4 times. Following the experimental feeding phase, all birds were fed the same Grower, Finisher and Post-finisher diets until slaughter at 35 days of age. At day twenty-one of the trial, two male birds were randomly selected from each pen, euthanised and these carcasses were analysed for crude fat, fibre and protein. Body weight, feed intake and mortality were measured on days zero, three, seven, 10, 14, 21, 28 and 35 of the trial. Optimal broiler growth was found at TLys1.4 with no differences between ME levels. However, at the lowest TLys level body weight (BW) improved with every increase in ME level. Body weight gain (BWG) was similarly favoured by TLys1.4 during the experimental feeding phase but an inversed effect was observed in the carryover phase, where improved BWG was noted at high TLys levels and low ME levels. Feed intake (FI) was more influenced by TLys than ME levels, with increased FI when TLys increased from TLys1.3 to 1.4 at ME 11.30 and 12.13. Resultant 35 day feed conversion ratio (FCR) did not improve beyond TLys1.4 and differences due to ME levels were only observed at the lowest and highest TLys levels (ME 11.30 being the least favourable). No treatment effects were observed for mortality. The calculated performance efficiency factor (PEF) of the broilers in this study was maximised at TLys1.4 with no differences between ME levels; however, these results were matched when TLys1.3 was combined with ME 11.30. Carcass fat was observed to decrease with increasing TLys levels across all ME levels and carcass protein conformed to expected trends by increasing with increased TLys levels. Results based on broiler performance suggest that TLys of 1.4% in combination with ME levels as low as 11.30 MJ/kg may be successfully used in the early feeding phase.1 1 21日龄肉鸡生产性能的最佳能量/赖氨酸比值 Optimal energy to lysine ratio for performance of broilers from day-old to21 days of age Bilqees Mahomed BSc (Agric) Animal Science Submitted in partial fulfilment of the requirements for the degree MSc (Agric) Animal Science: Animal Nutrition In the Department of Animal and Wildlife Sciences Faculty of Natural and Agricultural Sciences University of Pretoria 2018 DECLARATION OF ORIGINALITY I, Bilqees Mahomed, hereby declare that this dissertation submitted for the obtainment of the degreeMSc (Agric) Animal Science: Animal Nutrition at the University of Pretoria is my own work as hasnot been previously submitted by myself for a degree at any institution. Signature: Date: ACKNOWLEDGEMENTS To my Creator, everything that I am and everything that I have is from You and for You. I would like to express my gratitude to AFGRI Animal Feeds for awarding me the internship thatsupported my MSc degree. I sincerely appreciate the effort and dedication of the staff at DaybreakTrial House who were instrumental in the successful execution of my trial. A heartfelt thank you to my colleagues at Labworld; who have assisted greatly in completing theanalytical aspects of my experiment. I would especially like to thank Sarla Moodley for herencouragement throughout my studies and for her guidance with my analyses. Christine Jansen van Rensburg (Dr. C) cannot be thanked enough for her commitment, consideration,and most of all, her patience. Much credit for my progress in monogastric nutrition is due to her. I am grateful to Roelf Coertze for his dependable assistance with my statistical analysis. Thank you to Kelly Brennan for her encouragement and assistance with my trial and thesis, especiallywith the carcass processing aspect. My deep appreciation is given to my best friend; Lutfiyya Razak, who never shied away from gettingher hands dirty and who always had time and energy to help me. To my mother, who supported all my endeavours and tolerated my antics, words cannot express mythankfulness. I love you. Abstract The seven day period post hatching is considered critical as it is thought to account for 8-10%of the final body weight of broilers at 40 days of age. The digestive capacity of newly hatched chicksis quite low, and increases with age to support growth. By meeting the nutritional requirements of theyoung chick, broiler performance may be improved throughout the production cycle by means ofcarryover effects. Not only will this increase the return of investment on feed costs but will alsoreduce the negative environmental effects that result from broiler production. Despite models using 21day old birds having proven to yield better estimates of nutritional requirements during the earlyfeeding phase, birds older than 40 days of age are still widely used in models for determinationthereof. This trial was conducted in an effort to identify the optimal dietary energy (metabolisableenergy) to protein ratio (expressed on the basis of total lysine) for Ross 308 broiler chicks from 0 to21 days of age. Birds were provided with 12 treatments comprising of three metabolisable energy(ME) levels (11.31,12.13 and 12.97 MJ/kg) in combinations with four total lysine (TLys) levels(1.3%, 1.4%,1.6% and 1.7%). Each treatment was replicated 4 times. Following the experimentalfeeding phase, all birds were fed the same Grower, Finisher and Post-finisher diets until slaughter at35 days of age. At day twenty-one of the trial, two male birds were randomly selected from each pen,euthanised and these carcasses were analysed for crude fat, fibre and protein. Body weight, feedintake and mortality were measured on days zero, three, seven, 10, 14, 21, 28 and 35 of the trial. Optimal broiler growth was found at TLys1.4 with no differences between ME levels.However, at the lowest TLys level body weight (BW) improved with every increase in ME level.Body weight gain (BWG) was similarly favoured by TLys1.4 during the experimental feeding phasebut an inversed effect was observed in the carryover phase, where improved BWG was noted at highTLys levels and low ME levels. Feed intake (FI) was more influenced by TLys than ME levels, withincreased FI when TLys increased from TLys1.3 to 1.4 at ME 11.30 and 12.13. Resultant 35 day feedconversion ratio (FCR) did not improve beyond TLys1.4 and differences due to ME levels were onlyobserved at the lowest and highest TLys levels (ME 11.30 being the least favourable). No treatmenteffects were observed for mortality. The calculated performance efficiency factor (PEF) of thebroilers in this study was maximised at TLys1.4 with no differences between ME levels; however,these results were matched when TLys1.3 was combined with ME 11.30. Carcass fat was observed todecrease with increasing TLys levels across all ME levels and carcass protein conformed to expectedtrends by increasing with increased TLys levels. Results based on broiler performance suggest thatTLys of 1.4% in combination with ME levels as low as 11.30 MJ/kg may be successfully used in theearly feeding phase. Table of contents Abstract 1ii List of abbreviations V1 List of tables Vii Chapter 1: Introduction Chapter 2: Literature Review 3 2.1 Dietary energy for broilers 3 2.1.1 Classification of energy. 3 2.1.2 Sources of dietary energy for broilers 4 2.2 Dietary protein for broilers 4 2.2.1 Amino acids in broiler diets 5 2.2.2 Amino acid digestibility 5 2.2.3 Amino acid imbalances 6 2.2.4 Balanced protein for broilers 7 2.3 Energy to protein ratios in broiler diets_ 7 2.3.1 Factors affecting response of broilers to dietary energy and amino acid levels 8 2.3.2 Effect of energy to protein ratios in broiler diets C 2.3.2.1 Feed and nutrient intake Q 2.3.2.2 Broiler performance 11 2.3.2.3 Carcass composition 12 2.4 Early nutrition for broilers 15 2.4.1 Pre-starter and Starter diets for broilers 15 2.4.2 Phase-specific and carryover effects of increased dietary balanced protein levels_ 16 Conclusion 17 Chapter 3: Materials and Methods 18 3.1 Experimental design 18 3.2 Animal husbandry 18 3.3 Experimental diets 18 3.4 Broiler performance measurements 26 3.5 Carcass analysis 26 3.6 Statistical analysis_ 27 Chapter 4: Results 28 4.1 Body weight 28 4.2 Body weight gain 30 4.3 Feed intake 33 354.4 Feed conversion ratio_ 384.5 Performance efficiency factor 404.6 Carcass composition 414.7 Mortality. 42Chapter 5: Discussion 425.1 Body weight and body weight gain 435.2 Feed intake 445.3 Feed conversion ratio_ 445.4 Performance efficiency factor 445.5 Carcass composition 46Chapter 6: Conclusion 48Chapter 7: Critical review and Recommendations 49Chapter 8: References Appendixes_ a List of abbreviations AAAmino acidAMEApparent metabolisable energyBPBalanced proteinBWBody weightBWGBody weight gainCPCrude proteindLysDigestible lysineEAAEssential amino acidsFCEFeed conversion efficiencyFCRFeed conversion ratioFIFeed intakeLysLysineMEMetabolisable energyMetMethionineNENet energyNEAANon-essential amino acidsNSPNon-starch polysaccharidesPEFPerformance efficiency factorTLysTotal lysineTMETrue metabolisable energy List of tables Table 2.1 Classification of amino acids for broilers (adapted from Leeson and Summers, 2001). 5 Table 2.2 Amino acid recommendations (as % of diet) for meat type chickens from 0 to 3 weeks(adapted from NRC, 1994 and Aviagen Ross 308 broiler manual, 2014) 16 Table 3.1 Formulated metabolisable energy (ME) and total lysine (TLys) levels and ME:TLys ofexperimental diets that were fed to broilers from 0 to 21 days of age 20 Table 3.2 Formulated raw material composition (%) of experimental diets 21 Table 3.3 Formulated nutrient composition (%) of experimental diets 22 Table 3.4 Analysed nutrient composition (%) of experimental diets 23 Table 3.5 Formulated total amino acid composition (%) of experimental diets 24 Table 3.6 Analysed amino acid composition (%) of experimental diets_ 25 Table 4.1.1 The effect of varying ME:TLys on body weight (g) of broilers at 0 days of age (±standard error of the mean) 28 Table 4.1.2 The effect of varying ME:TLys on body weight (g) of broilers at 3 days of age (±standard error of the mean) 28 Table 4.1.3 The effect of varying ME:TLys on body weight (g) of broilers at 7 days of age (±standard error of the mean) 29 Table 4.1.4 The effect of varying ME:TLys on body weight (g) of broilers at 10 days of age (±standard error of the mean) 29 Table 4.1.5 The effect of varying ME:TLys on body weight (g) of broilers at 14 days of age (±standard error of the mean).... 29 Table 4.1.6 The effect of varying ME:TLys on body weight (g) of broilers at 21 days of age (±standard error of the mean) 29 Table 4.1.7 The effect of varying ME:TLys on body weight (g) of broilers at 28 days of age (±standard error of the mean) 30 Table 4.1.8 The effect of varying ME:TLys on body weight (g) of broilers at 35 days of age (±standard error of the mean) 30 Table 4.2.1 The effect of varying ME:TLys on body weight gain (g) of broilers at 3 days of age (±standard error of the mean) 31 Table 4.2.2 The effect of varying ME:TLys on body weight gain (g) of broilers at 7 days of age (±standard error of the mean) 31 Table 4.2.3 The effect of varying ME:TLys on body weight gain (g) of broilers at 10 days of age (±standard error of the mean) 31 Table 4.2.4 The effect of varying ME:TLys on body weight gain (g) of broilers at 14 days of age (±standard error of the mean) 31 Table 4.2.5 The effect of varying ME:TLys on body weight gain (g) of broilers at 21 days of age (±standard error of the mean) 32 Table 4.2.6 The effect of varying ME:TLys on body weight gain (g) of broilers at 28 days of age (±standard error of the mean) 32 Table 4.2.7 The effect of varying ME:TLys on body weight gain (g) of broilers at 35 days of age (±standard error of the mean) 32 Table 4.3.1 The effect of varying ME:TLys on feed intake (g) of broilers at 3 days of age (± standarderror of the mean) 33 Table 4.3.2 The effect of varying ME:TLys on feed intake (g) of broilers at 7 days of age (± standarderror of the mean) 33 Table 4.3.3 The effect of varying ME:TLys on feed intake (g) of broilers at 10 days of age (±standard error of the mean ) 3 3 Table 4.3.4 The effect of varying ME:TLys on feed intake (g) of broilers at 14 days of age (±standard error of the mean) 34 Table 4.3.5 The effect of varying ME:TLys on feed intake (g) of broilers at 21 days of age (±standard error of the mean) 34 Table 4.3.6 The effect of varying ME:TLys on feed intake (g) of broilers at 28 days of age (±standard error of the mean) 34 Table 4.3.7 The effect of varying ME:TLys on feed intake (g) of broilers at 35 days of age (±standard error of the mean) 35 Table 4.4.1 The effect of varying ME:TLys on the feed conversion ratio of broilers at day three of age(± standard error of the mean) 35 Table 4.4.2 The effect of varying ME:TLys on the feed conversion ratio of broilers at day seven ofage (± standard error of the mean) 36 Table 4.4.3 The effect of varying ME:TLys on the feed conversion ratio of broilers at day ten of age(± standard error of the mean) 36 Table 4.4.4 The effect of varying ME:TLys on the feed conversion ratio of broilers at day fourteen ofage (± standard error of the mean) 36 Table 4.4.5 The effect of varying ME:TLys on the feed conversion ratio of broilers at day twenty-oneof age (± standard error of the mean). 37 Table 4.4.6 The effect of varying ME:TLys on the feed conversion ratio of broilers at day twenty-eight of age (±standard error of the mean) 37 Table 4.4.7 The effect of varying ME:TLys on the feed conversion ratio of broilers at day three5 ofage (± standard error of the mean) 37 Table 4.5.1 The effect of varying ME:TLys on the performance efficiency factor of broilers at daythree of age (± standard error of the mean) 38 Table 4.5.2 The effect of varying ME:TLys on the performance efficiency factor of broilers at dayseven of age (± standard error of the mean) 38 Table 4.5.3 The effect of varying ME:TLys on the performance efficiency factor of broilers at day tenof age (± standard error of the mean) 38 Table 4.5.4 The effect of varying ME:TLys on the performance efficiency factor of broilers at dayfourteen of age (± standard error of the mean) 39 Table 4.5.5 The effect of varying ME:TLys on the performance efficiency factor of broilers at daytwenty-one of age (± standard error of the mean).. 39 Table 4.5.6 The effect of varying ME:TLys on the performance efficiency factor of broilers at daytwenty-eight of age (± standard error of the mean) 39 Table 4.5.7 The effect of varying ME:TLys on the performance efficiency factor of broilers at daythree5 of age (± standard error of the mean) 40 Table 4.6.1 The effect of varying ME: TLys on carcass moisture of broilers at 21 days of age (+standard error of the mea n ) 40 Table 4.6.2 The effect of varying ME: TLys on carcass fat of broilers at 21 days of age (± standarderror of the mean) 41 Table 4.6.3 The effect of varying ME: TLys on carcass protein of broilers at 21 days of age (±standard error of the mean) 41 Chapter 1 Introduction Optimal broiler production depends on meeting the animals’ requirements for growth whilst avoidingwastage associated with production input. Providing dietary energy and protein in quantities similar to thoserequired by the bird has been of interest as a means of reducing the nutritional cost, as well as theenvironmental pollution associated with broiler production. Nir (1995) observed that broiler body weight(BW) at six days of age had a significant positive correlation to BW at six to seven weeks of age. Thisfinding was supported by the theory that the seven day period post hatching accounted for 8-10% of the BWat 40 days of age and is thus considered critical for broilers (Lilburn, 1998). The model used to determine energy and amino acid (AA) requirements in the early feed phases iswidely practised using broilers older than 40 days of age, despite younger birds (21 day old) having provento yield better estimates of AA requirements in the Pre-starter and Starter phases (Brito et al.,2011). Wijttenet al. (2004a) found that increased balanced protein (BP) levels in the Starter improved broiler growth in thatphase, as well as throughout entire growing period. When BP was increased in the Grower phase, followingan adequate BP Starter, a lower magnitude of response in broiler performance was elicited. This corroboratesthe significance of increased BP level in the Starter phase. Carryover effects similar to those observedbetween BP levels in Starter and Grower phases were also evident between Grower and Finisher phases(Pesti & Fletcher, 1984). Wijtten et al. (2004a) observed a long term carryover effect where increased BP inthe Starter phase resulted in abdominal fat accretion being significantly lower at slaughter. Increasing thelevel of BP in the early feed phases may be regarded as an investment since the increase in feed cost maywell be exceeded by the profit generated through improved BWG in the subsequent phases of the productioncycle. Improvements in broiler performance traits seen in response to changes in the energy to protein ratiohave been partially attributed to the enhanced development of the digestive system (Swatson et al., 2000).Diets with varying combinations of ME and total protein levels resulted in significant changes observed inthe digestive organs in broilers from 12 to 24 days of age. These involved increases in gizzard, duodenal,pancreatic, caecal and ileal weights, as well as the digesta holding capacity of the gizzard and small intestine.Treatments with the highest ME to protein ratios per ME level tested yielded the best broiler performance.Lilburn (1998) emphasised that young chicks are metabolically prepared to oxidise fatty acids and thus toutilise dietary fat, provided that fat sources containing high levels of long chain unsaturated fatty acids(vegetable oils). This supported the findings of Swatson et al. (2000) that encouraged an increased ME levelin the post hatch feeding phase. Direct mechanisms through which changes in the digestive organs affectedthe performance response were not elucidated, rather the increased rate of digestive organ development and its possible impact on protein utilisation efficiency is assumed to be responsible for a proportion of this effect(Swatson et al., 2000). This theory may be supported by work conducted by Noy & Sklan (1997) whoobserved that birds deprived of feed and water in the first forty eight hours post hatch had reduced villus sizeand enterocytes per villus five to six days later. It was suggested that reduced intestinal function resulted indepressed growth rate of birds over an extended period. Research on the interaction between dietary ME and dietary AA on broiler performance and carcasstraits conducted by Cho (2011), revealed a reliance on the ratio of BP with energy in the diet. The author’sfindings implied that at higher levels of dietary Lys, more energy is required for optimal broiler performance.Chang et al. (2015) examined the effect of decreasing ME levels in combination with BP levels at lower andhigher levels recommended by the Ross 308 broiler manual (Aviagen, 2007) under moderate heat stressconditions. The findings of this experiment corresponded with those reported by Cho (2011). Ullah et al.(2012) tested combinations of varying levels of ME and Lys inclusion rates at a fixed protein level of 21% inthe Pre-starter diet (days 1 to 10 of the productive cycle). These findings demonstrated that increased Lyslevels at the higher ME level resulted in optimal broiler performance. The improvement in slaughter weightwas thought to be correlated with the superior seven day body weight. It must be noted that the ME levelstested in the above mentioned studies (Cho, 2011;Ullah et al., 2012) were below the recommended levels asspecified by both the NRC (1994) and Aviagen (2012). It is undeniable that broiler performance at time of slaughter can be improved by nutritionalintervention during the early feeding phases. The aim of this trial was to identify the ideal combinations ofdietary energy and protein levels in the Pre-starter and Starter phases that would optimise broilerperformance throughout the broiler production cycle. While an increase in BP level is expected to improvebroiler performance, the maximum level that will elucidate a significant response in broiler performancemust be specified at the various energy levels it is tested against. Similarly, lower energy levels have beenimplied to be sufficient to support optimal broiler performance but the minimum level that will suffice foreach BP must be identified. Both these parameters (dietary balanced protein and energy) were analysed withfocus on the early feeding phase and the carryover effects resulting from them at slaughter in order to betterunderstand the nutritional requirements of broilers from hatching to 21 days of age. Chapter 2Literature Review Energy and protein are the two largest constituents of broiler diets and are also the primarydeterminants of production cost through their influence on feed cost as well as resultant broiler performance(Cho, 2011). Due to the high cost of synthetic AA available for animal feeds, small changes in inclusionlevels result in significant feed cost differences (Viera et al., 2016). The use of mature broilers as a model todetermine energy and amino acid (AA) requirements in the early feed phases is widely practised, despiteyounger birds (21 day old) having proven to yield better estimates of AA requirements in the Pre-starter andStarter phases (Brito et al., 2011). It is thus important for further research to be conducted to identify ideallevels of energy and protein for the early feeding phases, in order to improve overall broiler production andreduce feed costs. 2.1 Dietary energy for broilers 2.1.1 Classification of energy Energy requirements of broilers may be divided into that required for maintenance, such as basalmetabolism (thermogenesis and physical activity) and that used for production. The energy contribution of afeedstuff may be represented as gross energy (total combustible energy), digestible energy (DE) (grossenergy less the energy lost through faecal excretion), ME (DE less the energy lost through production of gasand urinary products) and net energy (NE) (ME less the energy lost through heat production during digestionand metabolism) (NRC, 1994). Metabolisable energy (ME) or apparent metabolisable energy (AME) may becorrected for endogenous energy loss, to give true metabolisable energy (TME) (Sibbald, 1976). A furthercorrection made for nitrogen retention of the animal yields TMEn. This is thought to be the most accurateestimation of the energy content of a feedstuff due to the variables it accounts for. However, due to therelatively small contribution of endogenous loss to overall energy loss, AMEn is more commonly used as anestimate of ME (Parsons, 1982). The shortcomings of using ME on an energy evaluation platform include the lack of differentiationbetween efficiencies of different energy generating precursors and disregard of the effect of the animalsage/physiological status on the ME value for individual feedstuff, as well as the effect of the level of feedingon energy utilisation efficiency (Batal & Parsons, 2004). NE values provide the best estimate of the actualenergy contribution of a feedstuff, as it does account for the differences in efficiency of utilisation of energyprecursors,,but direct measurements thereof are expensive and time consuming (Pirgozliev et al,. 2011). Indirect methods include use of prediction equations based on DE/ME values and chemical characteristics ofthe relevant diets (Noblet, 2010). 2.1.2 Sources of dietary energy for broilers Broilers may derive energy from carbohydrates, protein and fats (NRC, 1994).Carbohydrates,specifically the starch component, are the main energy contributor to dietary energy (Cho, 2011). Starchmay be present either as amylase (consisting of linear glucose chains, which are not as readily cleaved byamylase) or amylopectin (consisting of linear and branched glucose chains, making it more susceptible toenzymatic cleavage). Some polysaccharides exist that are not of starch origin; called non-starchpolysaccharides (NSPs). The enzymes required to digest NSPs are not naturally secreted by monogastricanimals, thus nullifying their possible energy contribution. Water soluble NSPs consist of B-glucans,arabinoxylans and fructans, all of which have a marked anti-nutritional role of increasing digesta viscosity inthe small intestine, which adversely affects its absorption capacity (Iji, 1999). NSPs also consist of dietaryfibre, which is fermentable but indigestible carbohydrates. Due to the water insolubility of dietary fibre,intestinal digesta viscosity is unaffected by its presence (Hetland et al., 2004). Lipids are the most energy dense feed component and are most efficiently metabolised, possibly due toa relatively lower heat increment during digestion (Classen, 2013). Whilst hard fats (tallow and lard) are notutilised by young birds, vegetable fats are readily utilised and can be included in the diet up to 3-4% beforeaffecting pellet quality; an additional 2-3% may be sprayed on onto the already-formed pellet. Fats arecommonly found as triglycerides and sometimes as free fatty acids. Saturated fatty acids may be formed denovo, with the exception of linoleic and a-linolenic acids, which are referred to as essential fatty acids. Sincefatty acids are not excreted in the urine, their ME values are determined by the rate at which they areabsorbed from the digestive tract (Kleyn, 2013). Dietary protein may be used as glucose precursors, but thisis less efficient as protein must first undergo amino acid (AA) catabolism to supply energy; which has anassociated energy cost of excretion of excess nitrogen as uric acid (Cho, 2011). 2.2 Dietary protein for broilers Broiler production centres on the conversion of feed protein to animal protein (meat production).Following energy, protein is the second largest constituent of broiler diets and is the most expensivecomponent thereof. Apart from the financial implication of excess protein, the environmental impact ofnitrogenous waste excreted from livestock must be accounted for (Nasr & Kheiri, 2011). The protein valueof a feedstuff is usually depicted as crude protein (CP), which is calculated by multiplying its nitrogenpercentage by a factor of 6.25. This is an inaccurate estimate as it does not account for the different nitrogen: protein ratios that exist across feed ingredients and unlike true protein, CP is not solely based on the AAcontribution of the feedstuff, but also on the non-protein nitrogen that may be present (Mariotti et al., 2008).Protein requirements in broilers actually signify the requirement of amino acids (AA), the monomers ofprotein. Factors determining this requirement include the level of bird productivity (growth and eggproduction) as well as broiler maintenance (AA used in production of body components and in variousmetabolic pathways) (NRC, 1994). Malheiros et al. (2003) found that protein concentration was mostconsequential when the effects of low levels of dietary fat, energy and protein on broiler growth wereevaluated. 2.2.1 Amino acids in broiler diets Amino acids are compounds of carbon, hydrogen and nitrogen (sometimes also containing sulphurand/or phosphorus), that are covalently bonded by peptide bonds to form proteins. These may be either ofdietary or animal (endogenous) origin. Free forms of AA and small peptides may be found in AA poolswithin the animal’s body, at concentrations reflecting its AA balance. Of the 22 different known AA, 11 areclassified as essential AA (EAA). This is based on their lack of or limited de novo syntheses whichnecessitates their dietary supplementation (Leeson & Summers, 2001). For poultry, eight of the EAA areconsidered critical, as they are not present in significant amounts in a typical diet. Non-essential AA (NEAA)are readily formed in the body, thus dietary requirement is minimal or null. The classification of amino acidsfor broilers is shown in Table 2.1. Table 2.1 Classification of amino acids for broilers (adapted from Leeson and Summers, 2001) Essential Non-Essential Lysine Glutamine Methionine Alanine Cysteine Glutamic acid Isoleucine Aspartic acid Arginine Asparagine Threonine Hydroxyproline Tryptophan Glycine Valine Serine Histidine Proline Phenylalanine Leucine Non-critical EAA 2.2.2 Amino acid digestibility Amino acid digestibility refers to the fraction of dietary AA which is retained following ingestion (notexcreted in the faeces) and can be calculated as the difference between AA intake and faecal output as afraction of intake. Since the evaluation of AA availability is expensive and time consuming (Garcia, 2006),AA digestibility is used as an estimate of availability. This also allows for diets to be formulated with moreprecision with regard to meeting nutritional requirements. Feed ingredients with low levels of digestible AAare often financially wasteful and contribute to heightened levels of nitrogen in the faeces through theexcretion of excess AA (Lemme et al, 2004). When such feed ingredients constitute large proportions of thediet, broiler performance can be more difficult to accurately predict due to the limited availability of AA(Fernandez et al., 1995). Nasr & Kheiri (2011) examined the difference between diet formulations based ontotal AA versus digestible AA inclusion on broiler carcass yield and found that breast meat yield andabdominal fat accretion were significantly higher when digestible AA values were used. This result wasattributed to a higher AA intake from these diets. 2.2.3 Amino acid imbalances Single AA deficiencies in broiler diets (up to 50% deficient) resulted in reduced growth rate and feedintake (FI); this is especially prominent with EAA (Okumora & Mori, 1979). Single AA excesses are moredangerous, with Met being the most toxic, resulting in depressed growth and FI. Excesses of certain AA maylimit the efficiency of the use of the first limiting AA. Antagonism between AA may also be present,wherein excess of a certain AA increases the requirement for another, metabolically similar AA, as seen inbirds with high levels of Lys elevating renal arginase activity and thus the Arg requirement (Nesheim, 1968)Such factors may contribute to the impaired growth characteristics that have been noted in response to AAexcesses (Han & Baker, 1993), however, no thermogenic difference was observed in diets containingimbalanced protein (Macleod, 1997). Variations in protein quality that result in AA imbalances may have an effect on energy utilisation inbroilers. Resultant effects may be seen in BWG and nitrogen retention, without any associated changes infeed or nitrogen intake. This was demonstrated by findings of Nieto et al. (1995), where supplementation ofa Met deficient broiler diet with DL-Met resulted in increased weight gain, and nitrogen and energy retainedas protein. When the same diet was supplemented with L-Lys, weight gain, and nitrogen and energy retainedas protein decreased. This suggested that supplementation of the first limiting AA can improve the quality ofdietary protein, as well as the efficiency of dietary ME utilisation and thus growth, however, over-supplementation of an AA can lead to a further imbalance in the AA profile, which may reduce daily weightgain and nitrogen retention. Supporting results were found by Macleod (1997), which indicated that proteinquality played a role in AA imbalances. Low Lys levels from a balanced protein (BP) were shown to yield a higher TME intake in broilers from 21 days of age, when compared to high Lys levels from an unbalancedprotein. Protein retention was positively correlated with Lys concentration (intake) but negatively so withLys to CP ratio, thus with lower protein quality, a higher protein retention per gram of Lys was observed.Heat production, measured by indirect calorimetry, was shown to correlate with Lys intake, Lys to CP, aswell as Lys to TME ratios. The change in body composition resulting from a difference in CP and TME ratiowas not accompanied by a change in the regulatory heat increment. 2.2.4 Balanced protein for broilers Despite the importance of EAA supplementation, it alone is not enough to optimise broilerperformance. Pesti (2009) demonstrated that even with the supplementation of sufficient EAA necessary tosupport growth, chickens fed low-protein diets did not perform positively as was expected, and insteadaccrued excessive fat instead of lean muscle; thus, the requirement for NEAA as well as EAAAWashypothesised. It has been acknowledged that the AA requirement of poultry is affected by genetic, nutritionaland environmental factors (Wijtten et al., 2004a), necessitating the need for a common basis for AArequirements to be quantified. The concept of ideal or balanced protein (BP) is theoretically that whichprecisely meets an animal’s AA requirement, by supplying the correct balance of EAA and sufficientnitrogen for the de novo production of NEAA without any deficiencies or excesses (Emmert & Baker,1997).Since requirements for EAA have been described in values relative to Lys, all AA within BP are equallylimiting, so although the absolute values of the AA required may change, the ratio between these values isrelatively constant (Wijtten et al.,2004b). Multiple factors have led to the level Lys being used as the reference AA relative to which other EAAare given proportional values. These include Lys often being the second limiting AA (limiting being that AAwhich is most deficient relative to others), extensive studies having been conducted on Lys, analysis of Lyscontent in feedstuffs being relatively uncomplicated and the function of Lys being solely for maintenanceand accretion of protein (not used as a precursor for NEAA synthesis) (Emmert & Baker, 1997; Plumstead,2005). Theoretically, the BP concept indicates the possibility of maintaining broiler performance at lowerdietary CP levels, by inclusion of sufficient and balanced essential AA. However; this did not hold true in alltrials using low protein levels. In these cases, lower protein diets did not yield the same performance as thecontrol diets. Such results could be attributed to the modern broiler strain having a high requirement of non-essential as well as essential AA (Lemme et al., 2003). 2.3 Energy to protein ratios in broiler diets 2.3.1 Factors affecting response of broilers to dietary energy and amino acid levels Work by Classen (2013) reviewed multiple aspects of broiler management as having an influence onbroiler response to energy. When focusing on energy to protein ratio, the author proposed that eachcomponent be treated as a possible limiting factor so that whichever was first limiting would be of primaryimportance for that specific situation. This led to the conclusion that the ratio of consequence is in fact thatof dietary energy to the level of digestible ideal essential AA, provided that minimum protein levels areavailable to support sufficient synthesis of non-essential AA. Differences in response between sexes of broilers were observed by Wijtten et al. (2001) who foundthat higher dietary BP levels led to a higher response in male birds than females, where BWG in malesincreased in response to up to 130% Dutch CVB standard and females only up to 110 to 120% Dutch CVBstandard. Feed conversion improved in response to increasing dietary BP level in both sexes, but to a higherdegree in males. Male broilers have a higher potential for improved BWG and feed conversion efficiency,and thus a higher AA requirement to fulfil said potential. A further finding by Baker (2009) was that insteadof an overall increase in AA requirements, the requirement specifically for Lys was higher in male chicksthan in females. The effect of broiler age may be attributed to the development of the digestive system in newly-hatched chicks; which is continuous throughout the first few weeks post-hatch. This can be assumed fromperformance results as reported by Brito et al. (2011), in which ileal digestibility of cecectomised broilers ofseven days of age provided a better estimate of 21 day old broiler AA requirement than that of broilers of 42days of age. Protein gain as a proportion of BWG is reduced with progressive age and BW, thus acorresponding reduction in AA and protein requirement exists for older, heavier birds (Baker, 2009). Thisfinding is supported by Wijtten et al. (2004b), wherein increasing BWG and decreasing FCR respondedlinearly to increasing dietary BP levels in broilers from 14 and 34 days of age, but exponentially in broilersfrom 28 to 41 days of age. Feed form, pellet quality and particle size of feed ingredients used in finished feed are all implicated asindirectly affecting broiler performance through their effect on FI. If these can be controlled, theaforementioned response may be improved to an extent. Work conducted by Greenwood et al. (2005)indicated that BWG of broilers responded positively to higher dLys levels when feed was provided in pelletform rather than in form of a mash. A similar relationship was seen between feed form and feed efficiency(FE), with the additional finding that dLys deficient diets in the pellet form amplified the deficiency effect onFE more so than the mash form. Increased feed and energy intake was observed with pelleted feed..Theincreased potential response of BWG and FE to dLys suggested that pelleted feed should be used as the model for determining dLys requirements for broilers. Findings by Lemme et al. (2006) showed that despitehigher final BW having resulted from diets containing good quality pellets, BWG of poor quality pelletscould possibly be equivalent, provided they contained higher BP levels. In agreement with the findings ofGreenwood et al. (2005), FI in birds offered mash was lower than in birds offered pellets, resulting in adecreased BWG. If digestible Lys levels were increased, the decrease in FI of mash became even morepronounced than that of pellet diets. These observations may be attributed to the increased energy cost ofconsuming finer particles. The importance of pellet quality should not be ignored when aiming to optimisenutrient intake while reducing production costs. 2.3.2 The effect of energy to protein ratios in broiler diets 2.3.2.1 Feed and nutrient intake High energy feeds were often assumed to reduce FI (Liu et al., 2016). This has allowed for AArecommendations to be provided as a function of the energy value of the diet (i.e. gram per MJ ME). Theimplication of this was that for a higher energy density, a higher AA density was necessary to compensatefor the associated reduction in FI in order for optimal broiler performance to be achieved (Lemme,2007).Work by Bellaver et al. (2002) has demonstrated that FI from days 1 to 21 of the growing period decreasedas the dietary ME level increased from 12.55 to 13.39 MJ/kg, provided dietary AA was balanced relative to adigestible Lys level of 10.2 g/kg and higher. Weight gain responses for ME densities of 12.97 and 13.39MJ/kg indicated that the optimum response was achieved at the BP levels between 9.2 and 12.2 g/kg. Foroptimum response to have resulted from the 12.55 MJ ME/kg diet, a higher level of BP would have beenrequired (weight gain showed an increasing trend even with the highest digestible Lys to ME ratio used inthis experiment). Results of a similar experiment conducted by Plumstead (2005) concurred with theseresults, where it was shown that a higher digestible Lys to ME ratio was required at decreasing ME densitiesfor broiler performance to be maintained. Therefore, it may be concluded that the increase in FI associatedwith a lower energy density of the diet alone is not sufficient to allow for adequate AA intake to meetrelevant broiler requirements (Lemme,2007). Despite the regulatory effect dietary energy is assumed to have on FI, its influence on BWG isconsidered indirect due to the more significant effect resulting from the level of dietary protein, which in turnis controlled by FI. Lemme et al. (2005) tested combinations of dietary ME and BP AA levels at variousfractions of the Aviagen Ross Management Guide recommendations across each feed phase. From day zeroto 46 of the trial, FI was shown to increase non-linearly with increasing dietary BP levels and decreasingdietary ME densities. At 95% ME recommendation, energy intake was shown to have been maintainedthrough increased FI, but at lower dietary ME levels, FI could not be sufficiently increased to maintain energy intake. BWG increased non-linearly with increasing dietary AA density, as was seen across all energydensities, however higher weight gains were seen with lower energy densities where FI increased, especiallyin the Starter phase. Another favourable response to increasing dietary AA density observed was a reductionin the FCR. Decreasing ME levels resulted in favourable weight gains. This effect was further improved withincreasing AA levels, which in turn is increased by the energy-driven increased FI. Relatively higher dietaryAA levels and lower ME levels relative to the Aviagen recommendation were shown to yield the best broilerperformance, thus implying that as dietary ME is lowered, dietary AA should not be reduced, or at least notto the same extent. Faulkner (1993) had seen a similar trend in FI when feeding decreasing Lys levels incombinations with and without sucrose supplementation. While birds attempted to increase Lys intakethrough increasing their FI, the addition of dietary sucrose proved to impede their efforts. Explanations forthis reduction in FI included the birds having been unable to cope with the increased heat increment resultingfrom the high energy intake as well as a reduced body size (physical capacity) resultant from the low Lysintake. In further agreement with Lemme et al. (2005), Faulkner (1993) observed an increase in growth ratewith increasing dietary Lys levels until the point at which it reached a plateau - this was thought to be due toinsufficient dietary energy. Increasing dietary energy levels relative to protein levels also reduced growthrate through increased fat deposition as well as heat production. More recent work conducted by Plumstead et al. (2007) negated the effect of dietary energy density onthe level of FI in broilers. The first experiment tested combinations of three dietary ME levels varying from12.55 to 13.39 MJ/kg with four dietary CP levels from 21.9% to 26.9%. The AA profiles were pre-set tocontain the ideal ratio of EAA relative to digestible Lys (4.8% CP). Results at 21 days depicted an increasein BWG and a reduction in adjusted FCR, in response to increasing levels of CP at the lowest ME level(12.55 MJ/kg) as well as to an increase in dietary ME from 12.55 to 12.97 MJ/kg. These responses wereobserved despite the lack of associated changes in FI. Neither BWG nor FCR implied consistency in therelationship between BP and ME leading to the hypothesis that beyond the ME 12.55 MJ/kg, BP elicited aresponse independent of the ME level. The second experiment by Plumstead et al. (2007) examined theresponse elicited by graded inclusion rates of digestible Lys at low and high balanced CP dietary inclusions.BWG at 20 days of age increased linearly with an increase in dietary CP provided the AA profile wasbalanced. Since dietary protein was not shown to influence FI, the improvement in BWG was assumed to bea result of a higher AA intake. It was further proposed that differences in levels of FI in previous studies maybe attributed to differences in formulation techniques, ages of the birds and the range of dietary ME tested. Feed intake showed a positive correlation to dietary BP independently of dietary energy density whenMadsen et al. (2010) examined the effect of graded BP levels (80%, 90%, 100% and 115% of Aviagenrecommendation) at energy levels of 95% and 100% of Aviagen recommendation. Experimental diets wereintroduced from day eleven of the trial. Although FI increased at the lower energy inclusion level, overall energy intake was lower than that observed in the higher energy diet and increasing BP levels resulted indecreased FI at both energy levels. Thus, energy intake was reduced but protein intake was not, as the higherprotein diets were able to fully compensate for the lower FI. Weight gain increased with increasing BPlevels; however, the differences between energy levels became progressively less pronounced as the BP levelincreased. FCR was unfavourable at the lower energy level and improved with increasing BP levels (even atthat above the recommended BP level). 2.3.2.2 Broiler performance Early access to feed and water to newly hatched chicks has been shown to improve BW throughout thegrowing period. This effect was attributed to the stimulation of growth and activity in the digestive tract(Noy & Sklan, 1997). Swatson et al. (2000) tested the hypothesis that improvements in broiler performancetraits seen in response to changes in the energy to protein ratio may be partially attributed to the enhanceddevelopment of the digestive system. The authors observed that diets with varying combinations of ME andprotein levels between 11 and 14 MJ/kg, and 250 and 500 g/kg, respectively, resulted in significant changesobserved in the digestive organs in broilers from 12 to 24 days of age. These involved increases in gizzard,duodenal, pancreatic, caecal and ileal weights, as well as the digesta holding capacity of the gizzard andsmall intestine. Treatments with the highest ME to protein ratios per ME level tested yielded the highestBWG, FI and feed conversion efficiency, with the overall highest BWG and FCR resulting from acombination of 13 MJ/kg and 250 g/kg protein. Direct mechanisms through which changes in the digestiveorgans affected the performance response was not elucidated, rather the increased rate of digestive organdevelopment and its possible impact on protein utilisation efficiency is assumed to be responsible for aproportion of this effect. Research on the interaction between dietary ME and dietary AA on broiler performance and carcasstraits conducted by Cho (2011), revealed a reliance on the ratio of BP to energy in the diet. Dietary ME wasprovided at 11.30,11.85, 12.41 and 12.97 MJ/kg across three ileal digestible Lys levels (between feed phasespecific ranges) throughout the grow-out period. At the highest Lys level, increasing energy content of thediet yielded increasing values for body weight, FE as well as carcass and breast meat yield, despite nosignificant difference observed in FI. This indicated that at higher levels of dietary Lys, higher levels ofdietary energy were required to optimise broiler performance. Intermediate Lys levels were shown to beadequately matched by all ME levels provided, thus no effect of ME could be seen in the measuredresponses. At low levels of dietary Lys, increasing ME resulted in lowered FI, growth rate and body weight,as expected with an increasing imbalance between these dietary components. BWG response to increasingdietary BP to ME ratio beyond the Starter phase has been observed at ME levels of 12.55 MJ/kg and higher,while lower ME levels do not show a significant difference in weight gain. FI also significantly differed between energy levels fed, showing a decreasing trend with increasing dietary ME.Feed conversionimproved with both increasing energy level as well as increasing protein to energy ratio, with betterresponses at moderate to low energy levels. Similar results were found when Liu et al. (2016) fed five dietswith various ME to CP ratios from days seven to 28; diets with low protein concentrations yielded lowerweight gains and FI. The effect of ME to CP ratios on BWG and FCR appeared to be quadratic, indicating aneed for both protein and energy for efficient muscle deposition. This is in agreement with the earlierfindings of Emmans (1987), who theorised that birds eat to meet their requirement of the first limitingnutrient in the feed. Work by Ullah et al. (2012) demonstrated an overall decreasing trend in FI with increasing ME levelsand an increase in FI with increasing Lys levels at the highest ME level, when feeding varying levels of ME(11.51 to 11.92 MJ/kg) and total Lys inclusion rates (1.3% to 1.5%) at a fixed protein level of 21% fromdays 1 to 10 of the production cycle. Birds consuming the diet with the highest ME density and Lys inclusionlevel during the Pre-starter phase had the highest FI in the last three weeks of the production cycle, whichresulted in the most unfavourable FCR. The best FCR was achieved by a combination of 11.92 MJ/kg MEand 1.3% Lys, this FCR value being non-significantly different from that resulting from combinations of11.72 MJ/kg ME and 1.4% Lys, and 11.92 MJ/kg ME and 1.4% Lys. Maximum dressing percentage,digestive tract weight and intestinal length (all having non-significant difference between treatments) as wellas slaughter weight (significantly higher), were also achieved with the combination of 11.92 MJ/kg and 1.4%Lys, the latter of which thought to be correlated with the superior seven day body weight as having resultedfrom said diet. It must be noted that the ME levels tested in the above mentioned studies (Cho, 2001; Ullah etal., 2012) were below the recommended levels as specified by both the NRC (1994) and Aviagen. 2.3.2.3 Carcass composition Along with a higher final body weight, growth rate and improved FCR, genetic selection of themodern broiler has also resulted in a higher fat deposition potential (Baeza & Le Bihan- Duval, 2013).Comparisons were done between the carcass yield and composition of broilers as reared in 1970 (ARBCstrain) versus“modern broilers”(Ross 308), once in 1991 and again in 2001 (Havenstein et al., 1994,2003).The effect of dietary improvement over time was accounted for through the inclusion of both 2001 and 1997diets as levels in the experimental design, and was confirmed with Ross 308 birds having had 25-33%heavier carcasses on the 2001 diet than on the 1970 diet. In contrast, ARBC bird BW improved only by 12-13% on the 2001 diet, with the implication that the older strain did not have the genetic potential to utilisethe improved diet (strain x diet effect). When comparing both strains on the same diets, Ross 308 broilerspresented consistently higher average carcass weights of 535% and 453% of the ARBC carcass weights onthe 2001 and 1970 diets respectively, at 43 days of age. A significant increase in total breast meat yield was also observed when comparing the results of the modern strains across the two experiments, with 2001 birdshaving approximately 6% more breast meat compared to the 1991 strain (ACRBC) despite being only adecade apart. Both studies reflected a lower percentage of body composition comprising of the heart andlungs for the modern strains, as well as relatively higher abdominal fat accretion than that observed for theACRB strain. Of these differences observed between the ACRBC and Ross 308 broiler strains. 85 to 90%may be attributed to genetic selection, with the remaining fraction attributed to the improvement in the diet(Havenstein et al., 2003). Similar results were seen by Zhao et al. (2009) when comparing carcass weight,carcass yield and fat accretion in the Arbor Acres commercial line with that of a Chinese unimproved line(The Beijing-You). It was further noted that performance differences between breeds decreased withdecreasing nutrient density, while carcass quality differences decreased with increased nutrient density. A high fat accretion is associated with an inefficient usage of dietary energy, as it negativelyinfluences carcass yield, consumer acceptability and thus economic return (Emmerson, 1997). Of thenutritional factors that are able to manipulate the degree of fat accretion, energy and protein levels in the diethave been noted as the most effective. A reduction of the energy level in broiler diets from 13.39 to 12.55MJ/kg from 21 to 42 days of age (Kassim & Suwanpradit, 1996b) and from 13.50 to 12.80 MJ/kg from 18 to52 days of age (Rabie & Szilyagi, 1998) resulted in a significant reduction in abdominal fat without anyeffect on other performance traits. Female broilers between 21 and 42 days of age fed diets with significant differences in energy toprotein ratios were shown to influence body composition by altering the rate of fat deposition, withoutaffecting the regulatory heat increment (Macleod, 1990, 1991 and 1992). Linear correlations were seenbetween dietary CP to AME ratios and carcass protein: fat ratios, carcass protein and carcass fat. Results of alater experiment conducted using male broilers confirmed these findings, where the change in the heatincrement between different dietary Lys levels were solely attributed to the resultant change in bodycomposition that was associated with protein and fat accretion (Macleod, 1997). The unchanged heatincrement indicated that the increased energy intake did not result in a higher proportion of energy lostthrough heat, but was rather channelled towards building body components such as fat and protein.Therefore, feed was being efficiently utilised for growth. Increasing dietary AA levels corresponded withincreasing breast meat yield and reduced abdominal fat accretion, with maximal meat yield in response toAA supply resulting from a higher AA to energy ratio. Energy above that required for said meat yield wouldonly be stored as body fat (Lemme et al., 2005). This was illustrated in an earlier experiment by Lemme etal. (2003) where the highest ME level tested (13.18 MJ/kg) resulted in an increase in breast meat yield and adecrease in abdominal fat accretion, proportional to dietary AA, reaching a maximum response at apparentfaecal digestible (AFD) Lys to ME ratio of 8.53 and 8.96 g/MJ, respectively, while decreasing at higher ratios. Body composition can thus be manipulated by changing not only the amounts of dietary energy andprotein, but also by the ratio of protein to energy that is present in the diet. Fan et al. (2008) examined the effect of lowering the dietary ME level from 12.13 to 11.30 MJ/kg inducks between 14 and 42 days of age and found a significant reduction in abdominal fat relative to bodyweight, without any change in breast or leg muscle proportions. It may thus be deduced that by lowering thelevel of dietary ME, the efficiency of dietary energy use may be increased through the reduction of fataccretion. Other studies have also shown that low protein diets increased abdominal and total body fataccretion (Kassim & Suwanpradit, 1996a; Collin et al., 2003), while diets with protein levels above thatrecommended by the NRC resulted in a lower total body fat accretion (Yalcin et al., 2010). Changes indietary ME and protein density in diets from day 11 of the growing period were examined by Madsen et al.(2010) with results indicating that carcass yield was unaffected by the difference in dietary ME levelbetween 95% and 100% of Aviagen recommendation, but responded positively to increasing levels of BPThe lower ME level and higher BP level combination was shown to reduce abdominal fat accretion andincrease breast meat yield implying that current balanced recommendations may not be fully exploiting thegenetic growth potential of the modern broiler. Carcass composition changes noted by Dozier et al. (2007) included a 0.1% increase in breast meatyield with a reduction in ME levels from 13.56 to 13.14 MJ ME/kg, as well as a reduction in abdominal fatpad accretion; breast meat yield was also observed to increase from moderate to high AA density. Reductionof AA density had the opposite effect on breast meat yield and also reduced CP, Lys and total sulphurcontaining AA intake per unit BWG and breast meat yield. The increase in AME levels from 13.47 to 13.85MJ ME/kg, as tested in a separate experiment, reduced carcass yield and elevated abdominal fat accretion.Breast meat yield was improved with increasing dietary AA levels and moderate ME, with high AA densitydiets resulting in a higher carcass yield than diets formulated to moderate levels of both AME and AA. From an individual AA perspective, Met or Lys deficient diets, and diets with Arg levels above theNRC recommendation resulted in increased abdominal fat accretion while increasing levels of Met and Lyswere shown to reduce abdominal fat accretion (Grisoni et al., 1991; Corzo et al., 2003, 2006;Xie et al.,2006; Nasr & Kheiri, 2011). Relative to carcass yield of other muscles, breast meat is significantly reducedby low dietary Lys levels (Tesseraud et al., 1996). High dietary Lys levels in the Starter phase (days 1 to 14of age) in broilers resulted in higher breast meat yield at slaughter weight, but no effect was seen in responseto increased Lys levels from days 15 to 49 (Holsheimer & Ruesink, 1998). Abdominal fat deposition maythus be reduced by increasing dietary Lys and Met levels, and preventing excessive Arg levels throughoutthe growing phase, while investing in increased Lys density in the early growth phase may be remuneratedthrough improvement in breast meat yield at slaughter. Contradictory results were seen when the effect of increased digestible Lys levels across each feedphase in both male and female broilers was investigated by Tavernari et al. (2009). Across all feedingphases, both sexes were fed diets containing 92.5%, 100% and 107.5% of the digestible Lys requirements asstipulated in the Brazilian Tables for Poultry and Swine (Rostagno et al.,2000). No significant differenceswere seen in body compositions with regard to dry matter or fat percentage between the different levels ofdigestible Lys across any of the feed phases, apart from 42 day old females having a lower carcass proteinlevel in the treatment providing the highest digestible Lys. Body fat accretion did not differ significantlybetween treatments and protein deposition response was seen only in seven week old males. The lowestdigestible Lys level resulted in significantly lower protein deposition at six weeks of age, with no significantdifference between 100% and 107.5% of the given requirement levels. At seven weeks of age, 92.5%digestible Lys yielded significantly higher protein deposition than that achieved by 100% of the givenrequirement level (the higher protein inclusion level was not statistically different to the other two levels).Reasons for the lack in response of body composition to dietary Lys levels were attributed to the possibilityof weekly intervals not adequately reflecting the response and the random sampling of just two birds perexperimental unit increasing the coefficients of variation. Similar results were found by other scientists(Summers & Leeson, 1985; Eits et al., 2002), where higher Lys levels in the Starter phase did not reducebody fat accretion. 2.4 Early nutrition for broilers 2.4.1 Pre-starter and Starter diets for broilers The importance of early access to feed for newly hatched chicks has been strongly emphasised by Noy& Sklan (1997). Chicks deprived of feed and water in the first 36 hours post hatch weighed 100-200 g lessthan chicks given immediate access to feed at forty days of age. Lilburn (1998) suggested that the primaryobjective of the Pre-starter diet be to optimise the metabolic homeostasis of the flock, following which a dietto optimise maintenance and production be introduced. According to the Aviagen Ross 308 manual (2014), broilers expected to reach a target weight less than2.5 kg should be fed following a three-phase feeding programme: Starter from days zero to 10; Grower fromdays 11 to 24; Finisher 1 from days 25 to 39 and Finisher 2 from day 40 to slaughter. The recommendedenergy level for the Starter phase is 12.55 MJ/kg, at crude protein (CP) level of 23%. Individual amino acids(AA) as recommended by Aviagen (2014) are shown in Table 2.2. Also depicted are the NRC (1994)recommendations for “meat type chickens" which are split into similar feeding phases (only one Finisherdiet), with slightly different time periods of zero to three weeks, three to six weeks and six to eight weeks.The energy level for the phase is somewhat higher relative to the Aviagen recommendations, at 13.39 MJME/kg, while the CP level recommendation remains the same at 23%. Table 2.2 Amino acid recommendations (as % of diet) for meat type chickens from 0 to 3 weeks (adaptedfrom NRC, 1994 and Aviagen Ross 308 broiler manual, 2014) NRC 1994 Aviagen 2014 Amino acids Total Total Digestible Arginine 1.25 1.52 1.37 Isoleucine 0.80 0.97 0.86 Leucine 1.20 1.58 1.41 Lysine 1.10 1.44 1.28 Methionine +Cysteine 0.90 1.08 1.95 Methionine 0.50 0.56 0.51 Threonine 0.80 0.97 0.86 Tryptophan 0.20 0.23 0.20 Valine 0.90 1.10 0.96 Nutrient recommendations for the Starter phase are heavily based on research conducted on broilersbetween seven and 21 days of age, thus completely disregarding the influence of yolk absorption as well asthe progressive development of the digestive tract in the post hatch period (Garcia, 2006). An alternativefeed phase programme includes a Pre-starter phase that is fed from placement of chicks until a predeterminedage, with the Starter phase commencing thereafter (Ullah et al., 2012). Benefits of a Pre-starter phase includeimproved flock uniformity, higher growth rates within the first seven days of age and higher livabilitythroughout the production cycle (Garcia, 2006). Given the limited FI potential of the young chick, a morenutrient dense diet such as the Pre-starter could positively impact the overall production cycle. 2.4.2 Phase-specific and carryover effects of increased dietary balanced protein levels Having seen an improvement in response to dietary protein in feed phases that were preceded byprotein deficient diets (Pesti & Fletcher, 1984; Kidd et al., 1998; Eits et al., 2003), the effect of adequatedietary protein levels (Schutte, 1996) were tested against higher levels in the Starter, Grower and/or Finisherphases (Wijtten et al., 2004a). Increased BP levels in the Starter increased BWG and feed conversionefficiency of that phase, and also resulted in increased BWG and FI in the subsequent Grower phase andcontinued across the entire growing period. Additional effects of increased BP in the Starter phase that wasobserved in the second experiment included a lower magnitude of the response in BWG and feed conversionratio (FCR) to increased BP levels in the subsequent Grower phase. Despite a higher BWG resulting fromthe high BP Grower following an adequate BP Starter (compensatory growth), BW was still lower than thatresulting from the high BP Grower following the high BP Starter. This indicated the significance of theincreased BP level in the Starter on broiler performance beyond the Starter phase. Increased BP levels in the Finisher improved weight gain and feed conversion efficiency in theFinisher phase until slaughter. Carryover effects similar to those observed between BP levels in Starter andGrower phases resulted between Grower and Finisher phases, where high BP levels in the Grower resulted ina diminished response of BWG and FCR to high BP levels in the Finisher phase. Although these findingwere not statistically significant, they were consistent between experiments conducted and with results notedin previous experiments (Pesti & Fletcher, 1984). This reduction in feed efficiency may be explained by acompensatory increase in fat deposition in the Finisher phase (Gous et al., 1992) and an increasedmaintenance requirement due to the higher BW resulting from the Grower phase. Changes in carcasscomposition in response to the increase BP levels in all feeding phases were noted, namely a non-significantincrease in breast meat yield and reduction of abdominal fat deposition in the Starter phase, higher breastmeat yield and lower abdominal fat accretion persisting in the Grower phase, and a higher breast meat yieldin the Finisher phase. A long term carryover effect from the Starter phase was abdominal fat accretion beingsignificantly lower at slaughter. Increasing the level of BP in the early feed phases may be regarded as aninvestment since the increase in feed cost may well be exceeded by the profit generated through improvedBWG in the subsequent phases of the production cycle (Zubair & Leeson, 1996). Conclusion The period following hatching is crucial to the production cycle as it creates a foundation for laterbroiler performance. BW at seven days has been shown to have a strong, positive correlation with slaughterweight. Much of the improvement in broiler performance resulting from improved nutrition in the earlyfeeding phasess i1sSattributed to enhanced development of the digestive system. Energy and AArecommendations as published by Aviagen and the NRC have often yielded inferior results when testedagainst lower energy and higher AA combinations. The importance of dietary balanced protein has beenhighlighted as a possible alternative to high total protein inclusion rates, for reducing feed cost. An increasein profit may also be realised through correct AA ratios improving broiler performance, as high levels ofideal protein in the early phase of broiler nutrition positively influences performance during later phases. Thelevel of dietary energy has been thought to influence FI, but this does not always hold true. It has beenhypothesised that broilers consume feed at a level so as to maintain energy or AA intake, depending onwhich is first limiting. The ratio at which protein and energy are present in a diet has also been shown toaffect broiler performance, especially in terms of BWG, FE, breast meat yield and fat accretion. Carcasscomposition changes observed in response to nutrition include a decrease in fat accretion and an increase inbreast meat yield with decreasing energy and increasing AA levels. Responses of broilers to altered dietaryenergy and protein content may differ according to the sex, age and physical feed characteristics amongstother factors. Chapter 3Material and Methods 3.1 Experimental design This trial was conducted at the Daybreak Trial facilities in Sundra (South Africa). The trial house wasdivided into four blocks, each containing 12 pens, with one replication per treatment per block. There was atotal of 12 treatments, comprising of a randomised block design with three levels of metabolisable energy(ME) and four levels of total lysine (TLys). Combinations of four TLys treatments and three ME levels wererandomly allocated to each block. The variables analysed were BW, BWG, FI, FCR, performance efficiencyfactor (PEF) and mortality.These were respectively calculated from the following measurements: birdcounts, initial body weight, body weights, feed weighed in and feed weighed out and mortality records. Therelevant measurements were conducted on days zero, three, seven, 10, 14, 21, 28 and 35 of the trial, withcorrections being done for mortality at every weighing interval. 3.2 Animal husbandry Ross 308 chicks were randomly selected, counted into groups of 60, weighed and placed into pens atday zero. Chicks were placed as-hatched at a stocking density of 20 birds per square metre simulatecommercial production systems. Birds were provided with feed and water ad libitum throughout the trial.Temperature and lighting adhered to the profiles as seen in appendices I and II, respectively. Tunnelventilation was utilised, as was artificial lighting for light periods that extended beyond daylight hours.Vaccinations were administered through drinking water for Newcastle disease (on days 12 and 18 of thetrial) and infectious bronchitis (on day 12 of the trial). Dead birds were collected twice daily, and theircarcass weights recorded. Ethical approval was sanctioned by the ethics committee of the Faculty of Naturaland Agricultural Sciences, University of Pretoria, with the reference number EC160331-010. 3.3 Experimental diets Experimental diets were fed from days zero to 21, where after all birds were fed the same controldiets. Grower was fed from days 22 till 27, Finisher was fed from days 28 till 30 and Post-finisher was fedfrom days 31 till 35. All feed was produced at a commercial feed mill (AFGRI Animal Feeds, Isando, SouthAfrica). The ME and TLys concentrations as well as ME:TLys are provided in Table 3.1. Formulated rawmaterial and nutrient compositions (%) of experimental diets are listed in Table 3.2 and Table 3.3,respectively. Analysed nutrient composition (%) of experimental diets may be viewed in Table 3.4. Formulated and analysed total amino acid composition (%) of experimental diets is listed in Table 3.5 andTable 3.6, respectively. Chemical analysis of feed samples was conducted at Labworld (Philafrica Feeds, Isando, SouthAfrica). Moisture determination based on the AOAC official method 44 15-A (AOAC,1999) was conductedby comparing before and after weights of samples dried for 24 hours in an oven at 100C. These values wereused to calculate dry matter content by subtracting the moisture content from 100%. Protein analysis basedon the AOAC official method 992.23 (AOAC, 2000), was conducted using aa(Gerhardt Dumathermn(AESolutions, Centurion, South Africa) which determined the sample nitrogen content which was thenmultiplied by a factor of 6.25% to calculate the protein content. Crude fat analysis was based on the AOACofficial method 954.02 (AOAC, 2000), whereby crude fat content was determined by heat extraction of thesample submerged in petroleum ether using a Gerhardt Soxhlet(AE Solutions, Centurion, South Africa).Crude fibre analysis was based on the AOAC official method 978.10 (AOAC, 2000), whereby the crudefibre content was determined using aCGerhardt Fibrethermprogramme (AE Solutions, Centurion, SouthAfrica), which was followed by ashing of the sample. Ash content was determined based on the AOACofficial method 942.05 (AOAC, 2000), by ashing samples 550℃ for six hours. Calcium and phosphoruscontents were determined by using a Gerhardt Skalar digestion process, (AE Solutions, Centurion, SouthAfrica) with analysis based on the AOAC official method 976.06 (AOAC, 2000). Sodium and potassiumcontents were determined by absorption emission spectrometry based on an in-house method. This consistedof samples being ashed at 500℃ for five hours before undergoing digestion with 32% hydrochloric acid on aheated digestion block until completely dry. Digested samples were then dissoluted with 1M hydrochloricacid and analysed on the Shimadzu AA-7000 (Shimadzu, Roodepoort, South Africa). Starch content wasdetermined using spectrophotometric analysis on the ShimadzuUV-1800 (Shimadzu, Roodepoort, SouthAfrica). with analysis based on the AOAC official method 996.11 (AOAC, 2000). Amino acids wereanalysed using high performance liquid chromatography (HPLC) at AMINOLab (Evonik Industries, Essen,Germany). Table 3.1 Formulated metabolisable energy (ME) and total lysine (TLys) levels and TLys:ME ofexperimental diets that were fed to broilers from 0 to 21 days of age TREATMENT COMBINATION ME (MJ/kg) TLys (%) TLys:ME 1 11.30 0.12 2 12.13 1.3 0.11 3 12.97 0.10 4 11.30 1.4 0.12 5 12.13 0.12 6 12.97 0.11 7 11.30 0.14 8 12.13 1.6 0.13 9 12.97 0.12 10 11.30 1.7 0.15 11 12.13 0.14 12 12.97 0.13 Table 3.2 Formulated raw material composition (%) of experimental diets T1 T2 T3 T4 T5 T6 T7 T8 T9 T10 T11 T12 Yellow maize 55.02 57.69 54.97 51.53 53.38 52.62 40.66 44.98 40.62 39.92 43.88 39.98 Soya oilcake meal 28.70 32.50 32.65 32.40 33.50 31.05 29.25 28.55 29.25 28.05 27.30 28.50 Sunflower oilcake 5.00 0.00 0.00 5.00 3.85 0.00 5.00 5.00 5.00 5.00 5.00 5.00 Full fat soya 0.00 0.00 0.00 0.00 0.00 0.00 10.00 10.00 10.00 9.75 10.00 8.95 Fishmeal 0.00 0.00 0.00 0.00 0.00 3.60 1.00 1.00 1.00 4.55 4.65 4.65 Full fat maize germ 0.00 3.00 5.00 0.00 3.00 1.25 0.00 0.00 0.00 0.00 0.00 0.00 Wheat bran 5.00 2.55 0.00 5.00 0.00 0.00 0.00 0.00 0.00 0.00 0.00 0.00 White gluten 0.00 0.00 0.75 0.88 1.20 5.00 5.00 5.00 5.00 5.00 5.00 5.00 Soya oil (mixer) 0.00 0.00 2.35 0.00 0.78 1.50 0.50 1.30 2.48 0.00 0.83 2.29 Soya oil (coater) 0.00 0.00 0.00 0.00 0.00 1.50 0.00 0.00 2.48 0.00 0.00 2.29 Limestone 1.60 1.60 1.60 1.60 1.58 1.43 1.55 1.55 1.55 1.35 1.35 1.35 Mono di-calcium phosphate 1.10 1.13 1.15 1.03 1.08 0.73 0.95 0.95 0.95 0.50 0.48 0.48 Fine salt 0.26 0.27 0.27 0.25 0.25 0.19 0.23 0.22 0.23 0.14 0.13 0.14 Sodium bicarbonate 0.29 0.26 0.26 0.30 0.29 0.28 0.30 0.31 0.30 0.33 0.34 0.33 L-Lysine HC1 99% feed grade 0.35 0.29 0.30 0.38 0.37 0.27 0.41 0.42 0.41 0.35 0.36 0.35 DL-Methionine 99% feed grade 0.25 0.25 0.25 0.27 0.27 0.18 0.28 0.27 0.28 0.27 0.26 0.27 L-Threonine 98.5% feed grade 0.05 0.04 0.04 0.06 0.05 0.00 0.04 0.03 0.04 0.03 0.03 0.03 Choline chloride 0.05 0.05 0.05 0.05 0.05 0.05 0.05 0.05 0.05 0.05 0.05 0.05 PLT 1 Aviax + Olaquindox 0.27 0.27 0.27 0.27 0.27 0.27 0.27 0.27 0.27 0.27 0.27 0.27 AXTRA PHY 1000 TPT Broilers 0.10 0.10 0.10 0.10 0.10 0.10 0.10 0.10 0.10 0.10 0.10 0.10 Sand (as filler) 1.97 0.00 0.00 0.90 0.00 0.00 4.42 0.00 0.00 4.35 0.00 0.00 Table 3.3 Formulated nutrient composition (%) of experimental diets T1 T2 T3 T4 T5 T6 T7 T8 T9 T10 T11 T12 Volume 100.00 100.00 100.00 100.00 100.00 100.00 100.00 100.00 100.00 100.00 100.00 100.00 Moisture 10.85 10.95 10.55 11.00 10.77 10.66 10.19 10.61 10.28 10.22 10.61 10.30 Crude protein 20.80 20.90 21.02 22.80 22.78 24.66 26.63 26.68 26.63 28.14 28.29 28.11 Crude fat 2.86 4.21 7.29 2.83 4.88 6.60 4.74 5.67 9.10 4.52 5.52 8.89 Crude fibre 3.98 3.08 2.98 4.08 3.75 2.76 4.15 4.22 4.15 4.07 4.14 4.03 Ash 5.96 5.84 5.76 6.09 5.93 5.73 6.22 6.22 6.22 6.06 6.07 6.04 Calcium 1.05 1.05 1.05 1.05 1.05 1.06 1.06 1.06 1.06 1.05 1.05 1.05 Phosphorus (total) 0.67 0.64 0.63 0.68 0.65 0.62 0.67 0.68 0.67 0.66 0.67 0.66 Potassium 1.03 1.07 1.07 1.11 1.11 1.01 1.11 1.11 1.11 1.11 1.11 1.11 Sodium 0.22 0.22 0.22 0.22 0.22 0.22 0.22 0.22 0.22 0.22 0.22 0.22 Metabolisable energy (MJ/kg) 11.56 12.44 13.28 11.59 12.48 13.25 11.57 12.39 13.18 11.57 12.40 13.20 Table 3.4 Analysed nutrient composition (%) of experimental diets T1 T2 T3 T4 T5 T6 T7 T8 T9 T10 T11 T12 Moisture 8.80 8.79 8.46 8.73 8.63 8.61 8.19 8.25 8.35 8.56 8.54 8.52 Dry matter content 91.20 91.21 91.54 91.27 91.37 91.39 91.81 91.75 91.65 91.44 91.46 91.48 Protein 21.09 21.90 21.64 23.06 23.26 25.10 26.79 27.54 26.61 29.20 29.51 28.57 Fat 3.28 4.89 7.62 3.43 5.67 6.57 4.89 5.59 9.29 5.06 5.16 8.64 Fibre 3.11 2.69 3.14 2.29 2.76 2.07 3.33 3.64 3.16 3.49 3.52 4.20 Ash 6.88 5.00 5.11 6.32 5.32 4.85 9.23 5.52 5.33 8.49 5.32 5.10 Calcium 0.86 0.86 0.82 0.93 0.95 0.82 1.02 0.93 0.86 0.86 0.86 0.88 Phosphate 0.65 0.64 0.66 0.59 0.64 0.62 0.66 0.62 0.65 0.54 0.64 0.64 Potassium 0.88 0.88 0.86 0.94 0.92 0.84 1.00 0.98 0.94 0.98 0.99 0.97 Sodium 0.19 0.20 0.20 0.22 0.20 0.23 0.22 0.20 0.23 0.26 0.23 0.22 Starch 37.15 38.21 35.53 37.83 34.78 34.12 28.20 30.82 27.61 27.53 28.99 27.77 Table 3.5 Formulated total amino acid composition (%) of experimental diets T1 T2 T3 T4 T5 T6 T7 T8 T9 T10 T11 T12 Lysine 1.31 1.31 1.31 1.44 1.43 1.44 1.63 1.63 1.63 1.72 1.72 1.71 Methionine 0.57 0.57 0.57 0.63 0.63 0.62 0.71 0.71 0.71 0.76 0.76 0.76 Methionine + Serine 0.92 0.92 0.92 1.00 1.00 1.01 1.14 1.14 1.14 1.19 1.20 1.19 Threonine 0.82 0.82 0.82 0.90 0.89 0.92 1.02 1.02 1.02 1.08 1.09 1.08 Tryptophan 0.23 0.23 0.23 0.26 0.25 0.26 0.29 0.29 0.29 0.30 0.30 0.30 Arginine 1.38 1.36 1.35 1.50 1.48 1.50 1.69 1.69 1.69 1.78 1.78 1.78 Isoleucine 0.85 0.87 0.88 0.94 0.95 1.03 1.13 1.12 1.13 1.19 1.19 1.19 Valine 0.97 0.98 0.98 1.07 1.06 1.16 1.25 1.25 1.25 1.32 1.33 1.32 Leucine 1.73 1.80 1.86 1.92 1.98 2.36 2.42 2.44 2.42 2.53 2.56 2.53 Histidine 0.56 0.57 0.57 0.61 0.61 0.65 0.69 0.69 0.69 0.73 0.73 0.73 Serine 1.01 1.04 1.05 1.11 1.12 1.22 1.32 1.32 1.32 1.37 1.38 1.37 Glycine 0.88 0.86 0.85 0.96 0.94 1.02 1.09 1.09 1.09 1.21 1.21 1.21 Glycine + Serine 1.89 1.89 1.90 2.07 2.06 2.24 2.41 2.41 2.41 2.58 2.59 2.58 Phenylalanine 1.00 1.02 1.04 1.11 1.12 1.24 1.34 1.34 1.34 1.39 1.40 1.39 Tyrosine 0.72 0.75 0.77 0.80 0.82 0.93 0.99 0.99 0.99 1.03 1.04 1.03 Alanine 1.04 1.06 1.09 1.14 1.16 1.40 1.41 1.43 1.41 1.52 1.54 1.52 Asparagine 2.04 2.08 2.09 2.25 2.26 2.36 2.61 2.60 2.61 2.75 2.75 2.74 Glutamine 3.69 3.69 3.73 4.07 4.06 4.39 4.81 4.82 4.81 4.98 5.00 4.97 Proline 1.21 1.25 1.27 1.32 1.34 1.54 1.58 1.60 1.58 1.64 1.67 1.64 Table 3.6 Analysed amino acid composition (%) of experimental diets T1 T2 T3 T4 T5 T6 T7 T8 T9 T10 T11 T12 Lysine 1.34 1.37 1.36 1.57 1.57 1.47 1.65 1.69 1.68 1.88 1.82 1.79 Methionine 0.49 0.54 0.53 0.61 0.58 0.56 0.64 0.65 0.64 0.72 0.72 0.72 Threonine 0.83 0.83 0.83 0.90 0.93 0.91 1.02 1.02 1.02 1.14 1.10 1.11 Tryptophan 0.27 0.26 0.27 0.28 0.29 0.29 0.31 0.31 0.32 0.35 0.34 0.34 Arginine 1.52 1.49 1.50 1.60 1.67 1.58 1.82 1.81 1.79 1.98 1.88 1.91 Isoleucine 0.90 0.89 0.90 0.98 1.00 1.04 1.15 1.12 1.12 1.27 1.22 1.25 Valine 1.02 1.00 1.02 1.09 1.12 1.18 1.28 1.26 1.25 1.39 1.35 1.38 Leucine 1.82 1.87 1.88 2.05 2.06 2.39 2.49 2.47 2.47 2.64 2.57 2.61 Histidine 0.57 0.57 0.58 0.61 0.63 0.63 0.69 0.68 0.67 0.74 0.71 0.72 Serine 1.09 1.09 1.11 1.18 1.21 1.25 1.37 1.38 1.36 1.47 1.40 1.42 Glycine 0.91 0.87 0.89 0.93 0.99 1.00 1.11 1.10 1.08 1.25 1.20 1.21 Phenylalanine 1.11 1.09 1.12 1.20 1.22 1.31 1.43 1.40 1.42 1.54 1.49 1.52 Alanine 1.08 1.10 1.12 1.19 1.21 1.41 1.44 1.44 1.43 1.57 1.54 1.55 Asparagine 2.19 2.20 2.20 2.38 2.43 2.41 2.71 2.68 2.66 2.93 2.81 2.85 Glutamine 4.03 3.94 3.98 4.28 4.42 4.58 5.10 5.06 5.04 5.40 5.16 5.24 Proline 1.24 1.27 1.27 1.37 1.34 1.49 1.58 1.59 1.59 1.71 1.60 1.67 3.4 Broiler performance measurements At the outset of the trial, two feeders and one feed storage bin were allocated to each pen. Thesewere clearly labelled with the corresponding pen number and their weights recorded, before beingallocated 50 kg trial feed per pen. These empty feeder and bin weights were then subtracted from totalfeeder (with feed) and bin (with feed) weights to calculate the residual feed at each weighing interval (ondays three, seven, 10, 14,21, 28 and 35). By subtracting residual feed weight from initial feed weight,feed intake was calculated per pen. The same principle was applied to calculate feed intake for theGrower, Finisher and Post-finisher feeds in the carry-over period of the trial. Bird counts were conducted at each weighing interval by manually transferring live birds into acrate (the weight of which was already tared on the scale). Dead birds were collected, counted andweighed daily with records being taken for each pen. These values were used to verify correct birdcounts on weighing intervals. Crates containing all birds per pen were then weighed and this value wasdivided by the bird count to calculate the average bird weight per pen. Using these measured values of average bird weight, feed intake and mortality rate, the followingperformance objectives were calculated based on the recommendations of Aviagen (2015): BWG was calculated by subtracting the previous measured BW from the BW at the current weighinginterval. FI (Fkg)CR was calculated using the formulaBWG (kg) Liveability was calculated by subtracting mortality (%) from 100. Liveability (%)×BW(kg)PEF was calculated using the formula×100Age (d)×FCR (kg feed per kg gain) 3.5 Carcass analysis In an effort to eliminate the effect of sex on carcass composition differences, only male birds wereevaluated in this trial. Following the weighing procedure on day 21, two birds were randomly selected fromeach pen. They were individually weighed and had neck tags inserted. These birds were then transported toan abattoir situated on the Hillcrest Experimental Farm (University of Pretoria, South Africa), where theywere electrically stunned and exsanguinated by incision to the carotid artery and jugular veins. Carcasseswere then de-feathered in an automated instrument that applied the principle of a tumbling motion whichcaused feathers to come loose and separate from the carcass. These carcasses were then manually evisceratedbefore being packaged and frozen. Once completely frozen, carcasses were minced using an electric mincer and re-frozen before freeze drying (Nutrilab, University of Pretoria). Dried samples were then analysed forfat and protein content (Labworld, Philafrica Feeds, Isando, South Africa) with results reported as apercentage of sample weight. Carcass moisture was determined using an in-house method of calculating the weight difference ofsamples before and after freeze drying. Carcass fat was analysed on AOAC official method 992.06 (AOAC,2000), by first digesting samples with hydrochloric acid at high temperatures (acid hydrolysis) using aHydrotherm (AE Solutions, Centurion, South Africa) and thereafter conducting crude fat extractionof the digested samples (heat extraction of the sample submerged in petroleum ether using aGerhardtSoxhlet(AE Solutions, Centurion, South Africa). Protein analysis was conducted based on AOAC officialmethod 992.23 (AOAC, 2000), using a Gerhardt Dumatherm (AE Solutions, Centurion, South Africa), whichdetermined the sample nitrogen content which was then multiplied by a factor of 6.25% to calculate proteincontent. 3.6 Statistical analysis The GLM model was applied to analyse data for average effects throughout the duration of the trial,with data having been treated asairandomised block design (Statistical Analysis Systems, 2016).Measurements recorded at days three, seven, 10, 14, 21, 28 and 35 were analysed using Repeated MeasuresAnalysis of Variance with the GLM model (Statistical Analysis Systems, 2016). The Fischer’s test (Samuels,1989) was used to determine the significance of difference (P <0.05) between calculated means and standarddeviations. Equation of the linear model applied: Where Y is the variable of interest u is the overall population mean L is the effect of the i level (ME) T is the effect of the jthtreatment (TLys) B is the effect of the kth block LT is effect of the i x j interaction (TLys xME) And e is the error associated with each Y Chapter 4 Results The following tables contain the main effects of treatment (TLys) and level (ME), as well as the interactionbetween treatment and level for the different dependent variables at different intervals in the trial. Blockswere not significant in any of the analysis and thus excluded in the result report. 4.1 Body weight Results for body weight of broilers according to weighing intervals are shown below in Tables 4.1.1 to4.1.8. Table 4.1.1 The effect of varying ME:TLys on body weight (g) of broilers at 0 days ofage (± standard error of the mean) Metabolis able Energy (MJ/kg) Total Lysine (g/kg) 11,3 12,13 12,97 Mean 1,3 43.87(±0.4154)12 44.17(±0.4154) 44.17(±0.4154) 44.07(±0.2398) 1,4 43.36(±0.4856) 43.63(±0.4154) 43.91(±0.4154) 43.63(±0.2541) 1,6 44.75(±0.4154)1 43.94(±0.4154) 44.19(±0.4856) 44.29(±0.2541) 1,7 43.29(±0.4154) 44.21(±0.4154) 43.63(±0.4154) 43.71(±0.2398) Mean 43.82(±0.217) 43.99(±0.2077) 43.97(±0.217) ,Means within the same column with no common superscript differ significantly (P<0.05) Table 4.1.2 The effect of varying ME:TLys on body weight (g) of broilers at 3 days ofage (± standard error of the mean) Metabolis able Energy (MJ/kg) Total Lysine (g/kg) 11,3 12,13 12,97 Mean 1,3 83.50(±1.099)62 82.54(±1.099)62 88.46(±1.099)a 84.83(±0.6347) 1,4 88.23(±1.285)1 87.12(±1.099)1 88.86(±1.099) 88.07(±0.6723) 1,6 86.63(±1.099)12 88.84(±1.099)1 89.85(±1.285) 88.44(±0.6723)1 1,7 89.54(±1.099)a1 86.08(±1.099)61 87.54(±1.099)ab 87.72(±0.6347)1 Mean 86.97(±0.5743)a 86.15(±0.5496)a 88.68(±0.5743)' a.b Means within the same row with no common superscript differ significantly (P<0.05) ( 1 .2 Means within the same column with no common superscript differ significantly (P<0.05) ) Table 4.1.3 The effect of varying ME:TLys on body weight (g) of broilers at 7 days ofage (± standard error of the mean) Metabolis able Energy (MJ/kg) Total Lysine (g/kg) 11,3 12,13 12,97 Mean 1,3 162.3(±3.081)b3 155.1(±3.081)b3 184.3(±3.081)2 167.2(±1.779)2 1,4 192.4(±3.602)ab1 185.5(±3.081)b2 197.2(±3.081)1 191.7(±1.884)1 1,6 177.5(±3.081)62 195.0(±3.081)1 193.9(±3.602)a12 188.8(±1.884)1 1,7 187.1(±3.081)1 193.3(±3.081)12 195.0(±3.081)1 191.8(±1.779)1 Mean 179.8(±1.610)” 182.2(±1.541)” 192.6(±1.610)a , Means within the same row with no common superscript differ significantly (P<0.05) -Means within the same column with no common superscript differ significantly (P<0.05) Table 4.1.4 The effect of varying ME:TLys on body weight (g) of broilers at 10 days ofage (±standard error ofthe mean) Metabolis able Energy (MJ/kg) Total Lysine (g/kg) 11,3 12,13 12,97 Mean 1,3 228.0(±3.878)b3 216.9(±3.878)b3 267.8(±3.878)a2 237.6(±2.239)3 1,4 273.6(±4.534)b1 268.1(±3.878)62 286.5(±3.878)a1 276.1(±2.372)12 1,6 247.7(±3.878)62 281.0(±3.878)a1 281.7(±4.534)a1 270.2(±2.372)2 1,7 277.7(±3.878)1 281.9(±3.878)1 284.1(±3.878)1 281.2(±2.239)1 Mean 256.7(±2.026) 262.0(±1.939)” 280.0(±2.026)a , Means within the same row with no common superscript differ significantly (P<0.05) Means within the same column with no common superscript differ significantly (P<0.05) Table 4.1.5 The effect of varying ME:TLys on body weight (g) of broilers at 14 days ofage (± standard error ofthe mean) Metabolis able Energy (MJ/kg) Total Lysine (g/kg) 11,3 12,13 12,97 Mean 1,3 327.7(±5.895)b3 361.54(±5.895)b3 451.7(±5.895)a2 395.3(±3.403)4 1,4 459.6(±6.891)b1 451.0(±5.895)b2 485.8(±5.895)a1 465.5(±3.605)2 1,6 406.7(±5.895)b2 472.9(±5.895)a1 476.5(±6.891)1 452.0(±3.605)3 1,7 475.0(±5.895)1 477.2(±5.895)1 484.3(±5.895)1 478.8(±3.403)1 Mean 428.5(±3.080)° 440.7(±2.947)” 474.6(±3.080)a Means within the same row with no common superscript differ significantly (P<0.05) Means within the same column with no common superscript differ significantly (P<0.05) Table 4.1.6 The effect of varying ME:TLys on body weight (g) of broilers at 21 days ofage (±standard error ofthe mean) Metabolis able Energy (MJ/kg) Total Lysine (g/kg) 11,3 12,13 12,97 Mean 1,3 718.5(±27.20)b2 705.6(±27.20)62 881.4(±27.20)a 768.5(±15.70)2 1,4 876.4(±31.79)1 900.3(±27.20)1 931.4(±27.20) 902.7(±16.63)1 1,6 786.0(±27.20)b23 919.8(±27.20)a1 910.0(±31.79)a 871.9(±16.63)1 1,7 817.8(±27.20)b12 924.5(±27.20)a1 928.7(±27.20)a 890.3(±15.70)1 Mean 799.6(±14.21)° 862.6(±13.60)” 912.9(±14.21)a Means within the same row with no common superscript differ significantly (P<0.05) 1-3 Means within the same column with no common superscript differ significantly (P<0.05) Table 4.1.7 The effect of varying ME:TLys on body weight (g) of broilers at 28 days ofage (±standard error of the mean) Metabolis able Energy (MJ/kg) Total Lysine (g/kg) 11,3 12,13 12,97 Mean 1,3 1267(±18.44)b4 1269(±18.44)b2 1466(±18.44)a2 1334(±10.65)3 1,4 1451(±21.56)b2 1481(±18.44)ab1 1530(±18.44)a1 1487(±11.28)2 1,6 1350(±18.44)b3 1531(±18.44)a1 1511(±21.56)a12 1464(±11.28) 1,7 1511(±18.44)1 1531(±18.44)1 1547(±18.44)1 1530(±10.65)1 Mean 1395(±9.635)C 1453(±9.221)” 1514(±9.635)a Means within the same row with no common superscript differ significantly (P<0.05) 1-4Means within the same column with no common superscript differ significantly (P<0.05) Table 4.1.8 The effect of varying ME:TLys on body weight (g) of broilers at 35 days ofage ± standard error of the mean) Metabolis able Energy (MJ/kg) Total Lysine (g/kg) 11,3 12,13 12,97 Mean 1,3 1846(±26.60)b3 1880(±26.60)b2 2058(±26.60)22 1928(±15.36)3 1,4 2066(±31.10)1 2089(±26.60)1 2141(±26.60)1 2099(±16.27)1 1,6 1939(±26.60)62 2096(±26.60)1 2038(±31.10)a2 2025(±16.27)“ 1,7 2109(±26.60)1 2135(±26.60)1 2135(±26.60)1 2127(±15.36) Mean 1990(±13.90)° 2050(±13.30) 2093(±13.90) Means within the same row with no common superscript differ significantly (P<0.05) 1-3 Means within the same column with no common superscript differ significantly (P<0.05) No differences were observed between treatments for body weight (BW) at day zero, with theexception of TLys1.6 at ME 11.3, which was slightly heavier at the start of the trial. BW remained highest atME 12.97 throughout the trial when broilers were fed the lowest TLys level (TLys1.3). Upon increasingTLys levels to TLys1.4, BW was highest at ME 12.97. This effect persisted from days three to 14, followingwhich no differences were observed between ME levels. Improved BW was seen in response to increasingME levels from ME 11.30 to ME 12.13 at both TLys1.6 and TLys1.7. Carryover effects resulted only fromTLys1.6 with BW being highest at the termination of the trial (day 35). At ME 11.30, BW increased fromTLys1.3 to TLys1.4 from days three to 21, and increased with each TLys level on days 28 and 35. Similarly,BW increased from TLys1.3 to TLys1.4 from days three to 35, and further increased from TLys1.4 toTLys1.6 from days 7 to 14 at ME 12.13. Carryover effects resulted only at ME 12.97, where BW increasedfrom TLys1.3 to TLys1.4 from days seven to 14 and on days 28 and 35. 4.2 Body weight gain Results for cumulative body weight gain according to weighing intervals are shown below in Tables4.2.1 to 4.2.7. Table 4.2.1 The effect of varying ME:TLys on body weight gain (g) of broilers at 3 days ofage (± standard error ofthe mean) Metabolisable Energy (MJ/kg) Total Lysine (g/kg) 11.3 12.13 12,97 Mean 1,3 13.21(±0.3139)62 12.79(±0.3139)63 14.77(±0.3139)“ 13.59(±0.1812)2 1.4 14.95(±0.3669) 14.50(±0.3139)12 14.99(±0.3139) 14.81(±0.1920)1 1,6 13.96(±0.3139)62 14.97(±0.3139)a1 15.22(±0.3669)& 14.71(±0.1920)1 1,7 15.52(±0.3139)1 13.96(±0.3139)b2 14.64(±0.3139)aD 14.67(±0.1812)1 Mean 14.39(±0.1640) 14.05(±0.1569) 14.90(±0.1640)a a.Means within the same row with no common superscript differ significantly (P<0.05) Means within the same column with no common superscript differ significantly (P<0.05) Table 4.2.2 The effect of varying ME:TLys on body weight gain (g) of broilers at 7 days ofage (±standard error of the mean) Metabolis able Energy (MJ/kg) Total Lysine (g/kg) 11,3 12.13 12,97 Mean 1,3 16.92(±0.4156)b3 15.84(±0.4156)63 20.01(±0.4156)42 17.59(±0.2399)2 1,4 21.30(±0.4858)b1 20.20(±0.4156)62 21.89(±0.4156)1 21.15(±0.2542)1 1,6 18.97(±0.4156)b2 21.58(±0.4156)a1 21.38(±0.4858)a1 20.64(±0.2542)1 1,7 20.54(±0.4156)1 21.29(±0.4156)21 21.63(±0.4156)1 21.15(±0.2399)1 Mean 19.43(±0.2171) 19.74(±0.2078)” 21.23(±0.2171) a, Means within the same row with no common superscript differ significantly (P<0.05) Means within the same column with no common superscript differ significantly (P<0.05) Table 4.2.3 The effect of varying ME:TLys on body weight gain (g) of broilers at 10 days ofage (± standard error ofthe mean) Metabolisable Energy (MJ/kg) Total Lysine (g/kg) 11.3 12,13 12.97 Mean 1,3 21.90(±0.4976)b4 20.61(±0.4976)b3 27.83(±0.4976)22 23.45(±0.2873)4 1.4 27.05(±0.5817)62 27.53(±0.4976)62 29.78(±0.4976)1 28.12(±0.3043)2 1,6 23.39(±0.4976)b3 28.68(±0.4976)a12 29.29(±0.5817)12 27.12(±0.3043)3 1,7 30.21(±0.4976)1 29.56(±0.4976)1 29.68(±0.4976)+ 29.82(±0.2399)1 Mean 25.64(±0.2599)C 26.60(±0.2488)” 29.14(±0.2599)a Means within the same row with no common superscript differ significantly (P<0.05) 4Means within the same column with no common superscript differ significantly (P<0.05) Table 4.2.4 The effect of varying ME:TLys on body weight gain (g) of broilers at 14 days ofage (± standard error ofthe mean) Metabolis able Energy (MJ/kg) Total Lysine (g/kg) 11,3 12.13 12,97 Mean 1,3 30.06(±0.4986)b4 29.49(±0.4986)63 38.21(±0.4986)a2 32.59(±0.2879)4 1,4 36.18(±0.5829)62 37.93(±0.4986)b2 41.24(±0.4986)a1 39.11(±0.3849) 1,6 32.74(±0.4986)b3 39.7(±0.4986)1 40.37(±0.5829)a1 37.60(±0.3849)3 1,7 41.13(±0.4986)1 40.56(±0.4986)1 41.32(±0.4986)+ 41.00(±0.2879)+ Mean 35.52(±0.2605) 32.92(±0.2493)C 40.28(±0.2605)& Means within the same row with no common superscript differ significantly (P<0.05) 1-4 Means within the same column with no common superscript differ significantly (P<0.05) Table 4.2.5 The effect of varying ME:TLys on body weight gain (g) of broilers at 21 days ofage (± standard error of the mean) Metabolisable Energy (MJ/kg) Total Lysine (g/kg) 11.3 12.13 12,97 Mean 1,3 49.39(±3.519)” 49.15(±3.519)62 61.39(±3.519)a 51.31(±2.032) 1.4 59.54(±4.114) 64.19(±3.519)1 63.66(±3.519) 62.46(±2.153)1 1,6 54.19(±3.519) 63.85(±3.519)1 61.93(±4.114) 59.99(±2.153)1 1,7 48.98(±3.519) 63.90(±3.519)a1 63.49(±3.519)《 58.79(±2.032)12 Mean 53.02(±1.839)” 60.27(±1.760)a 62.62(±1.839)& a.Means within the same row with no common superscript differ significantly (P<0.05) Means within the same column with no common superscript differ significantly (P<0.05) Table 4.2.6 The effect of varying ME:TLys on body weight gain (g) of broilers at 28 days ofage (± standard error of the mean) Metabolis able Energy (MJ/kg) Total Lysine (g/kg) 11.3 12.13 12,97 Mean 1,3 78.41(±4.188)2 80.47(±4.188) 83.5(±4.188) 80.79(±2.418)2 1,4 82.07(±4.896)2 82.92(±4.188) 85.56(±4.188) 83.52(±2.562) 1,6 80.63(±4.188)2 87.35(±4.188) 85.84(±4.896) 84.60(±2.562)12 1,7 99.10(±4.188)a1 86.59(±4.188)” 88.35(±4.188)ab 91.34(±2.418)1 Mean 85.05(±2.188) 84.33(±2.094) 85.81(±2.188) a, Means within the same row with no common superscript differ significantly (P<0.05) 1.2 Means within the same column with no common superscript differ significantly (P<0.05) Table 4.2.7 The effect of varying ME:TLys on body weight gain (g) of broilers at 35 days ofage ± standard error ofthe mean) Metabolis able Energy (MJ/kg) Total Lysine (g/kg) 11,3 12,13 12.97 Mean 1,3 82.71(±2.311) 87.35(±2.311) 84.54(±2.311)1 84.86(±1.334)1 1.4 87.90(±2.702) 86.86(±2.311) 87.22(±2.311)1 87.33(±1.414)1 1,6 84.04(±2.311)a 80.75(±2.311)ab 75.37(±2.702)62 80.07(±1.414)2 1,7 85.42(±2.311) 86.35(±2.311) 84.01(±2.311) 85.26(±1.334)1 Mean 85.03(±1.207) 85.33(±1.156) 82.78(±1.207) ab Means within the same row with no common superscript differ significantly (P<0.05) 1.2 Means within the same column with no common superscript differ significantly (P<0.05) Body weight gain (BWG) in broilers was highest at ME 12.97 at TLys1.3 and TLys1.4 throughout theexperimental feeding phase (days 0 to 21). At TLys1.6, BWG increased from ME 11.30 to ME 12.13 fromdays three to 14. This effect persisted up to day 35. A similar effect was observed at TLys1.7, where BWGincreased from ME 11.30 to ME 12.13, with a carryover effect until day 28. At ME 11.30, BWG increasedwith increasing TLys levels from TLys1.3 to TLys1.4 from days three to 14, and from TLys1.4 to TLys1.7on days 10 and 14. On day 28, BWG was highest at TLys1.7. This trend continued at ME 12.13, whereBWG increased with increasing TLys levels within the experimental feeding phase. At ME 12.97, BWGincreased from TLys1.3 to TLys1.4 from days seven to 14 and was lowest at TLys1.6 on day 35. 4.3 Feed intake Results for cumulative feed intake according to weighing intervals are shown below in Tables 4.3.1 to4.3.7. Table 4.3.1 The effect of varying ME:TLys on feed intake (g) of broilers from 0 to 3 days of age (± standard error of the mean) Total Lysine (g/kg) 11,3 12,13 12,97 Mean 1,3 41.71(±1.394) 41.92(±1.394)1 40.29(±1.394) 41.31(±0.8046) 1,4 41.08(±1.629) 37.88(±1.394)2 39.02(±1.394) 39.38(±0.8523) 1,6 41.21(±1.394)a 39.17(±1.394)a12 37.43(±1.629) 39.27(±0.8523) 1,7 40.00(±1.394) 40.29(±1.394)12 37.67(±1.394) 39.32(±0.8046) Mean 41.00(±0.7280) 39.81(±0.6968)ab 38.60(±0.7280)夕 Means within the same row with no common superscript differ significantly (P<0.05) Means within the same column with no common superscript differ significantly (P<0.05) Table 4.3.2 The effect of varying ME:TLys on feed intake (g) of broilers from 0 to 7 days of age (± standard error of the mean) Total Lysine (g/kg) 11,3 12,13 12,97 Mean 1,3 162.1(±4.855) 155.4(±4.855)2 160.9(±4.855) 159.5(±2.803) 1,4 173.0(±5.676) 159.3(±4.855)2 167.6(±4.855) 166.6(±2.970) 1,6 162.3(±4.855)夕 177.9(±4.855)a1 153.0(±5.676)夕 164.4(±2.970) 1,7 164.6(±4.855) 165.1(±4.855)12 161.5(±4.855) 163.8(±2.803) Mean 165.5(±2.536) 164.4(±2.428) 160.8(±2.536) Means within the same row with no common superscript differ significantly (P<0.05) Means within the same column with no common superscript differ significantly (P<0.05) Table 4.3.3 The effect of varying ME:TLys on feed intake (g) of broilers from 0 to 10 days of age (±standard error of the mean) Total Lysine (g/kg) 11,3 12,13 12,97 Mean 1,3 268.7(±5.117)a2 251.7(±5.117)b2 275.5(±5.117)a12 265.3(±2.954) 1,4 290.3(±5.982)1 272.8(±5.117)61 289.0(±5.117)a1 284.1(±3.130)1 1,6 267.2(±5.117) 277.6(±5.117)1 268.8(±5.982)2 271.2(±3.130) 1,7 290.8(±5.117)1 284.8(±5.117)1 279.8(±5.117)12 285.1(±2.954)1 Mean 279.2(±2.673) 271.7(±2.558) 278.3(±2.673) a.b Means within the same row with no common superscript differ significantly (P<0.05) 12 Means within the same column with no common superscript differ significantly (P<0.05) Table 4.3.4 The effect of varying ME:TLys on feed intake (g) of broilers from 0 to 14 days of age (± standard error of the mean) Total Lysine (g/kg) 11,3 12,13 12,97 Mean 1,3 486.2(±10.08)a2 466.1(±10.08)a2 521.8(±10.08)” 491.3(±5.818)3 1,4 546.0(±11.78)1 521.8(±10.08)1 549.5(±10.08) 539.1(±6.163)1 1,6 494.5(±10.08)a2 526.7(±10.08)b1 518.4(±11.78)a 513.2(±6.163)2 1,7 572.0(±10.08)a1 539.2(±10.08)61 528.0(±10.08) 546.4(±5.818)1 Mean 542.7(±5.264)ab 513.4(±5.038)a 529.4(±5.264) , Means within the same row with no common superscript differ significantly (P<0.05) ,Means within the same column with no common superscript differ significantly (P<0.05) Table 4.3.5 The effect of varying ME:TLys on feed intake (g) of broilers from 0 to 21 days of age (±standard error of the mean) Metabolisable Energy (MJ/kg) Total Lysine (g/kg) 11,3 12,13 12,97 Mean 1.3 1052(±20.26)b3 1027(±20.26)63 1178(±20.26)& 1086(±11.70)3 1,4 1209(±23.68)2 1173(±20.26) 1229(±20.26) 1204(±12.39)1 1,6 1107(±20.26)b3 1194(±20.26)a12 1190(±23.68)a 1163(±12.39) 1,7 1279(±20.26)a1 1235(±20.26)ab1 1181(±20.26)b 1231(±11.70) Mean 1162(±10.58)” 1157(±10.13)” 1194(±10.58) . Means within the same row with no common superscript differ significantly (P<0.05) Means within the same column with no common superscript differ significantly (P<0.05) Table 4.3.6 The effect of varying ME:TLys on feed intake (g) of broilers from 0 to 28 days of age (±standard error of the mean) Total Lysine (g/kg) 11,3 12,13 12,97 Mean 1,3 1866(±29.77)63 1862(±29.77)b3 2062(±29.77) 1930(±17.19)4 1,4 2097(±34.80) 2077(±29.77)2 2161(±29.77) 2112(±18.21) 1,6 1964(±29.77)63 2101(±29.77)a12 2106(±34.80)& 2057(±18.21)3 1,7 2231(±29.77)a1 2172(±29.77)ab1 2139(±29.77) 2181(±17.19)1 Mean 2040(±15.55)夕 2053(±14.88) 2117(±15.55)& , Means within the same row with no common superscript differ significantly (P<0.05) -Means within the same column with no common superscript differ significantly (P<0.05) Table 4.3.7 The effect of varying ME:TLys on feed intake (g) of broilers from 0 to 35 days of age ± standard error of the mean) Total Lysine (g/kg) 11,3 12,13 12,97 Mean 1,3 2902(±45.83)62 2912(±45.83)b2 3149(±45.83)a2 2988(±26.46)3 1,4 3234(±53.58)1 3197(±45.83)1 3298(±45.83)1 3243(±28.03)1 1,6 3017(±45.83)b2 3181(±45.83)1 3194(±53.58)a12 3131(±28.03) 1,7 3377(±45.83)1 3310(±45.83)1 3274(±45.83)12 3321(±26.46)1 Mean 3133(±23.94) 3150(±22.91)” 3229(±23.94)& , Means within the same row with no common superscript differ significantly (P<0.05) Means within the same column with no common superscript differ significantly (P<0.05) Feed intake (FI) of broilers was lowest at high ME levels (ME 12.13 and ME 12.97) at TLys1.3 andTLys1.4 from days zero to 14. The highest FI observed at TLys1.4 resulted from ME 12.97, with a persistentcarryover effect. At TLys1.6, FI increased from ME 11.30 to ME 12.13 from day fourteen to 35. In contrast,FI decreased with increasing ME levels at TLys1.7. At ME 11.30, FI increased from TLys1.3 to TLys1.4from days 10 to 35, with a further increase from TLys1.4 to TLys1.7 on days 21 and 28. Similarly, at ME12.13; FI increased from TLys1.3 to TLys1.4 from days 10 to 35, with a further increase from TLys1.4 toTLys1.7 on days 21 and 28. This effect continued at ME 12.97; where FI increased from TLys1.4 to TLys1.6on day 10 and from TLys1.3 to TLys1.4 on day 35. 4.4 Feed conversion ratio Results for cumulative feed conversion ratio according to weighing intervals are shown below fromTables 4.4.1 to 4.4.7. Table 4.4.1 The effect of varying ME:TLys on the feed conversion ratio (kg FI/ kg BWG) of broilers from 0 to 3 days ofage (±standard error of the mean) Metabolis able Energy (MJ/kg) Total Lysine (g/kg) 11,3 12,13 12,97 Mean 1,3 1.053(±0.0391)1 1.093 (±0.0391)a1 0.9100(±0.0391) 1.018(±0.0178)1 1,4 0.9176 (±0.0361)23 0.8710(±0.0391) 0.8683(±0.0391) 0.8856(±0.0189) 1,6 0.9840 (±0.0391)a12 0.8728(±0.0391)02 0.8206(±0.0361)” 0.8925(±0.0189)2 1,7 0.8655 (±0.0391)b3 0.9655(±0.0391)1 0.8578(±0.0391) 0.8963(±0.0178) Mean 0.9594(±0.0162) 0.9504(±0.0155) 0.8642(±0.0162) a.b Means within the same row with no common superscript differ significantly (P<0.05) 1-3 Means within the same column with no common superscript differ significantly (P<0.05) Table 4.4.2 The effect of varying ME:TLys on the feed conversion ratio (kg FI/ kg BWG) of broilers from 0 to 7 days ofage (±standard error of the mean) Metabolis able Energy (MJ/kg) Total Lysine (g/kg) 11,3 12,13 12,97 Mean 1,3 1.371(±0.0288)a1 1.402(±0.0288)a1 1.151(±0.0288)b1 1.308(±0.0166)1 1,4 1.162(±0.0337) 1.123(±0.0288)2 1.093(±0.0288)12 1.126(±0.0176) 1,6 1.233(±0.0288)a2 1.176(±0.0288)a2 1.022(±0.0337)b2 1.140(±0.0176)2 1,7 1.146(±0.0288)2 1.109(±0.0288) 1.066(±0.0288) 1.107(±0.0166) Mean 1.225(±0.0150)& 1.203(±0.0144) 1.083(±0.0150) , Means within the same row with no common superscript differ significantly (P<0.05) ,Means within the same column with no common superscript differ significantly (P<0.05) Table 4.4.3 The effect of varying ME:TLys on the feed conversion ratio (kg FI/kg BWG) of broilers from 0 to 10 days of age (±standard error of the mean) Metabolis able Energy (MJ/kg) Total Lysine (g/kg) 11,3 12,13 12,97 Mean 1.3 1.461(±0.0175)a1 1.459(±0.0175)1 1.234(±0.0175)b1 1.385(±0.0101)1 1,4 1.263(±0.0204)a23 1.216(±0.0175)ab2 1.192(±0.0175)b12 1.223(±0.0107) 1,6 1.317(±0.0175)a2 1.171(±0.0175)ab2 1.131(±0.0204)b3 1.206(±0.0107)2 1,7 1.241(±0.0175)a3 1.199 (±0.0175)ab2 1.163(±0.0175)b23 1.201(±0.0101) Mean 1.320(±0.0091)a 1.261(±0.0087)b 1.180(±0.0091)° Means within the same row with no common superscript differ significantly (P<0.05) Means within the same column with no common superscript differ significantly (P<0.05) Table 4.4.4 The effect of varying ME:TLys on the feed conversion ratio (kg FI/ kg BWG) of broilers from 0 to 14 days ofage (±standard error of the mean) Metabolisable Energy (MJ/kg) Total Lysine (g/kg) 11,3 12,13 12,97 Mean 1,3 1.480(±0.0188)a1 1.471(±0.0188)a1 1.281(±0.0188)b1 1.410(±0.0109)1 1,4 1.313(±0.0220)a2 1.281(±0.0188)ab2 1.244(±0.0188)b1 1.279(±0.0115) 1,6 1.367(±0.0188)a2 1.228(±0.0188)b2 1.199(±0.0220)62 1.264(±0.0115)2 1,7 1.325(±0.0188)a2 1.246(±0.0188)ab2 1.198(±0.0188)b2 1.256(±0.0109)2 Mean 1.371(±0.0098)“ 1.306(±0.0094)' 1.230(±0.0098)C Means within the same row with no common superscript differ significantly (P<0.05) 1.2 Means within the same column with no common superscript differ significantly (P<0.05) Table 4.4.5 The effect of varying ME:TLys on the feed conversion ratio (kg FI/ kg BWG) of broilers from 0 to 21 days ofage (+standard error of the mean) Metabolis able Energy (MJ/kg) Total Lysine (g/kg) 11,3 12,13 12,97 Mean 1,3 1.561(±0.0638)12 1.554(±0.0638)1 1.406(±0.0638) 1.507(±0.0368) 1,4 1.449(±0.0746) 1.370(±0.0638) 1.385(±0.0638) 1.401(±0.0390) 1,6 1.493(±0.0638)² 1.363(±0.0638)2 1.371(±0.0746) 1.409(±0.0390) 1,7 1.715(±0.0638)a1 1.403(±0.0638)b12 1.334(±0.0638)” 1.484(±0.0368) Mean 1.554(±0.0333)& 1.422(±0.0319) 1.374(±0.0333) , Means within the same row with no common superscript differ significantly (P<0.05) ,Means within the same column with no common superscript differ significantly (P<0.05) Table 4.4.6 The effect of varying ME:TLys on the feed conversion ratio (kg FI/kg BWG) of broilers from 0 to 28 days of age (±standard error of the mean) Metabolis able Energy (MJ/kg) Total Lysine (g/kg) 11,3 12,13 12,97 Mean 1.3 1.526(±0.0133)a 1.521(±0.0133)a1 1.450(±0.0133) 1.499(±0.0077)1 1,4 1.490(±0.0156)a 1.446(±0.0133)b23 1.454(±0.0133)ab 1.463(±0.0081) 1,6 1.505(±0.0133) 1.413(±0.0133)63 1.435(±0.0156)” 1.451(±0.0081)2 1,7 1.520(±0.0133)a 1.463(±0.0133)62 1.423(±0.0133)C 1.468(±0.0077) Mean 1.150(±0.0070)° 1.461(±0.0067) 1.440(±0.0070)夕 aMeans within the same row with no common superscript differ significantly (P<0.05) Means within the same column with no common superscript differ significantly (P<0.05) Table 4.4.7 The effect of varying ME:TLys on the feed conversion ratio (kg FI/ kg BWG) of broilers from 0 to 35 days ofage ±standard error of the mean) Metabolisable Energy (MJ/kg) Total Lysine (g/kg) 11,3 12,13 12,97 Mean 1,3 1.610(±0.0120)a12 1.586(±0.0120)ab1 1.563(±0.0120)b2 1.587(±0.0069) 1,4 1.598(±0.0140)12 1.563(±0.0120)12 1.573(±0.0120)12 1.578(±0.0073) 1,6 1.593 (±0.0120)a2 1.550(±0.0120)62 1.602(±0.0140)a1 1.581(±0.0073) 1,7 1.635(±0.0120)a1 1.584(±0.0120)b12 1.565(±0.0120)612 1.594(±0.0069) Mean 1.609(±0.0063)a 1.571(±0.0060) 1.576(±0.0063) ab Means within the same row with no common superscript differ significantly (P<0.05) 1.2Means within the same column with no common superscript differ significantly (P<0.05) The calculated feed conversion ratio (FCR) of broilers was lowest at ME 12.13 and ME 12.97 atTLys1.3, with carryover effects observed at the termination of the trial. Similar results were observed atTLys1.4, with effects continuing till day twenty-eight of the trial. At TLys1.6, FCR was again favoured bythe higher ME levels. FCR was lowest at ME 12.13 as a carryover effect at the termination of the trial. Thistrend persisted at TLys1.7, with FCR decreasing with increasing ME levels as a carryover effect. Carryoverimprovements in FCR were observed at all ME levels when TLys was increased up to TLys1.6, while anincrease in TLys from TLys1.3 to TLys1.4 decreased FCR mostly within the experimental feeding phase. 4.5 Performance efficiency factor Results for performance efficiency factor according to weighing intervals are shown below in Tables4.5.1 to 4.5.7. Table 4.5.1 The effect of varying ME:TLys on the performance efficiency of broilers at 3 days ofage (± standard error of the mean) Metabolis able Energy (MJ/kg) Total Lysine (g/kg) 11,3 12,13 12,97 Mean 1,3 265.6(±11.39)b3 252.6(±11.39)b3 325.6(±11.39)a2 281.3(±6.573)2 1,4 322.18(±13.31)12 333.7(±11.39)1 343.1(±11.39)12 333.0(±6.964)1 1,6 295.2(±11.39)b23 339.7(±11.39)1 365.3(±13.31)a1 333.4(±6.964)1 1,7 346.3(±11.39)a1 299.6(±11.39)b2 341.0(±11.39)a12 328.9(±6.573)1 Mean 307.3(±5.948)” 306.4(±5.639) 341.7(±5.948)ab ,Means within the same row with no common superscript differ significantly (P<0.05) 1-Means within the same column with no common superscript differ significantly (P<0.05) Table 4.5.2 The effect of varying ME:TLys on the performance efficiency of broilers at 7 days ofage (± standard error of the mean) Metabolisable Energy (MJ/kg) Total Lysine (g/kg) 11,3 12,13 12,97 Mean 1,3 169.0(±7.202)b3 158.1(±7.202)b2 229.7(±7.202)02 185.6(±4.158)2 1,4 236.6(±8.419)ab1 235.2(±7.202)b1 258.0(±7.202) 243.2(±4.405)1 1,6 207.7(±7.202)C2 238.8(±7.202)b1 268.0(±8.419)1 238.1(±4.405)1 1,7 233.9(±7.202)b1 249.5(±7.202)ab1 261.4(±7.202)a1 248.3(±4.158)1 Mean 211.8(±3.762) 220.4(±3.601)' 254.3(±3.762)a Means within the same row with no common superscript differ significantly (P<0.05) Means within the same column with no common superscript differ significantly (P<0.05) Table 4.5.3 The effect of varying ME:TLys on the performance efficiency of broilers at 10 days ofage (± standard error of the mean) Metabolis able Energy (MJ/kg) Total Lysine (g/kg) 11,3 12,13 12,97 Mean 1,3 156.0(±4.496)b3 148.9(±4.496)b2 217.9(±4.496)2 174.3(±2.596)3 1,4 216.7(±5.257)b1 219.8(±4.496)61 240.7(±4.496)a1 225.7(±2.750) 1,6 188.2(±4.496)C2 239.1(±4.496)b1 246.8(±5.257)a1 224.7(±2.750) 1,7 224.4(±4.496)b1 235.6(±4.496)ab1 244.4(±4.496)1 234.8(±2.596)1 Mean 196.3(±2.349)C 210.8(±2.348)夕 237.4(±2.349)a Means within the same row with no common superscript differ significantly (P<0.05) 1-Means within the same column with no common superscript differ significantly (P<0.05) Table 4.5.4 The effect of varying ME:TLys on the performance efficiency of broilers at 14 days ofage (± standard error of the mean) Metabolis able Energy (MJ/kg) Total Lysine (g/kg) 11,3 12,13 12,97 Mean 1,3 179.6(±4.695)b3 175.9(±4.695)b3 252.4(±4.695)2 202.6(±2.711)3 1,4 250.0(±5.489)b1 250.5(±4.695)62 278.1(±4.695)a1 259.5(±2.872) 1,6 212.7(±4.695)62 272.9(±4.695)41 280.9(±5.489)a1 255.5(±2.872)2 1,7 257.1(±4.695)C1 273.8(±4.695)b1 287.6(±4.695)1 272.8(±2.711)3 Mean 224.9(±2.453)C 243.3(±2.348)” 274.7(±2.453)“ a Means within the same row with no common superscript differ significantly (P<0.05) Means within the same column with no common superscript differ significantly (P<0.05) Table 4.5.5 The effect of varying ME:TLys on the performance efficiency of broilers at 21 days ofage (± standard error ofthe mean) Metabolis able Energy (MJ/kg) Total Lysine (g/kg) 11,3 12,13 12,97 Mean 1,3 217.6(±13.57)b2 215.6(±13.57)62 298.8(±13.57)a 244.0(±7.833)2 1,4 283.2(±15.56)1 310.8(±13.57)1 319.0(±13.57) 304.3(±7.088)1 1,6 249.8(±13.57)b12 316.1(±13.57)a1 200.6(±15.56)& 288.8(±7.088)1 1,7 239.7(±13.57)62 314.1(±13.57)1 330.3(±13.57)《 294.7(±7.833)1 Mean 247.6(±7.088)& 289.1(±6.784)” 312.2(±7.088)C aMeans within the same row with no common superscript differ significantly (P<0.05) 1Means within the same column with no common superscript differ significantly (P<0.05) Table 4.5.6 The effect of varying ME:TLys on the performance efficiency of broilers at 28 days ofage (± standard error ofthe mean) Metabolisable Energy (MJ/kg) Total Lysine (g/kg) 11,3 12,13 12,97 Mean 1,3 289.4(±6.376)b3 294.4(±6.376)b2 356.7(±6.376)a2 313.5(±3.681)3 1,4 337.2(±7.454)b1 358.2(±6.376)a1 371.2(±6.376)a12 355.5(±3.900)1 1,6 308.8(±6.376)b2 367.8(±6.376)1 352.2(±7.454)a2 342.9(±3.900)2 1,7 345.1(±6.376)b1 367.9(±6.376)a1 380.4(±6.376)a1 364.5(±3.681)1 Mean 320.1(±3.331) 347.1(±3.188)夕 365.1(±3.331)a Means within the same row with no common superscript differ significantly (P<0.05) 1-3 Means within the same column with no common superscript differ significantly (P<0.05) Table 4.5.7 The effect of varying ME:TLys on the performance eficiency of broilers at 35 days of age + standard error of the mean) Metabolis able Energy (MJ/kg) Total Lysine (g/kg) 11,3 12,13 12,97 Mean 1,3 308.6(±8.862)b2 318.8(±8.862)62 352.4(±8.862)a1 326.6(±5.117)2 1,4 348.9(±10.36)1 356.4(±8.862)1 366.3(±8.862) 357.2(±5.420)1 1,6 317.1(±8.862)b2 352.7(±8.862)a1 317.7(±10.36)b2 329.2(±5.420)2 1,7 350.3(±8.862)1 356.6(±8.862)1 355.8(±8.862)1 354.2(±5.117)1 Mean 331.2(±4.630)” 346.1(±4.431)a 348.0(±4.630)& , Means within the same row with no common superscript differ significantly (P<0.05) ,Means within the same column with no common superscript differ significantly (P<0.05) The performance efficiency factor (PEF) of broilers was calculated using BW, cumulative mortalityrate and cumulative FI. Across all ME levels, PEF increased in response to increasing TLys levels. AtTLys1.3, PEF was highest at ME 12.97. Carryover effects observed for TLys1.6 and TLys1.7 proved thatoptimal PEF was achieved at ME 12.13. Additional carryover improvements in PEF resulted from increasingTLys levels from TLys1.3 to TLys1.4 at ME 11.30 and ME 12.13. At ME 12.97, PEF increased fromTLys1.3 to TLys1.4 from day three to 14 and from TLys1.3 to TLys1.7 on day twenty-eight. 4.6 Carcass composition Results for carcass analysis according to parameter analysed are shown below in Tables 4.6.1 to 4.6.7. Table 4.6.1 The effect of varying ME: TLys ratios on carcass moisture (as % carcass weight) of broilers at 21 days ofage (± standard error of the mean) Metabolis able Energy (MJ/kg) Total Lysine (g/kg) 11.3 12.13 12.97 Mean 1.3 68.99(±0.5995)1 67.40(±0.5995) 68.10(±0.5995)2 67.84(±0.3461)3 1.4 68.62(±0.7008)62 70.74(±0.5995)a1 71.23(±0.5995)a1 70.44(±0.3666)2 1.6 68.99(±0.5995)b2 71.52(±0.5995)a1 71.97(±0.7008)1 71.02(±0.3666)12 1.7 73.00(±0.5995)1 70.60(±0.5995)a1 71.23(±0.5995)a1 71.61(±0.3461)1 Mean 69.66(±0.3132) 70.07(±0.2997) 70.97(±0.3132)a ab Means within the same row with no common superscript differ significantly (P<0.05) 1-3Means within the same column with no common superscript differ significantly (P <0.05) ME 11.3 yielded the lowest carcass moisture at TLys1.4, TLys1.6 and TLys1.7. At ME 11.3, carcassmoisture was highest at TLys1.7 and lowest at ME 12.13 and ME 12.97. Table 4.6.2 The effect of varying ME: TLys ratios on carcass fat (as % carcass weight) of broilers at 21 days ofage (±standard error of the mean) Metabolis able Energy Total Lysine 11.3 12.13 12.97 Mean 1.3 29.78(±1.147)b1 36.78(±1.147)a1 25.22(±1.147)C1 30.59(±0.6623)1 1.4 25.29(±1.341)2 24.91(±1.147) 23.47(±1.147)12 24.56(±0.7016) 1.6 25.47(±1.147)a2 19.92(±1.147)b3 19.71(±1.34)b3 21.70(±0.7016)3 1.7 18.75(±1.147)3 20.07(±1.147)3 20.75(±1.147)23 19.85(±0.6623)3 Mean 24.82(±0.5992) 25.42(±0.5735)“ 22.29(±0.5992) Means within the same row with no common superscript differ significantly (P<0.05) Means within the same column with no common superscript differ significantly (P<0.05) Fat content increased with an increase in ME levels from ME 11.3 to ME 12.13 at TLys1.3. Incontrast, carcass fat was lowest at ME 12.97. At TLys1.6, carcass fat was highest at ME 11.30. Carcass fatdecreased with increasing TLys levels across all ME levels. Table 4.6.3 The effect of varying ME: TLys ratios on carcass protein (as % carcass weight) of broilers at 21 days ofage (± standard error of the mean) Metabolis able Energy Total Lysine 11.3 12.13 12.97 Mean 1.3 52.95(±0.8914)C3 46.91(±0.8914)b3 57.06(±0.8914)a3 52.31(±0.5146)4 1.4 56.64(±1.042)2 56.82(±0.8914)2 58.86(±0.8914)23 57.44(±0.5452)3 1.6 55.20(±0.8914)b23 61.80(±0.8914)a1 62.28(±1.042)a1 59.76(±0.5452) 1.7 64.17(±0.8914)a1 60.72(±0.8914)b1 60.31(±0.8914)b12 61.73(±0.5146)+ Mean 57.24(±0.4657) 56.56(±0.4457)夕 59.63(±0.4657) Means within the same row with no common superscript differ significantly (P<0.05) Means within the same column with no common superscript differ significantly (P<0.05) An increase in carcass crude protein was observed with ME levels increasing from ME 11.3 to ME12.97 at TLys1.3. Carcass protein also increased with increasing TLys levels across all ME levels. At bothTLys1.6 and TLys1.7, carcass protein was lowest at ME 11.3. 4.7 Mortality No significant differences were observed between treatments for mortality. Cumulative mortalityaveraged at 7.21% at the end of the trial. Chapter 5 Discussion 5.1 Body weight and body weight gain Body weight on day three was promoted by the combination of TLys1.3 and ME 12.97, whichchanged to TLys1.6 and ME 12.13 from days seven to 14. By the end of the treatment phase (day 21),optimal BW resulted from TLys1.4 with no significant difference between ME levels. This effect persistedthroughout the carryover period until slaughter at day 35. For the greater extent of the trial, no significantdifferences were observed between ME levels at TLys1.7. BW at ME 12.13 and 12.97 did not respond to anincrease beyond TLys1.4, with the exception of BW at ME 11.30 increasing at TLys1.7. This is consistentwith findings of Madsen et al. (2010), who reported that increasing BP levels increased BW, more so at lowME levels. Response up to the highest TLys level was observed only at the ME 11.30. At TLys1.4, noresponse was elicited by differences in ME levels. At TLys1.6, BW improved with an increase from ME11.30 to ME 12.13 but not at ME 12.97. At TLys1.3, BW increased from ME 11.30 to ME 12.97. In contrast to the findings of this trial, no response was seen between ME levels at the lowest dLyslevel when examined by Chang et al. (2015). BW did not increase with increasing ME levels at BP of 80%Aviagen 2007 recommendation, but did increase at BP 100% and 120% Aviagen 2007 recommendations.The ME levels which elicited an increase in BW were slightly lower in the Starter than those used in thepresent trial, thus not having reached maximum requirement even at the highest ME level. Classen (2013)tested even lower BP levels (70%, 80% and 90% BP Aviagen recommendation) at 11.30 MJ/kg to 12.97MJ/kg ME. While BW increased at 90% BP, no response to ME was observed at 80% BP, indicating that allME levels were adequate for the low BP levels available. In agreement with these findings, Cho (2011)observed that increasing dietary energy levels resulted in reduced BW at low Lys levels. Moderate Lys levelsdid not show any difference with changing ME levels, but at high Lys levels, BW increased with increasingME levels. Like BW, BWG on day three was promoted by the lowest TLys and highest ME level. TLys1.4 wasoptimal from days 7 to 14 but reverted to TLys1.3 on day twenty-one. An inversed effect was seen in thecarryover period with optimal BWG resulting from TLys1.6 and TLys1.7 in combination with ME 11.30 ondays 28 and 35, respectively. This increased BWG was not sufficient to compensate for the lower BWGduring the treatment phase. For the greater extent of the trial, no significant differences were observedbetween ME levels at TLys1.7. BWG at ME 12.97 did not respond to an increase in Lys beyond TLys1.4,with BW at ME 11.30 and ME 12.13 increasing at TLys1.7 from days seven to 14. A similar trend was observed by Faulkner (1993), where BWG increased with increasing Lys levelsuntil a point of plateau, beyond which BWG decreased at the highest Lys intake. This was attributed to a lackof energy which was required for protein deposition of that magnitude and possibly the higher energy cost ofexcess protein excretion. The possibility of Lys toxicity was also considered as an explanation for poorgrowth rates at the highest Lys level. In the present trial, BWG appeared to plateau at the higher TLys levelsbut no direct negative impact of excess Lys was observed. A further finding of Faulkner (1993) was thatincreasing energy to protein ratio increased the BWG up to a point, after which BWG declined. This was incontrast with current ME levels with the exception of BWG at TLys1.7, where increasing ME levels actuallydecreased BWG. The surplus of energy in the diet was presumed to have been directed towards higher fatdeposition relative to protein deposition, and may have increased the metabolic heat increment which mayhave reduced FI and thus BWG. Lemme et al. (2003) used Lys:AME as an indication of Lys levels across treatments. No differencewas observed in BWG at the lowest Lys:AME between energy levels, which was in contrast to the presentstudy, where even at TLys1.3, BWG increased with ME from the lowest to the highest ME level. Lemme etal. (2003) also observed that at 12.55 MJ/kg ME, the increase in BWG in response to increasing Lys:AMEwas more pronounced than at 13.18 MJ/kg ME, where BWG increased only up to a point before decreasing.This inverse to the findings of the present study, where BWG at the lowest ME level was more responsive tohigher TLys levels. 5.2 Feed intake Feed intake on day three was optimised at TLys1.3 and ME 12.13, this changed to TLys1.4 and ME11.30 on days seven and 10. From days 21 to 28, FI was highest at TLys1.7 and ME 11.30 before revertingto TLys1.4 at day 35 with no significance between ME levels, thus despite a response in FI to increasingTLys levels, carryover effects were not significant at the highest TLys level, nor at different ME levels. Thismay be a similar response pattern as was observed by Chang et al. (2015), where at constant ME levels, FIincreased with increasing BP levels from 80% to 100%, but decreased from 100% to 120% Aviagen 2007recommendations. In a trial by Madsen et al. (2010), both ME levels of 95% and 100% Aviagen 2002recommendations with increased BP levels from 95% to 100% Aviagen 2002 recommendations caused FI todecrease in broilers from 42 to 56 days of age. Reduced protein intake was however compensated for by highdietary protein content. This result is consistent with the findings at the lower TLys levels in the present trial. For the greater extent of the trial, no significant differences were observed between ME levels atTLys1.4 and TLys1.7 or between TLys levels at ME 12.97. It was postulated by Classen (2013) that feedswith moderate to high levels of AA do not elicit a change in FI according to ME levels, as increased energy may allow for AA to be spared from catabolism and direct them towards protein synthesis. At the lowerTLys levels, FI was often observed to increase with increasing ME levels. This response was consistent onlyat TLys1.3 and TLys1.6 from days 21 and beyond. Faulkner (1993) observed that FI was lowest when birdswere fed high Lys concentration feed, and FI increased with decreasing Lys levels. When birds weresupplemented with sucrose, FI intake increased to a point then decreased with increasing Lys levels, whichcorroborates the current finding. Decreased FI in response to increasing energy to protein ratios may beresultant of an energy surplus thus an imbalanced diet leading to a higher metabolic heat increment. Theexpected reduction in FI in response to increasing ME levels was observed only at TLys1.7. This effect wasconsistent with those of Madsen et al. (2010), where increasing ME from 95% to 100% Aviagen 2002recommendations decreased FI at both 80% and 115% BP Aviagen 2002 recommendations and Chang et al.(2015),)Wwhere FI decreased with increasing ME levels from 8800% toO120%ME Aviagen 2007recommendations at constant BP levels. 5.3 Feed conversion ratio The feed conversion ratio on day three was optimised at TLys1.7 and ME 11.30, this changed toTLys1.6 and ME 12.97 from days seven to 14. Optimal FCR stabilised at TLys1.4 on day 21 with nodifference between ME levels. Carryover effects persisted at days 28 and 35, where FCR was optimal atTLys1.4 and ME 12.13. For the greater extent of the trial, no significant differences were observed betweenME levels at TLys1.4. FCR improved with increasing ME levels as a general trend throughout this study.Response to TLys levels were rarely observed beyond TLys1.4. These findings agree with those of Madsenet al. (2010), where FCR was impaired with reduced ME levels but was improved with increased BP, andChang et al. (2015) who observed an improvement in FCR when ME increased from 85% to 92% ME at100% and 120% BP Aviagen 2007 recommendation. 5.4 Performance efficiency factor The performance efficiency factor was optimised at TLys1.4 throughout the greater extent of the trial,with the higher ME levels being favourable. At levels exceeding TLys1.4, almost no improvement wasobserved, with TLys1.6 often yielding the least favourable results at ME 11.30. These trends from thetreatment phase persisted throughout the carryover phase until slaughter. 5.5 Carcass composition The highest carcass fat and lowest protein was observed at TLys1.3 and ME 12.13, while the highestcarcass protein was observed at TLys1.7 and ME 11.30. Carcass fat decreased with increasing TLys levels across all ME levels, with the lowest fat content at TLys1.3 and ME 11.30. No consistent trend was noticedwith increasing ME levels. Carcass protein decreased with increasing ME levels at TLys1.7, and increasedwith increasing ME levels at lower TLys levels. An increasing trend in carcass protein was observed withincreasing TLys levels, with the most distinct effect at ME 11.30. In this study, carcass fat and protein wasanalysed on broilers at 21 days of age so as to determine the direct treatment effect on these parameters.Current findings were in agreement with that of Chang et al. (2015), where abdominal fat increased withincreasing ME levels and decreasing BP levels, with this effect being most pronounced at 80% BP Aviagen2007 recommendation. Findings by Lemme et al. (2003) indicated that breast meat yield increased withincreasing AA supply, with marked differences at the lowest Lys to AME ratio. At higher ME levels, breast meat yield decreased at the highest Lys level. Abdominal fat pad wasdecreased by decreasing AME:Lys, with results most pronounced at the lower ME levels. This may besupported by the theory of Faulkner (1993), in which he stated that birds on higher energy to protein ratiodiets over-consumed energy with less efficient usage of energy resulting from increased fat deposition.Additional findings by Chang et al. (2015) that are similar to findings of the present trial include carcass andbreast meat yield being highest at 85% ME and 100% and 120% BP Aviagen 2007 recommendation,respectively. Both parameters decreaseddwithhiincreasing ME levelsaatt85%BPPAviagen2007recommendation. In contrast to present findings, lowest abdominal fat was observed at 85% ME and 120%BP Aviagen 2007 recommendation. Classen (2013) fed diets ranging from 11.30 MJ/kg to 12.97 MJ/kg ME at 70%,80% and 90% BPAviagen 2007 recommendation. At 90% BP Aviagen recommendation, BW, carcass and breast meat yieldand FCR were all favoured by increasing ME levels. No response was observed to ME at 80% BP Aviagenrecommendation, indicating that all ME levels were adequate for the low BP levels available. At 70% BPAviagen recommendation, FI, BWG and carcass and breast meat yield decreased in response to increasingME levels, possibly due to large imbalance between energy to protein ratio. Dozier et al. (2007) fed birds from 42 to 56 days of age diets with different ME and AA levels.Lower ME levels had better breast meat yield than those fed moderate levels of ME, possibly attributed tothe increased Lys intake. High ME levels were observed to increase BWG, decrease FI and thus improveFCR. Feeding higher levels of AA, decreased FI and FCR, and increased breast meat yield. This experimentdemonstrated the importance of AA density even at late stages in the growth as a tool to increase breast meatyield and improve return on investment. Chapter 6 Conclusion The objective of the current trial was to examine the effects of increasing TLys levels across variousME levels while simultaneously examining the effects of increasing ME levels across various TLys levelsThe ME levels used were 11.30,12.13 and 12.97 MJ/kg. The TLys levels used were 1.3%, 1.4%, 1.6%and1.7%. These treatments were restricted to the Pre-starter and Starter feeding phases (days 0 to 21 of age) soas to determine the requirements of the early growing phase that would yield positive carryover effects onslaughter weight. The focus of the study was therefore on results at day three5, the termination of the trial. No improvement was seen in BW by increasing TLys levels above TLys1.4 at any ME level. BW wasoptimised at TLys1.4 with no differences between ME levels. At the lowest TLys level, however, BWimproved with every increase in ME level. This suggests that from TLys1.4, even the lowest ME level wasadequate for maximum BW to be achieved. Similarly, it may be assumed that TLys1.4 was adequate formaximum BW across all ME levels. BWG was similarly favoured by TLys1.4 during the experimentalfeeding phase but an inversed effect was observed in the carryover phase, where improved BWG was notedat high TLys levels and low ME levels. This increased BWG was not sufficient to compensate for the lowerBWG for these treatments during the treatment phase. Feed intake did not strictly adhere to the expected trend of decreasing with each increase in ME level.While this did occur occasionally, FI was more influenced by increasing TLys levels, with increased FI asTLys increased from TLys1.3 to 1.4 at ME 11.30 and 12.13. Resultant 35 day FCR did not improve beyondTLys1.4 and differences due to ME levels were only observed at the lowest and highest TLys levels (ME11.30 being the least favourable). No treatment effects were observed on the mortality rate. The performance efficiency factor of broilers (calculated using BW, cumulative mortality rate andcumulative FI) was maximised at TLys1.4 with no differences between ME levels; however, these resultswere matched when TLys1.3 was combined with ME 11.30. Carcass fat was observed to decrease withincreasing TLys levels across all ME levels, with the single results conforming to expected norms being anincrease in fat content with ME increasing from 11.30 to 12.13. Contradictory trends were seen at other MEand TLys combinations. Carcass protein conformed to expected patterns by increasing with increasing TLyslevels, however, increasing ME levels also resulted in increased carcass protein (with the exception of thistrend at TLys1.7). Scientists have observed carryover effects in BWG and FCE across the entire growing period whenBP levels were increased in the Starter phase. This only held true when TLys increased from 1.3% to 1.4% in the current trial. Recent findings have additionally indicated that at high Lys levels, increasing the energycontent of the diet yielded increased values for BW, FE, and carcass and breast meat yield, despite there notbeing any significant difference in FI. This implies that at higher levels of dietary Lys, more energy would berequired for optimal broiler performance. In the current trial, results conformed to these findings as BW increased with an increase in ME atTLys1.3 and FCR improved with an increase in ME from 11.3 to 12.13 at both TLys1.3 and 1.7. While FIwas not influenced by dietary energy levels, increased energy levels did not elicit a positive response inbroiler performance except at the lowest TLys level examined. No consistent response was observed inreduction of FI at increased ME levels but rather FI increased with increasing TLys levels from 1.3 to 1.4 atME 11.3 to 12.13 This is in agreement with recent findings that contradict the widely accepted notion ofreduced FI resulting from high energy density diets, and thus increasing the AA density requirement. Another popular theory that has recently been contradicted is that low ME levels in combinationwith high BP levels will result in reduced abdominal fat accretion and increase breast meat yield. However,carcass composition results of the current trial were correlated with past findings. A reduction in carcass fatand Carcass fat increased with increased ME from 11.3 to 12.31 and decreased with increased TLys levels.An increase in carcass protein was also observed at higher TLys levels. The current marketing value of broilers is based on whole birds, thus relatively lower priority wasplaced on specific carcass components for this trial. Contradictory results require further research to beconducted in this regard. Results based on broiler performance suggest that TLys of 1.4% in combinationwith ME levels as low as 11.30 MJ/kg may be successfully used in the early feeding phase. Chapter 7Critical Review and Recommendations This trial had multiple shortcomings as listed below: 1.Due to the large number of treatments in this trial, replicates of treatments were set at a maximum offour. A better indication of treatment effects may have resulted from a larger trial capacity, as thismay have reduced the variability of results and thereby increased the significance as well asconfidence levels. 2 Chicks were placed as-hatched according to commercial broiler rearing practices, this may haveconcealed different responses of male and female birds. 3. Trial feeds were produced at a commercial feed plant with production of 4 tonne batches pertreatment. Feeds could have been more closely matched to treatment formulations if raw materialswere weighed by hand and mixed in batch sizes similar to the required volume of feed for eachtreatment. 4 Due to technical difficulties, feeds were not delivered timeously to the trial facility, and thus may nothave warmed sufficiently for maximal feed intake on day zero. 5. While dietary energy levels were formulated on ME basis, direct analysis of ME on the feeds wasnot conducted. Proximal analysis included crude fat, fibre, protein, ash, mineral analysis, moistureand starch content. The ME value of these feeds may only be roughly approximated as not everyfeedstuff used had an assigned ME contribution nor was the possible interaction effect betweenfeedstuffs taken into account. 6.Freeze drying of 21 carcasses for carcass analysis was done in batches of 20 samples and this mayhave exposed different treatments to variable environments. 7.It recommended that more research should be conducted on nutrition in the early feeding phase, withonly carryover effects examined in the remaining feed phases. This will allow for nutritionists tomotivate that the increased cost of Pre-starter and Starter diets is a long term investment. Chapter 8 References AOAC, 1999. Official methods of analysis of AOAC. International 17th edition. Gaithersburg, USA. AOAC, 2000. Official methods of analysis of AOAC. International 17th edition. Gaithersburg, USA. Aviagen, 2007. Ross 308 Broiler: nutrition specifications. In-house publication, Global. Aviagen, 2014. Ross 308 Broiler: nutrition specifications. In-house publication, Global. Aviagen. 2015. Ross broiler pocket guide. http://eu.aviagen.com. Baeza, E. & Le Bihan-Duval, E., 2013. Chicken lines divergent for low or high abdominal fat deposition: arelevant model to study the regulation of energy metabolism. Animal 7 (6), 965-973. Baker, D. H., 1996. Advances in amino acid nutrition and metabolism of swine and poultry. Pages 41-53 inNutrient management of food animals to enhance and protect the environment. E. T. Kornegay, edLewis Publishers, New York. Baker, D. H., 2009. Advances in protein-amino acid nutrition in poultry. Amino Acids 37(1), 29-41. Batal, A. B. & Parsons. C. M., 2004. Utilization of various carbohydrate sources as affected by age in thechick. Poult. Sci. 83,1140-1147. Bellaver, C., Guideni, A. L., de Brum, P. A. R. D. & Rosa, P. S., 2002. Estimates of requirements ofmetabolizable Lys and energy in broilers from 1 to 21 days of age, using multivariate canonicalvariable. Bras. Zootec. 31, 71-78. Brito, A. B., Stringhini, J. H., Gomez Xavier S. A., Cafe M. B., Andrade, M. A. & Leandro, N. S. M. R.,2011. Performance of broilers fed digestible amino acids based diets obtained from cecectomizedroosters and broilers. Bras. Zootec. 40(11), 2400-2404. Bryden, W. L., Hew, L. I. & Ravindran, V., 2000. Digestible amino acid values: variation and application.Aust. Poult. Sci. Symp. 12,51-58. Chang, A., Elfick, D., Sooncharernying, S. 7 Cerrate, S. 2015. Performance of Ross 308 broilers fed differentlevels of energy and balanced protein under moderate heat stress. Aust. Poult, Sci. Symp.26, 117-120. Cho, M., 2011. The impact of diet energy and amino acid content on the feed intake and performance ofbroiler chickens. MSc Thesis. University of Saskatchewan, Saskatoon. Classen, H. L., 2013. Response of broiler chickens to dietary energy and its relationship to amino acidnutrition. Aust. Poult. Sci. Symp. 24, 107-114. Collin, A., Malheiros, R. D., Moraes, V. M. B., Van As, P., Darras, V. M., Taouis, M., Decuypere, E. &Buyse, J., 2003. Effects of dietary macronutrient content on energy metabolism and uncouplingprotein mRNA expression in broiler chickens. Br. J. Nutr. 90, 261-269. Corzo, A., Moran, E. T. J. & Hoehler, D., 2003. Arginine need of heavy broiler males: Applying the idealprotein concept. Poult. Sci. 82, 402-407. Corzo, A., Kidd, M. T., Dozier, W.A., Shack, L.A. & Burgess, S.C., 2006. Protein expression of pectoralismuscle major in chickens in response to dietary methionine status. Br. J. Nutr. 95, 703-708. Dozier, W. A., Corzo, A., Kidd, M.T. & Branton, S.L., 2007. Dietary apparent metabolizable energy andamino acid density on effects on growth and carcass traits of heavy broiler. J. Appl. Poult. Res. 16, 192-205. Eits, R. M., Kwakkel, R. P., Verstegen, M. W. A., Stoutjesdijk, P. & Greef, K. H., 2002. Protein and lipiddeposition rates in male broilers chickens: separate responses to amino acid and protein-free energy.Poult. Sci. 81, 472-480. Eits, R. M., Kwakkel, R. P., Verstegen, M. W. A. & Emmans, G. C., 2003. Responses of broiler chickens todietary protein: effects of early life protein nutrition on later responses. Br. Poult. Sci. 44, 398-409. Emmans, G. C.,1987. Computers in animal production. Br. Society of Animal Prod. 5,103-110. Emmerson, D. A., 1997. Commercial approaches to genetic selection for growth and feed conversion indomestic poultry. Poult. Sci. 76, 1121-1125. Emmert, J. L. & Baker, D. H., 1997. Use of the ideal protein concept for precision formulation of amino acidlevels in broiler diets. J. Appl. Poult. Res. 6, 462-470. Fan, H. P., Xie, M., Wang, W. W., Hou, S. S. & Huang, W., 2008. Effects of dietary energy on growthperformance and carcass quality of white growing pekin ducks from two to six weeks of age. Poult.Sci. 87, 1162-1164. Faulkner, A. S., 1993. The influence of dietary energy on the efficiency of utilisation of dietary protein inbroiler chickens. Masters Agricultural Thesis. University of Natal, Pietermaritzburg. Fernandez, S. R., Zhang, Y. & Parsons, C. M., 1995. Dietary formulation with cottonseed meal on a totalamino acid versus digestible amino acid basis. Poult. Sci. 74, 1168-1179. Garcia, A. R., 2006. Evaluating feed components for formulation of Pre-starter diets for broiler chickens.PhD Dissertation. University of Georgia, Athens. Gous, R. M., Emmans, G. C. & Fisher, C., 1992. The response of broilers to feeds differing in proteincontent following a period of fattening. Thirteenth annual meeting of the Southern Poult. ScienceSociety, Atlanta, Georgia. Greenwood, M. W, Cramer, K. R., Beyer, R.S., Clark, P. M.& Behnke, K.C., 2005. Influence of feed formon estimated digestible lysine needs of male broiler from sixteen to thirty days of age. J. Appl. Poult.Res.41,130-135. Grisoni, M. L., Uzu, G., Larbier, M. & Geraert, P. A., 1991. Effect of dietary Lys level on lipogenesis inbroilers. Reprod. Nutr. Dev. 31,683-690. Han, Y. & Baker, D.H., 1993. Effects of excess methionine or Lys for broilers fed a corn-soyabean mealdiet. Poult. Sci. 72,1070-1074. Havenstein, G. B., Ferket, P. R., Scheideler, S. E. & Rives, D. E., 1994. Carcass composition and yield of1991 vs 1957 broilers when fed “typical”1957 and 1991 broiler diets. Poult. Sci. 73(12),1795-1804. Havenstein, G. B., Ferket, P. R. & Qureshi, M. A., 2003. Carcass composition and yield of 1957 versus 2001broilers when fed representative 1957 and 2001 broiler diets. Poult. Sci. 82,1509-1518. Hetland, H., Choct, M. & Svihus, B., 2004. Role of insoluble non-starch polysaccharides in poultry nutrition.Worlds Poult. Sci.J. 60(4), 415-422. Holsheimer,J. P. & Ruesink, E. W., 1998., Effect on performance, carcass composition, yield and financialreturn of dietary energy and Lys levels in Starter and Finisher diets fed to broilers. Poult. Sci. 77, 806-815. Iji, P. A., 1999. The impact of cereal non-starch polysaccharides on intestinal development and function inbroiler chickens. Worlds Poult. Sci. J. 55(4),375-387. Kassim, H. & Suwanpradit, S., 1996a. The effect of dietary protein levels on the carcass composition ofStarter and Grower broilers. Asian Australas. J. Anim. Sci. 9,261-266. Kassim, H. & Suwanpradit, S., 1996b. The effect of dietary energy levels on the carcass composition of thebroilers. Asian Australas. J. Anim. Sci. 9,331-335. Kidd, M. T., Kerr, B. J., Halpin, K.L., McWard, G.W. & Quarles, C. L., 1998. Lys levels in Starter andGrower-Finisher diets affect broiler performance and carcass traits. J. Appl. Poult. Res. 7, 351-358. Kleyn, R., 2013. Dietary energy and protein. Pages 23-41 and 45-55. Chicken nutrition, a guide fornutritionists and poultry professionals. Context. Leicestershire, England. Leeson, S. & Summers, J. D., 2001. Protein and amino acids. Pages 102 -175 in Scott’s nutrition of thechicken. 4" rev. ed. University books. Ontario, Canada. Lemme, A., 2007. How to adjust dietary amino acids to energy in broiler diets? Pages 1-17 in Amino Newsvolume 8(2). Degussa AG, Hanau, Germany. Lemme, A., Wijtten, P. J. A., Langhout, D. J. & Petri, A., 2003. Interaction between ideal protein and dietaryenergy in growing broiler chicken. Eur. Sypm. Poult. Nutr. 14,304-305. Lemme, A., Ravindran, V. & Bryden, W. L., 2004. Ileal digestibility in amino acids in feed ingredients forbroilers. Poult. Sci. 60, 423-438. Lemme, A., Kemp, C., Fisher, C., Kenny, M. & Petri, A., 2005. Responses of growing broilers to varyingdietary energy and balanced amino acid levels. Eur. Symp. Poult. Nutr. 15, 465-468. Lemme, A., Wijtten, P. J. A., van Wichen, J., Petri, A. & Langhout, D. J., 2006. Responses of male growingbroilers to increasing levels of balanced protein offered as coarse mash or pellets of varying quality.Poult. Sci. 85, 721-730. Liu, S. Y., Raubenheimer, D., Selle, P. H., Gous, R. M., Hargreave, G., Simpson, R. J., Cadogan, D. J. andCowieson, A.J., 2016. Protein and energy ratios influence performance in broiler chickens. Aust.Poult. Sci. Symp.27, 170-172. Lilburn, M. S., 1998. Practical aspects of early nutrition for poultry. J. Appl. Poultry Res. 7, 420-424. Macleod, M. G., 1990. Energy and nitrogen intake, expenditure and retention at 20° in growing fowl givendiets with a wide range of energy protein contents. Br. J. Nutr. 64,625-637. Macleod, M. G., 1991. Fat deposition and heat production as responses to surplus dietary energy in fowlsgiven a wide range of metabolisable energy: protein ratio. Br. Poult. Sci. 32, 1097-1108. Macleod, M. G., 1992. Energy and nitrogen intake, expenditure and retention at 32°C in growing fowl givendiets with a wide range of energy protein contents. Br. J. Nutr. 67(2), 195-206. Macleod, M. G., 1997. Effects of amino acid balance and energy: protein ratio on energy and nitrogenmetabolism in male broiler chickens. Br. Poult. Sci. 38.405-411. Madsen, T. G., Carroll, S., Kemp, C. & Lemme, A., 2010. Influence of energy and balanced protein levels inwheat-based diets on Ross 308 broiler performance. Aust. Poult. Sci. Symp. 21,95-98. Malheiros, R. D., Moraes., V. M. B, Collin, A., Janssens, G. P. J., Decuypere, E. & Buyse, J., 2003.Nutrition Research. 23,567-578. Mariotti, F., Tome, D. & Mirand, P. P., 2008. Converting nitrogen into protein beyond 6.25 and Jones’factors. Crit. Rev. Food Sci. Nutr. 48, 177-184. Nasr, J. & Kheiri, F., 2011. Effect of different Lys levels on Arian broiler performances. Ital. J. Anim. Sci10,170-174. Nesheim, M. C., 1968. Kidney arginase activity and Lys tolerance in different strains of chickens selected fora high or low requirement of arginine. J. Nutr. 95, 79-87. Nieto, R., Prieto, C., Fernandez-Figares, I. & Aguilera, J. F., 1995. Effect of dietary protein quality onenergy metabolism in growing chickens. Br. J. Nutr. 74,163-172. Nir, I., 1995. The uncertainties of broiler growth. Europ. Symp. Poult. Nutr. 10, 19-20. Noblet, J., van Milgen, J. & Dubois, S., 2010. Utilisation of metabolisable energy of feeds in pigs andpoultry: interest of net energy systems. Aust. Pout. Sci. Symp. 21,26-35. Noy, Y. & Sklan, D., 1997. Posthatch development in poultry. J. Appl. Poult. Res. 6,344-354 ( NRC, 1994. Nutrient requirement of poultry. 9th rev. ed. Natl. Acad. Press. Washington. D. C. ) Okumora, J. & Mori, S., 1979. Effects of deficiencies of single amino acids on nitrogen and energyutilisation of chicks. Br. Poult. Sci. 20, 421-429. Parsons, C. M., Potter, L. M. & Bliss, B.A., 1982. True metabolisable energy corrected to nitrogenequilibrium. Poult. Sci. 61, 2241-2246. Pesti, G. M., 2009. Impact of dietary amino acid and crude protein levels in broiler feeds on biologicalperformance. J. Appl. Poult. Res. 18, 477-486. Pesti, G. M. & Fletcher, D. L., 1984. The responses of male broiler chickens to diets with various proteincontents during the Grower and Finisher phases. Br. Poult. Sci. 25, 415-423. Pirgozliev, V., Bedford, M. R., Acamovic, T., Mares, P. & Allymehr, M., 2011. The effects ofsupplementary bacterial phytase on dietary energy and total tract amino acid digestibility when fed toyoung chickens. Br. Poult. Sci. 52,245-254. Plumstead, P. W., 2005. Response of young broilers to graded levels of dietary protein and amino acids. MScThesis. North Carolina State University. Raleigh. Plumstead, P. W., Romero-Sanchez, H., Paton, N. D., Spears, J. W. & Brake, J., 2007. Effects of dietarymetabolizable energy and protein on early growth responses of broilers to dietary Lys. Poult. Sci. 86,2639-2648. Rabie, M. H. & Svilyagi, M., 1998. Effects of L-carnitine supplementation of diets differing in energy levelson performance, abdominal fat content, and yield and composition of edible meat of broilers. Br. J.Nutr. 80, 391-400. Rostagno, H.S., Albino, L. F. T., Donzele, J. L., 2000. Brazilian tables for poultry and swine. Composition offood and nutritional requirements. Federal University of Vicosa, Vicosa, Brazil. Samuels, M.L., 1989. Statistics for the Life Sciences. Collier MacMillian Publishers, London, UK. Schutte, J. B., 1996. CVB-documentatie-rapport No. 118: Aminozuurbehoeftenvanleghennen1envleeskuikens (Amino acd requirements of laying hens and broilers). Central Bureau for LivestockFeeding (CVB), Lelystad, The Netherlands. Statistical Analytical Systems, 2016. SAS User’s Guide: Statistical Version 9.2 SAS Institute Inc. Cary, NC,USA. Sibbald, I. R., 1976. The true metabolisable energy values of several feeding stuffs measured with roosters,laying hens, turkeys and broiler hens. Poult. Sci. 55,1459-1463. Summers, J. D. & Leeson, S., 1985. Broiler carcass composition as affected by amino acid supplementation.Can. J. Anim. Sci. 65,717-723. Swatson, H. K., Gous, R. M. & Iji, P. A., 2000. Biological performance and gastrointestinal development ofbroiler chicks fed diets varying in energy: protein ration. S. Afr. J. Anim. Sci. 30, 136-137. Tavernari, F., Buteri, C. B., Rostagno H. S. & Albino, L. F. T., 2009. Effects of dietary digestible lysinelevels on protein and fat deposition in the carcass of broilers. Bras..J. Poult. Sci. 11:99-107. Tesseraud, S., Peresson, R., Lopes, J. & Chagneau, A. M., 1996. Dietary Lys deficiency greatly affectsmuscle and liver protein turnover in growing chickens. Br. J. Nutr. 75.853-865. Ullah, M. S., Pasha, T. N., Ali, Z., Saima, Khattak, F. M. & Hayat, Z., 2012. Effects of different Pre-starterdiets on broiler performance, gastro intestinal tract morphormetry and carcass yield. J. Anim. PlantSci.22(23),570-575. Viera, S. L., Stefanello, C. & Cemin, H. S., 2016. Lowering the dietary protein levels by use of syntheticamino acids and the use of a mono competent protease. Anim. Feed Sci. and Tech. 221.262-266. Wijtten, P. J. A., Lemme, A., Pack, M. & Langhout, D. J., 2001. The effect of enhanced dietary“ideal”amino acid levels in maize- and wheat -based diets on performance of male and female broilers.Europ. Symp. Poult. Nutr. 13, 41-42. Wijtten, P. J. A., Lemme, A. & Langhout, D. J., 2004a. Effects of dietary ideal protein levels on male andfemale broiler performance during different phases of life: single phase effects, carryover effects andinteractions between phases. Poult. Sci. 83, 2005-2015. ( Wijtten, P. J. A., Prak, R., Lemme, A. & Langhout, D.J., 2004b. Effect of different dietary ideal proteinconcentrations on broiler performance. Br. Poult. Sci. 45(4), 504-511. ) ( Xie, M., Hou, S. S. & Huang, W., 2006. Methionine requirements of male white Peking ducks from twenty-one to forty nine days of age. Poult. Sci. 85, 743-746. ) ( Yalcin, S., Ozkul , H., Ozkan, S., Gous, R., Yasa, I. & Babacanoglu, E., 2010. Effect of dietary proteinregime on meat quality traits and carcass nutrient content of broilers from two commercial genotypes. Br. Poult. Sci. 51,621-628. ) Zhao, J. P., Chen, J. L., Zhao, G. P., Zheng, M. Q., Jiang, R. R. & Wen. J., 2009. Live performance, carcasscomposition and blood metabolite responses to dietary nutrient density in two distinct broiler breeds ofmale chickens. Poult. Sci. 88, 2575-2584. ( Zubair, A. K. & Lesson, S., 1996. Compensatory growth in the broiler chicken: a review. Worlds Poult. Sci. J . 52,189-201. ) Temperature profile for Daybreak Trial Facility Temperature (°C, 50 % relative humidity) Day Lower temperature Target temperature Upper temperature Lighting profile for Daybreak Trial FacilityController set point Daylight hours Darkness hours
确定


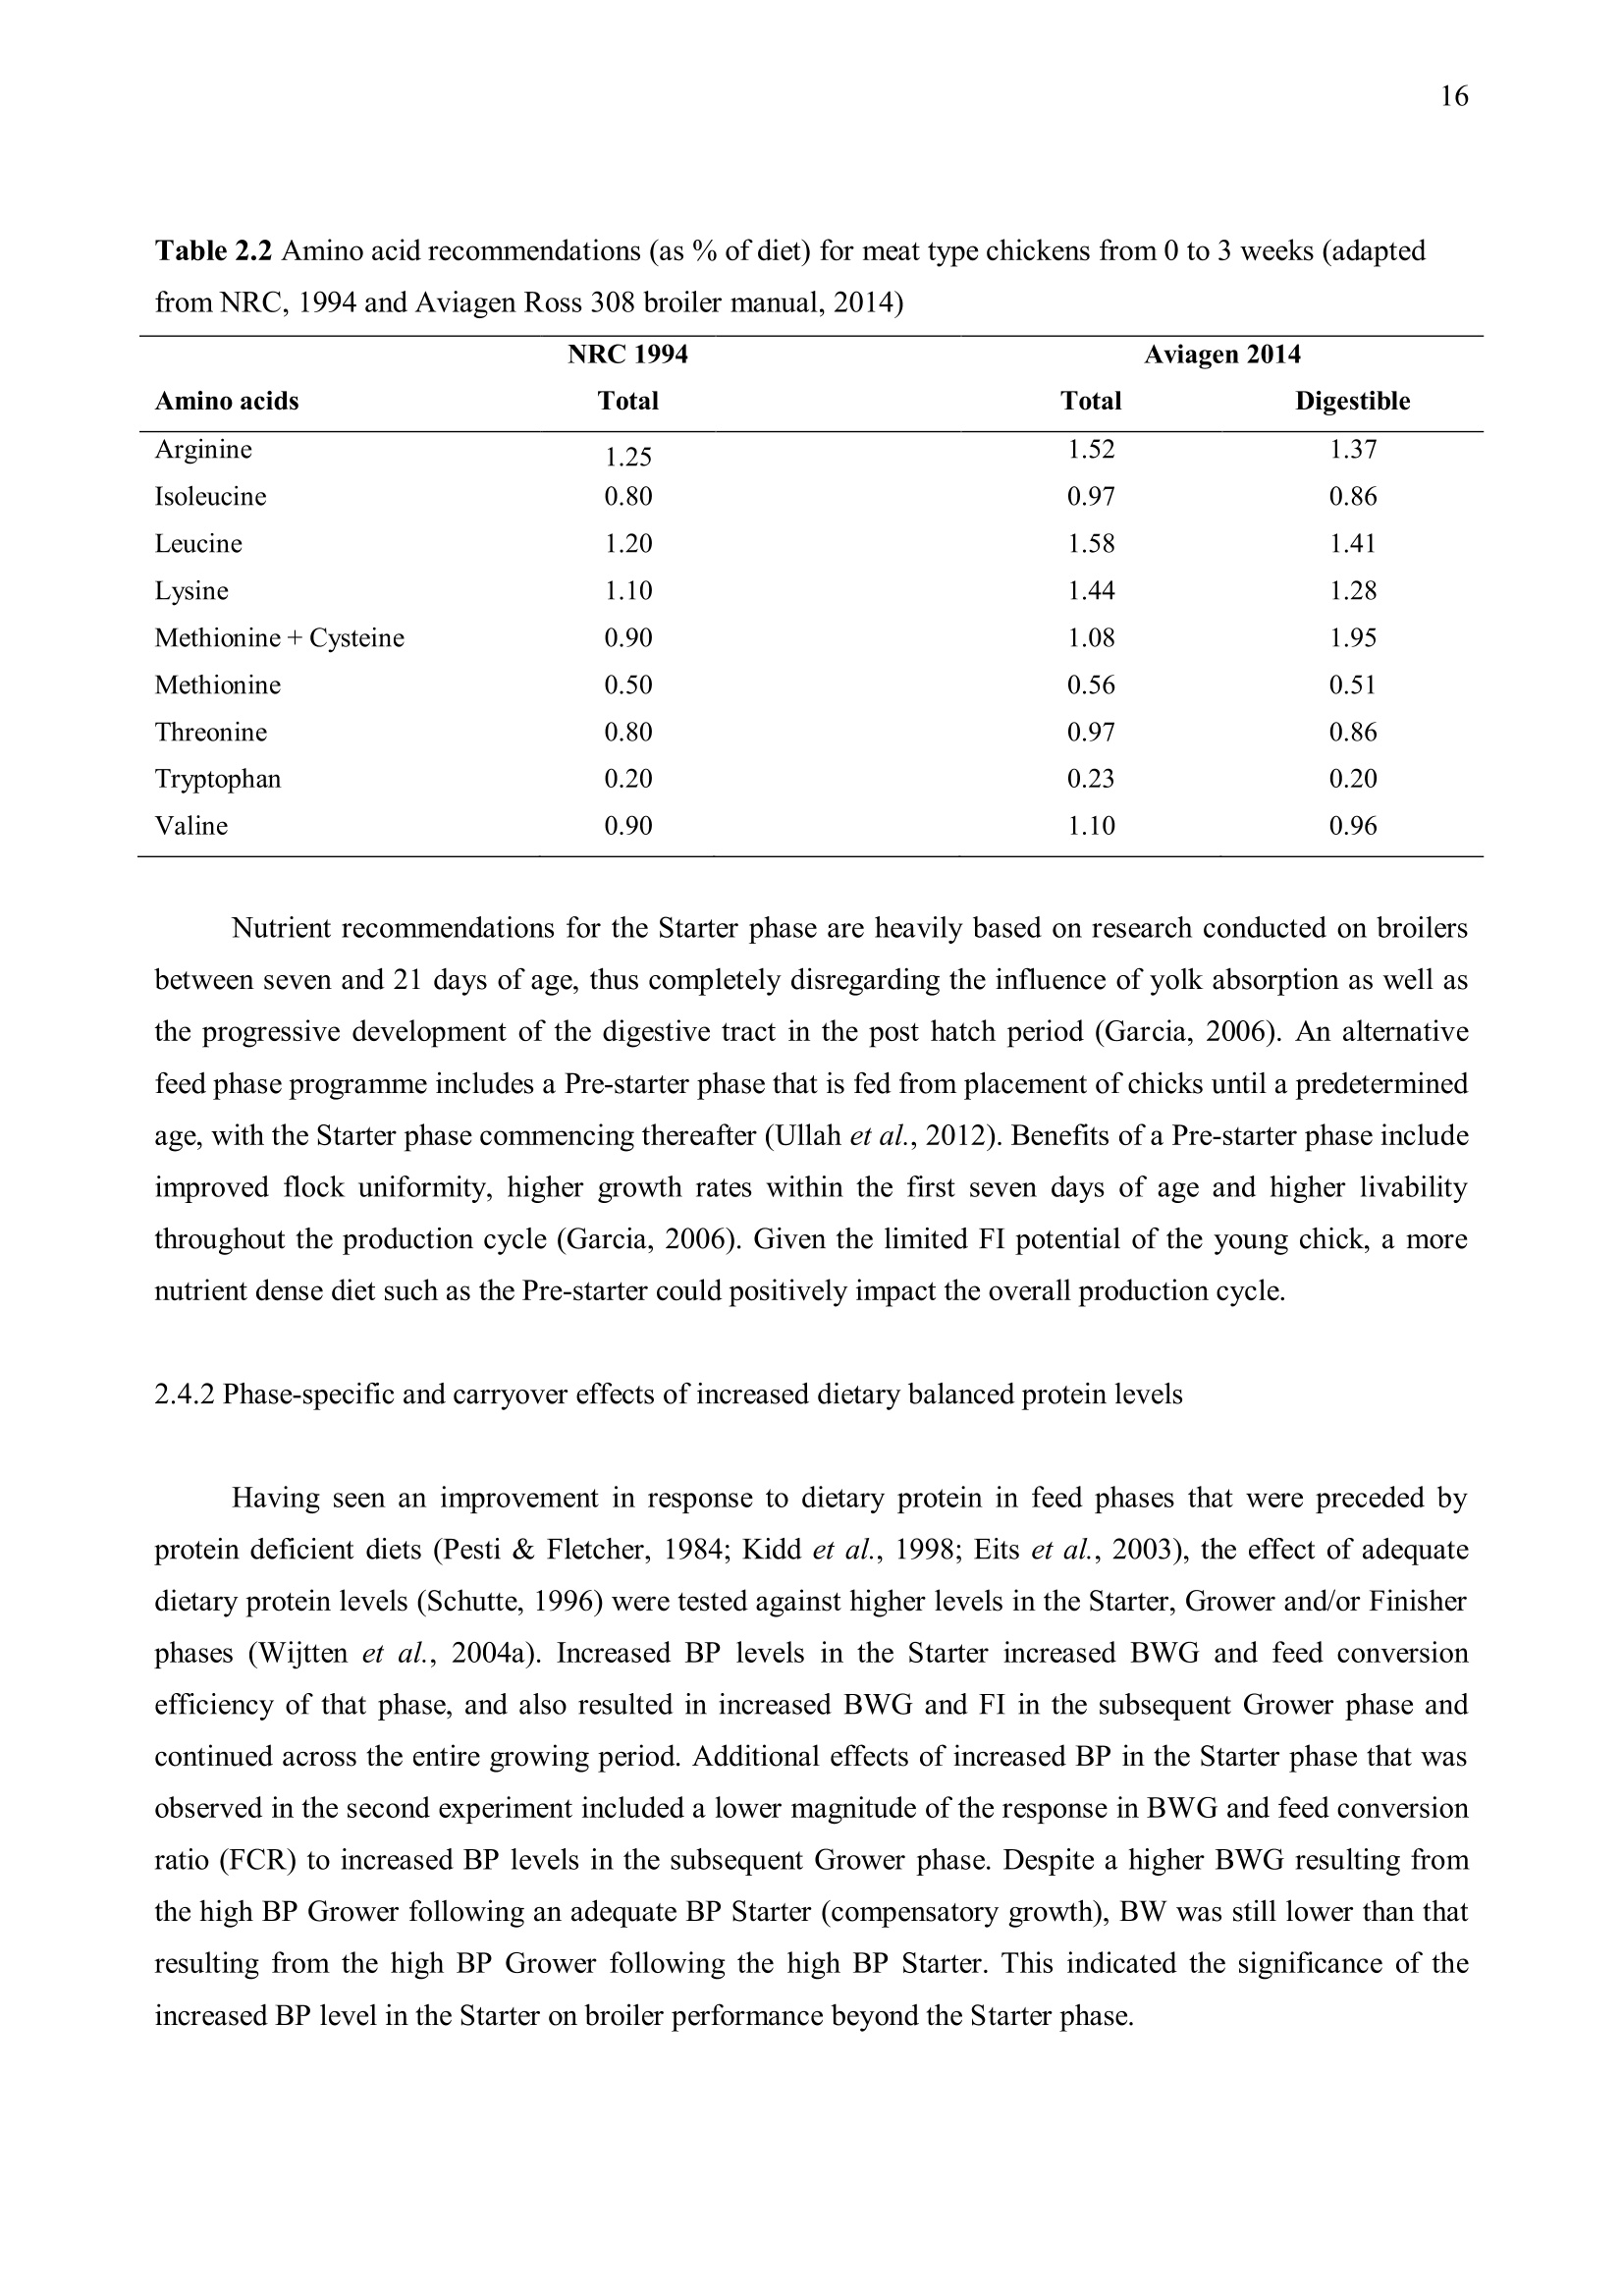
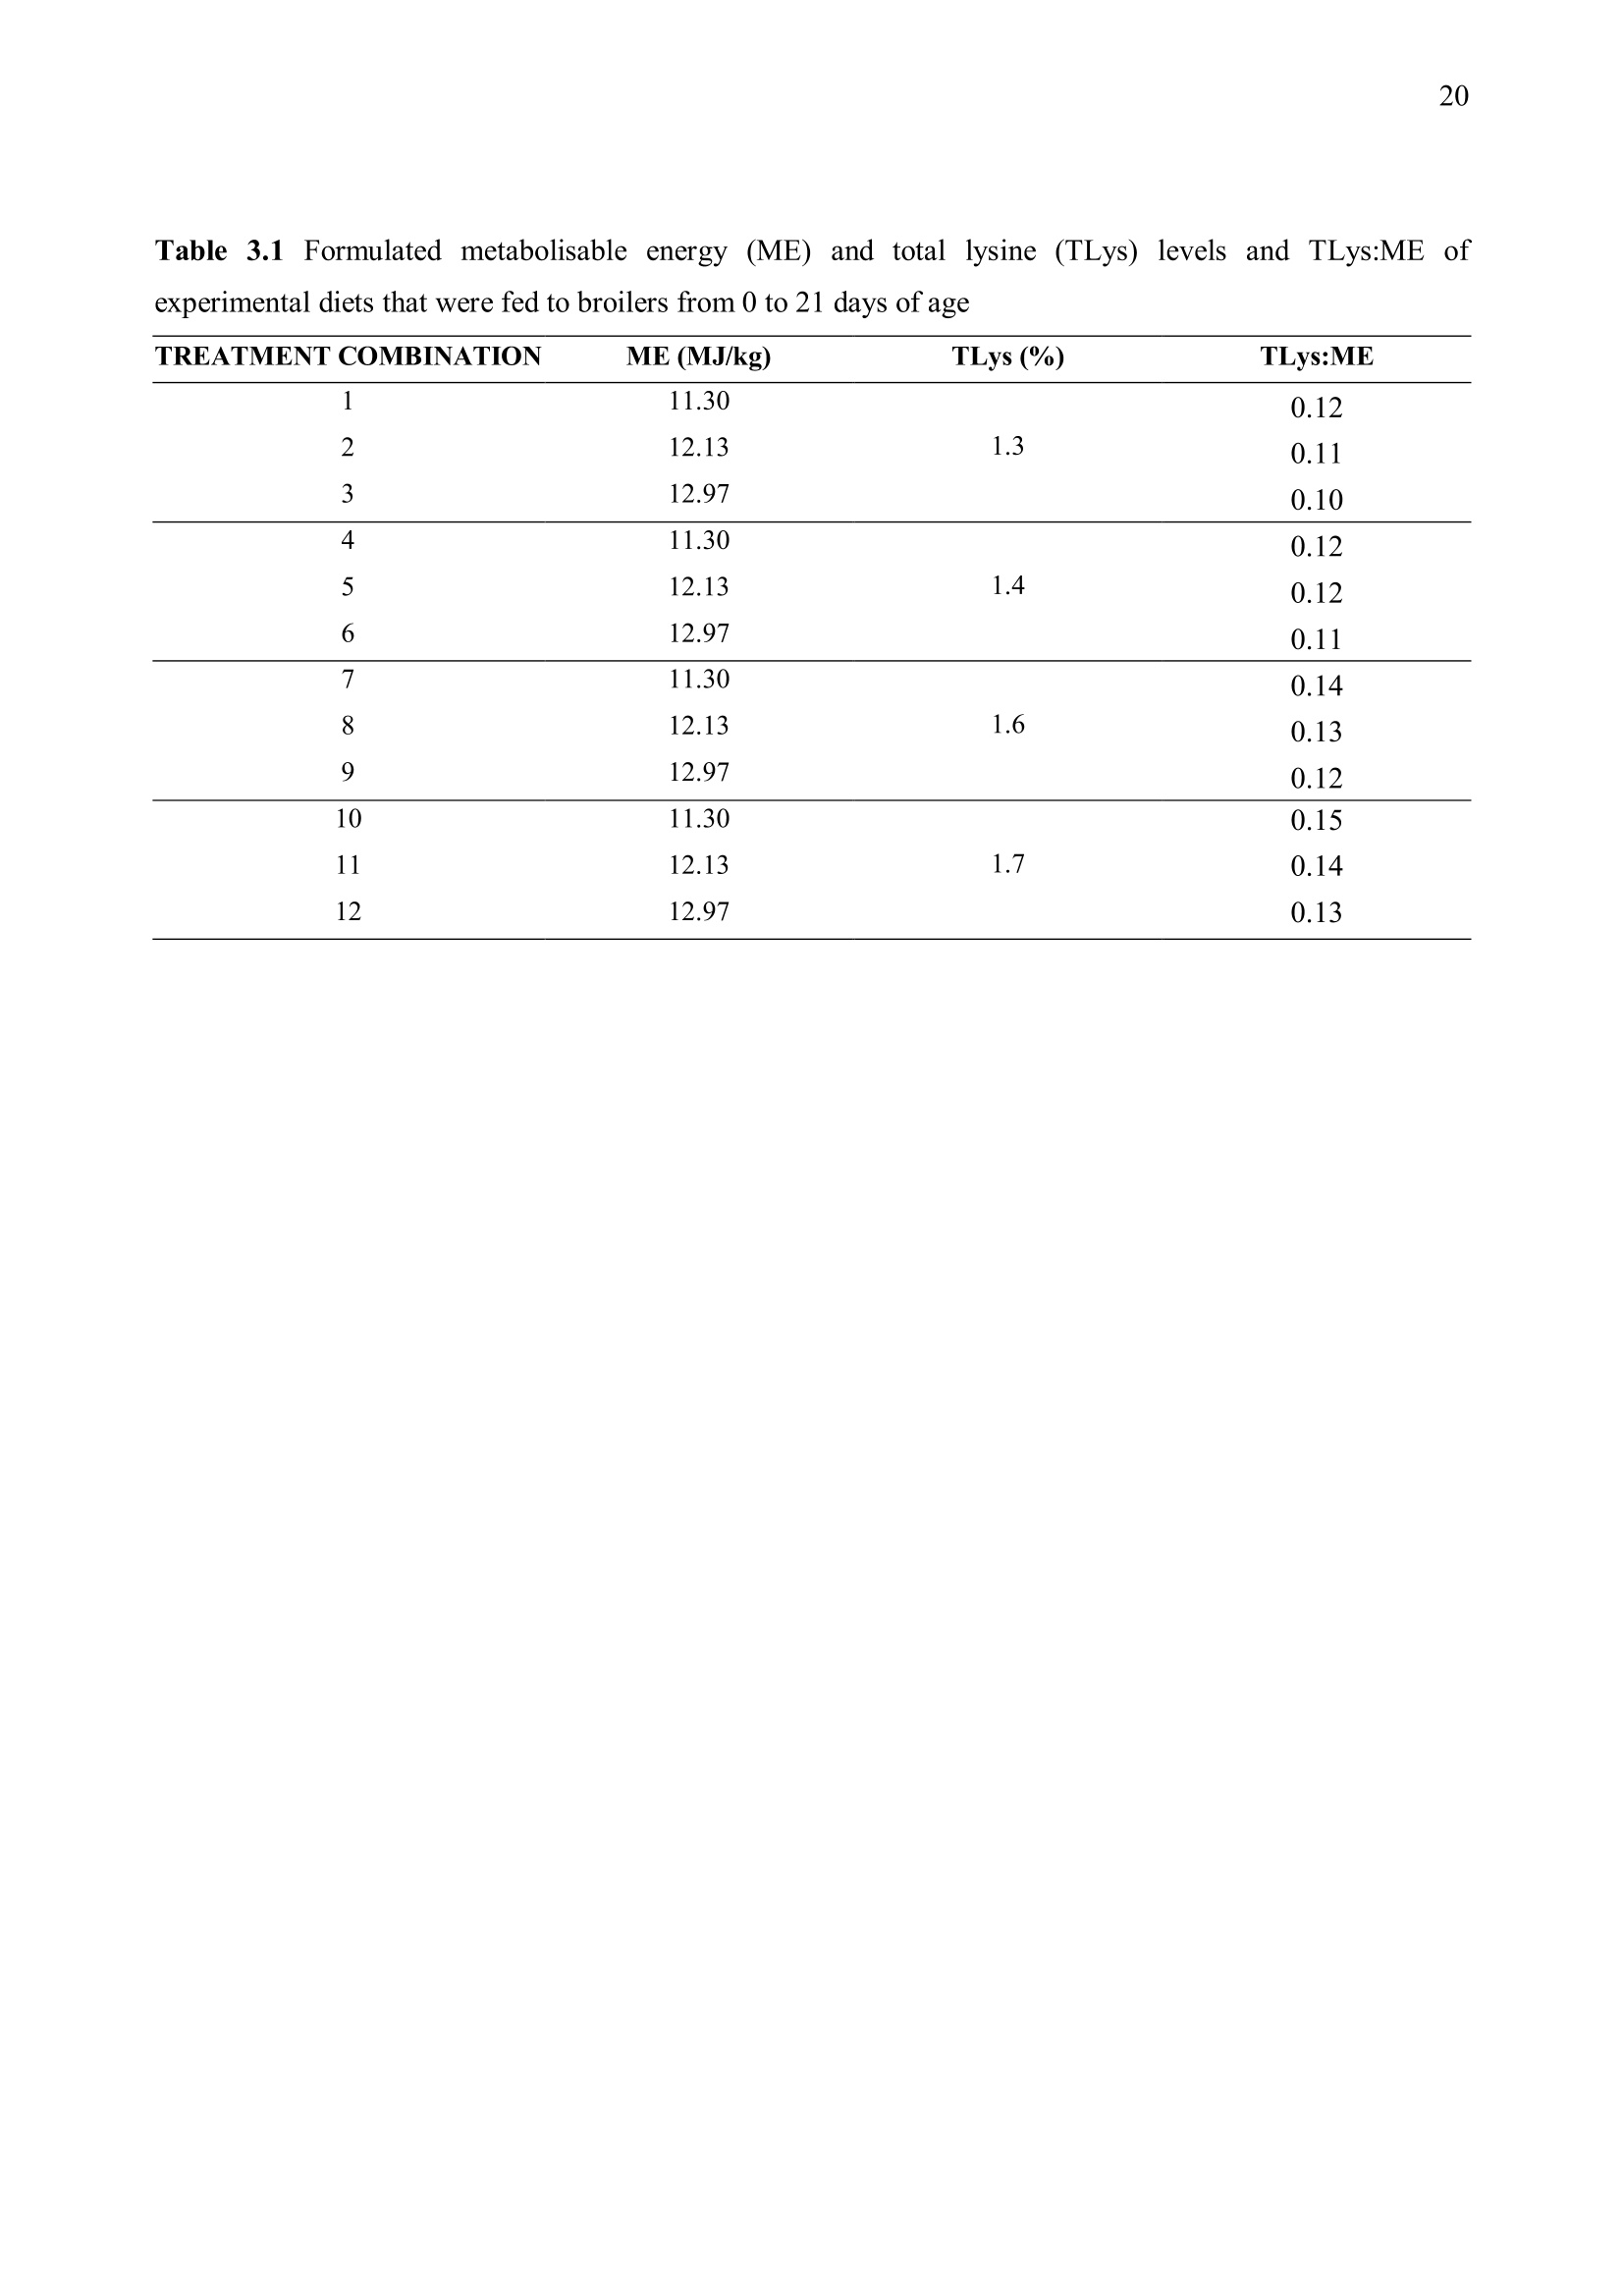
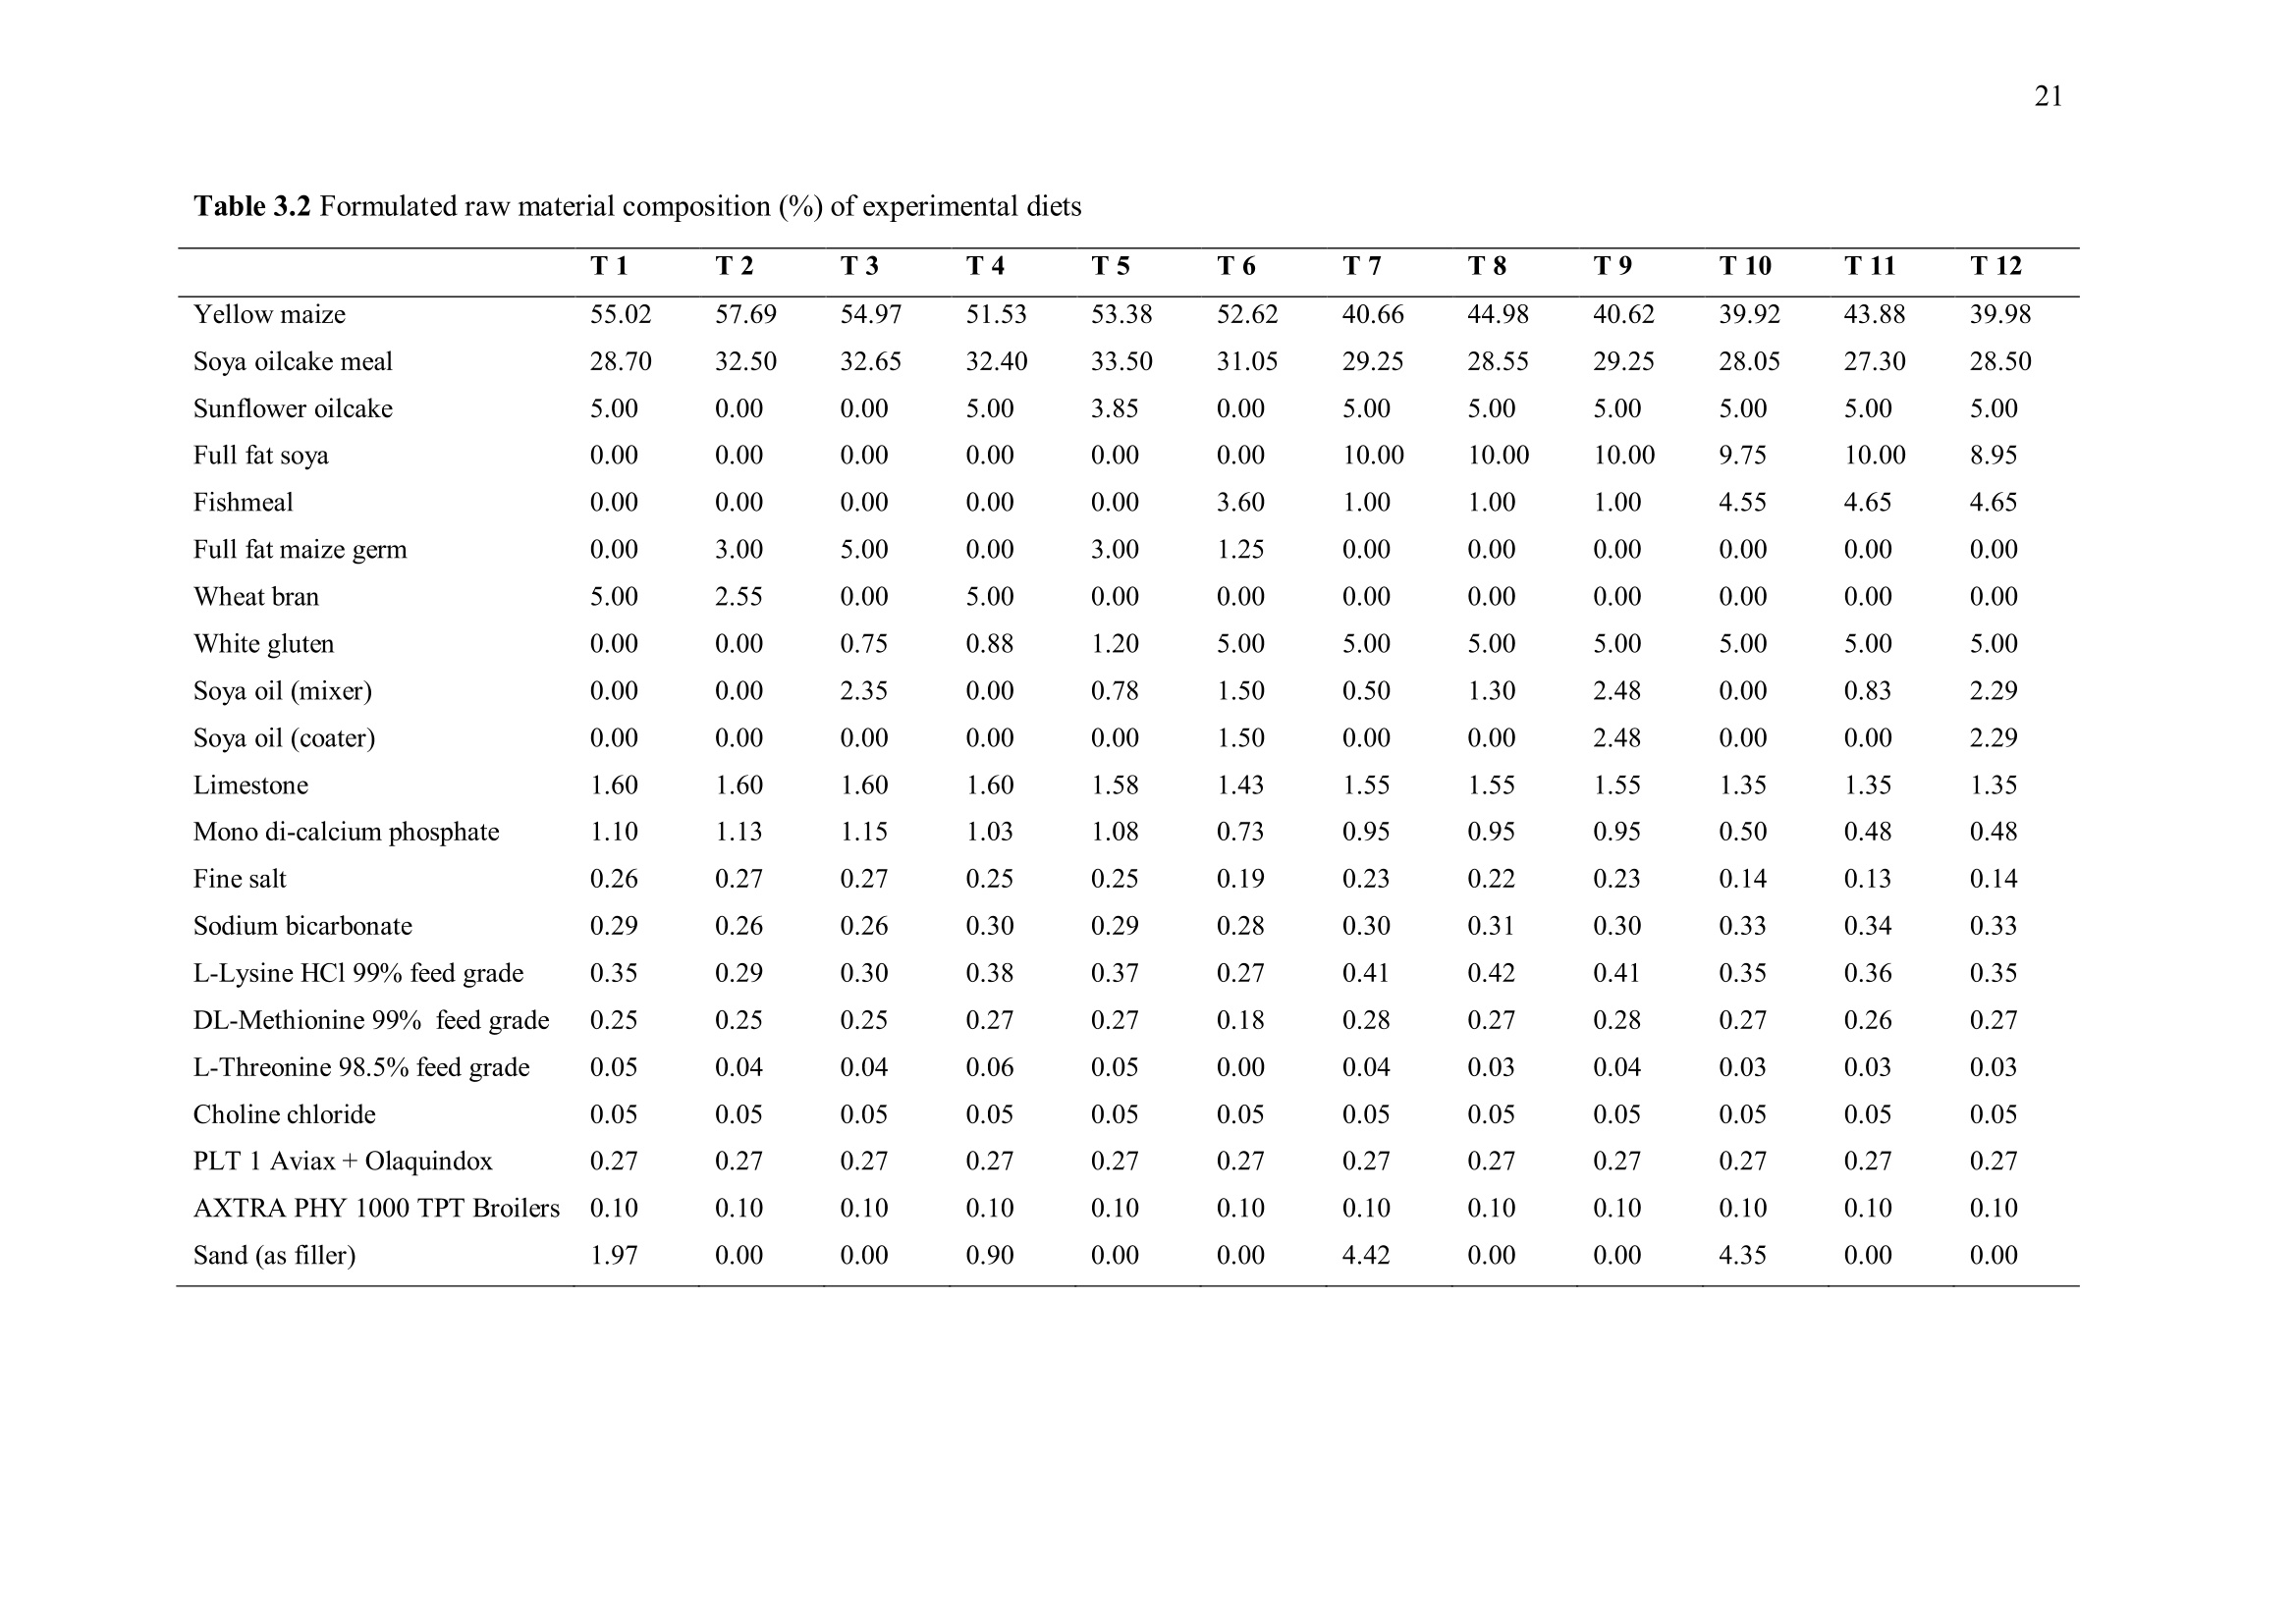
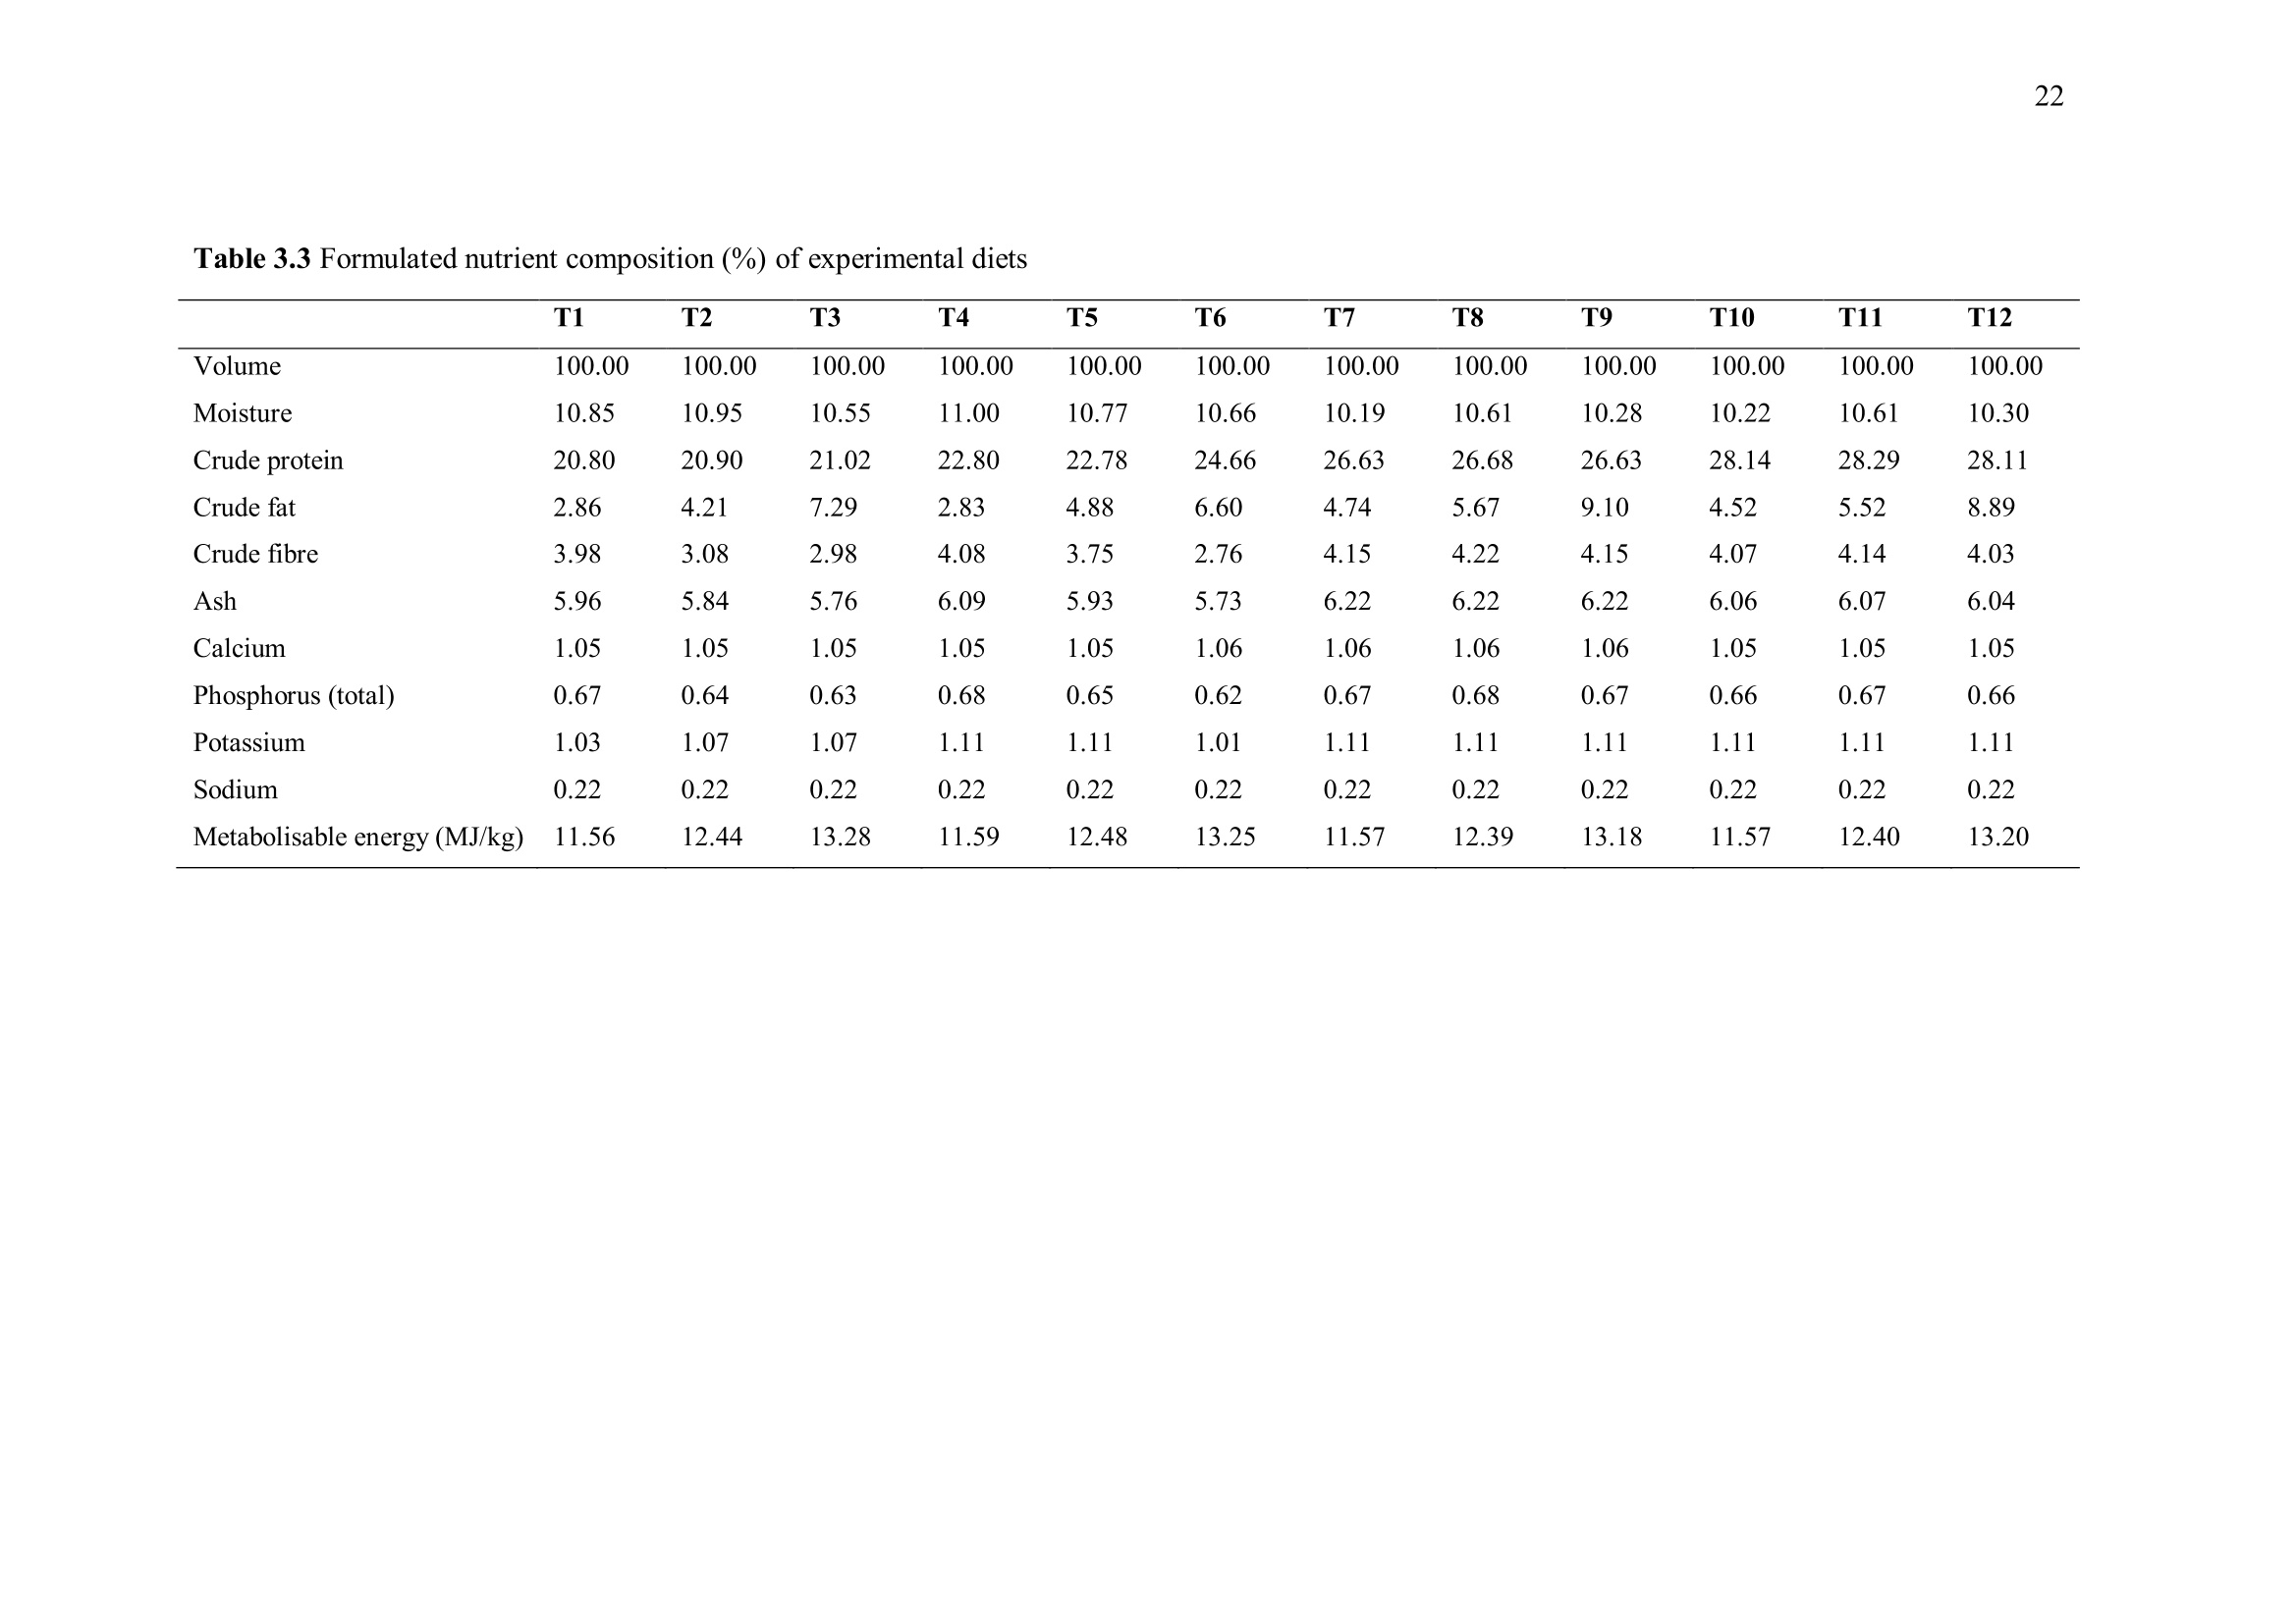
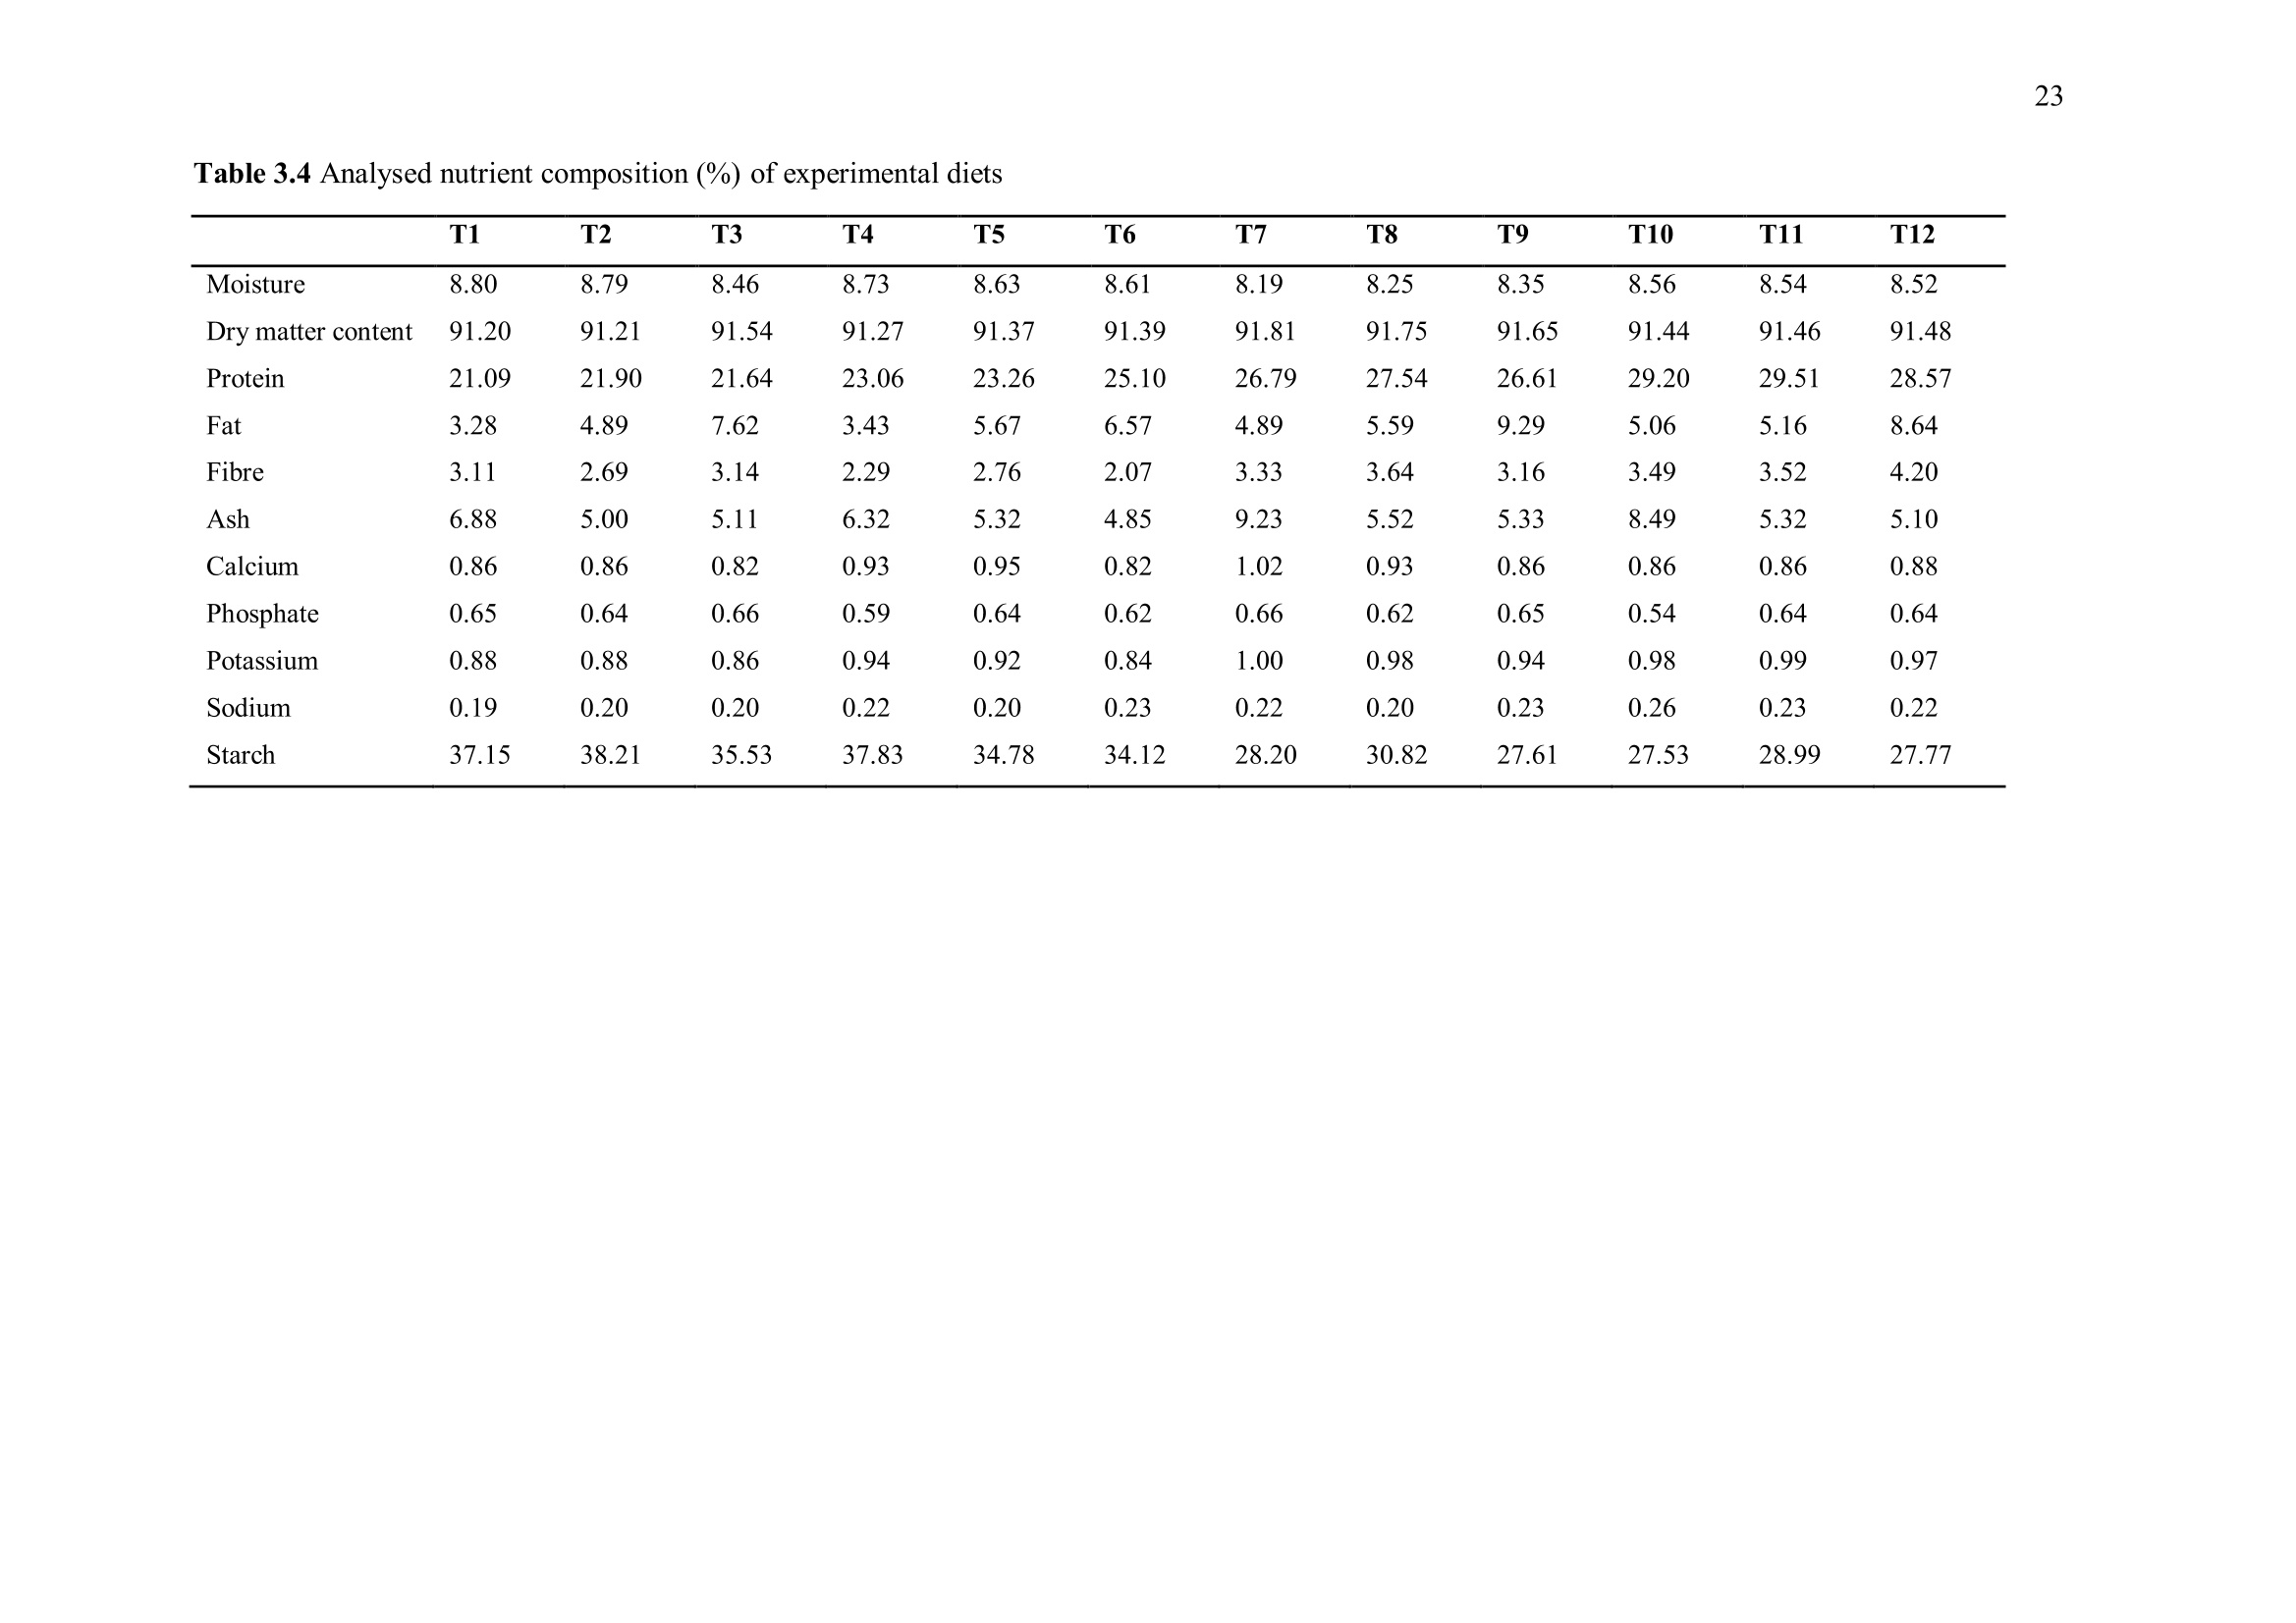
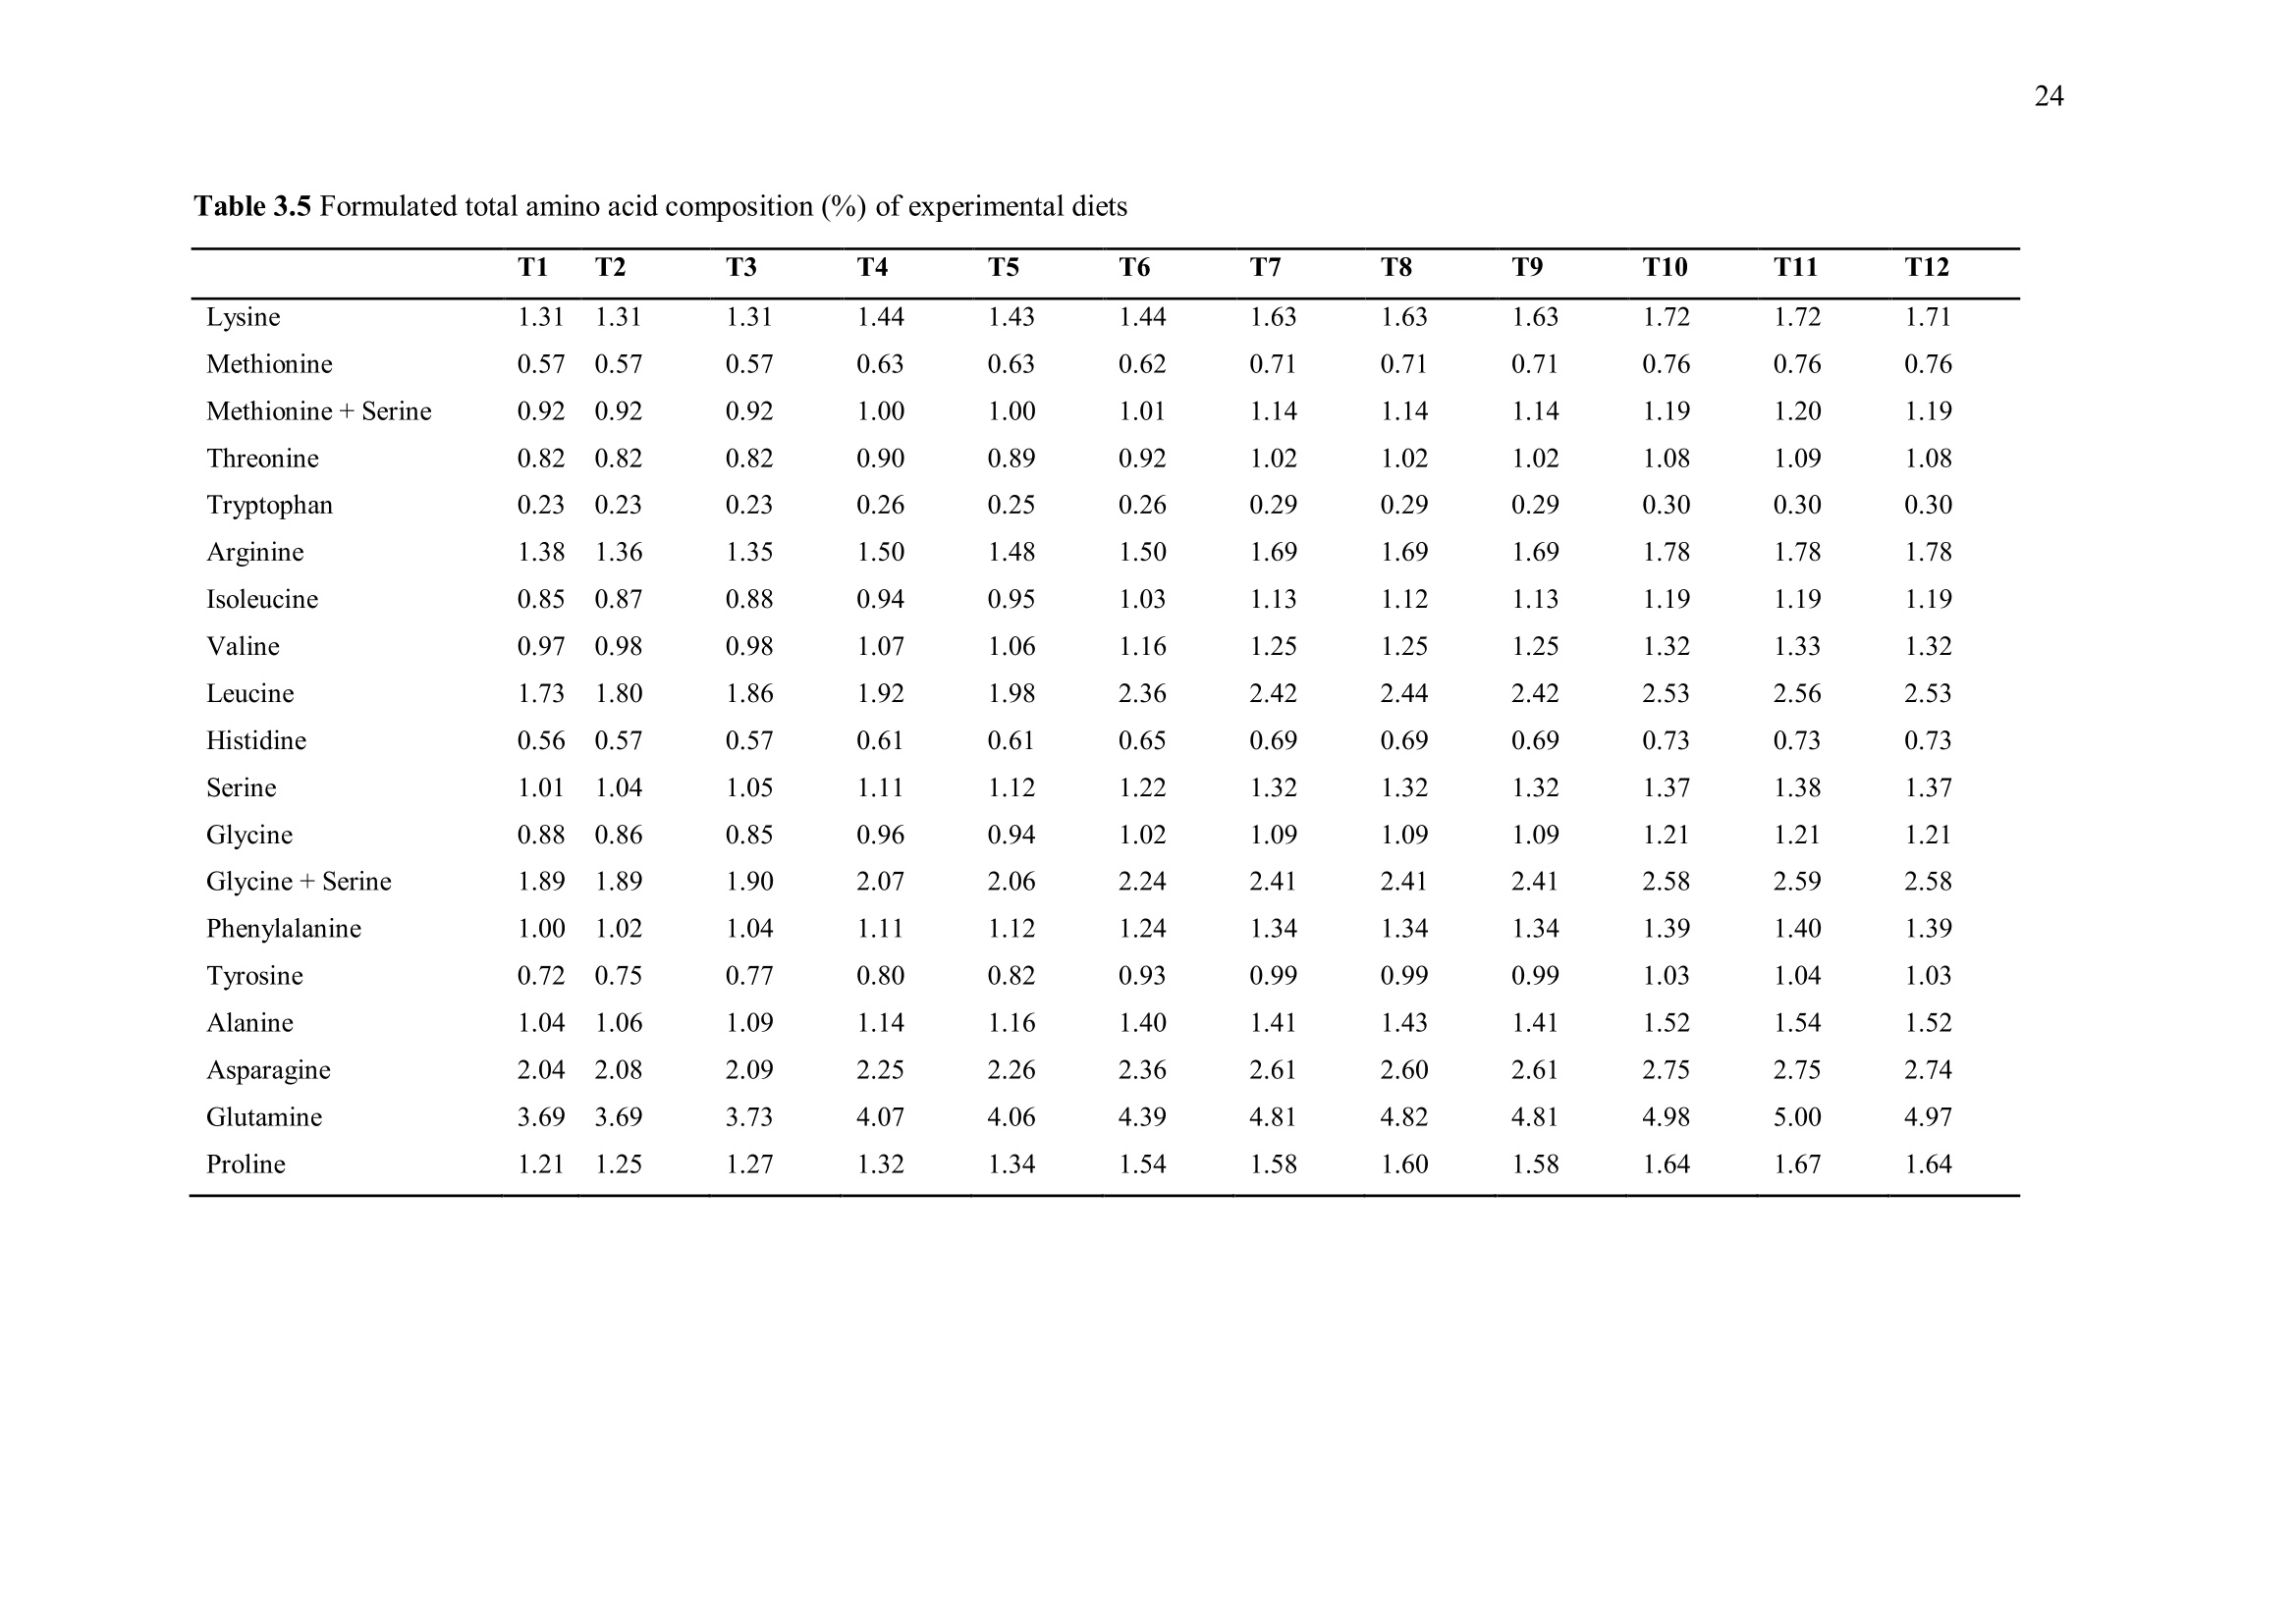
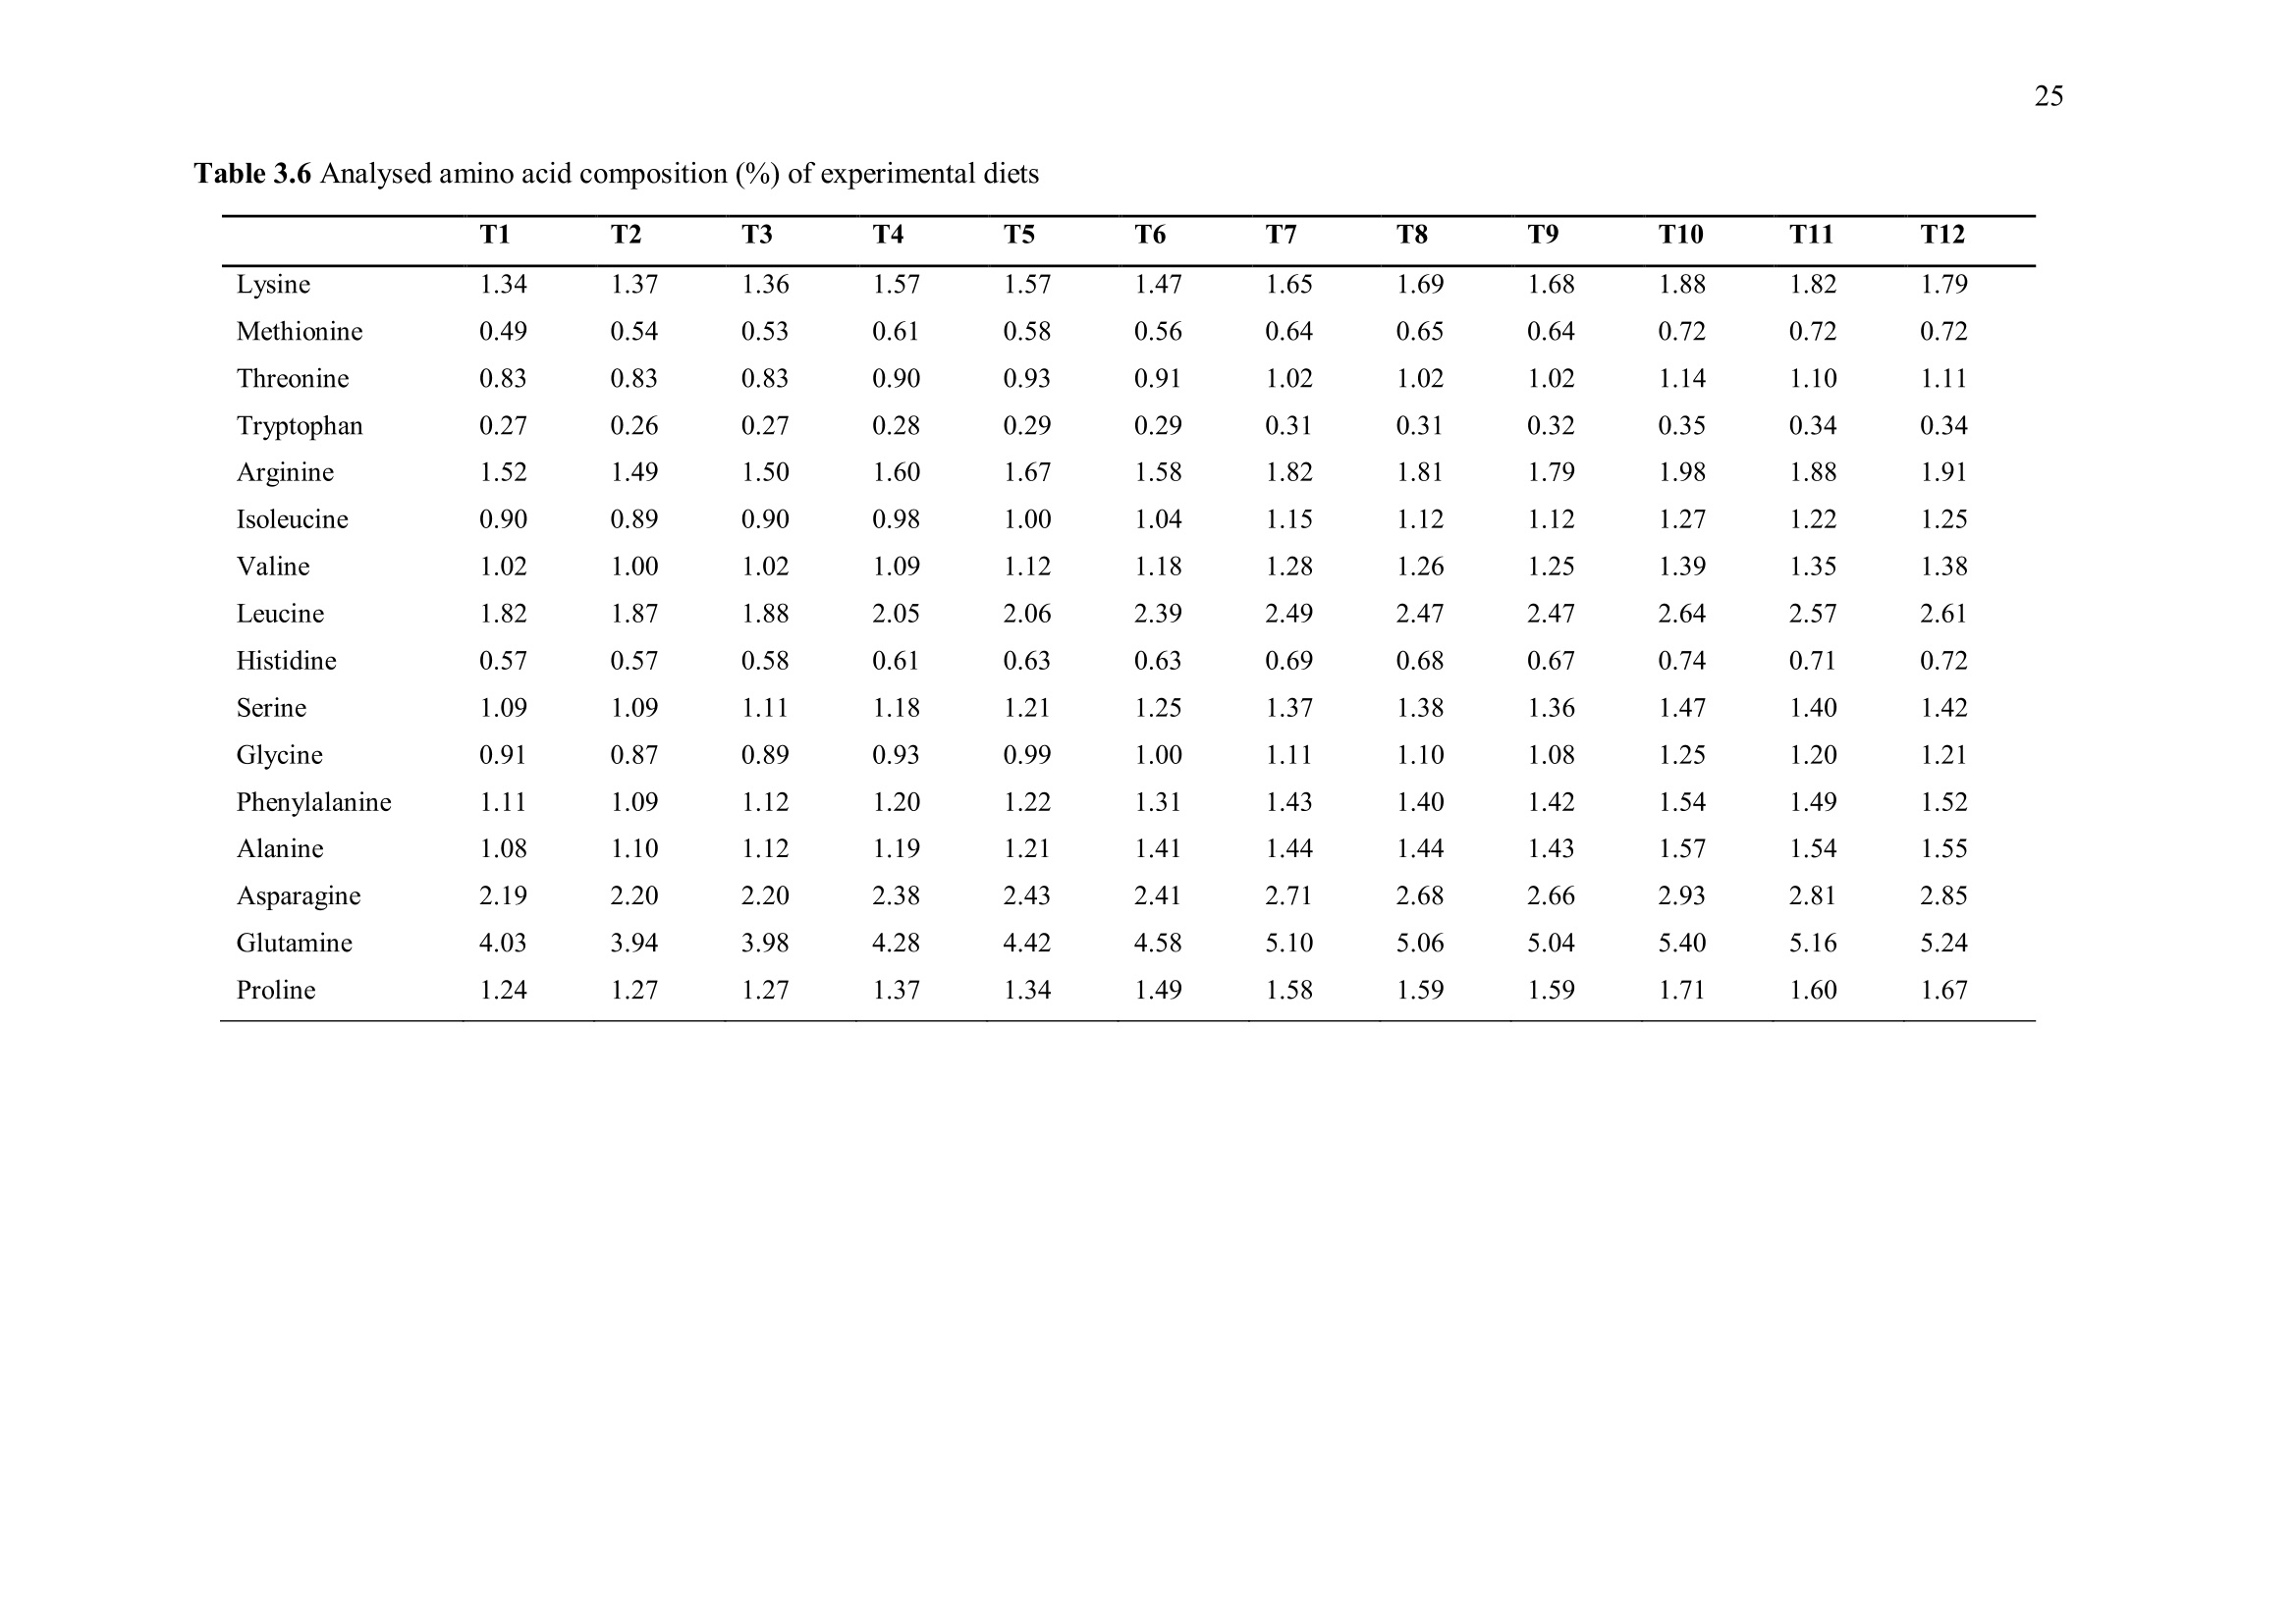
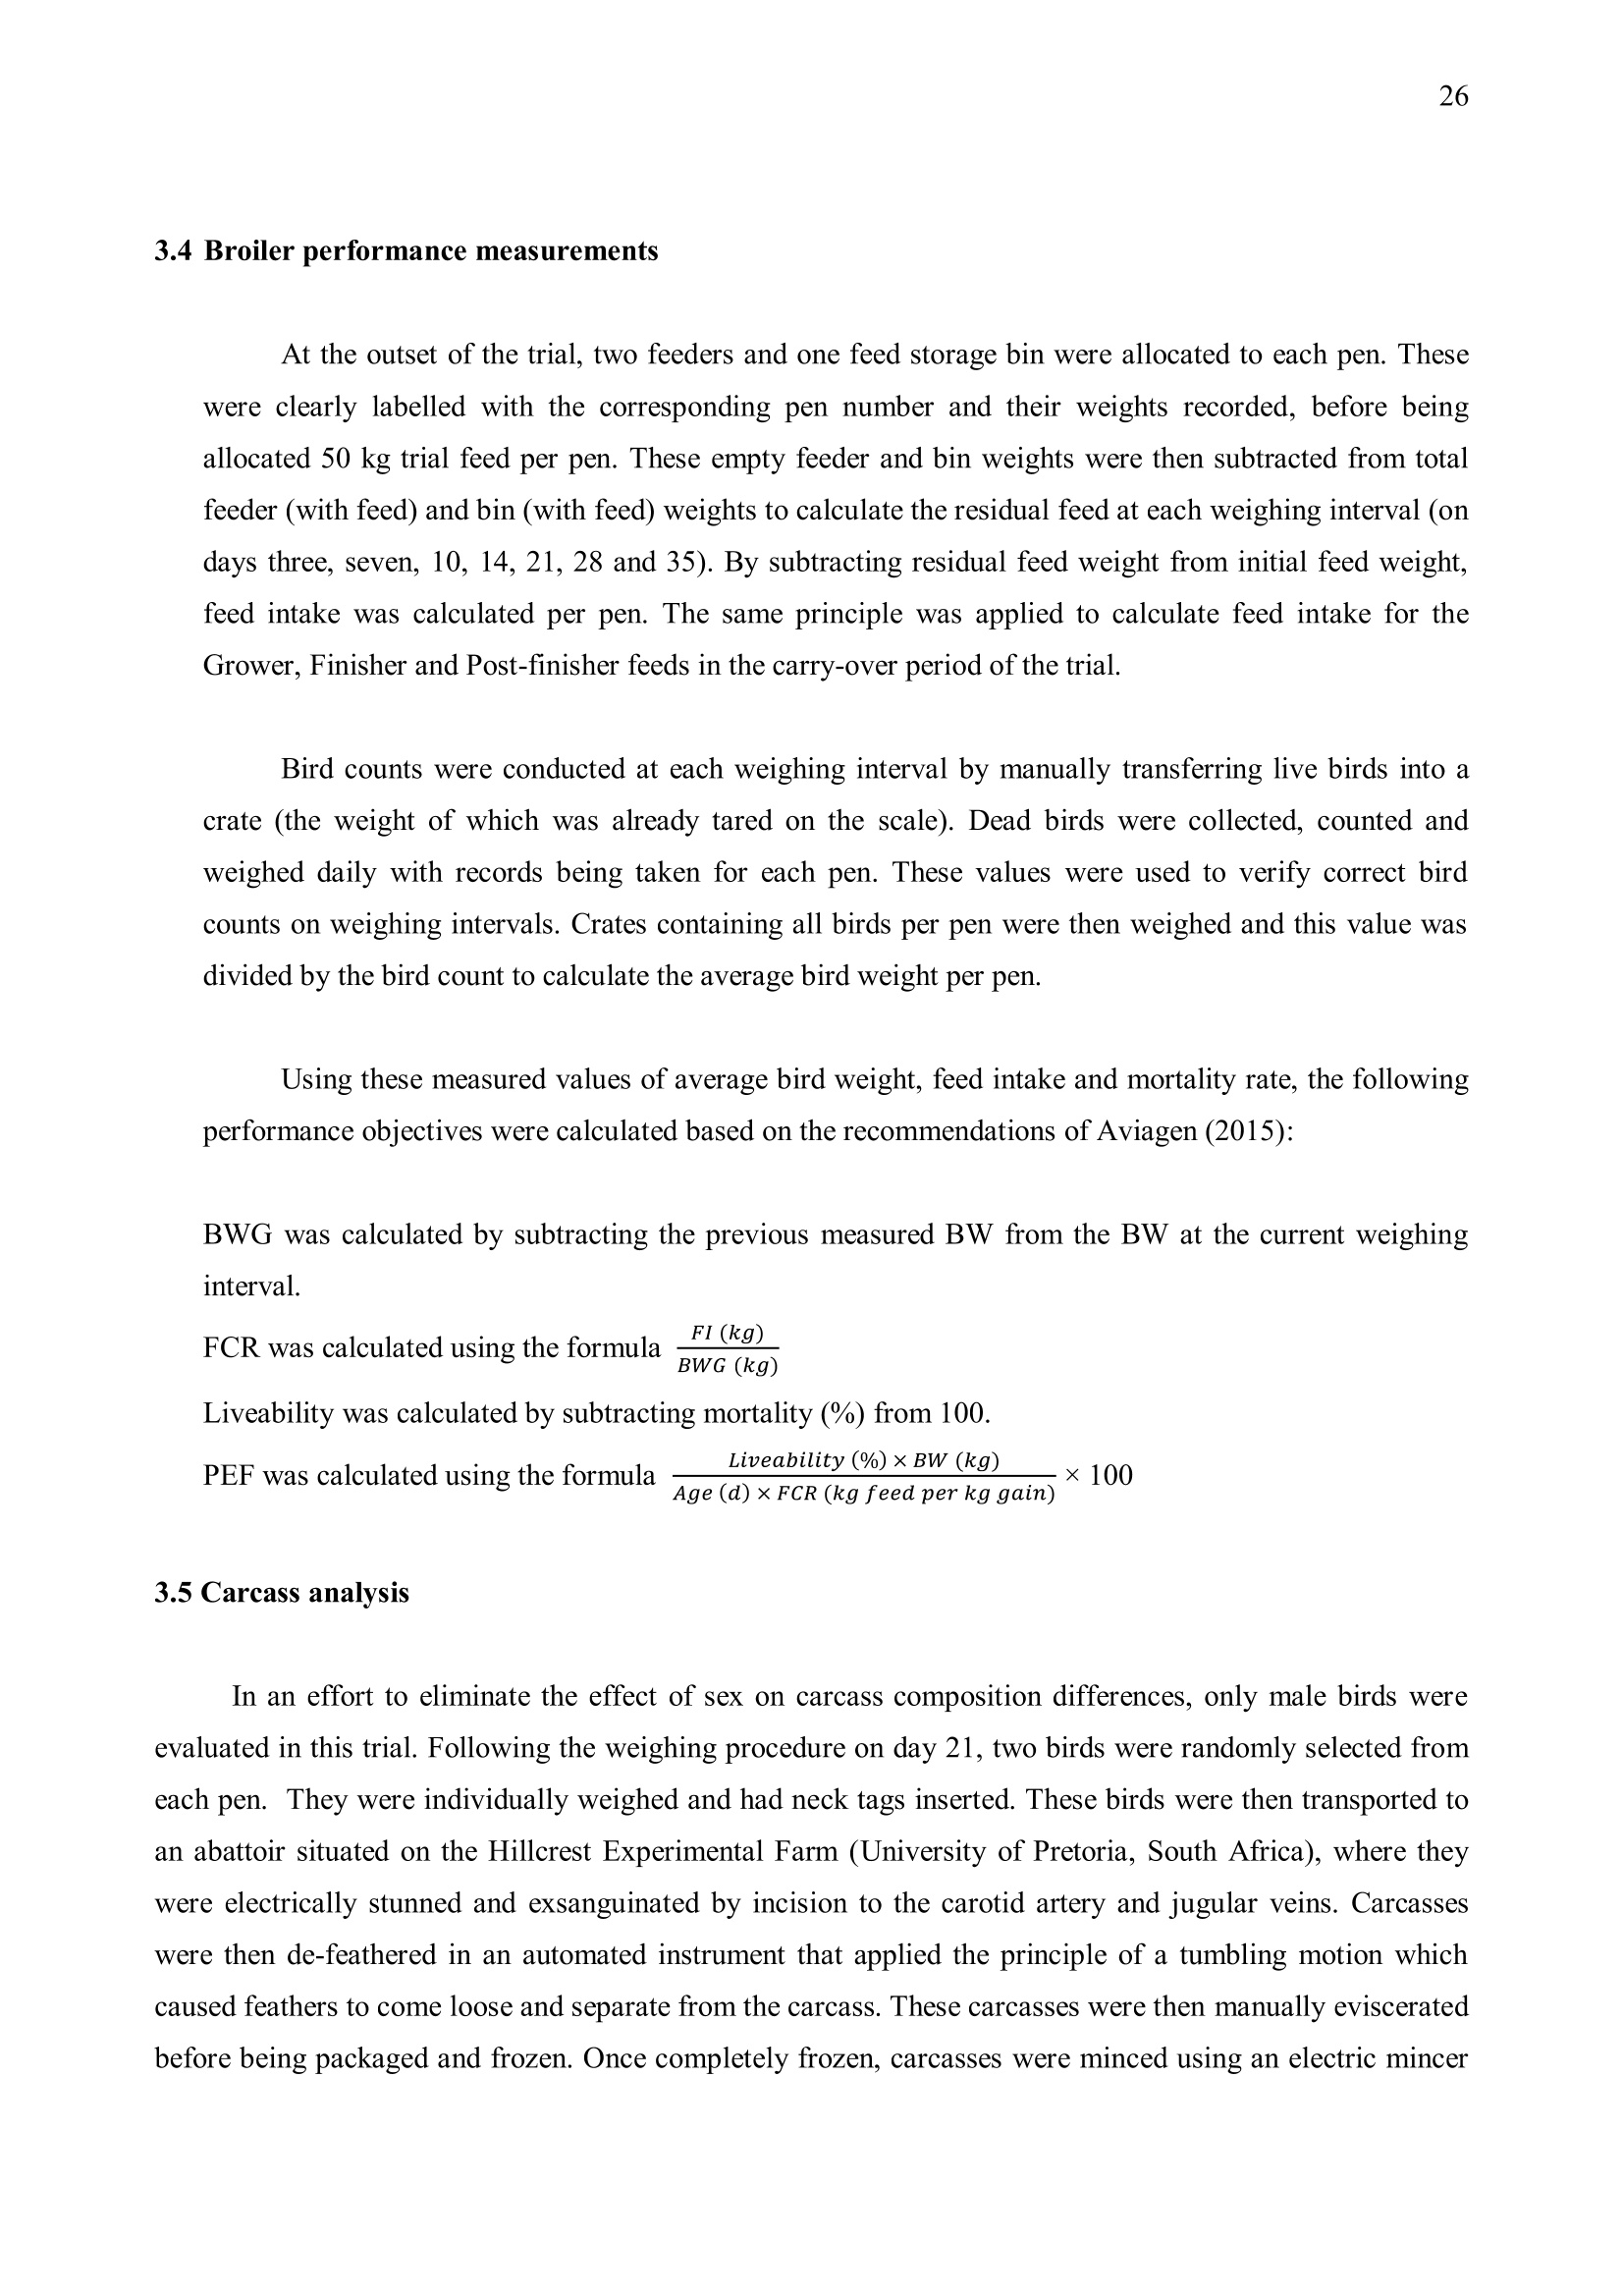
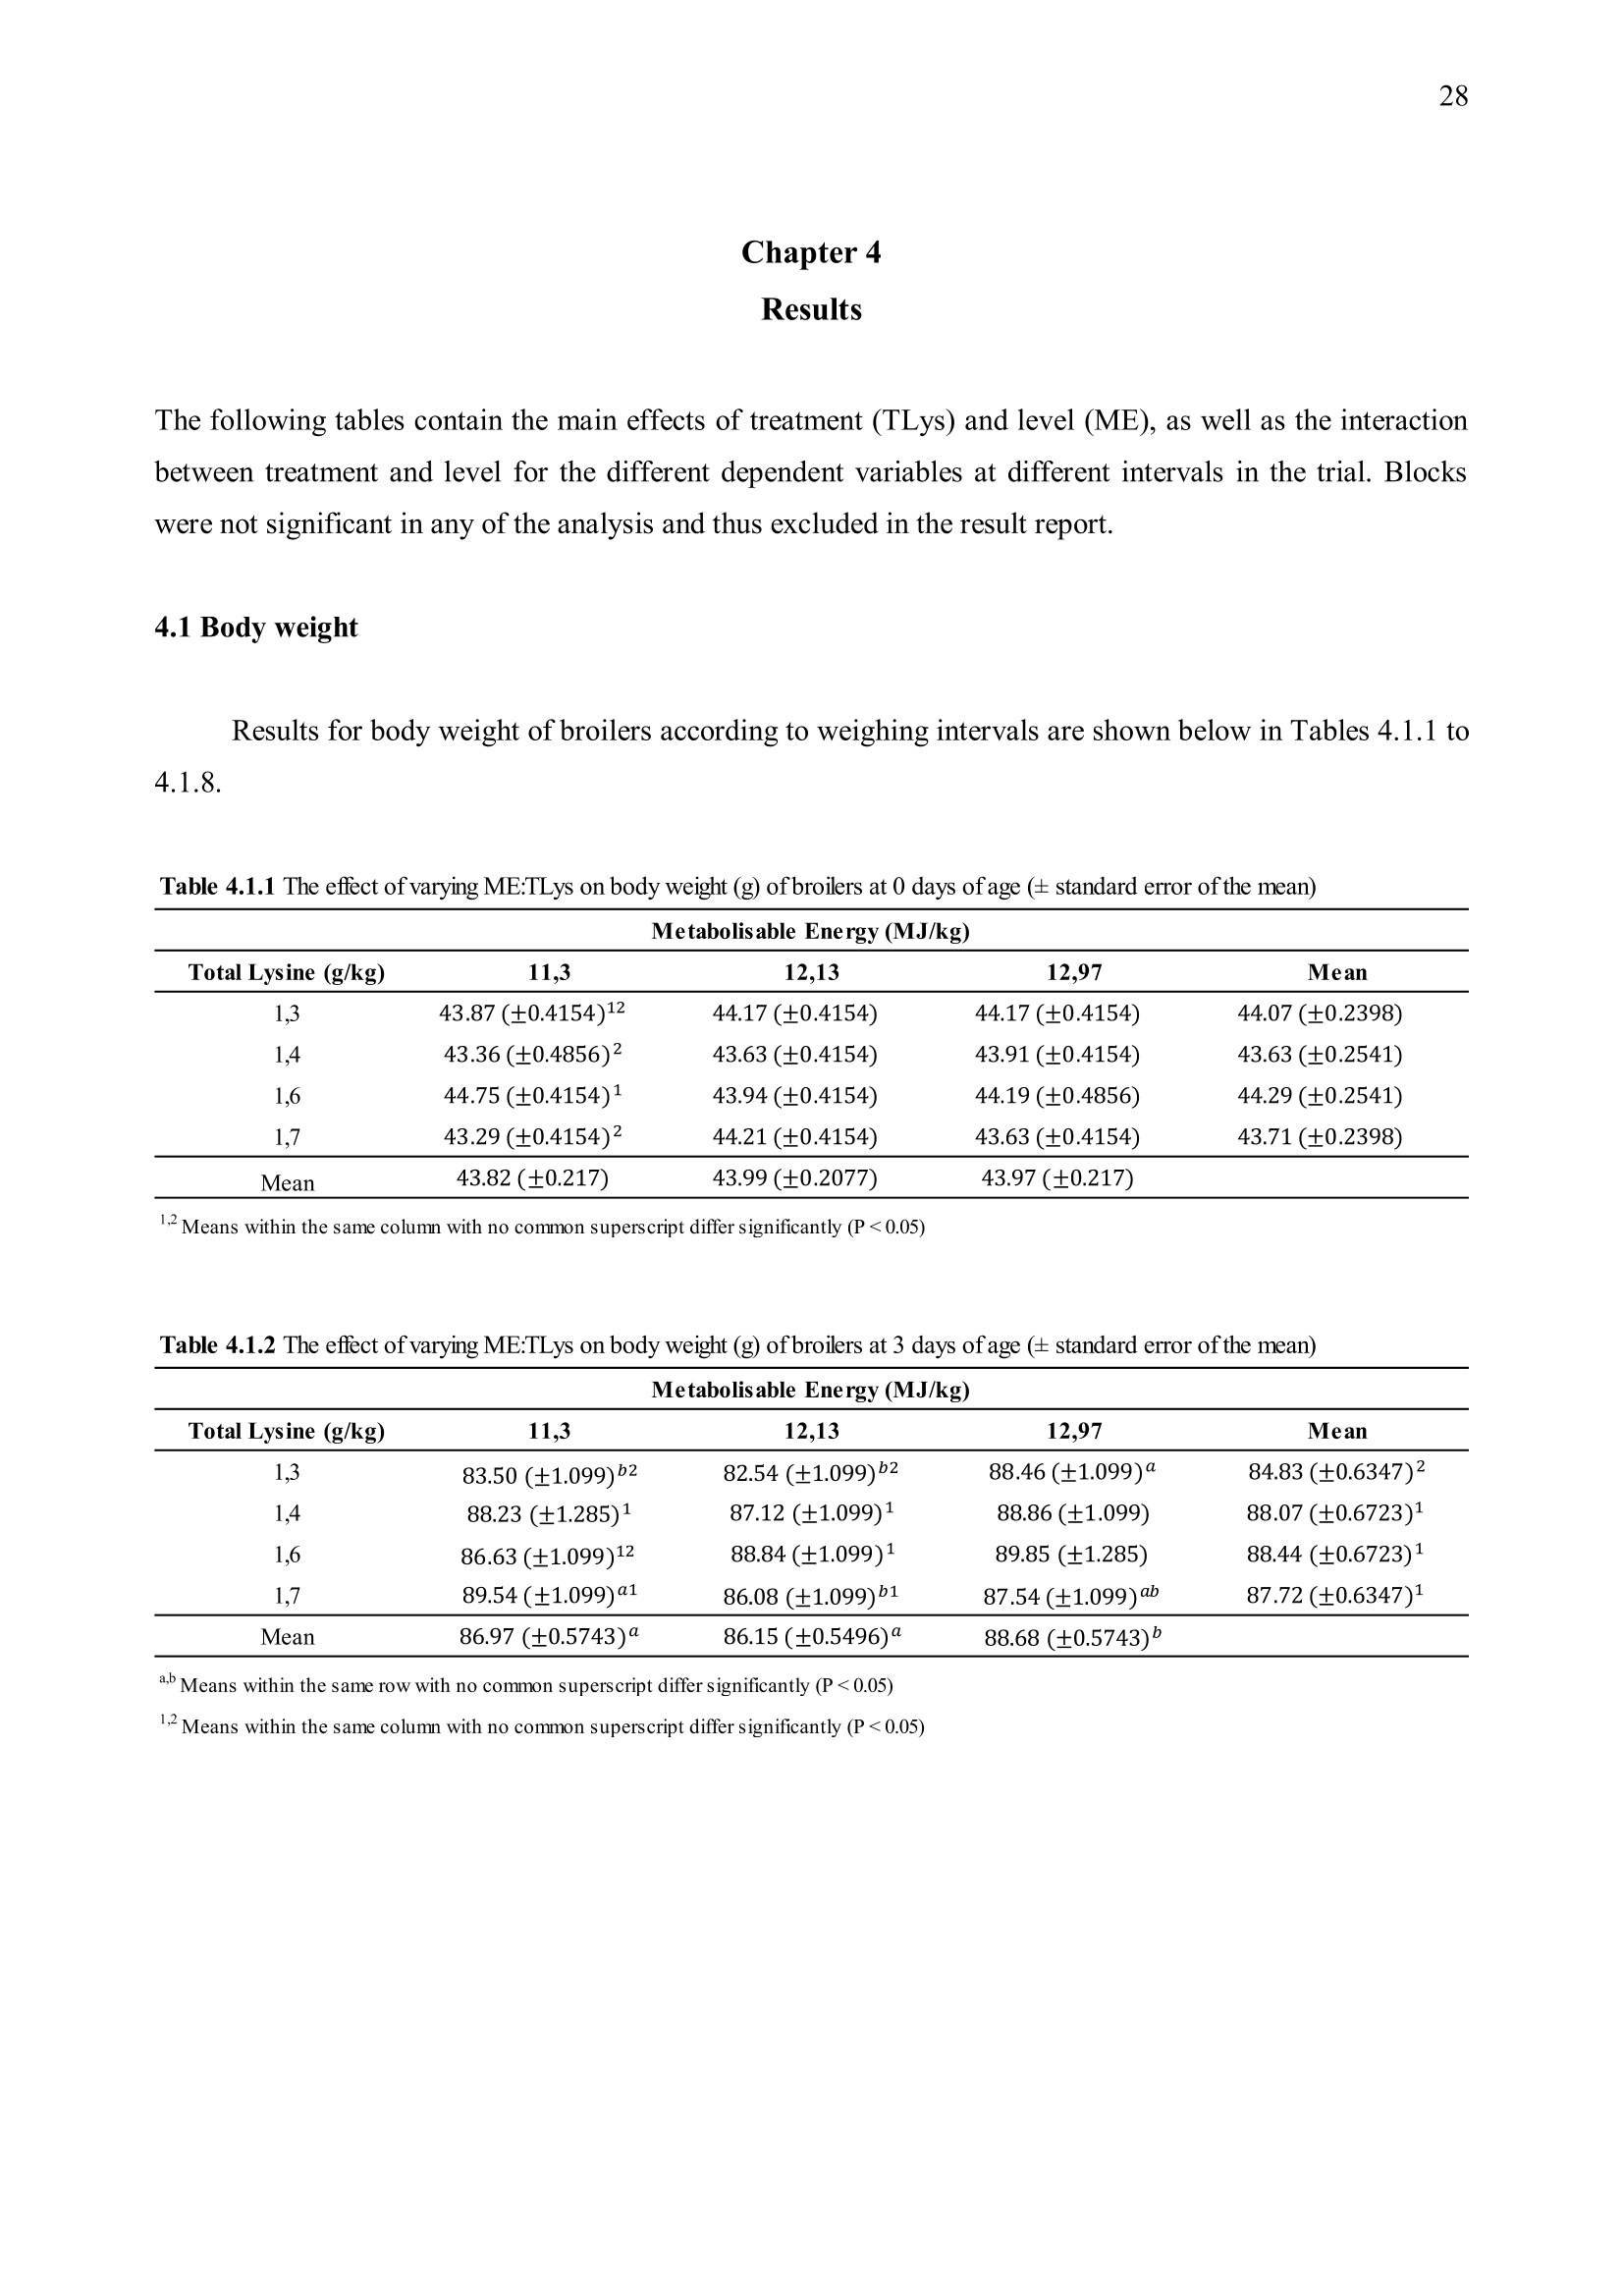
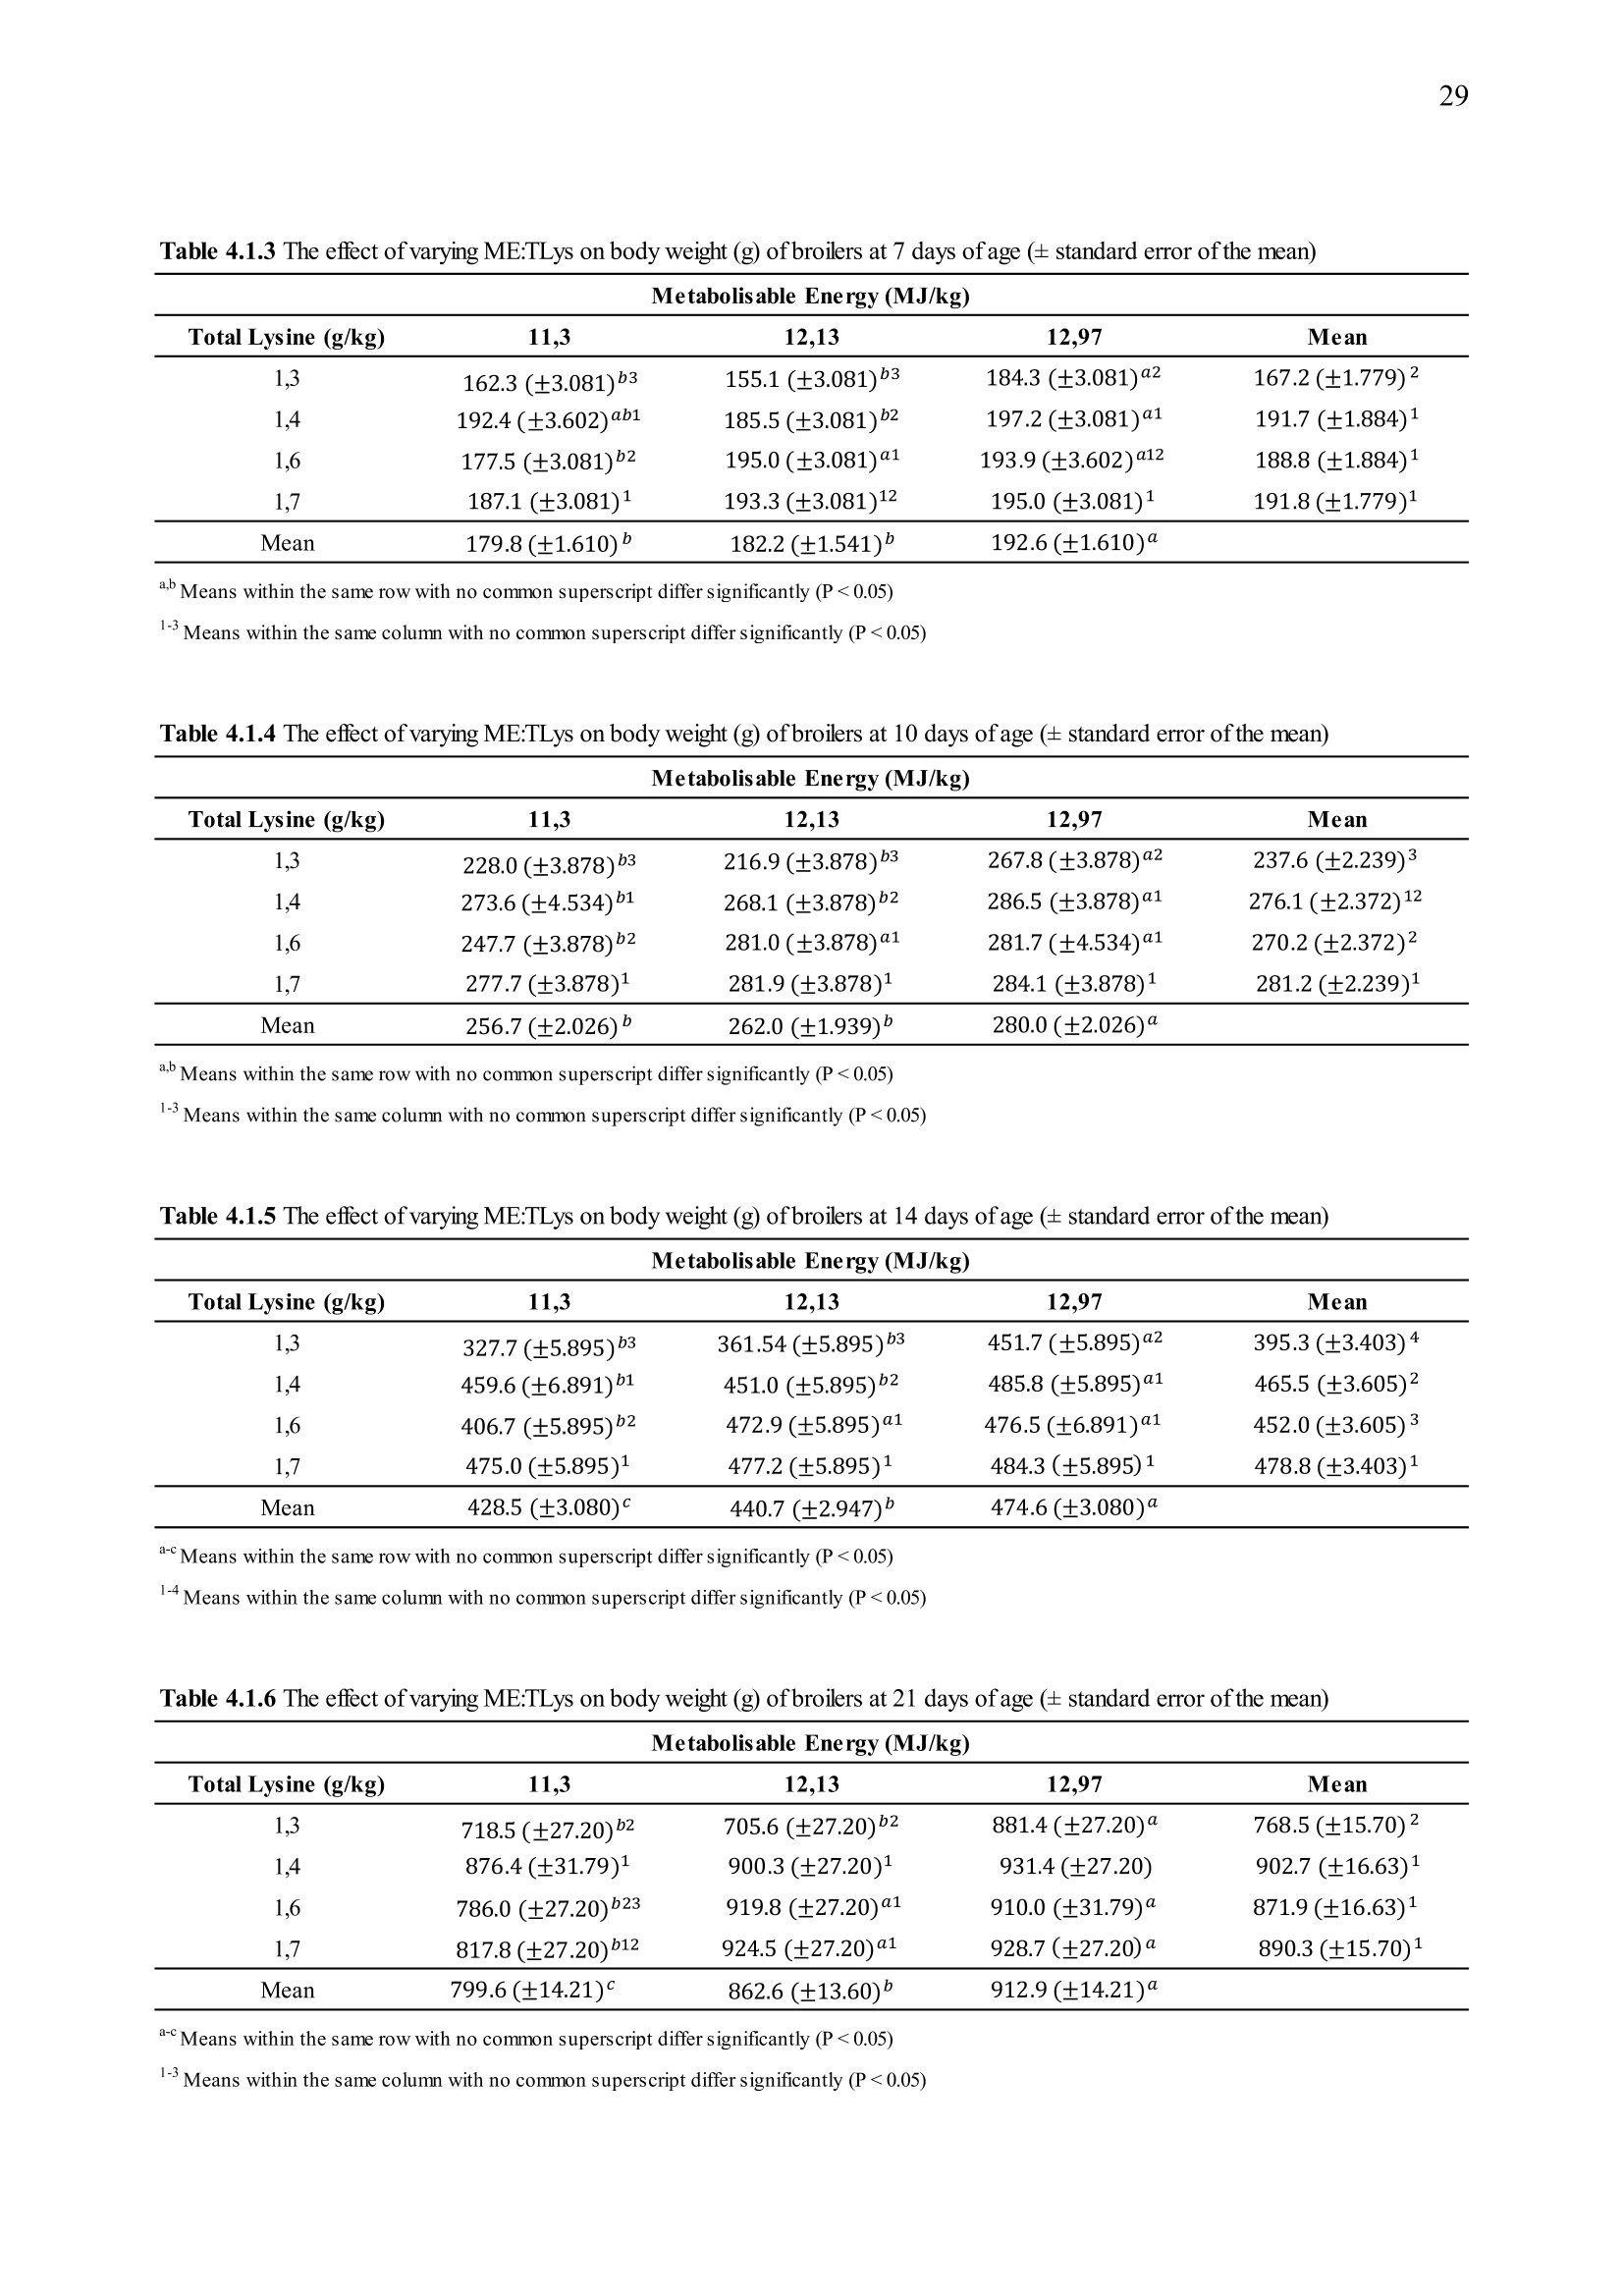
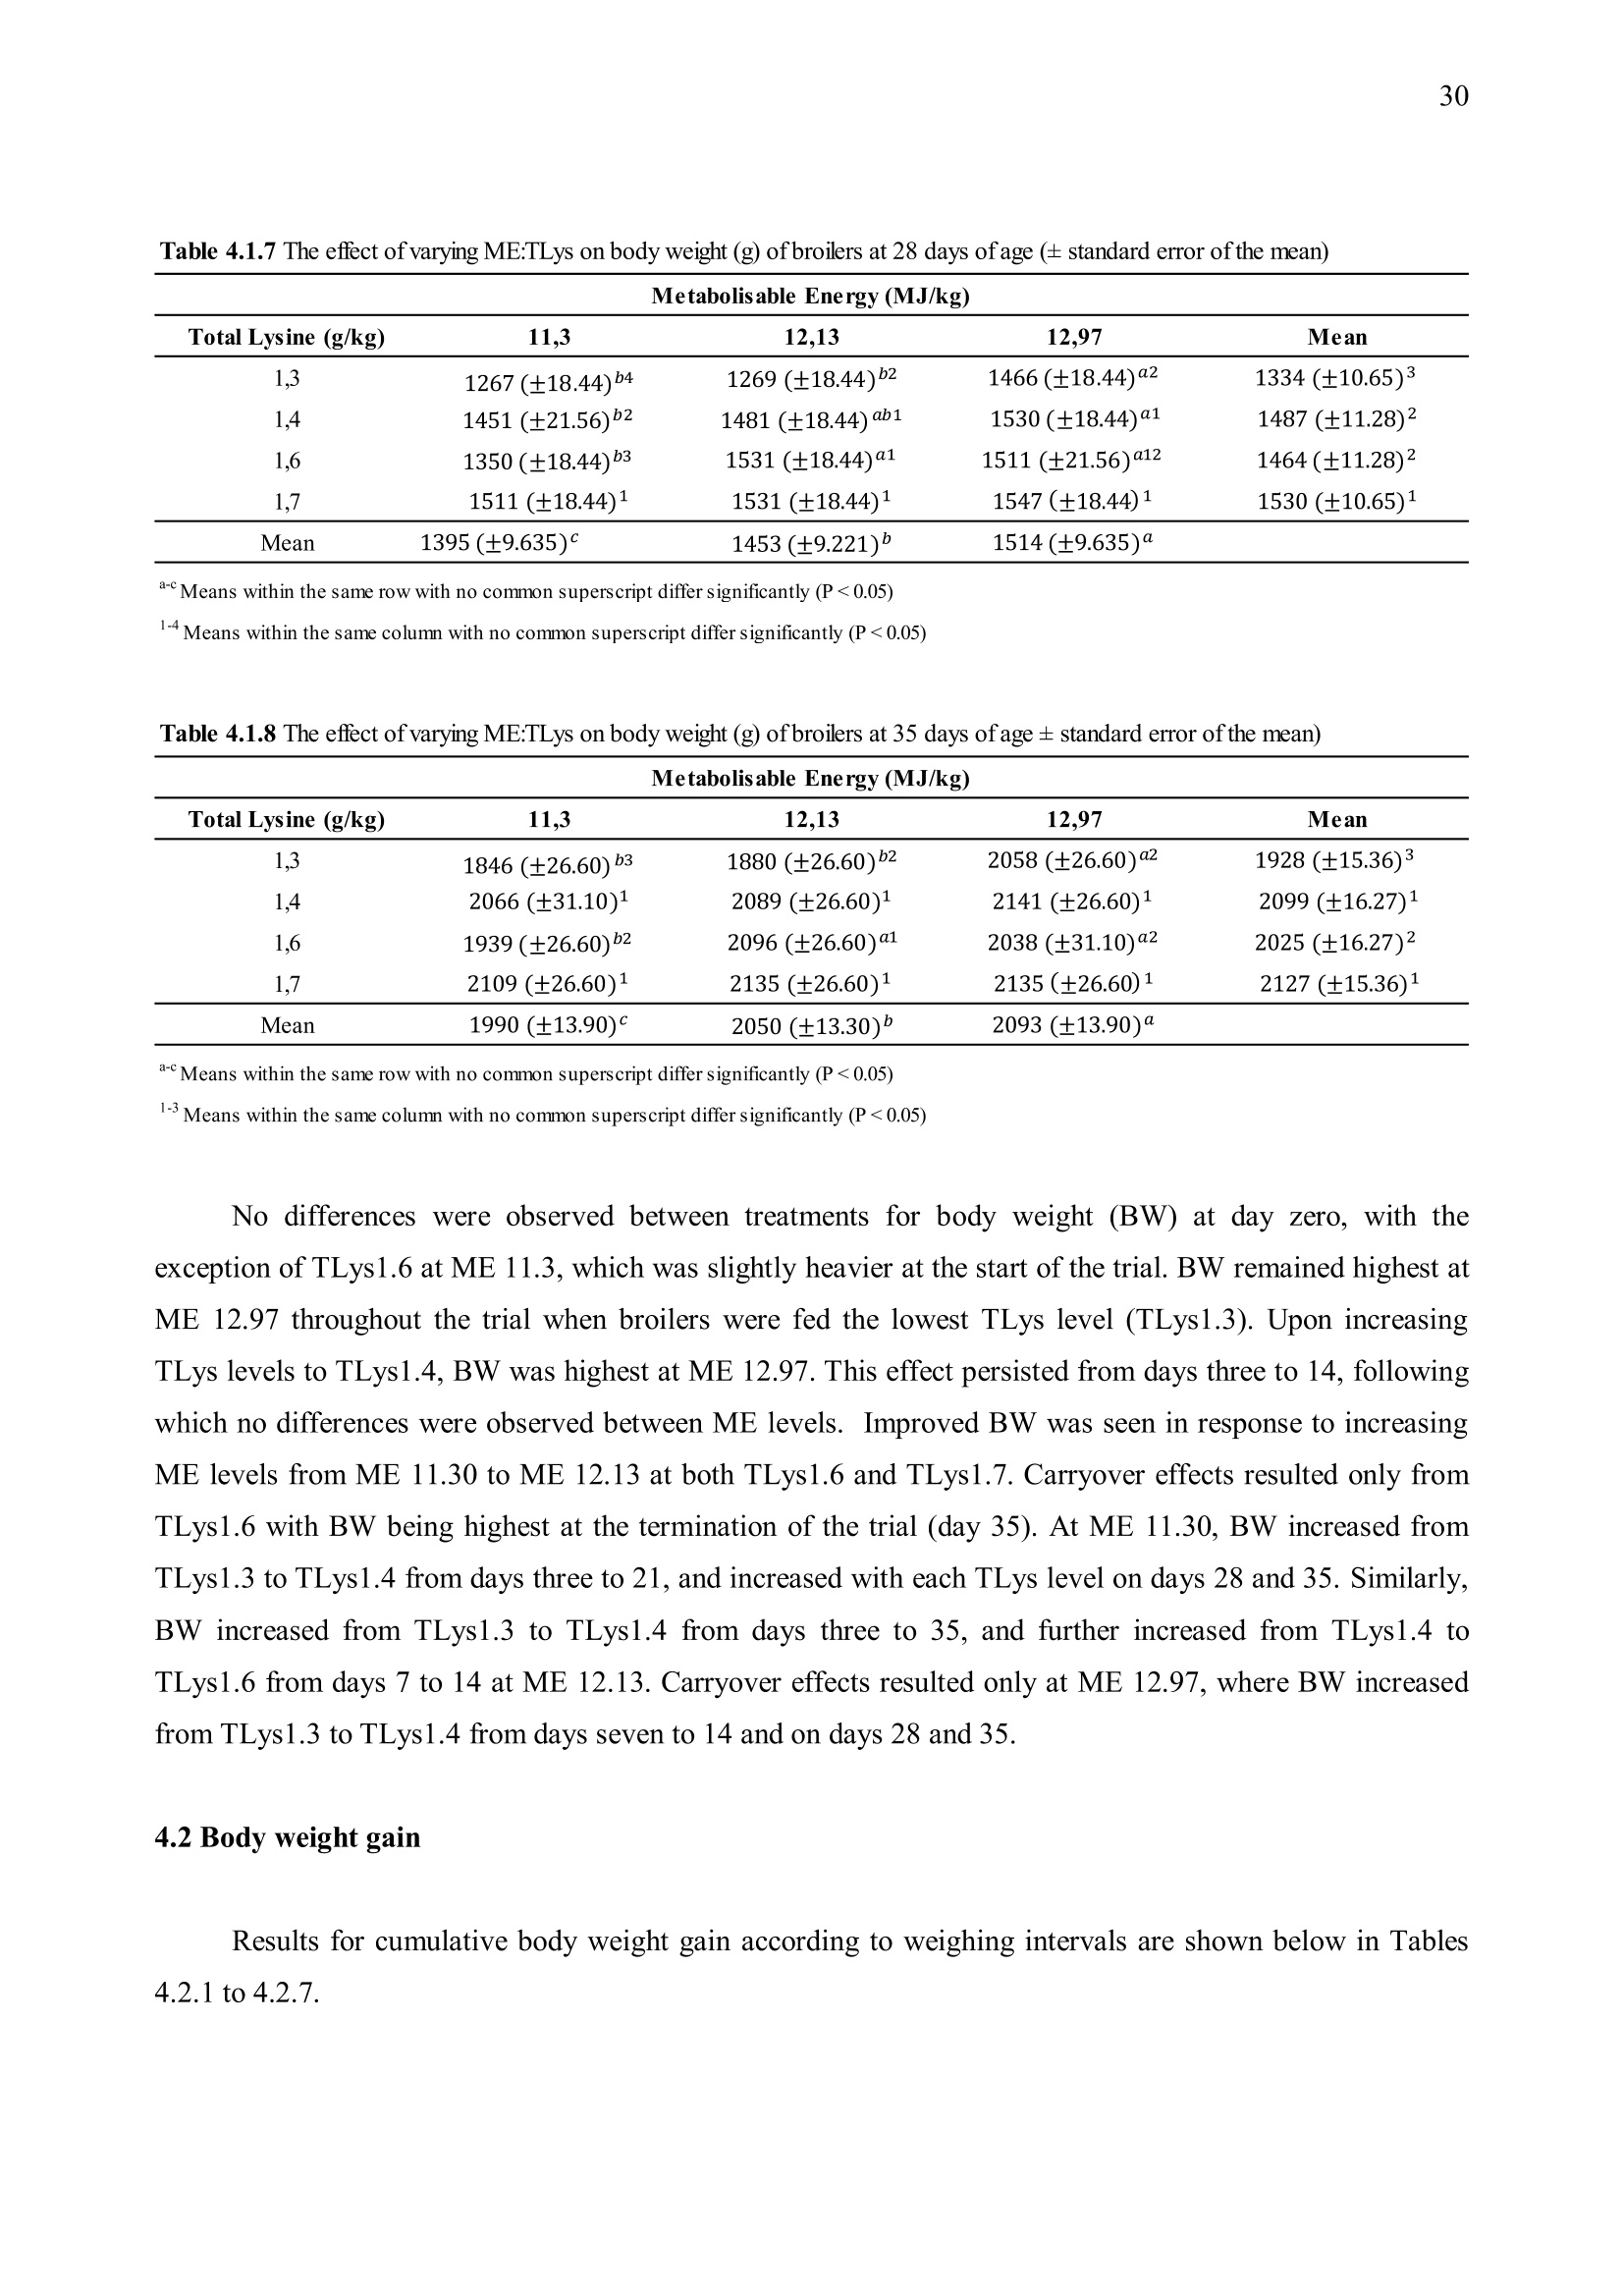
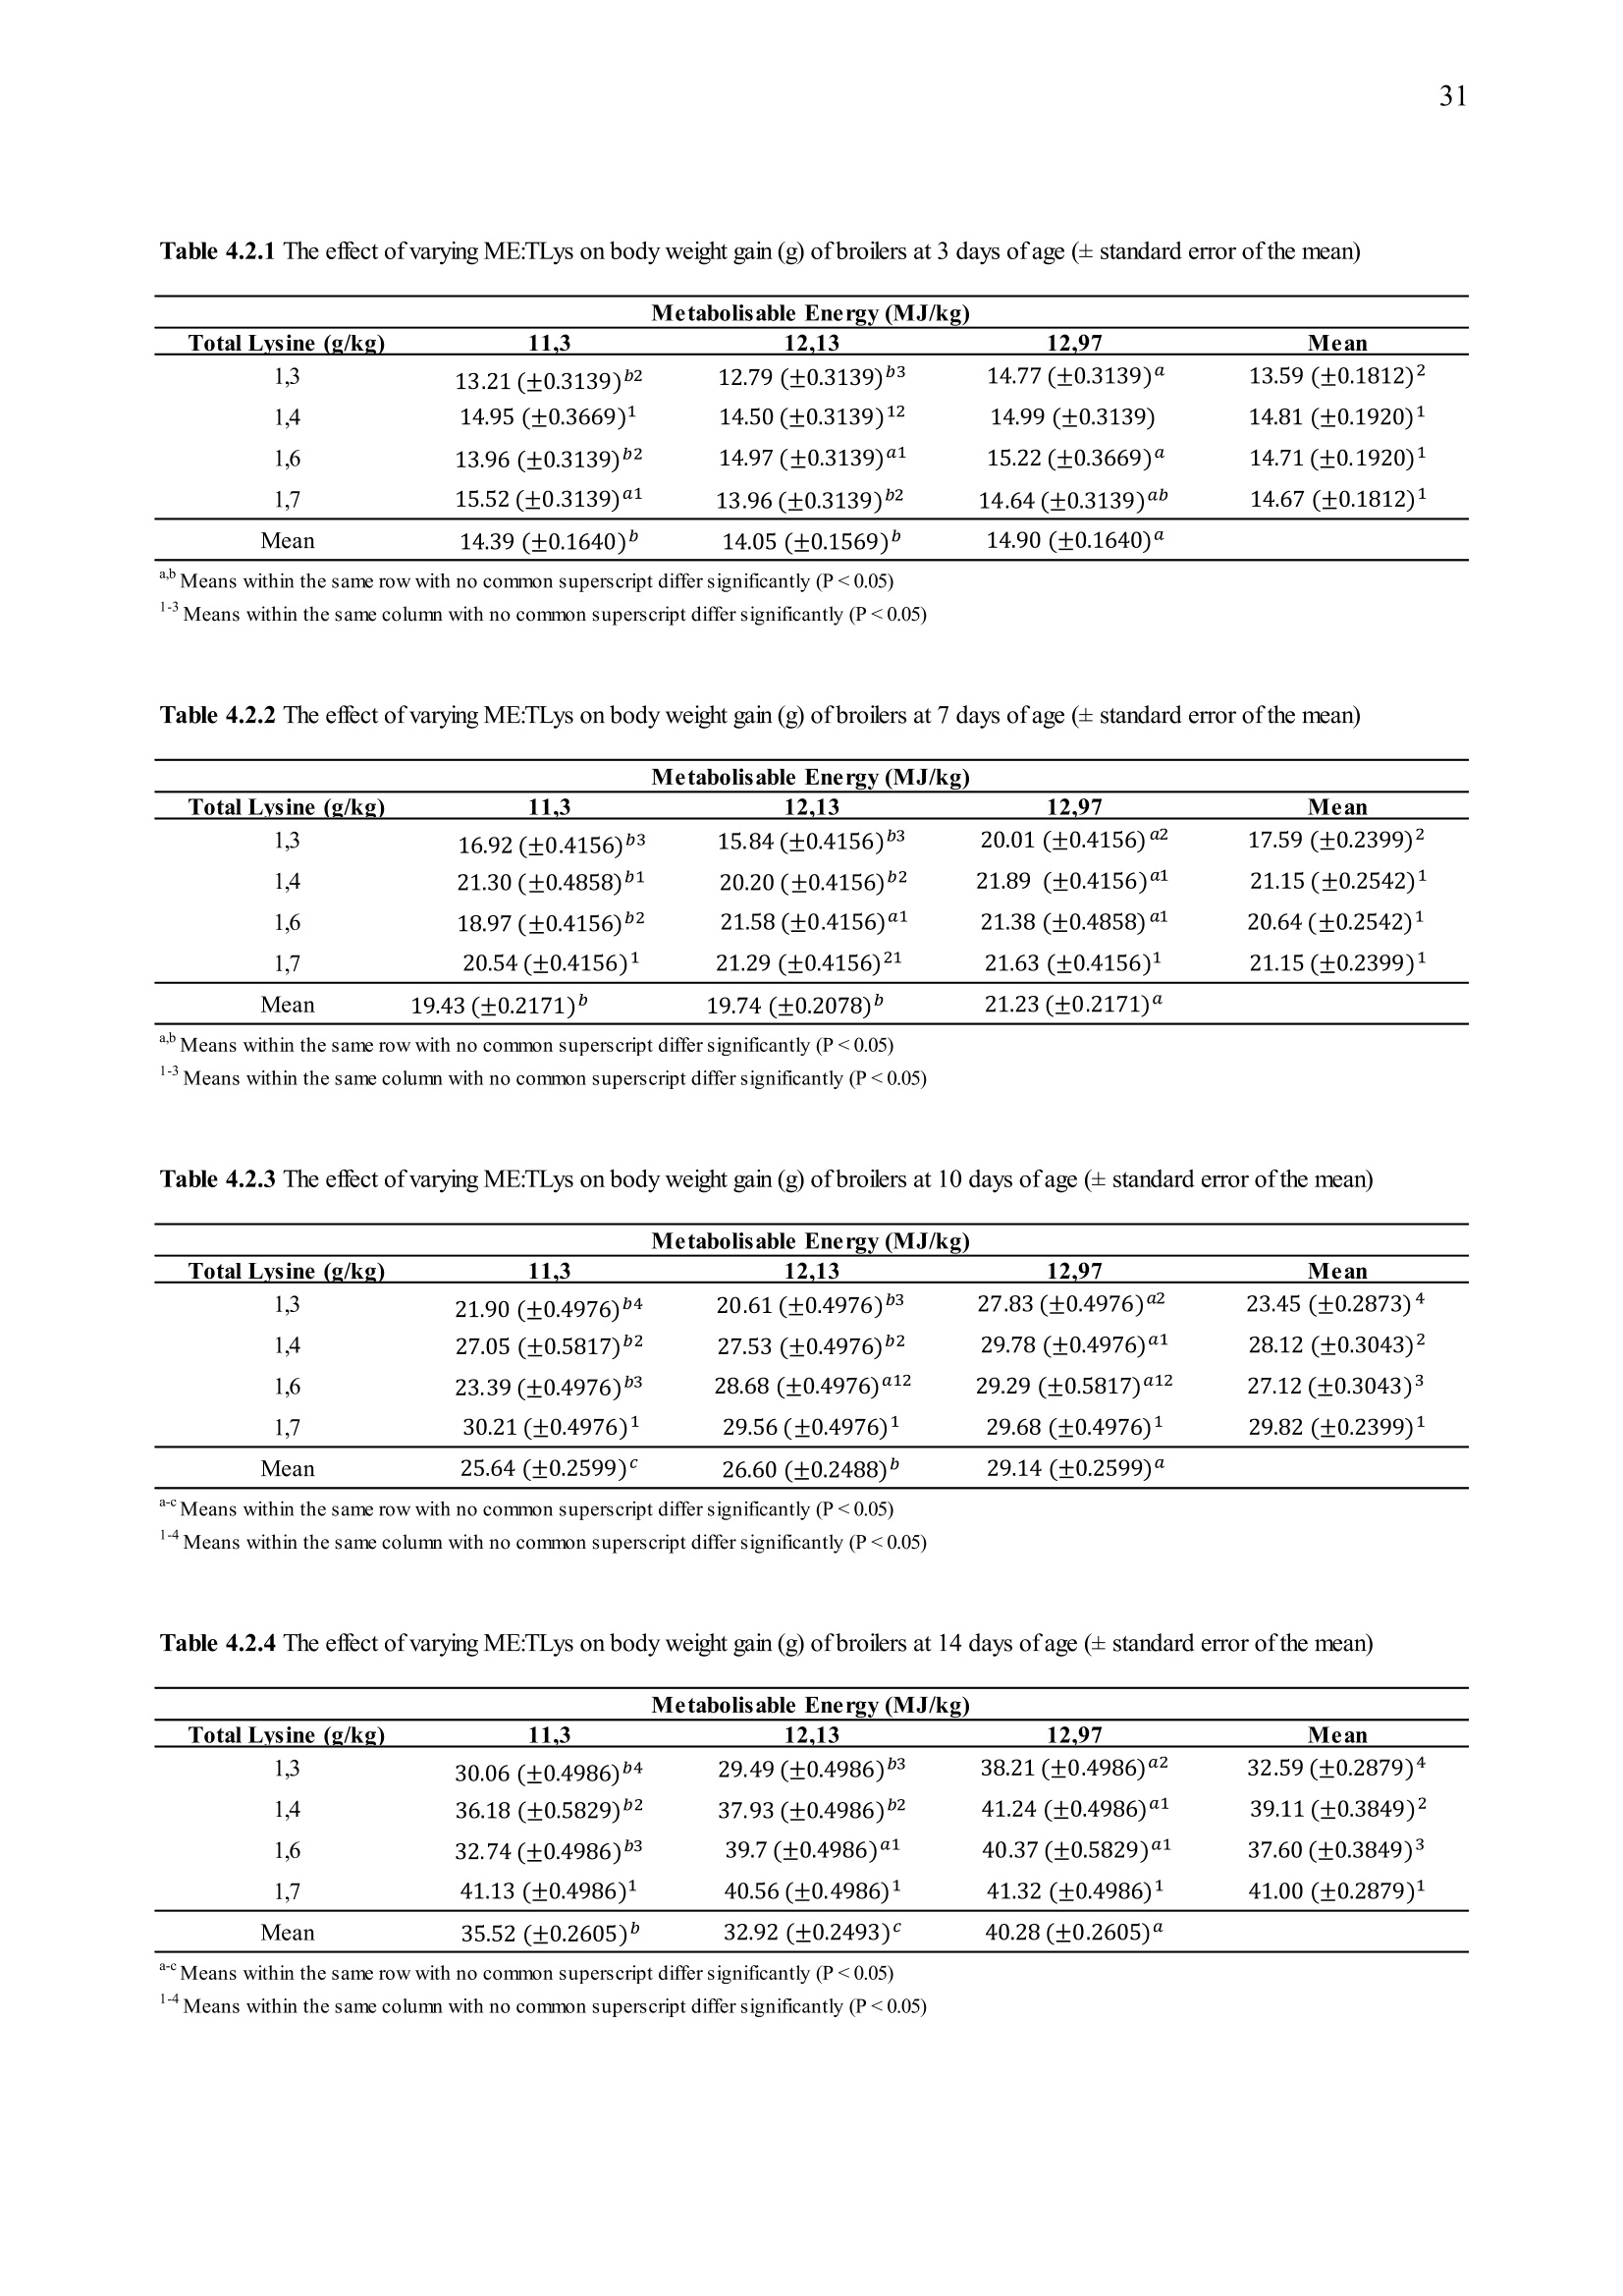
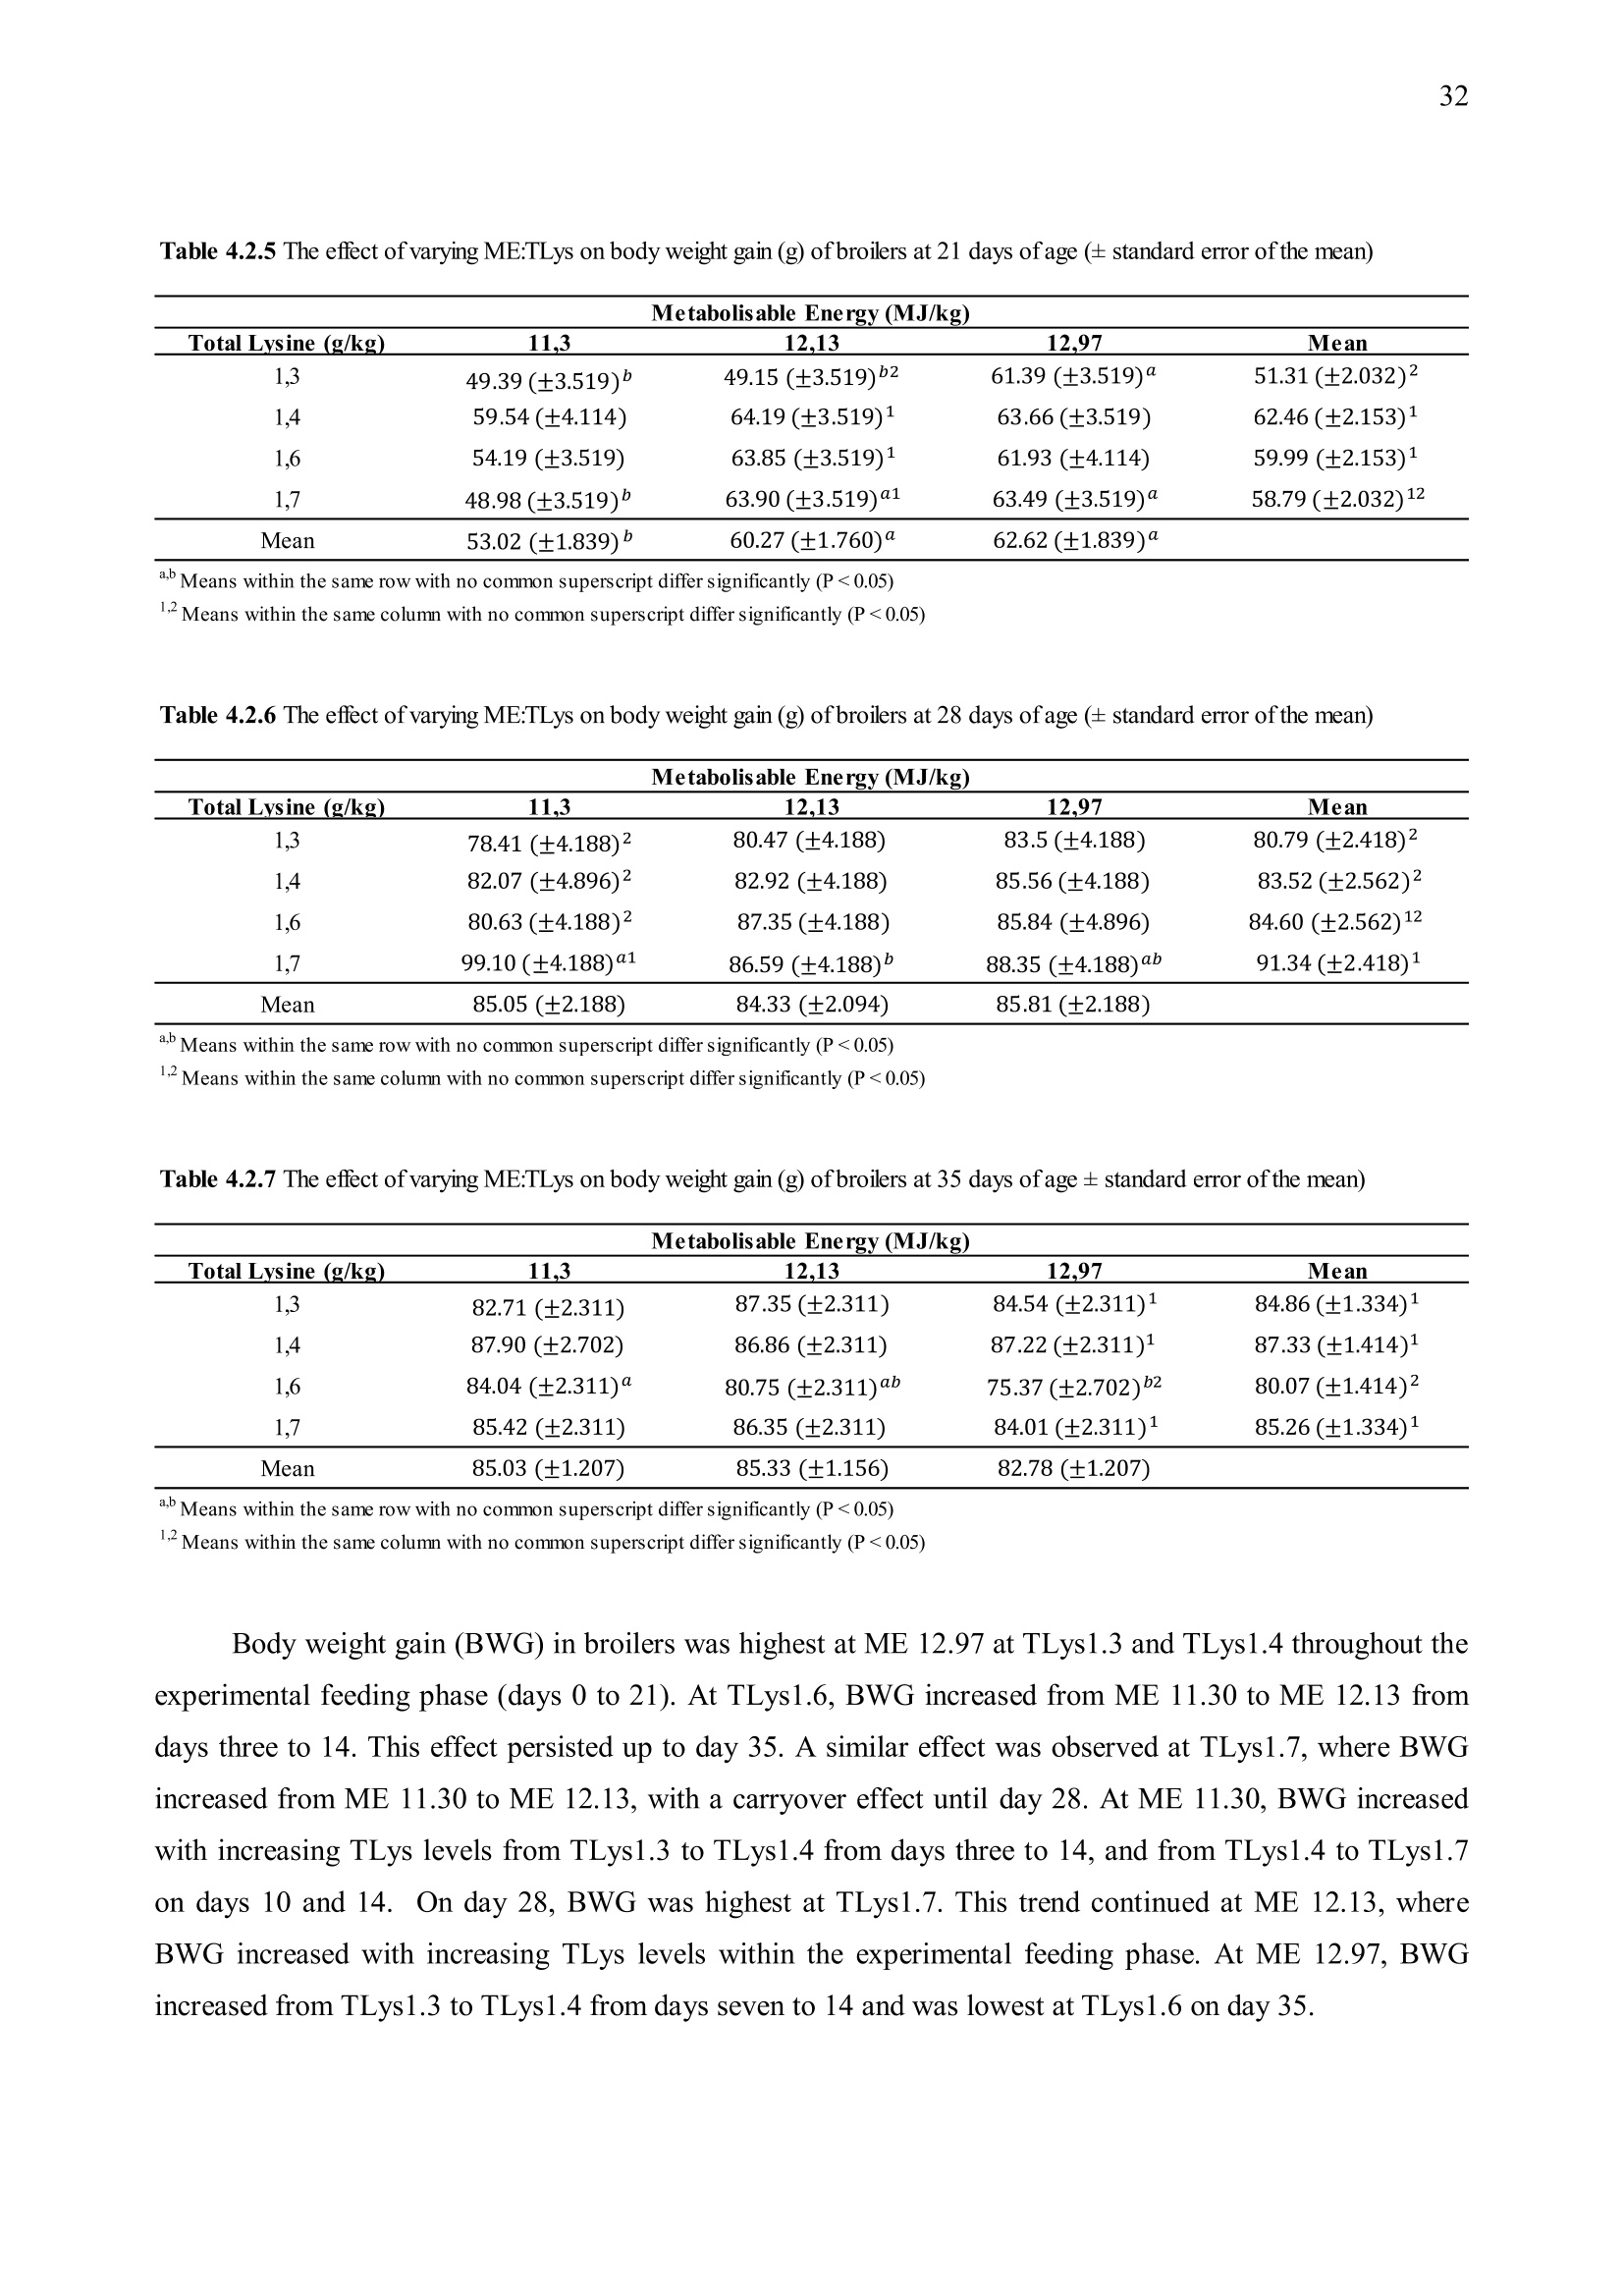
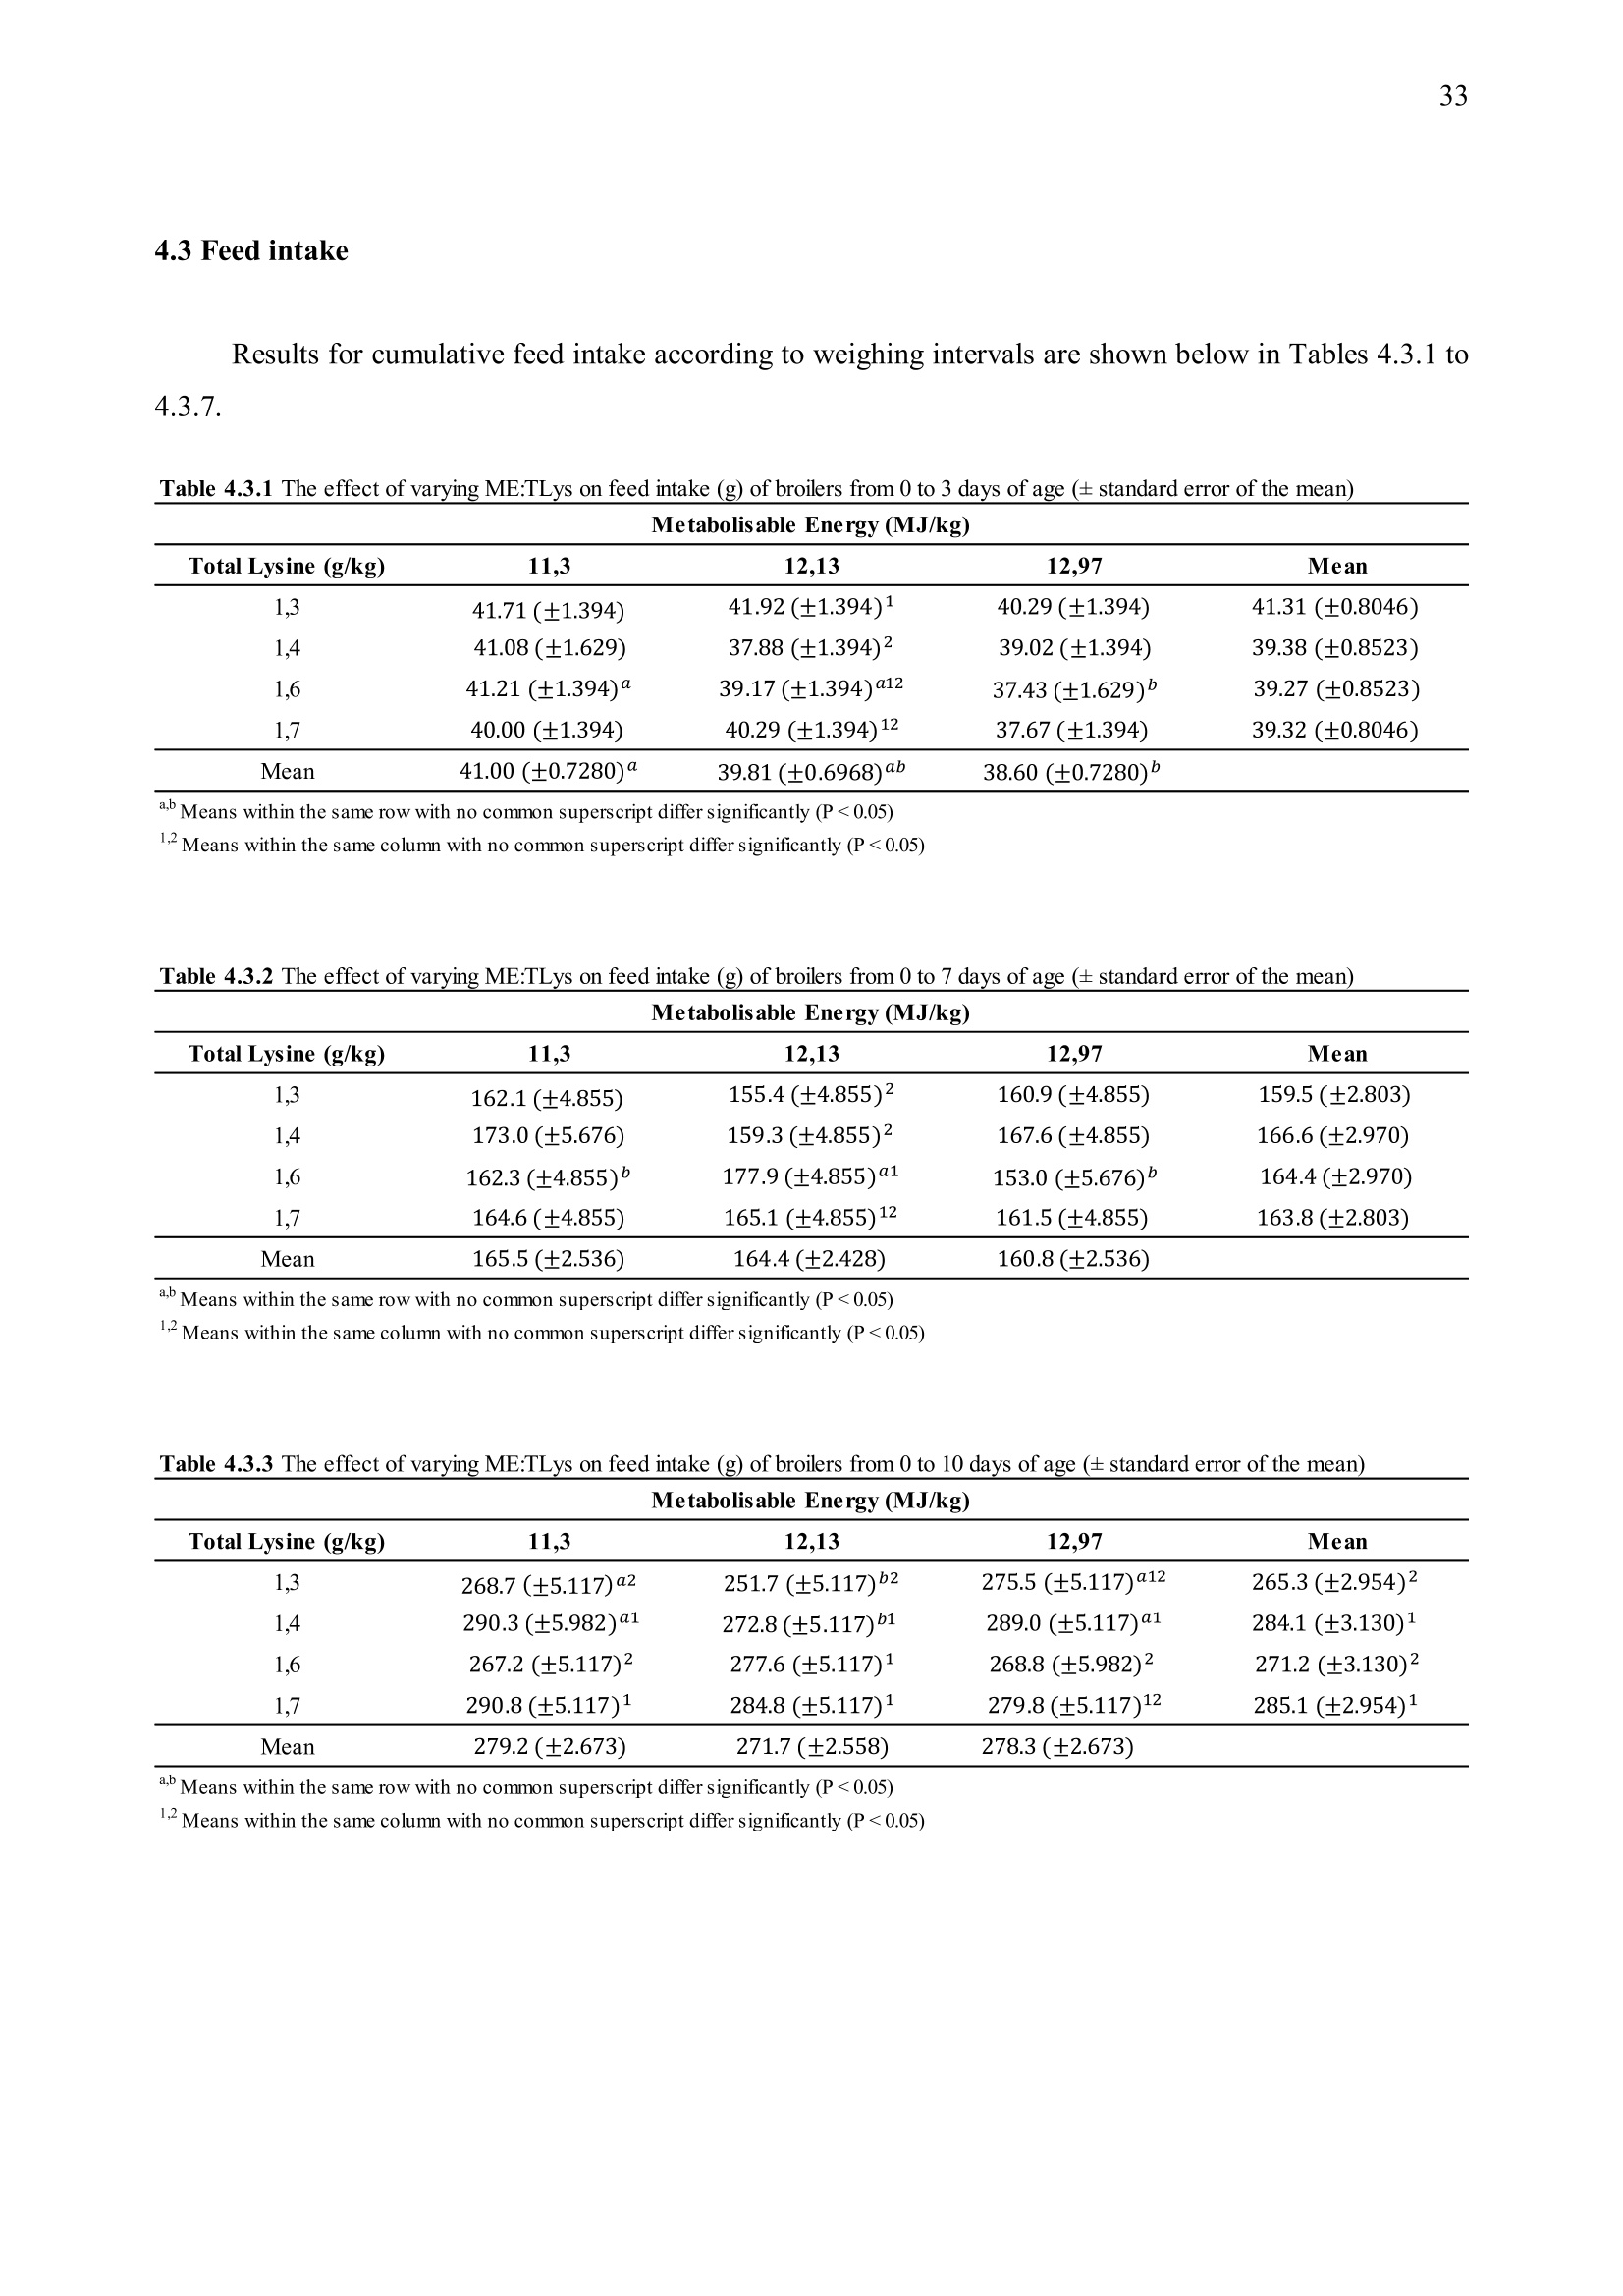
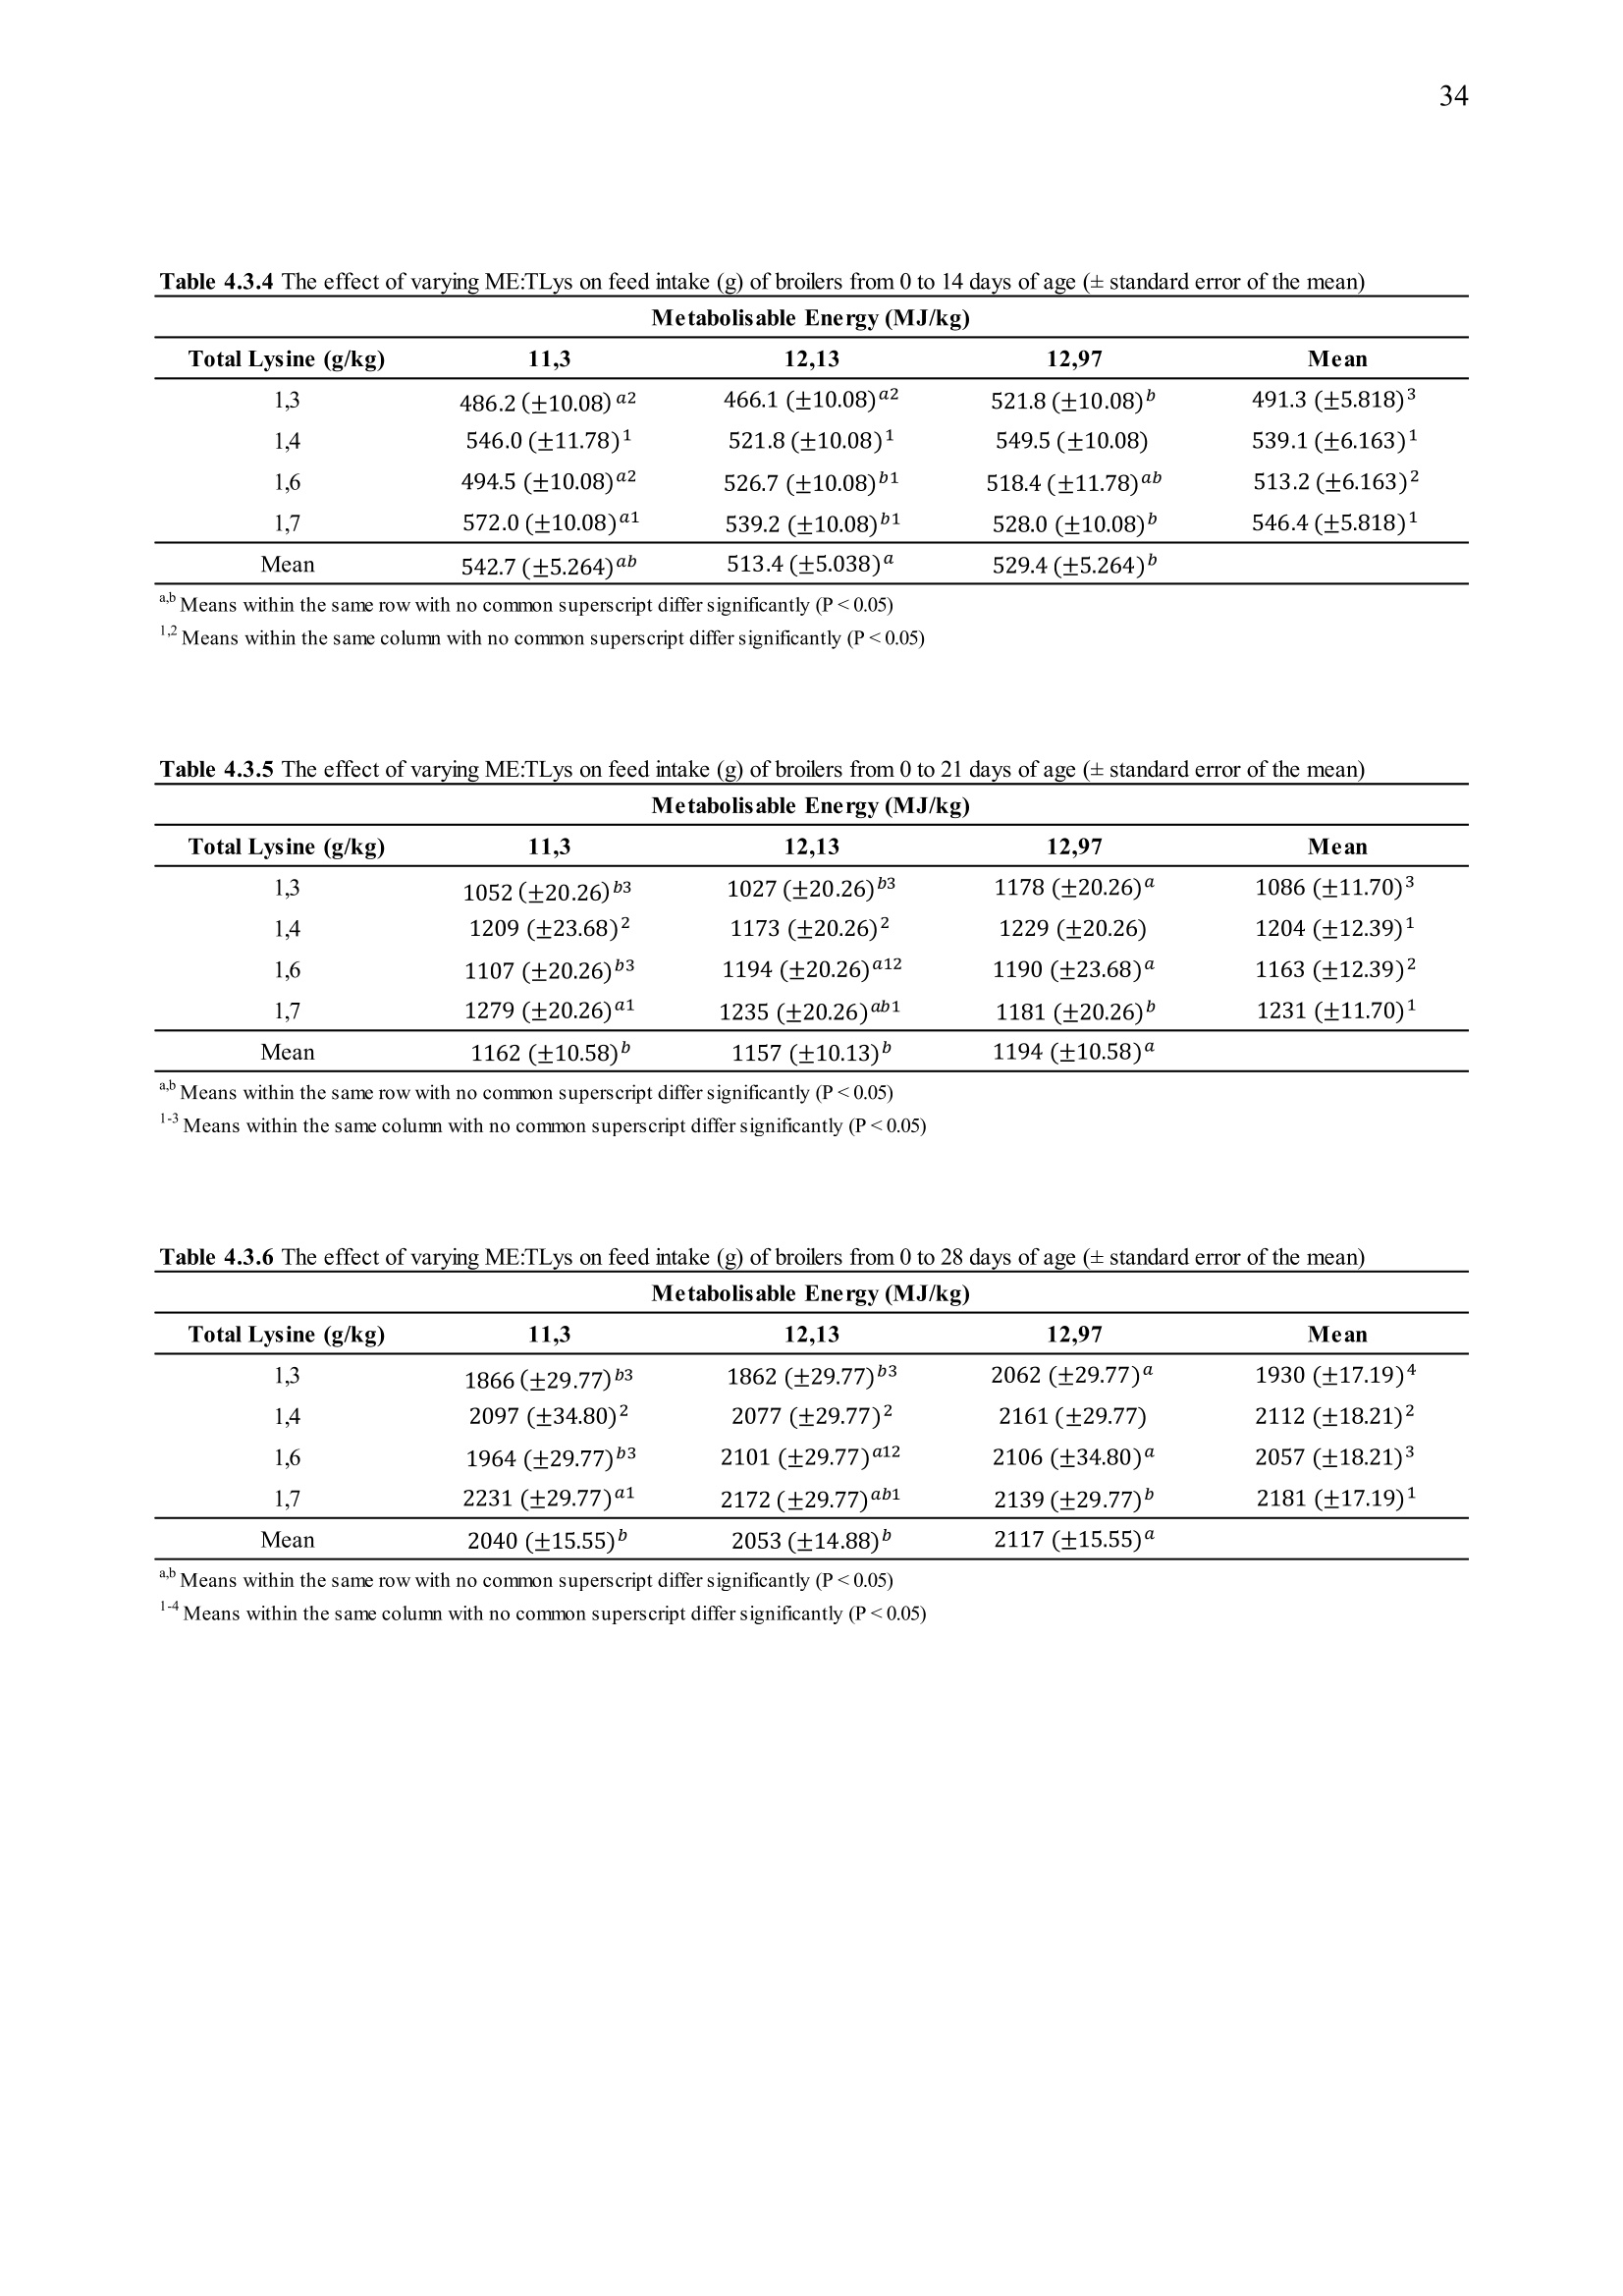
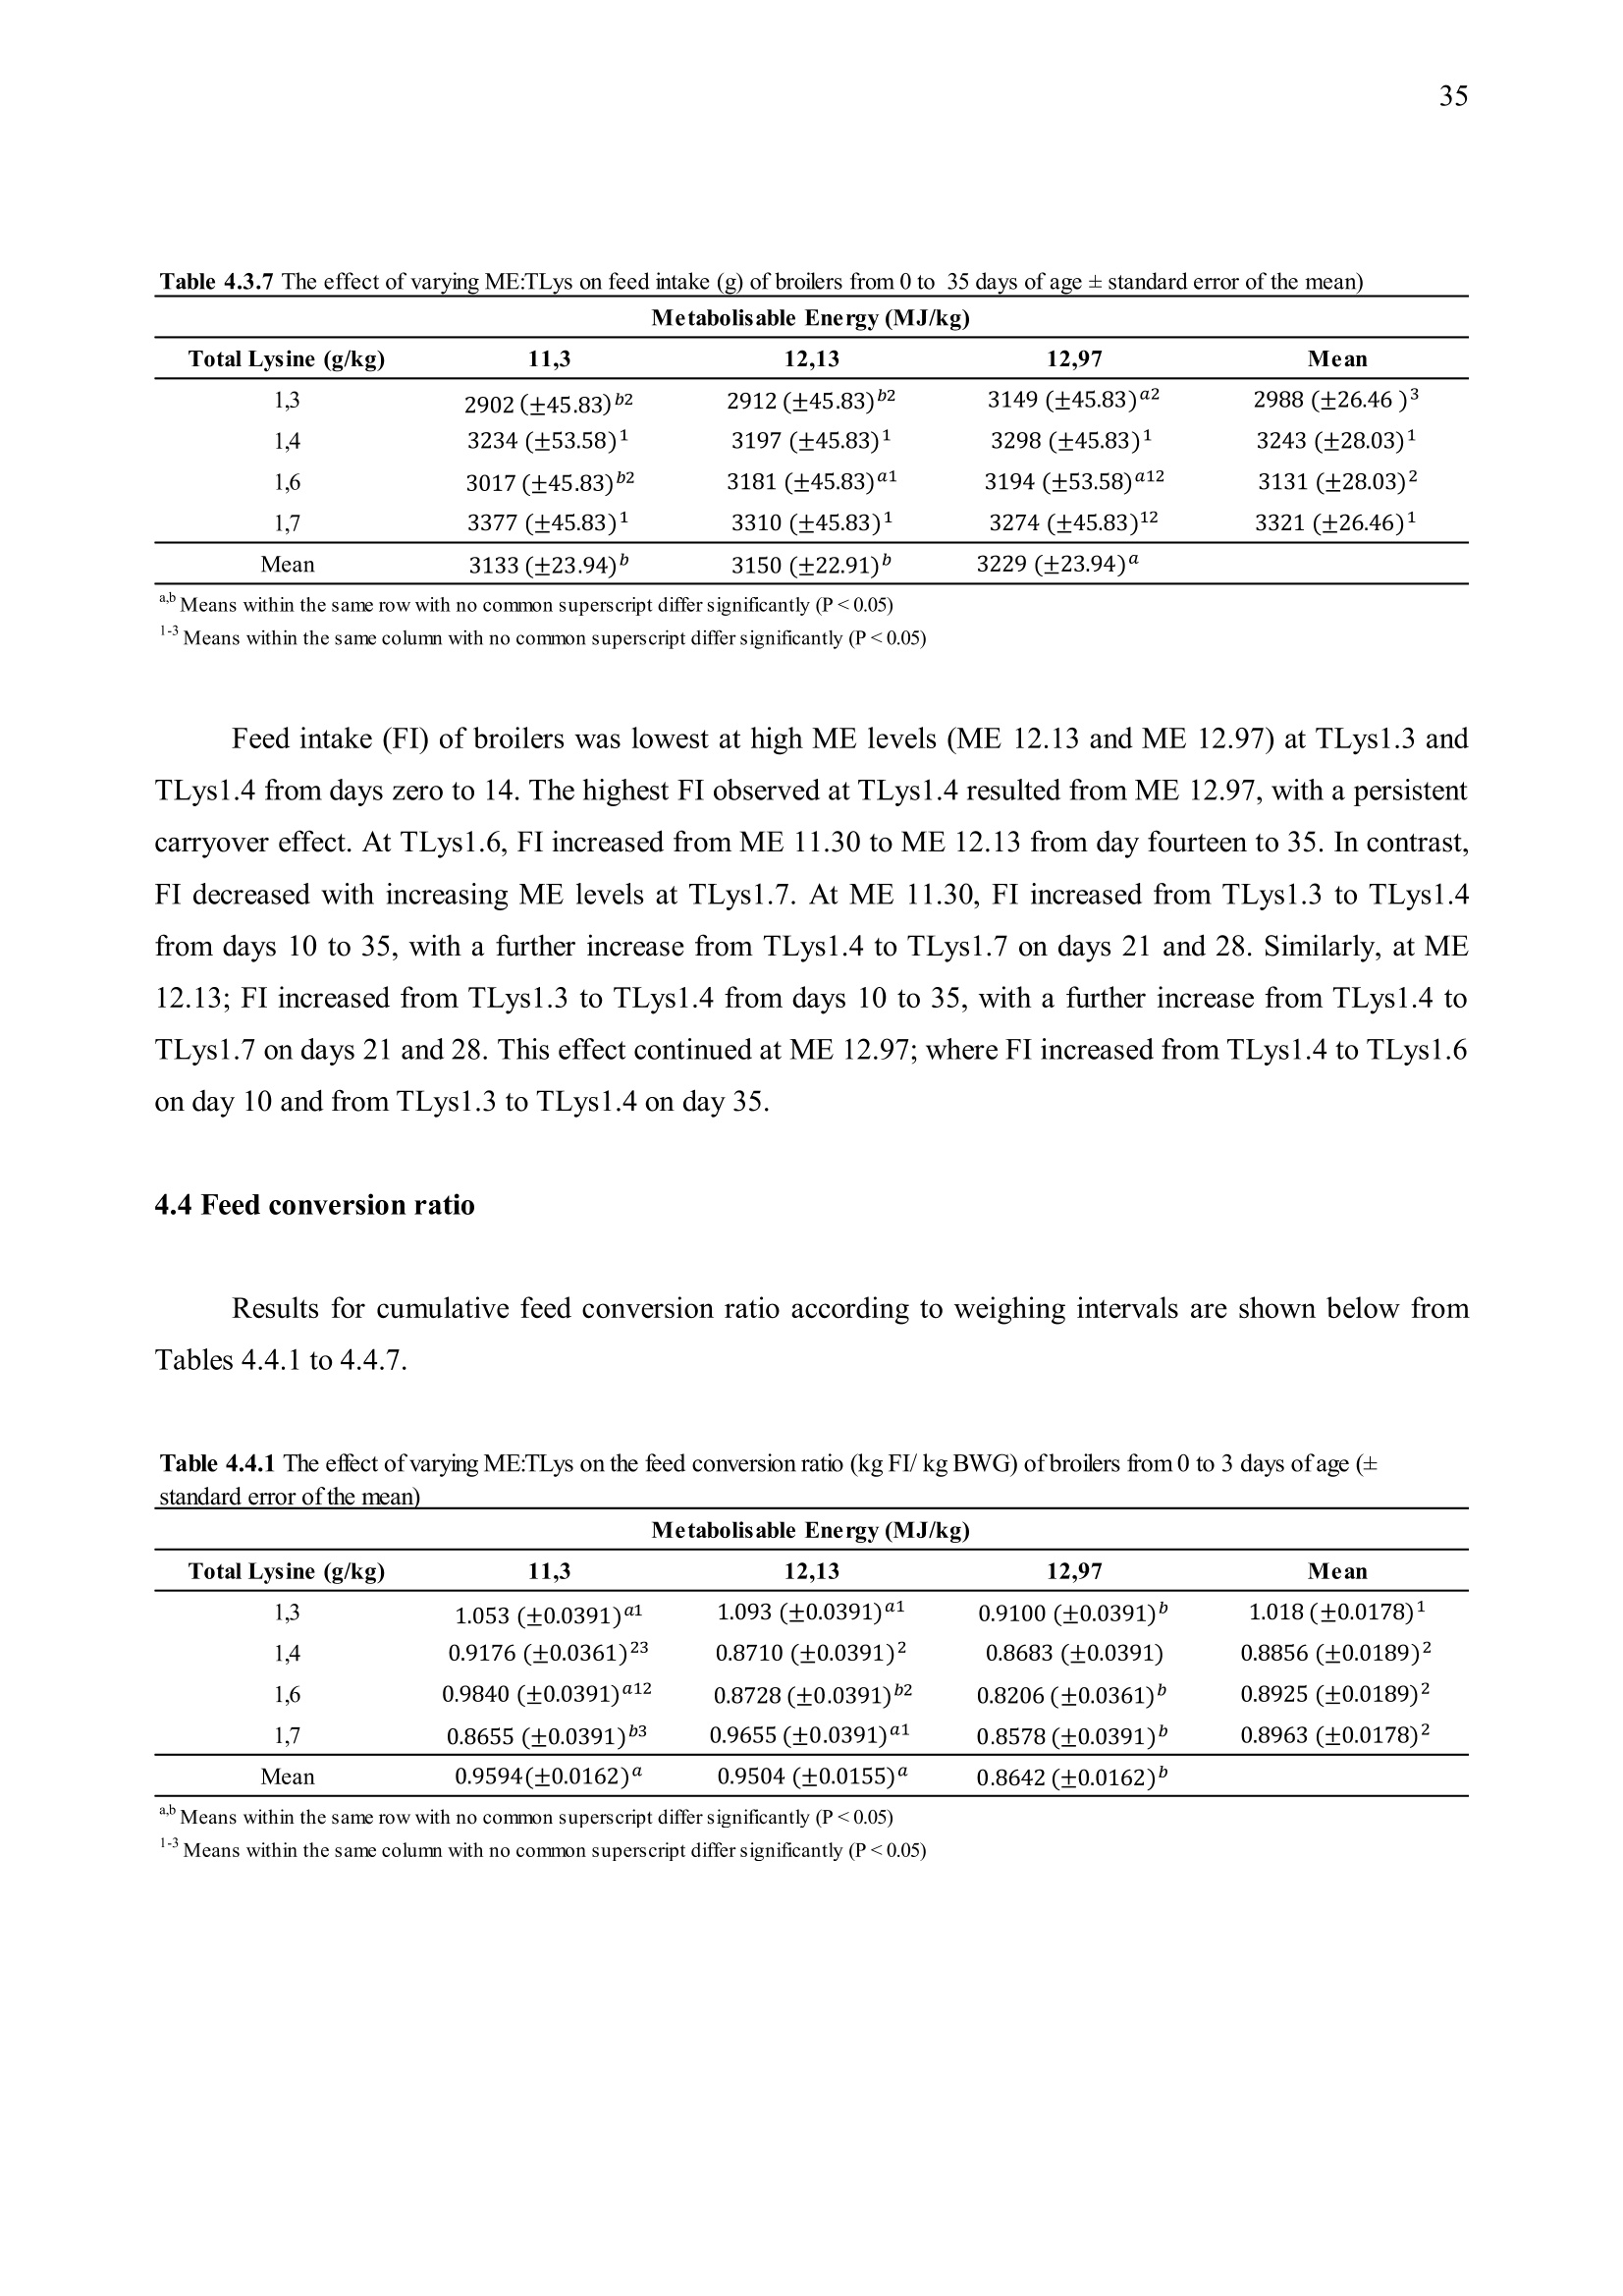
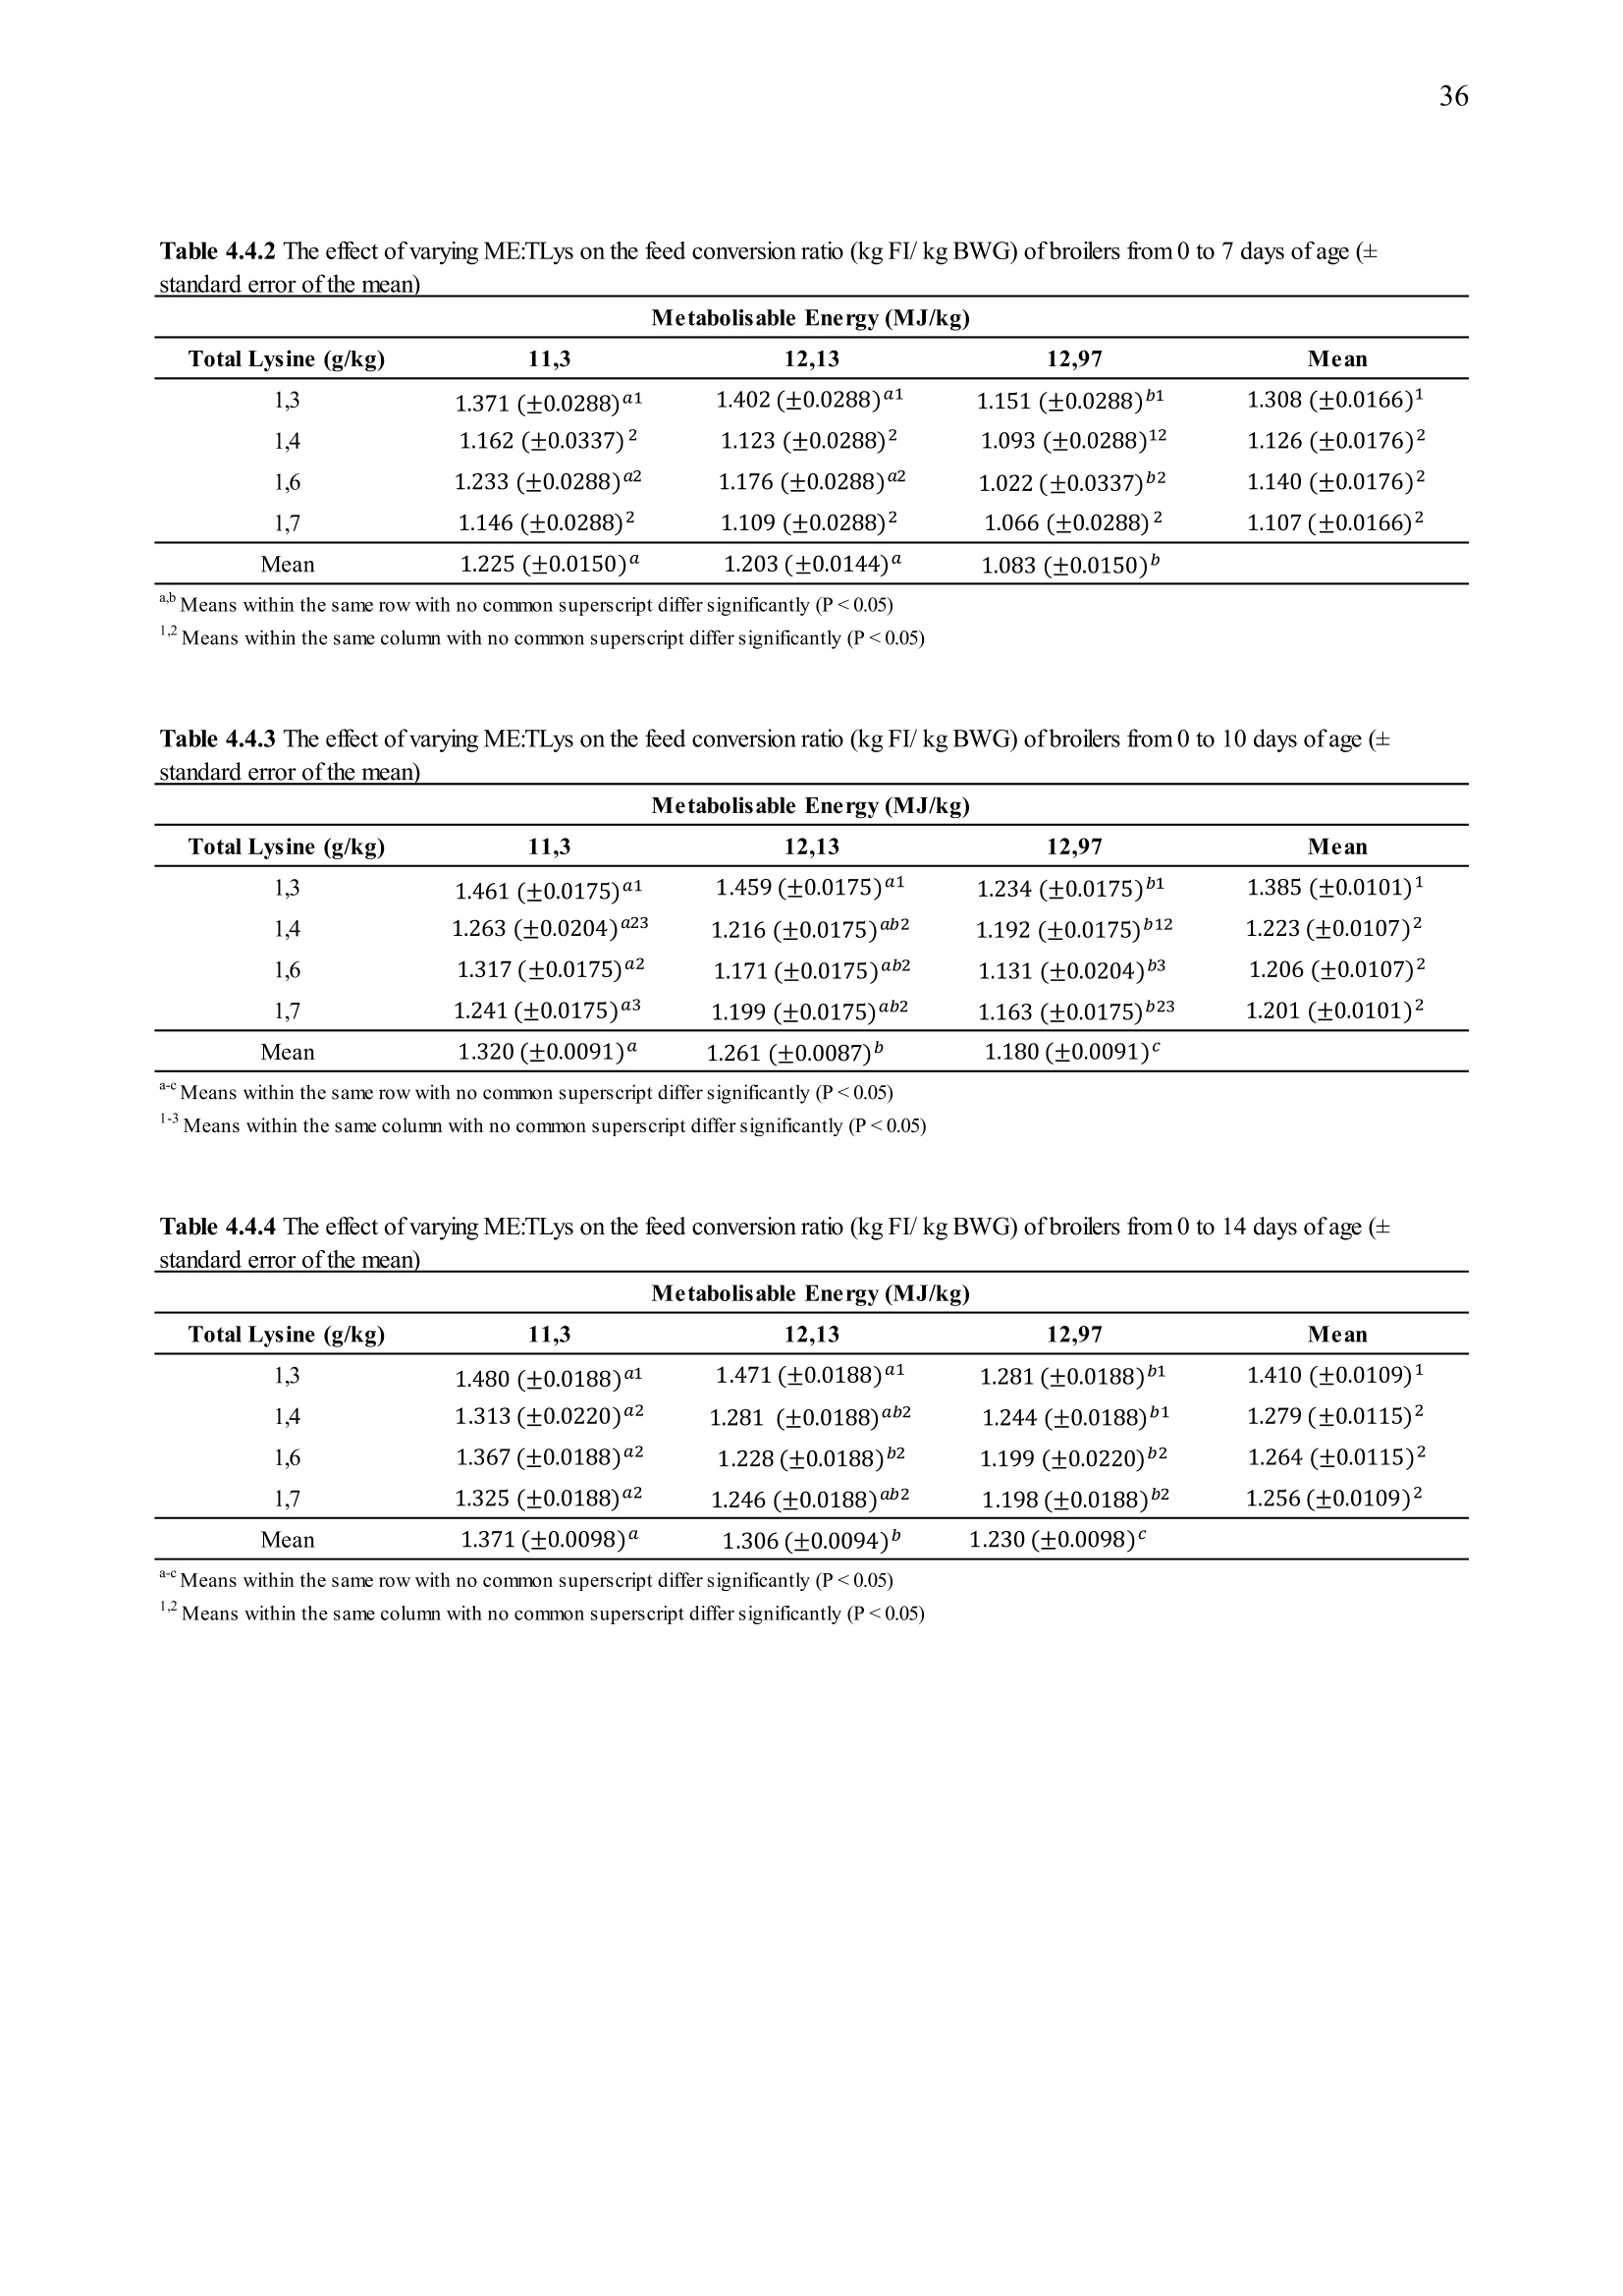
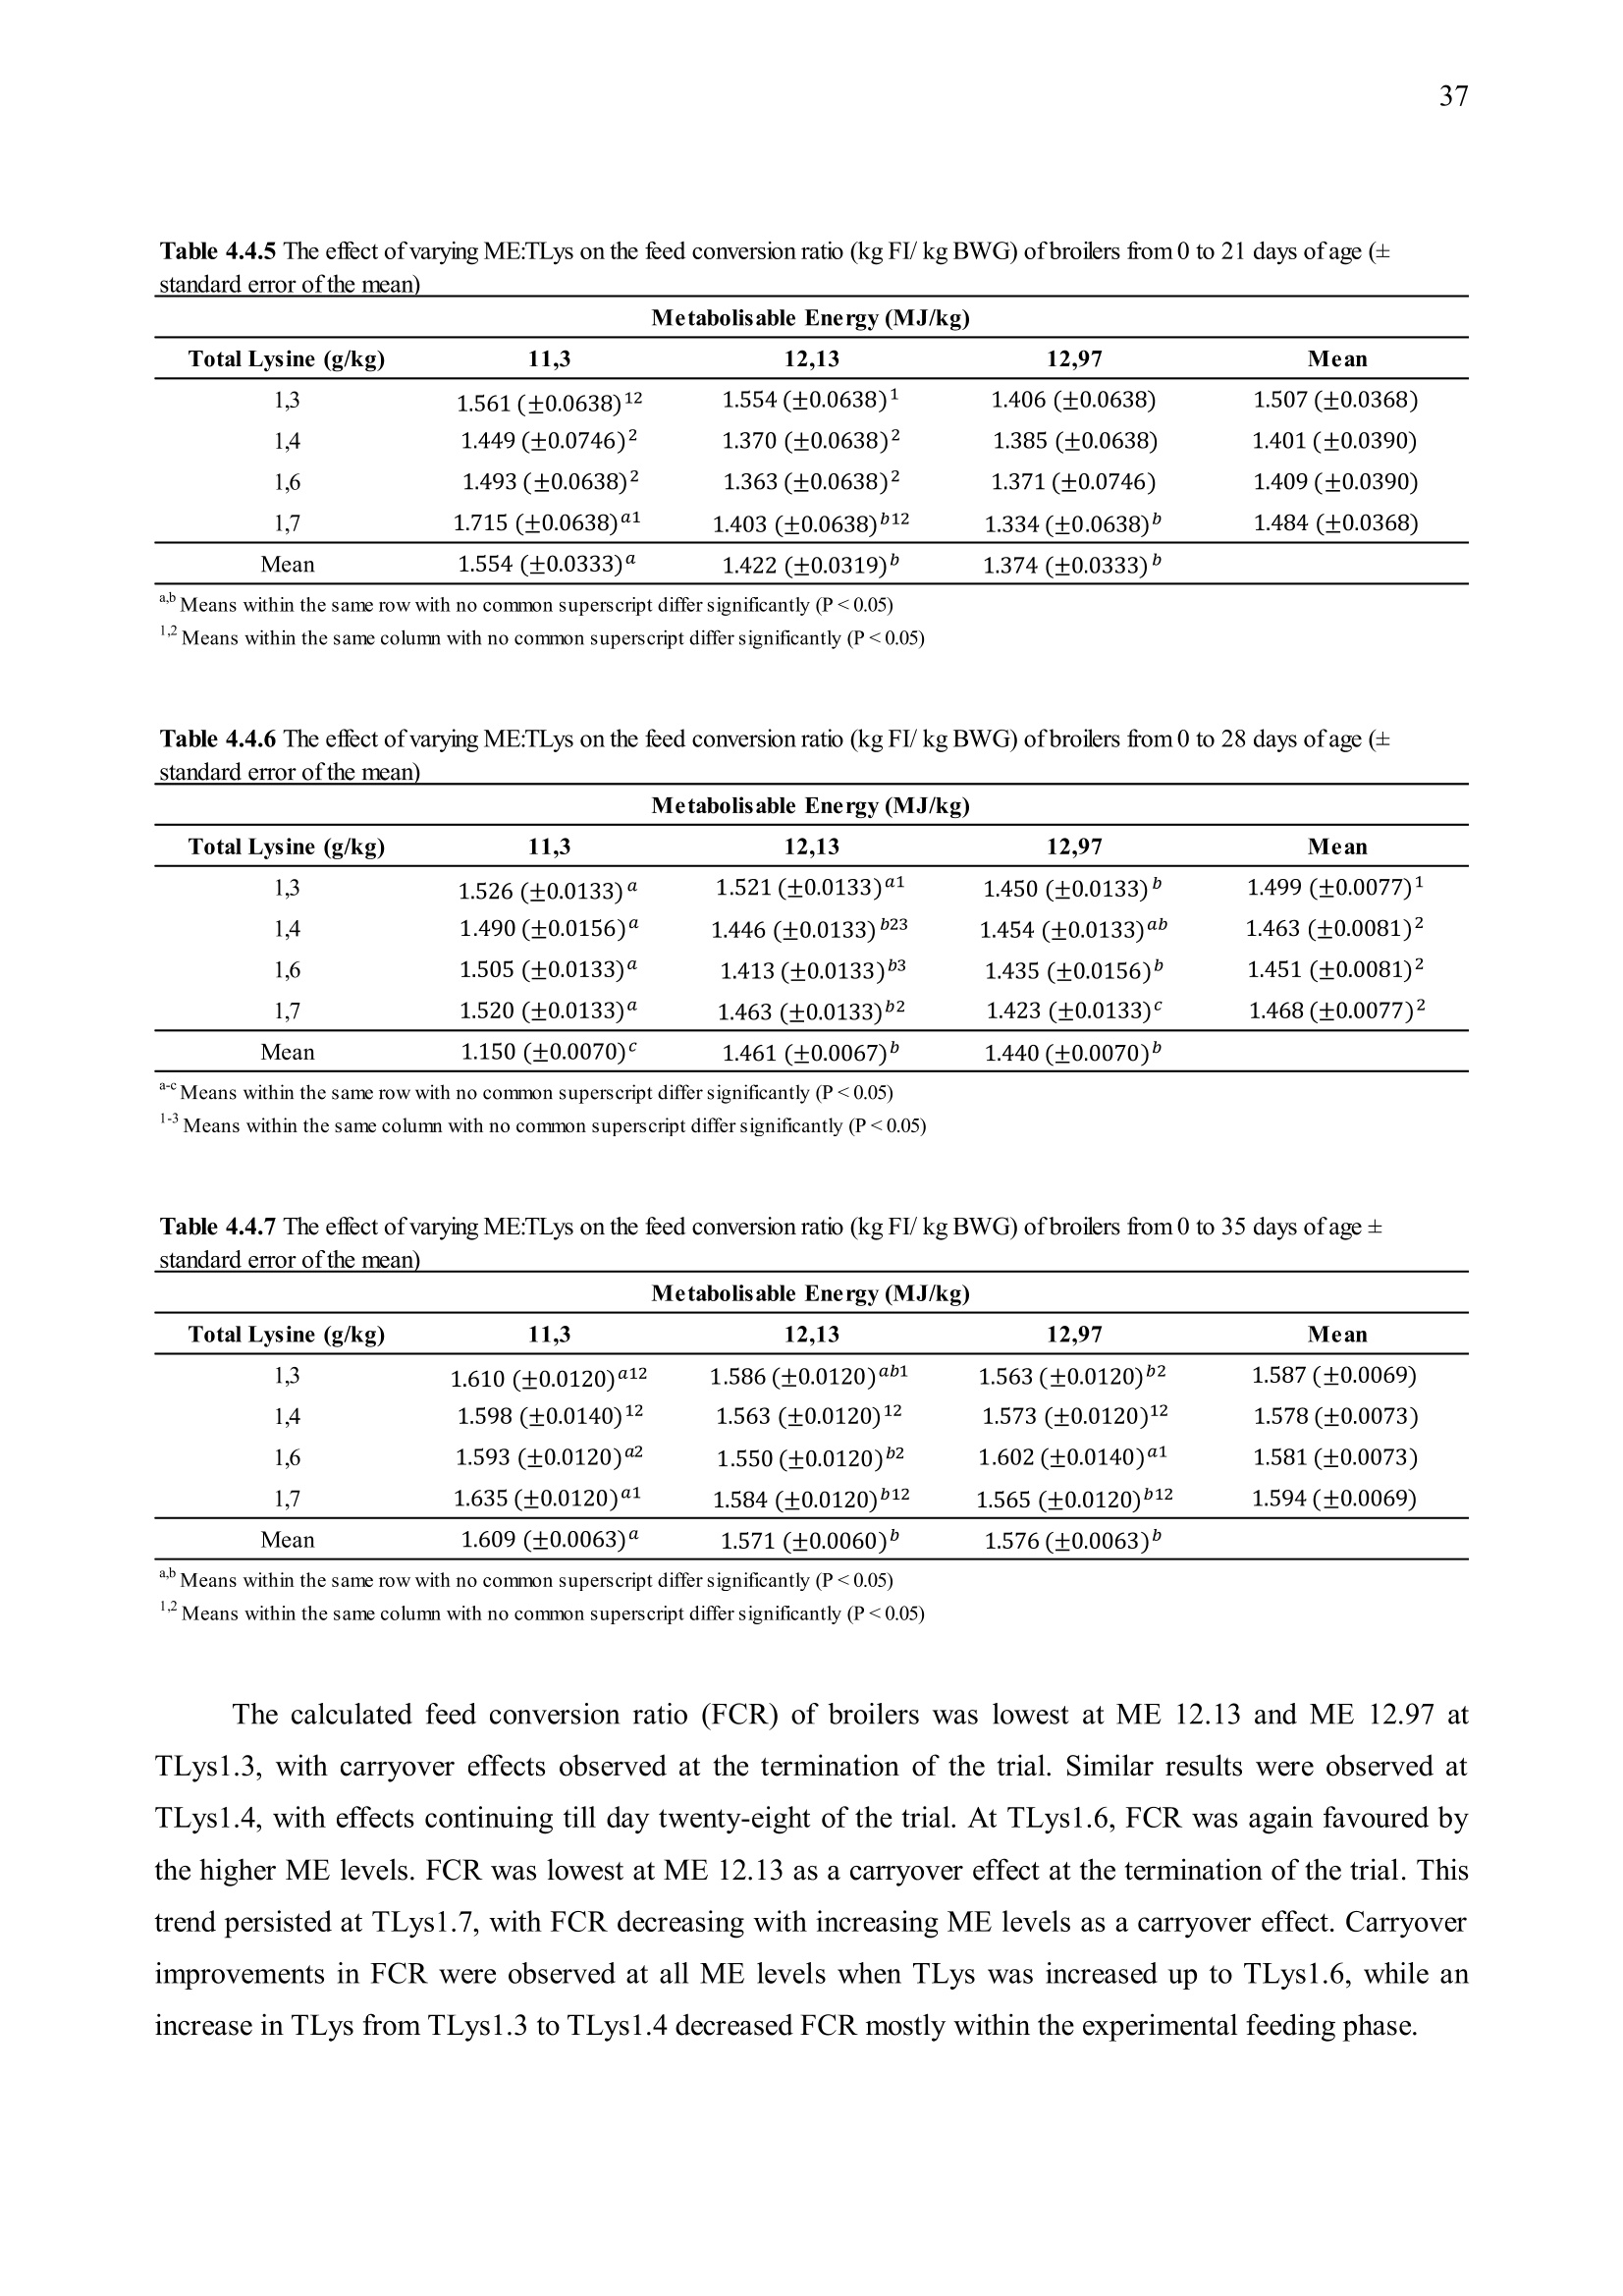
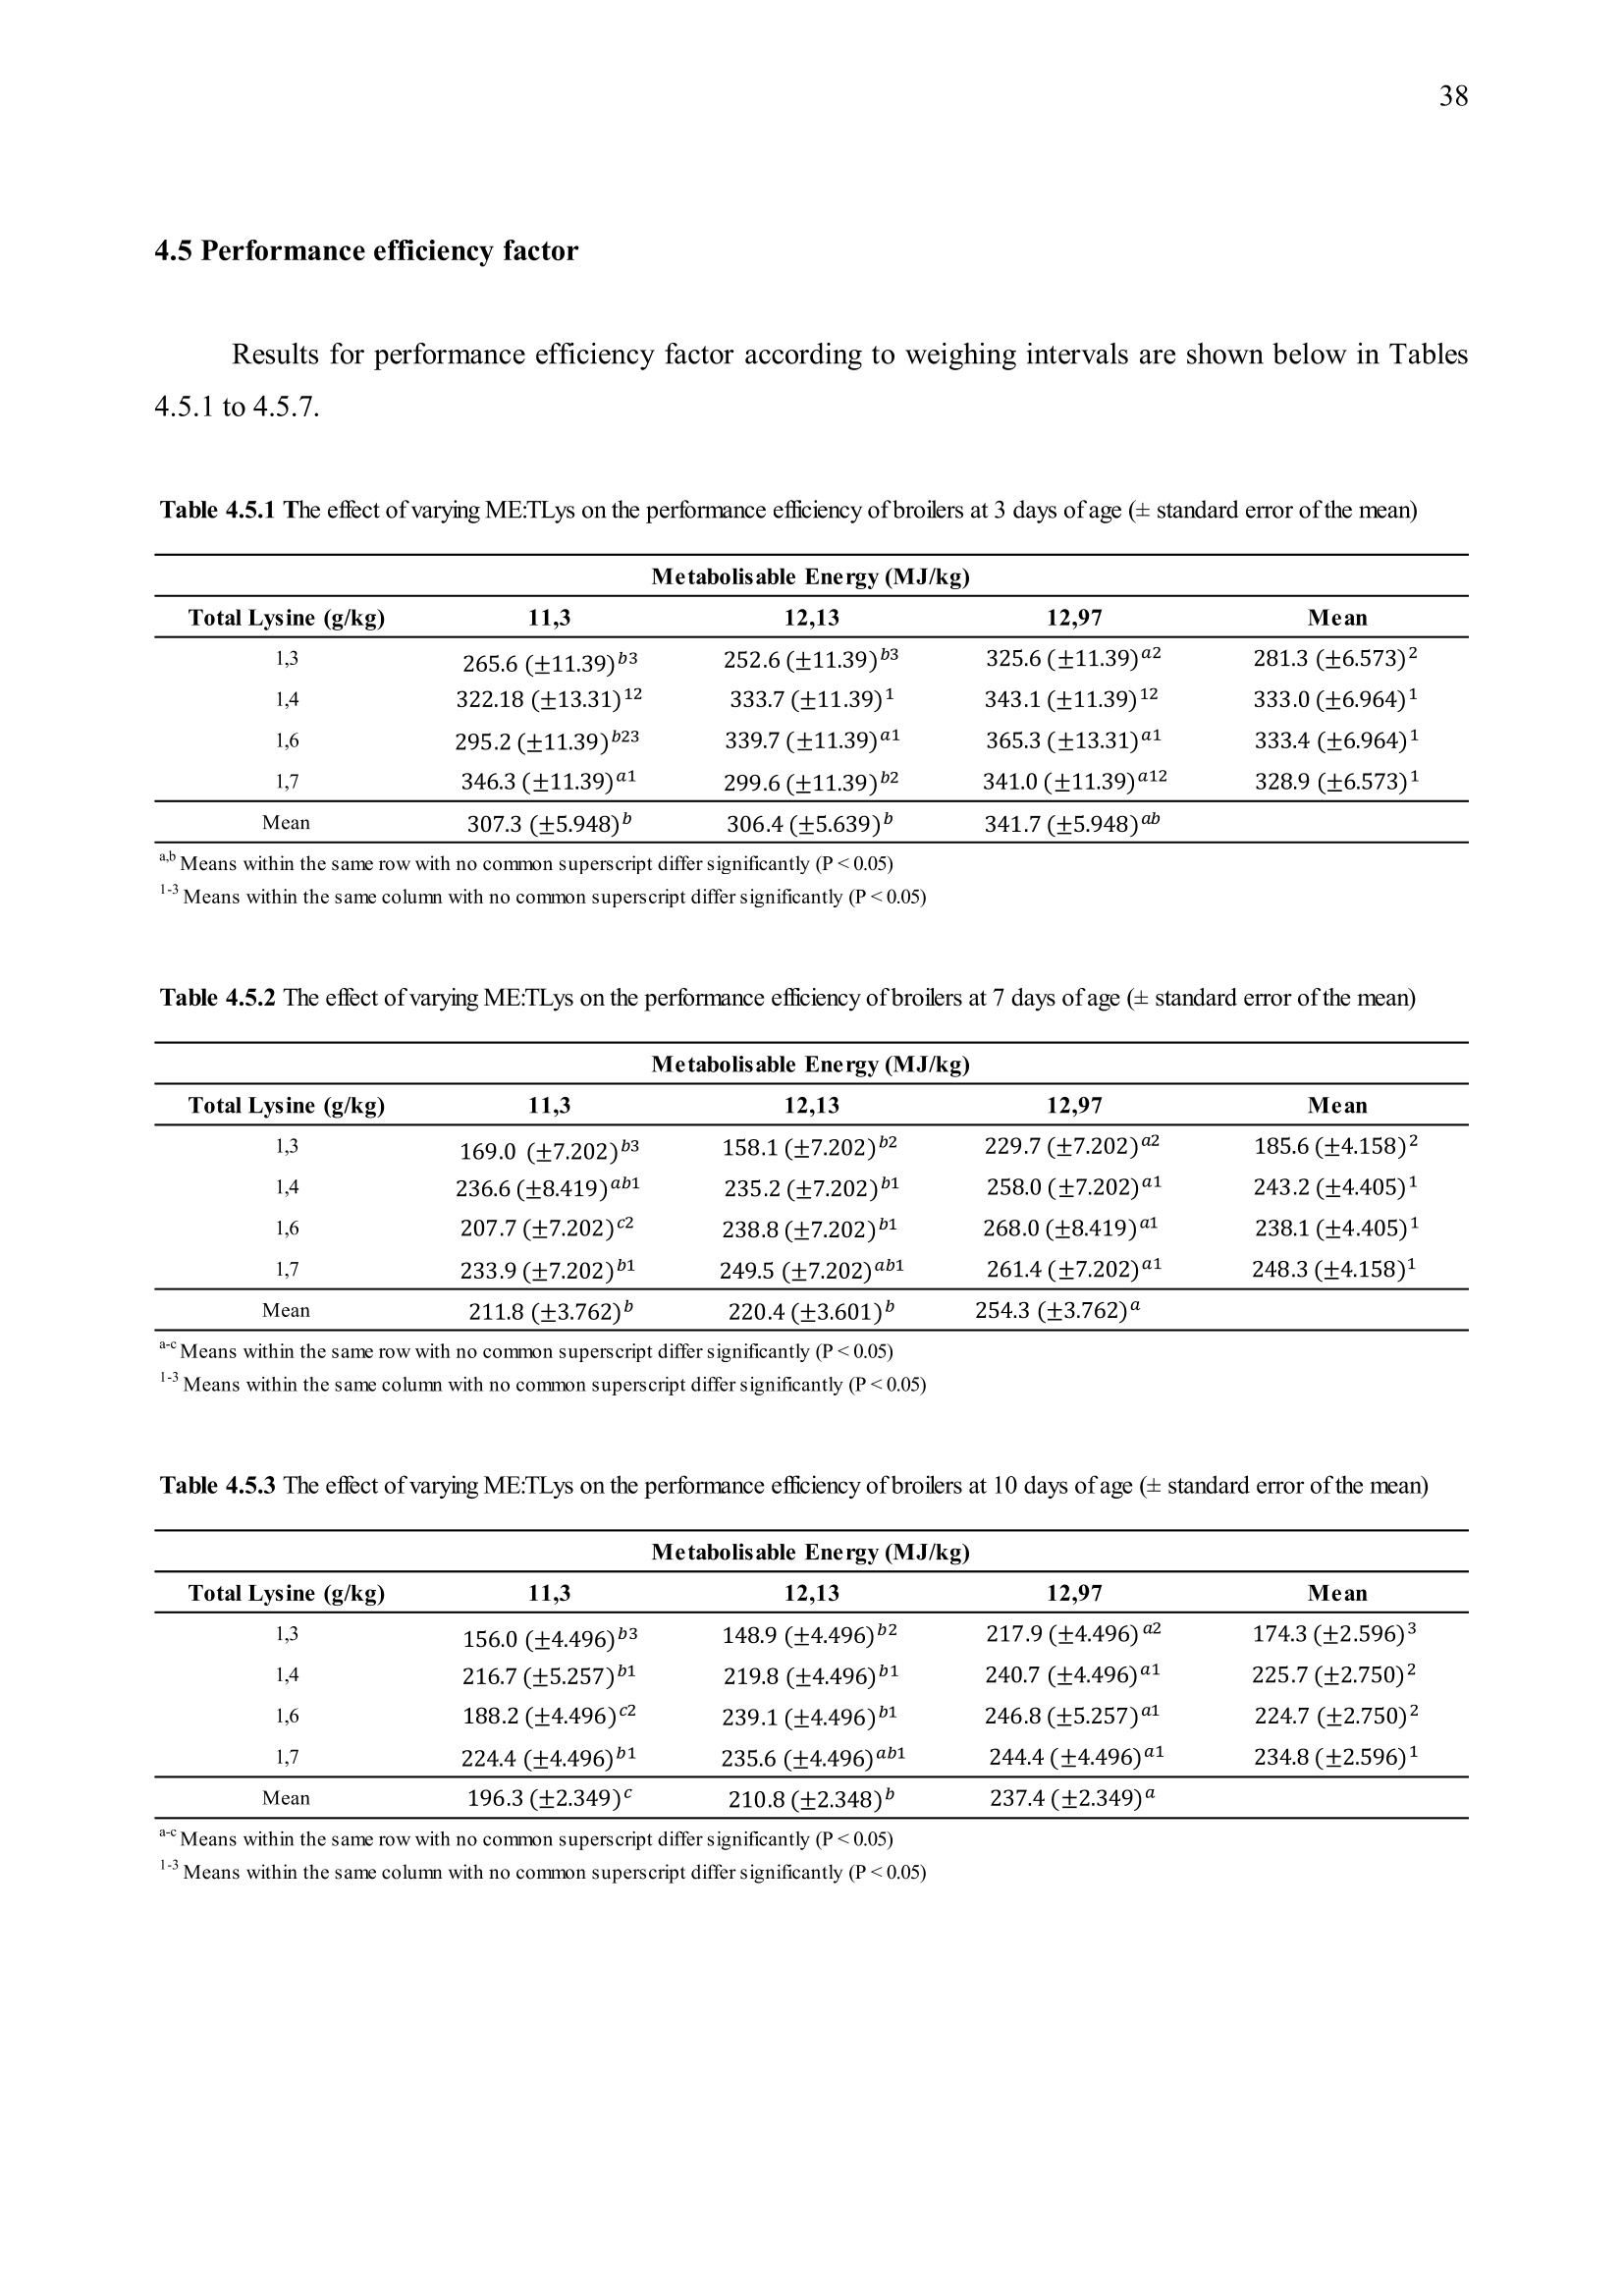
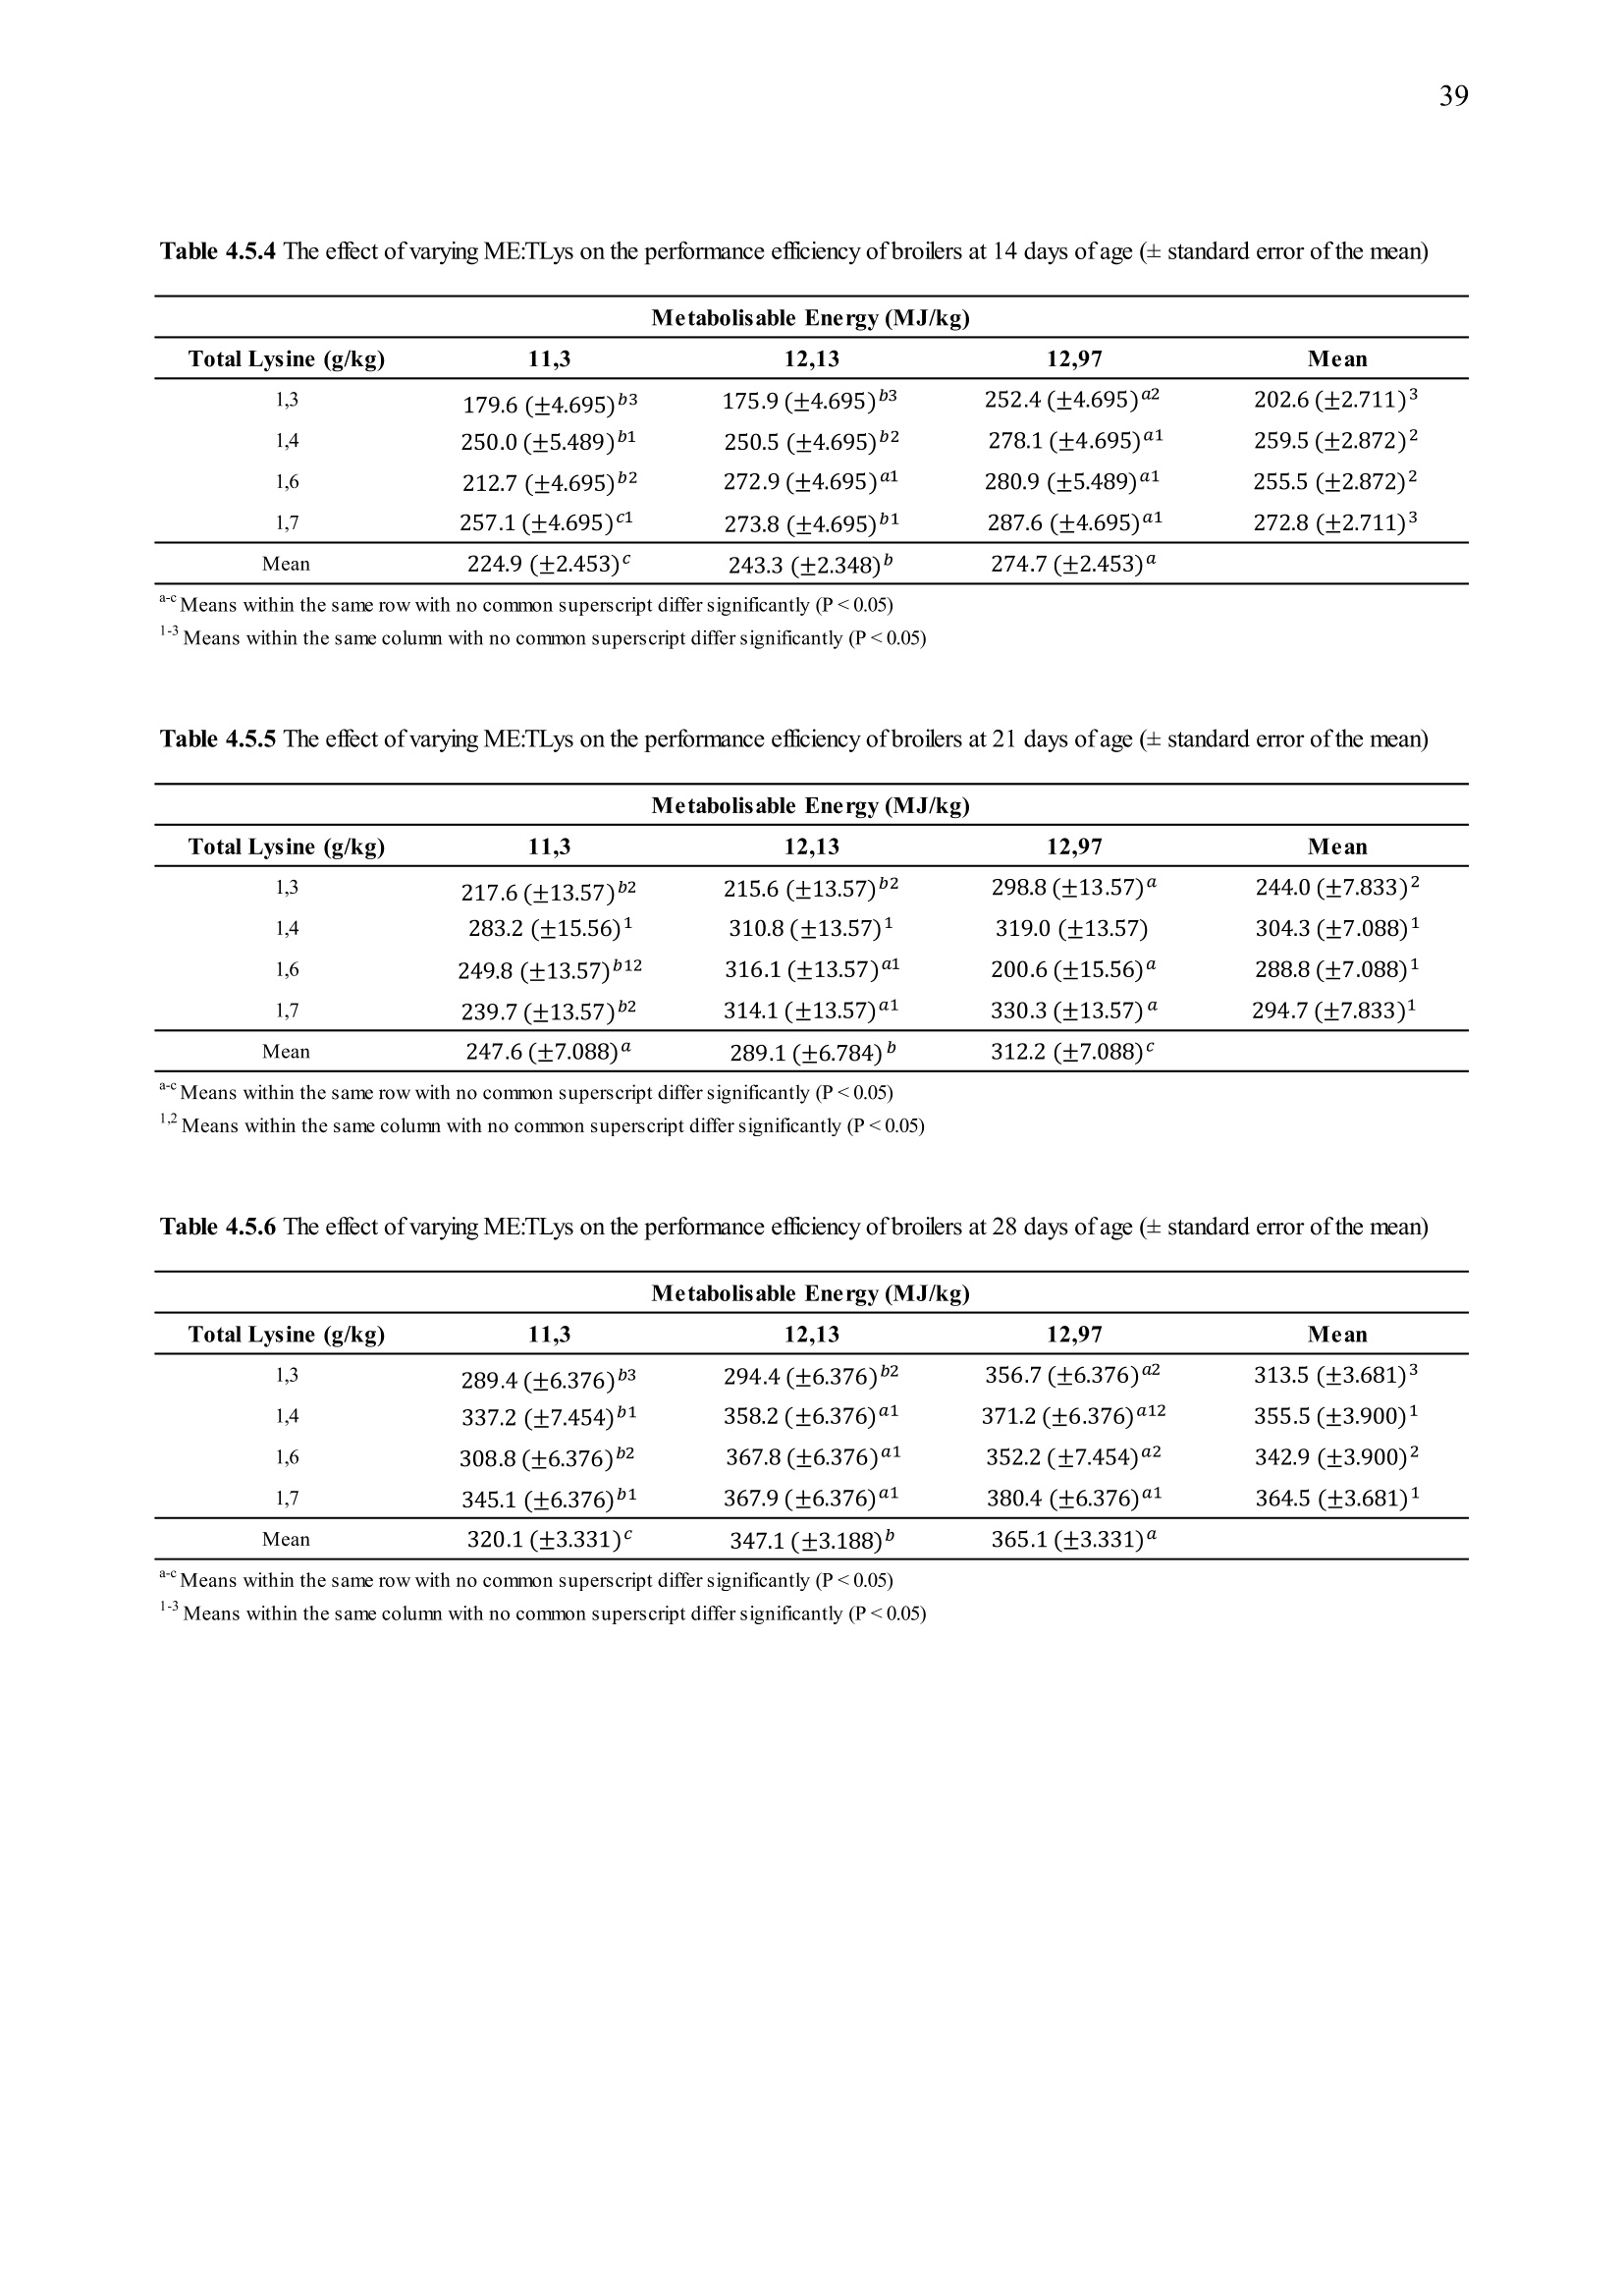
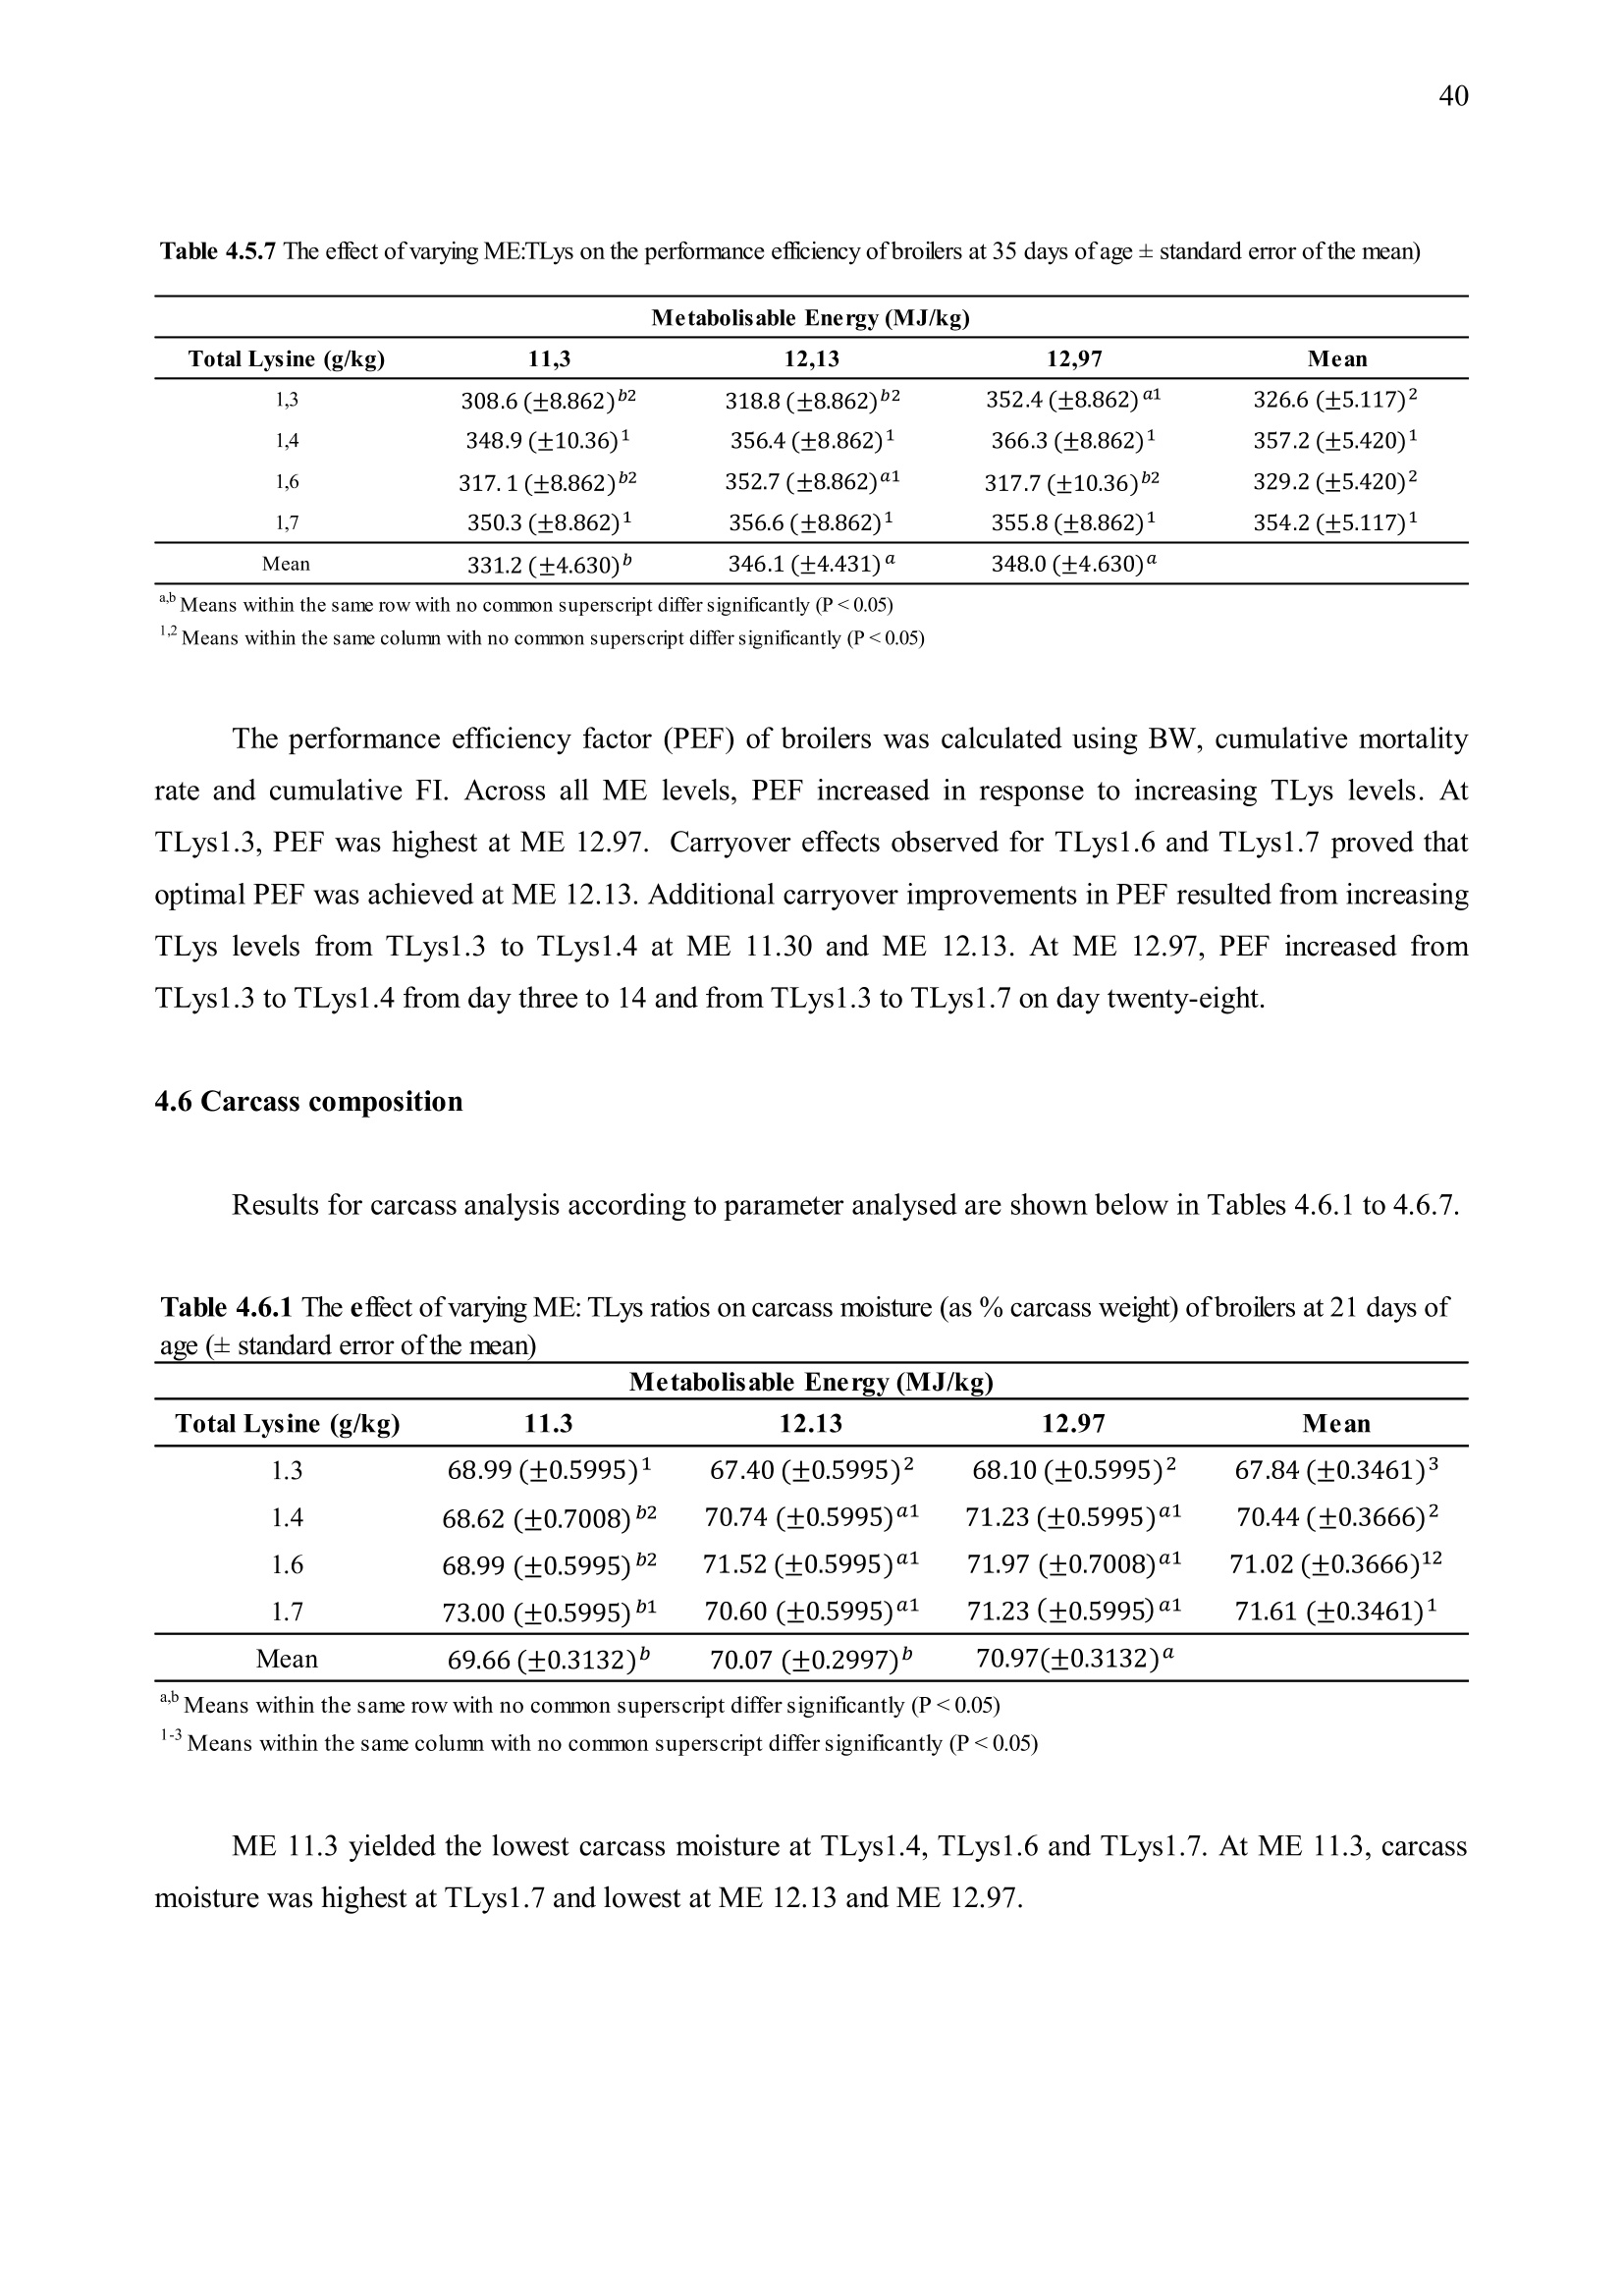
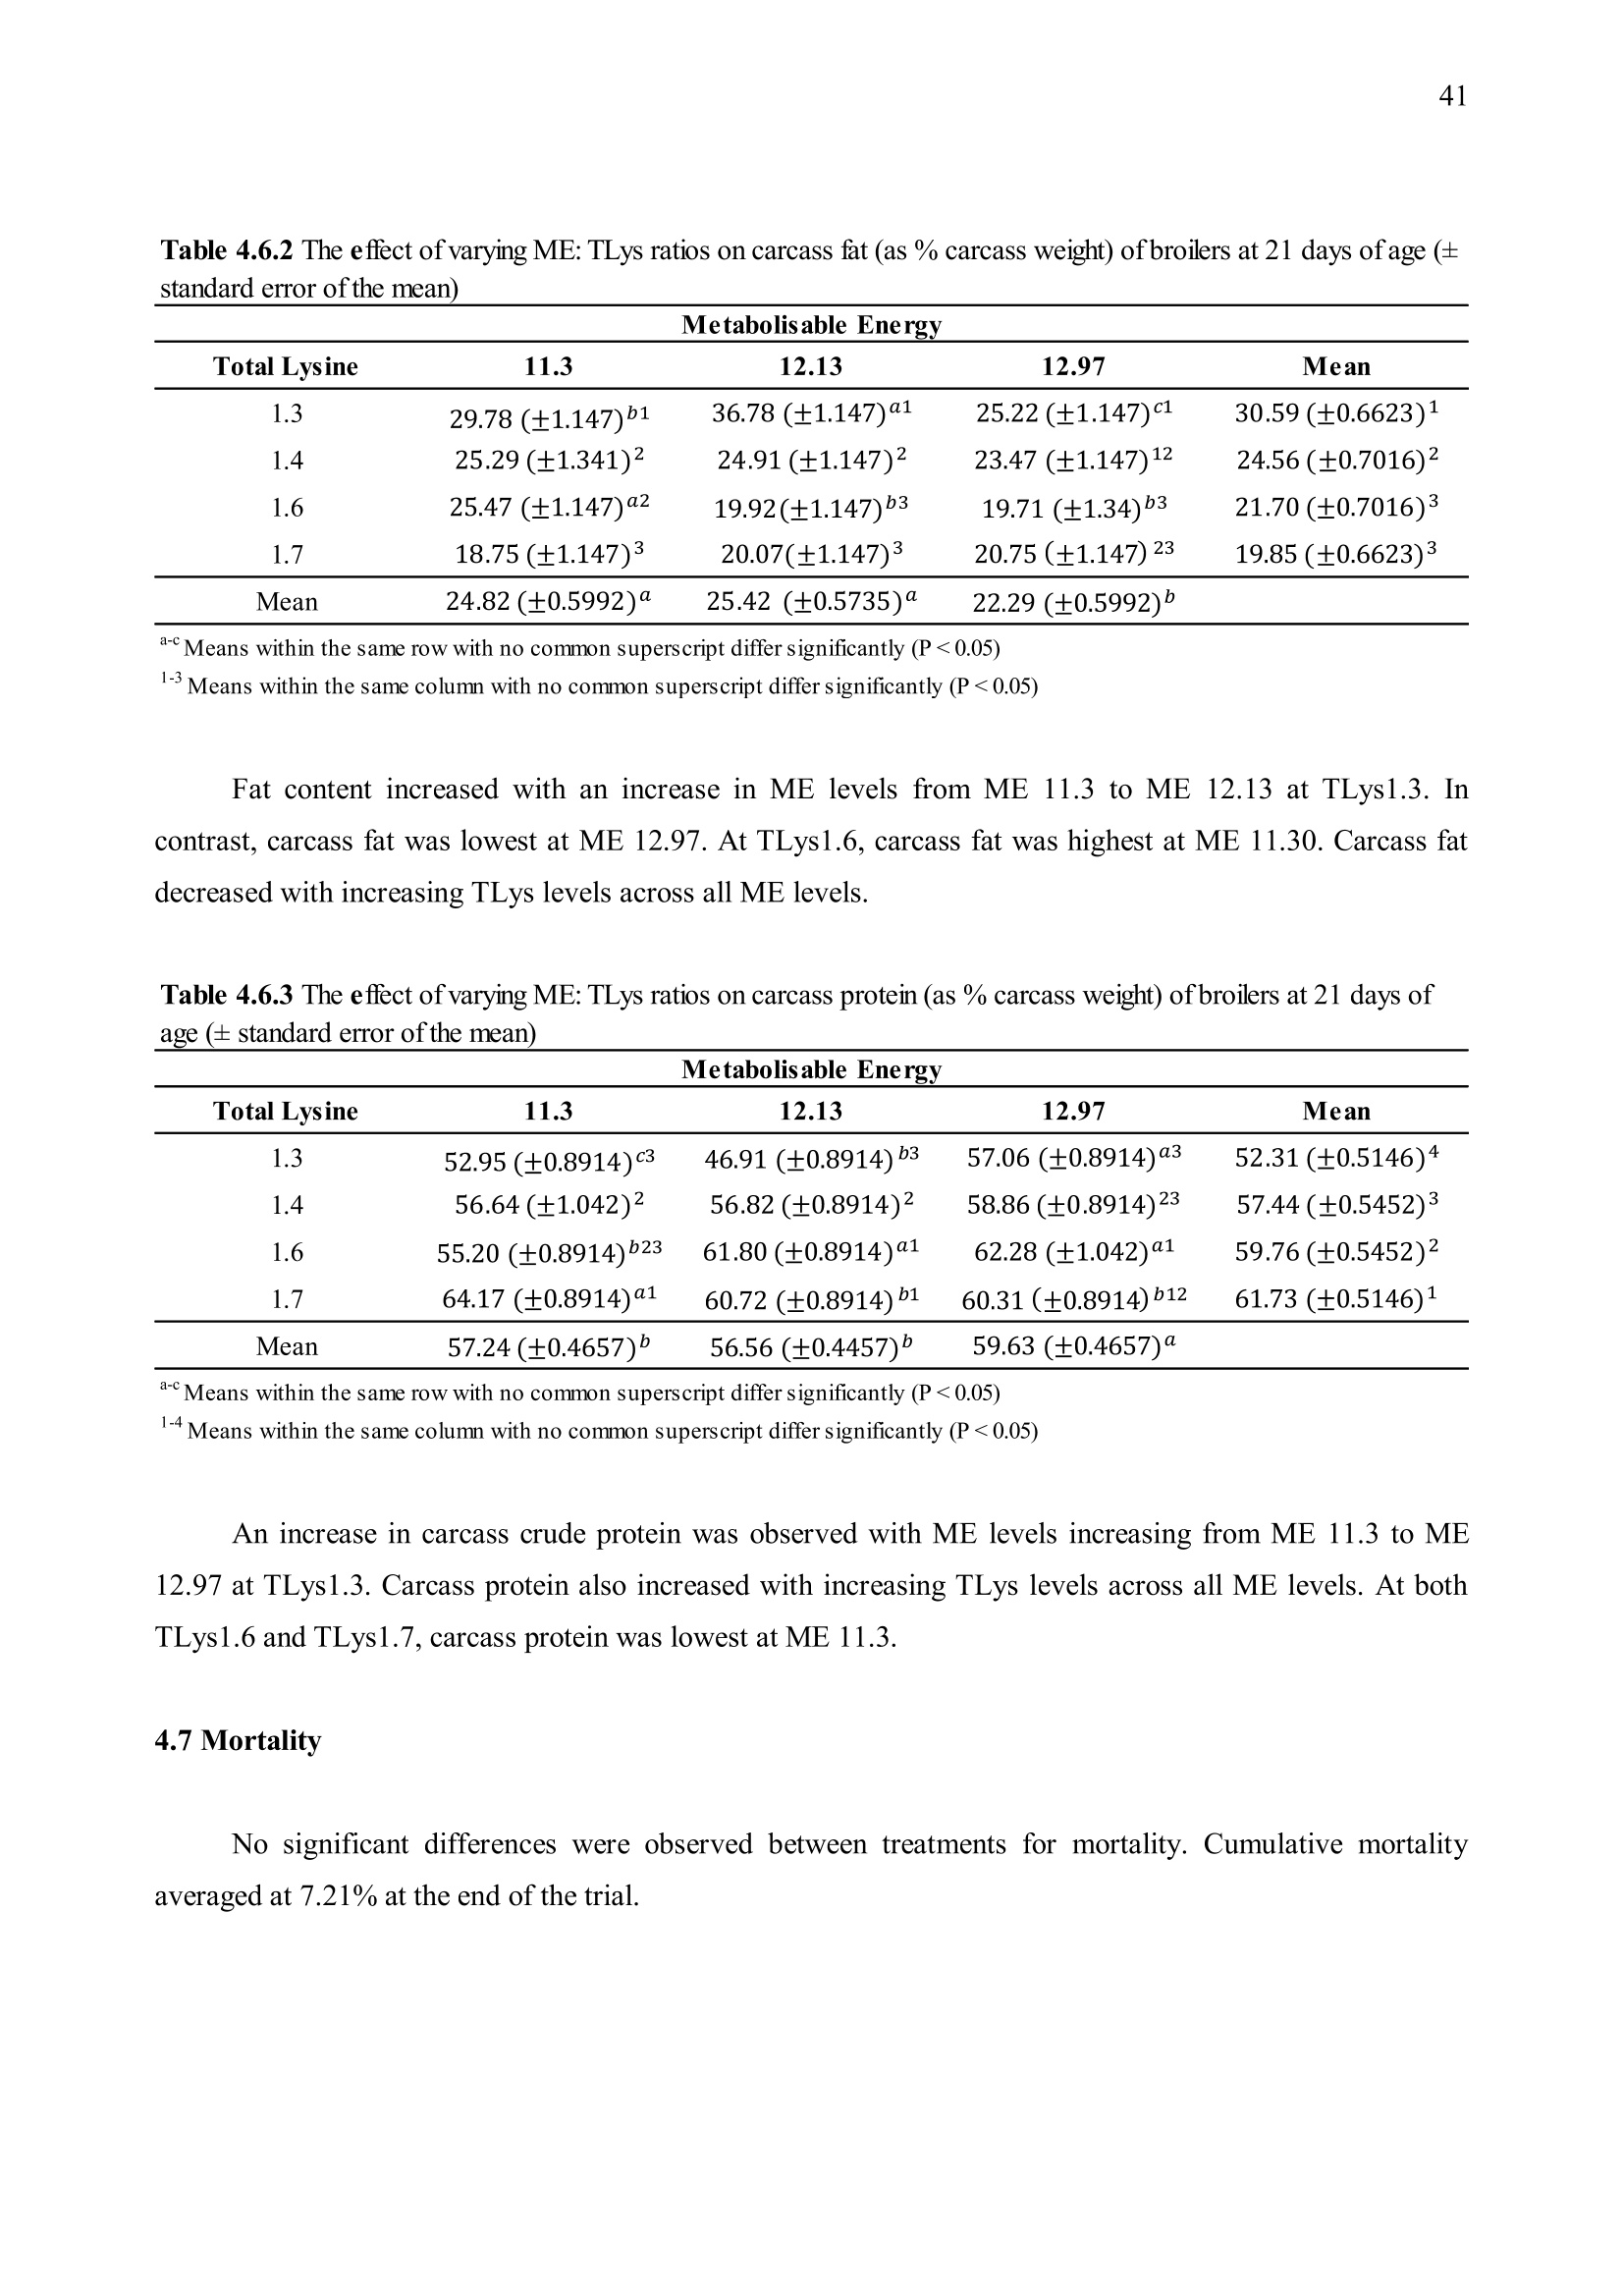
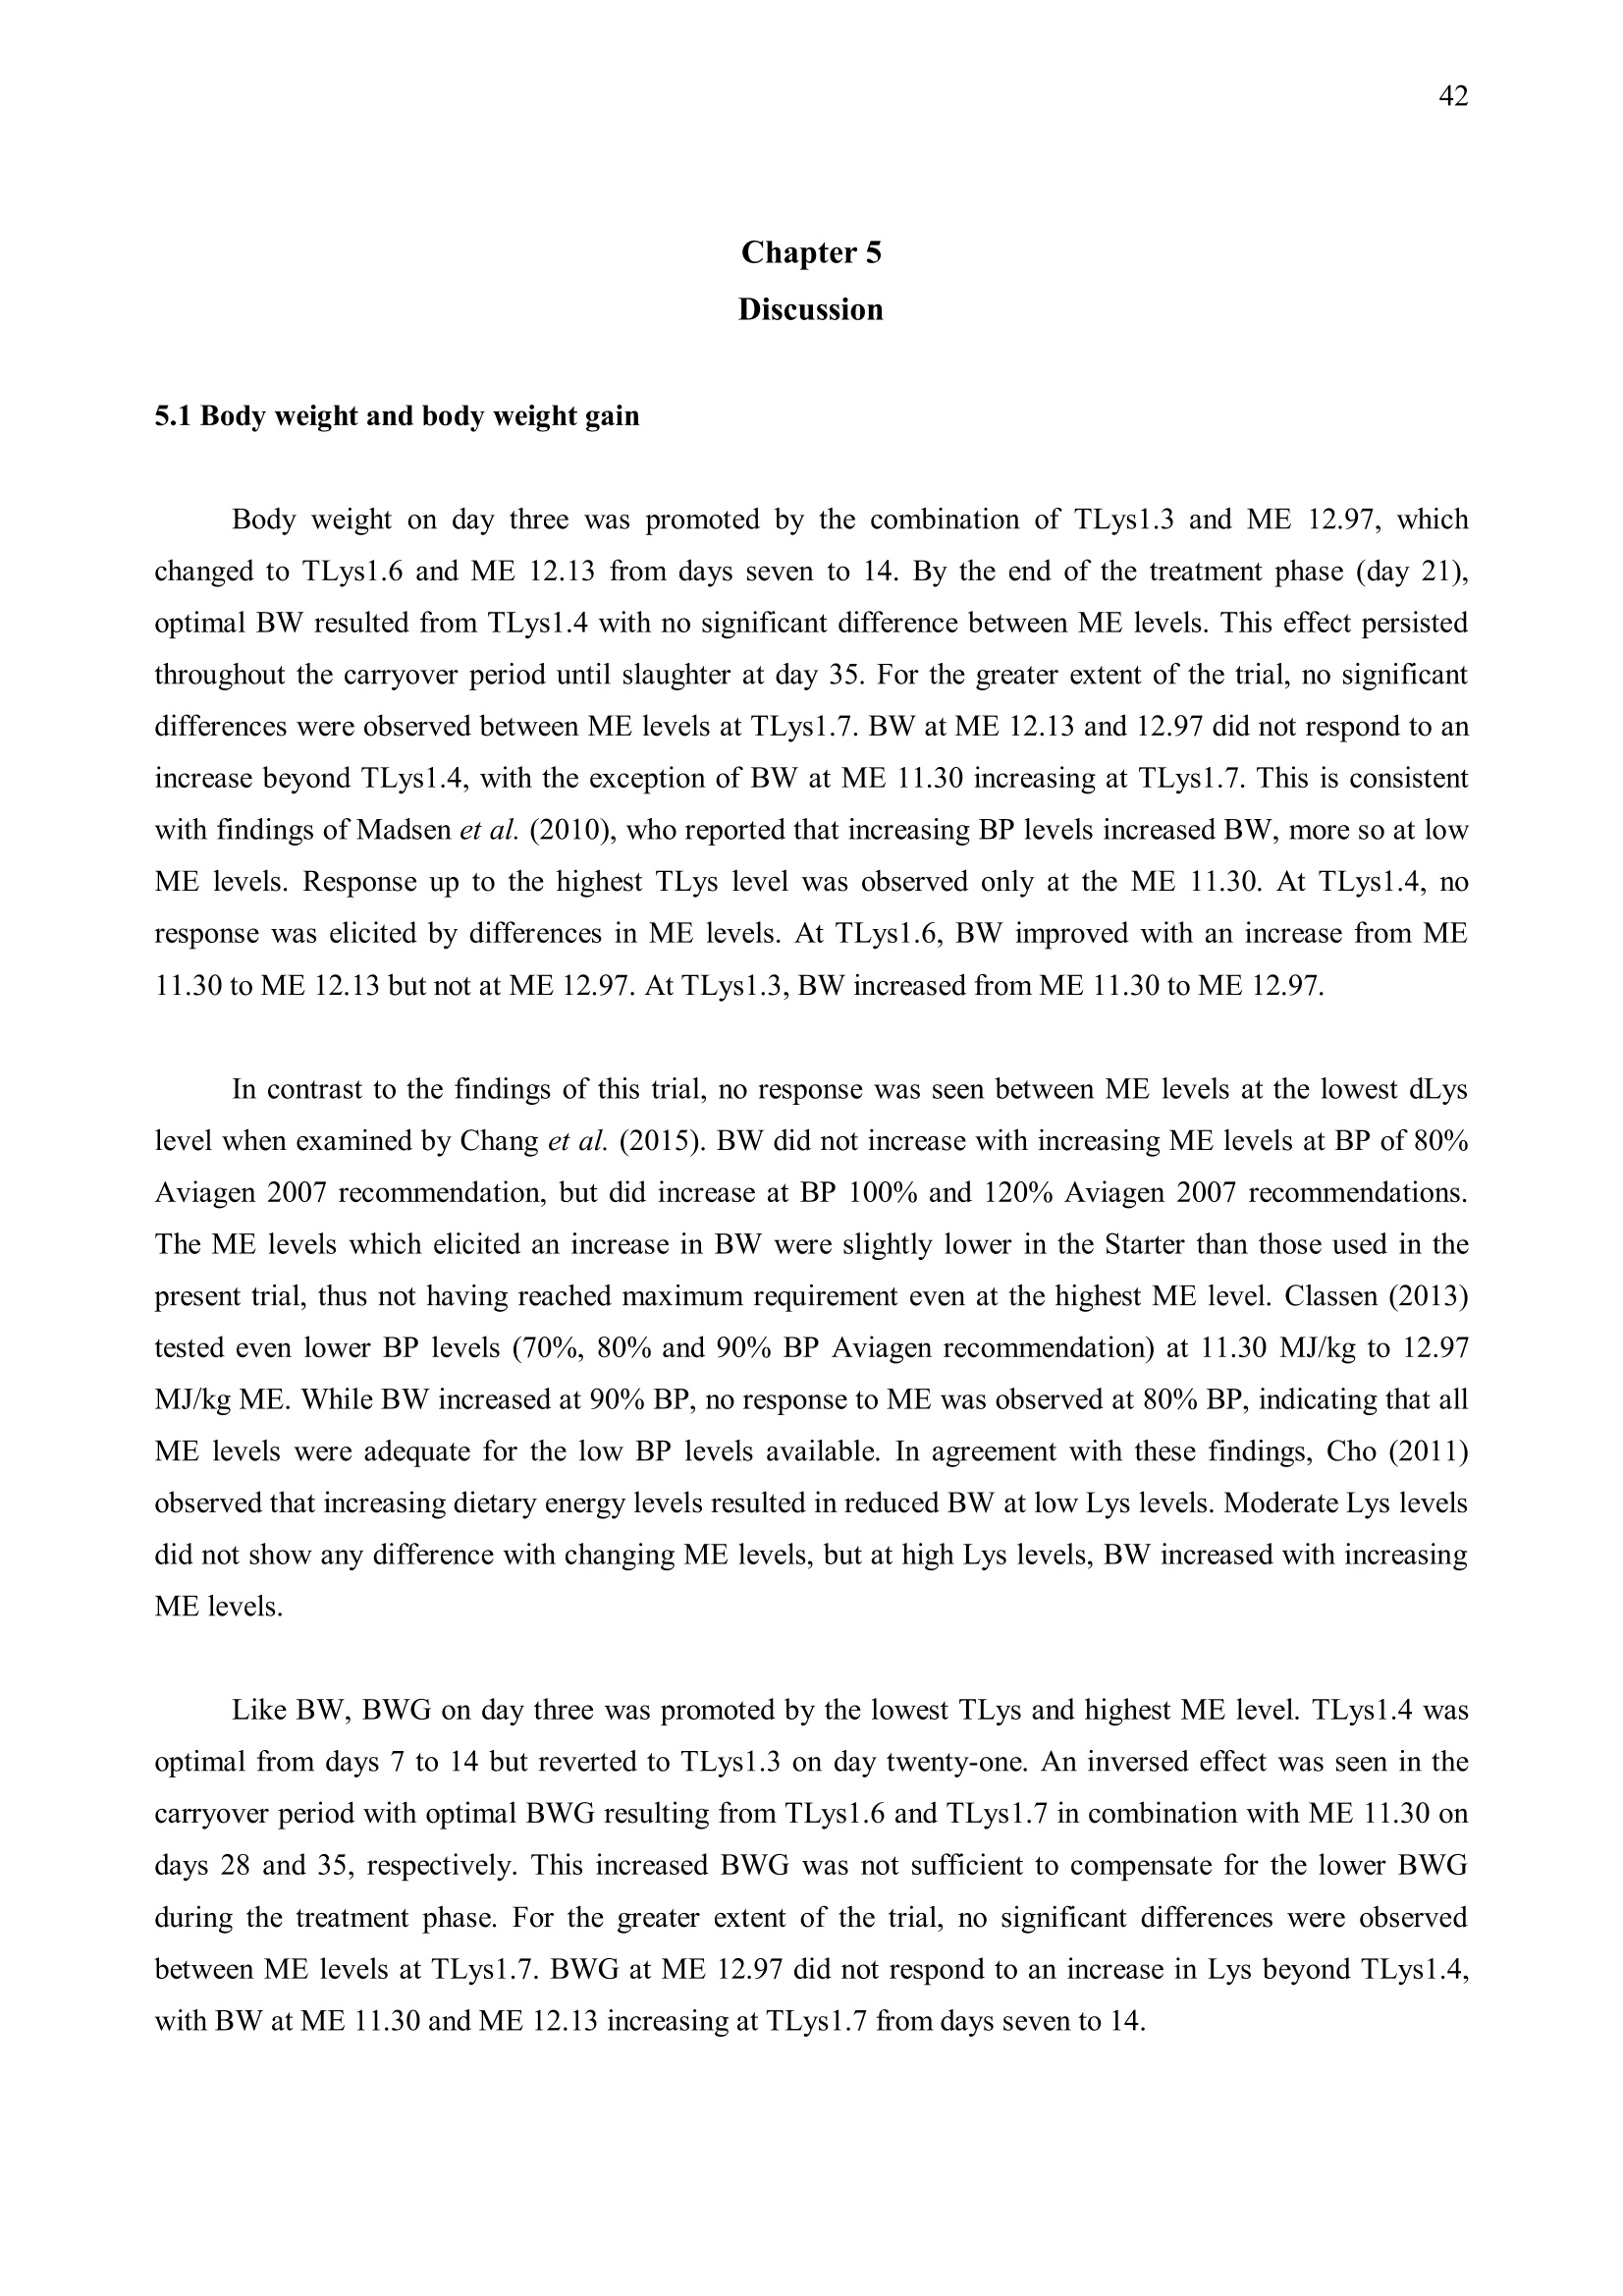
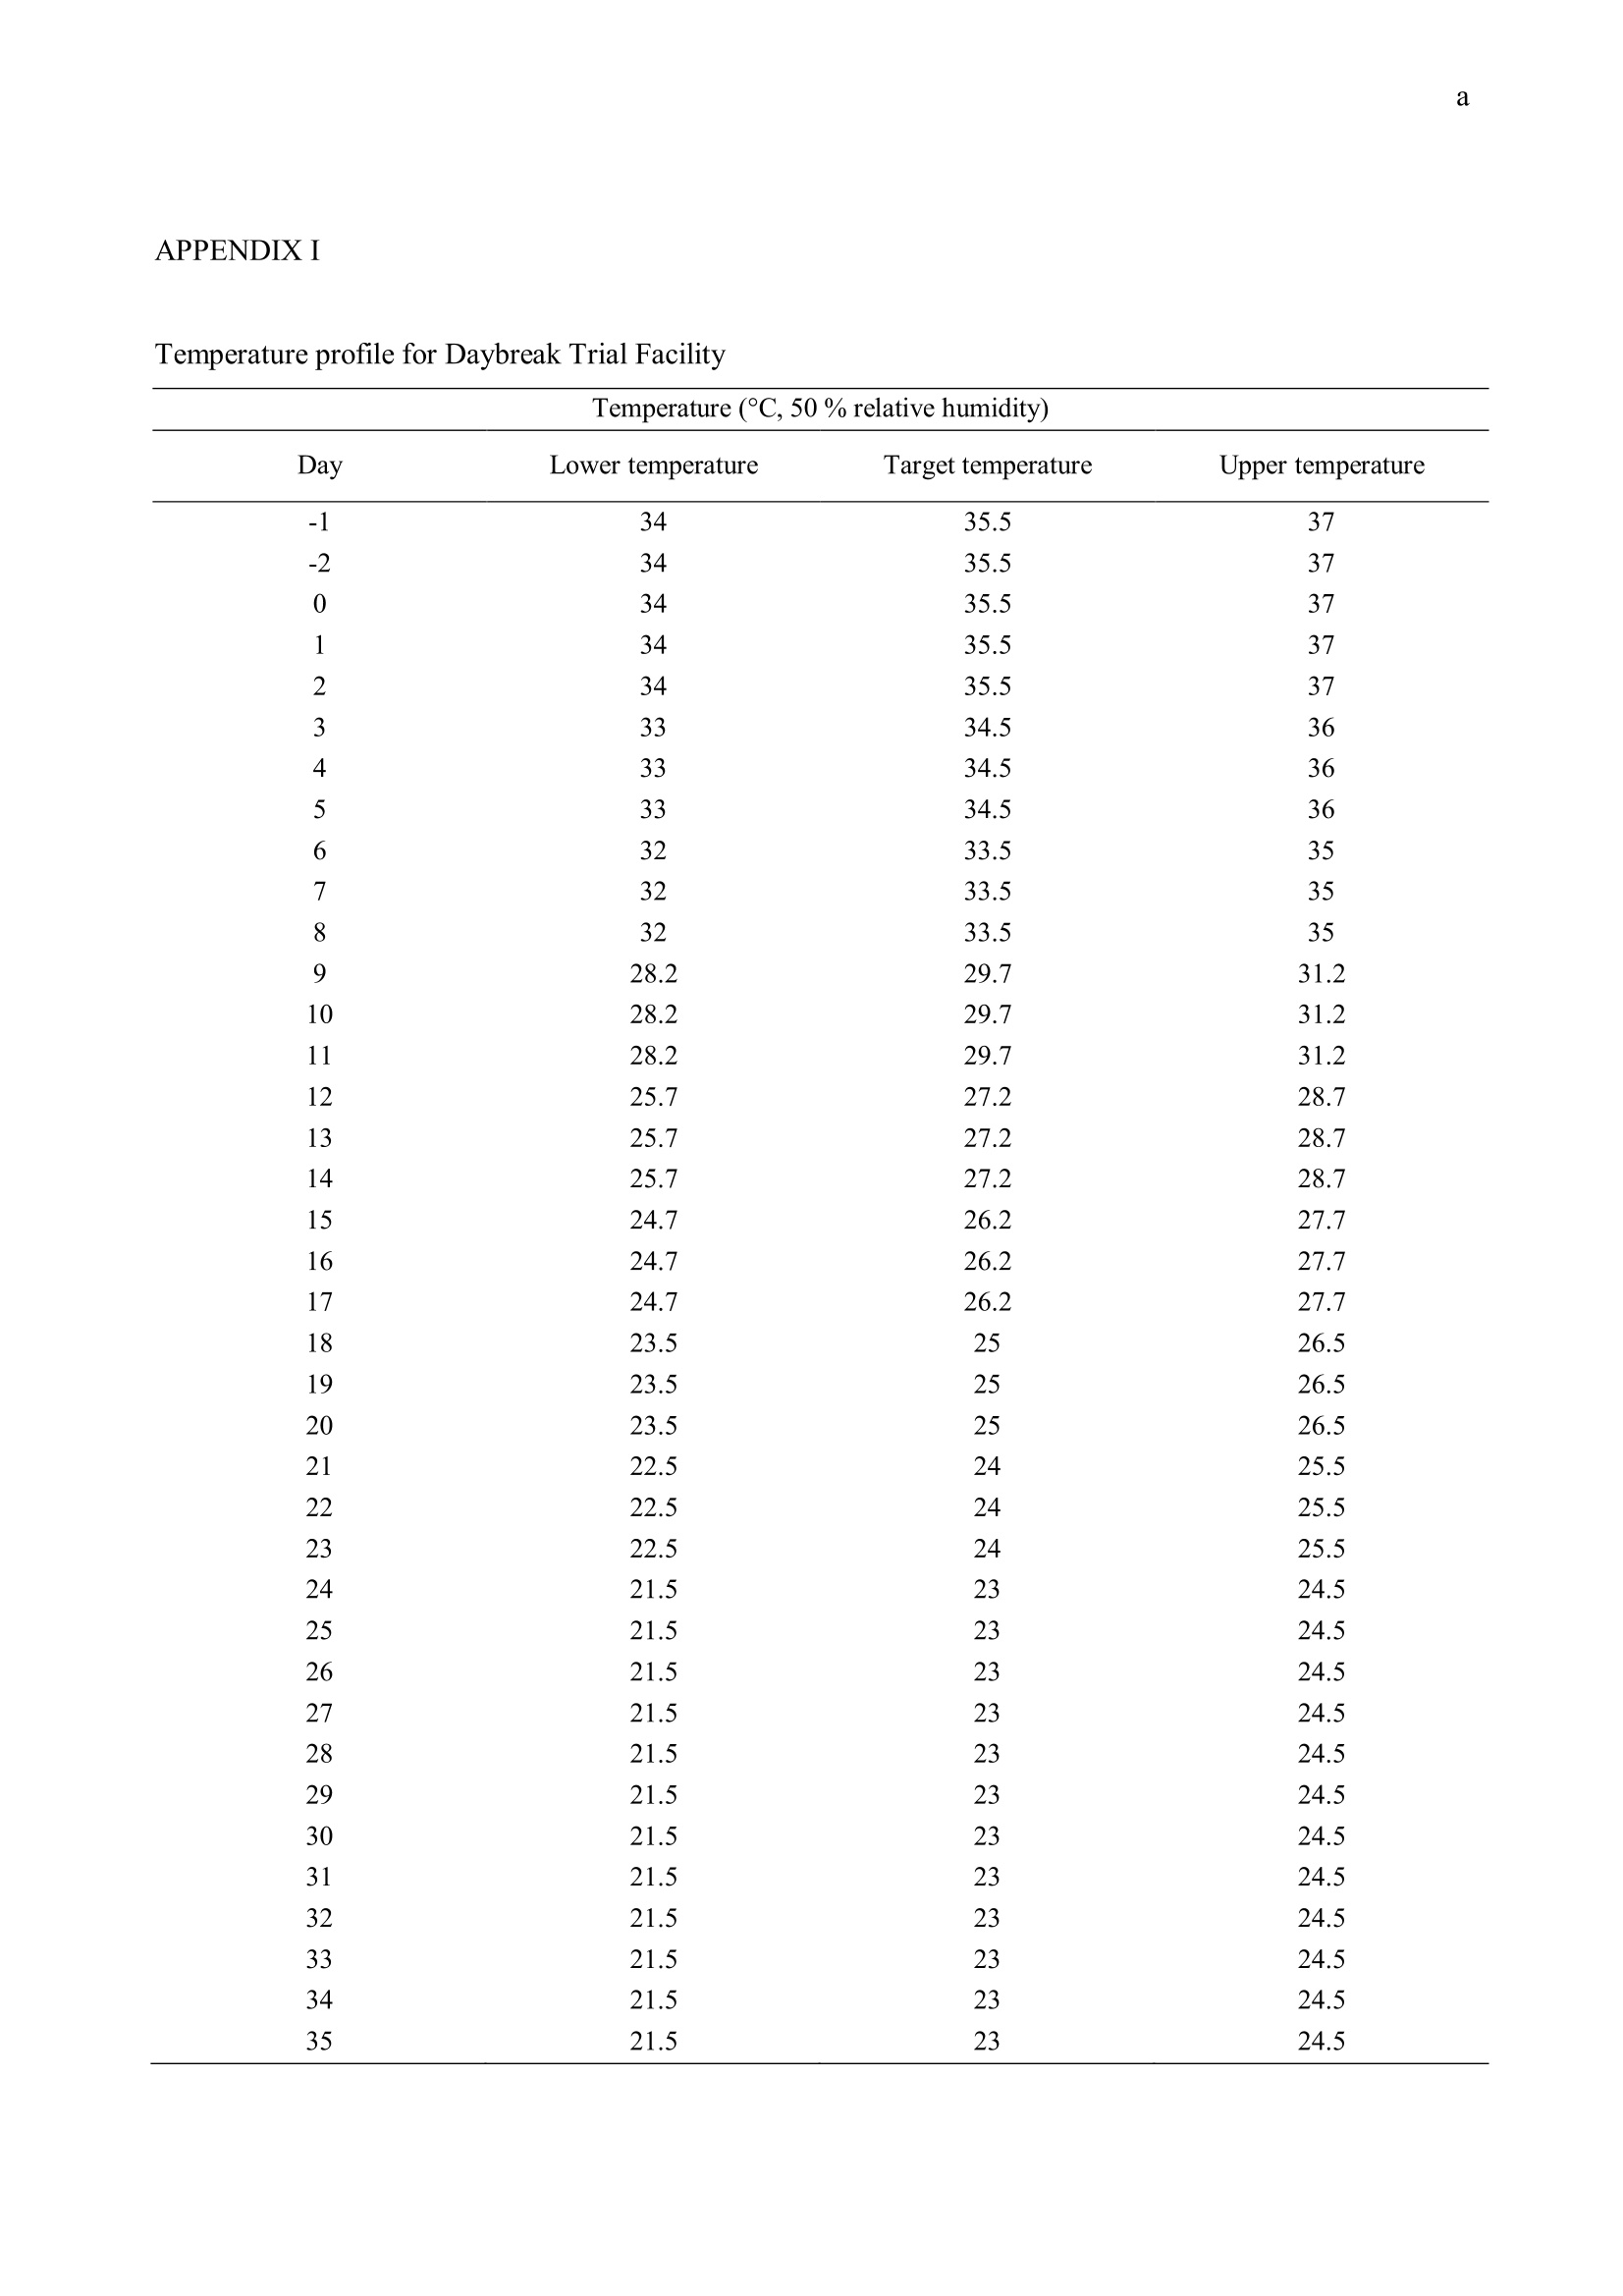
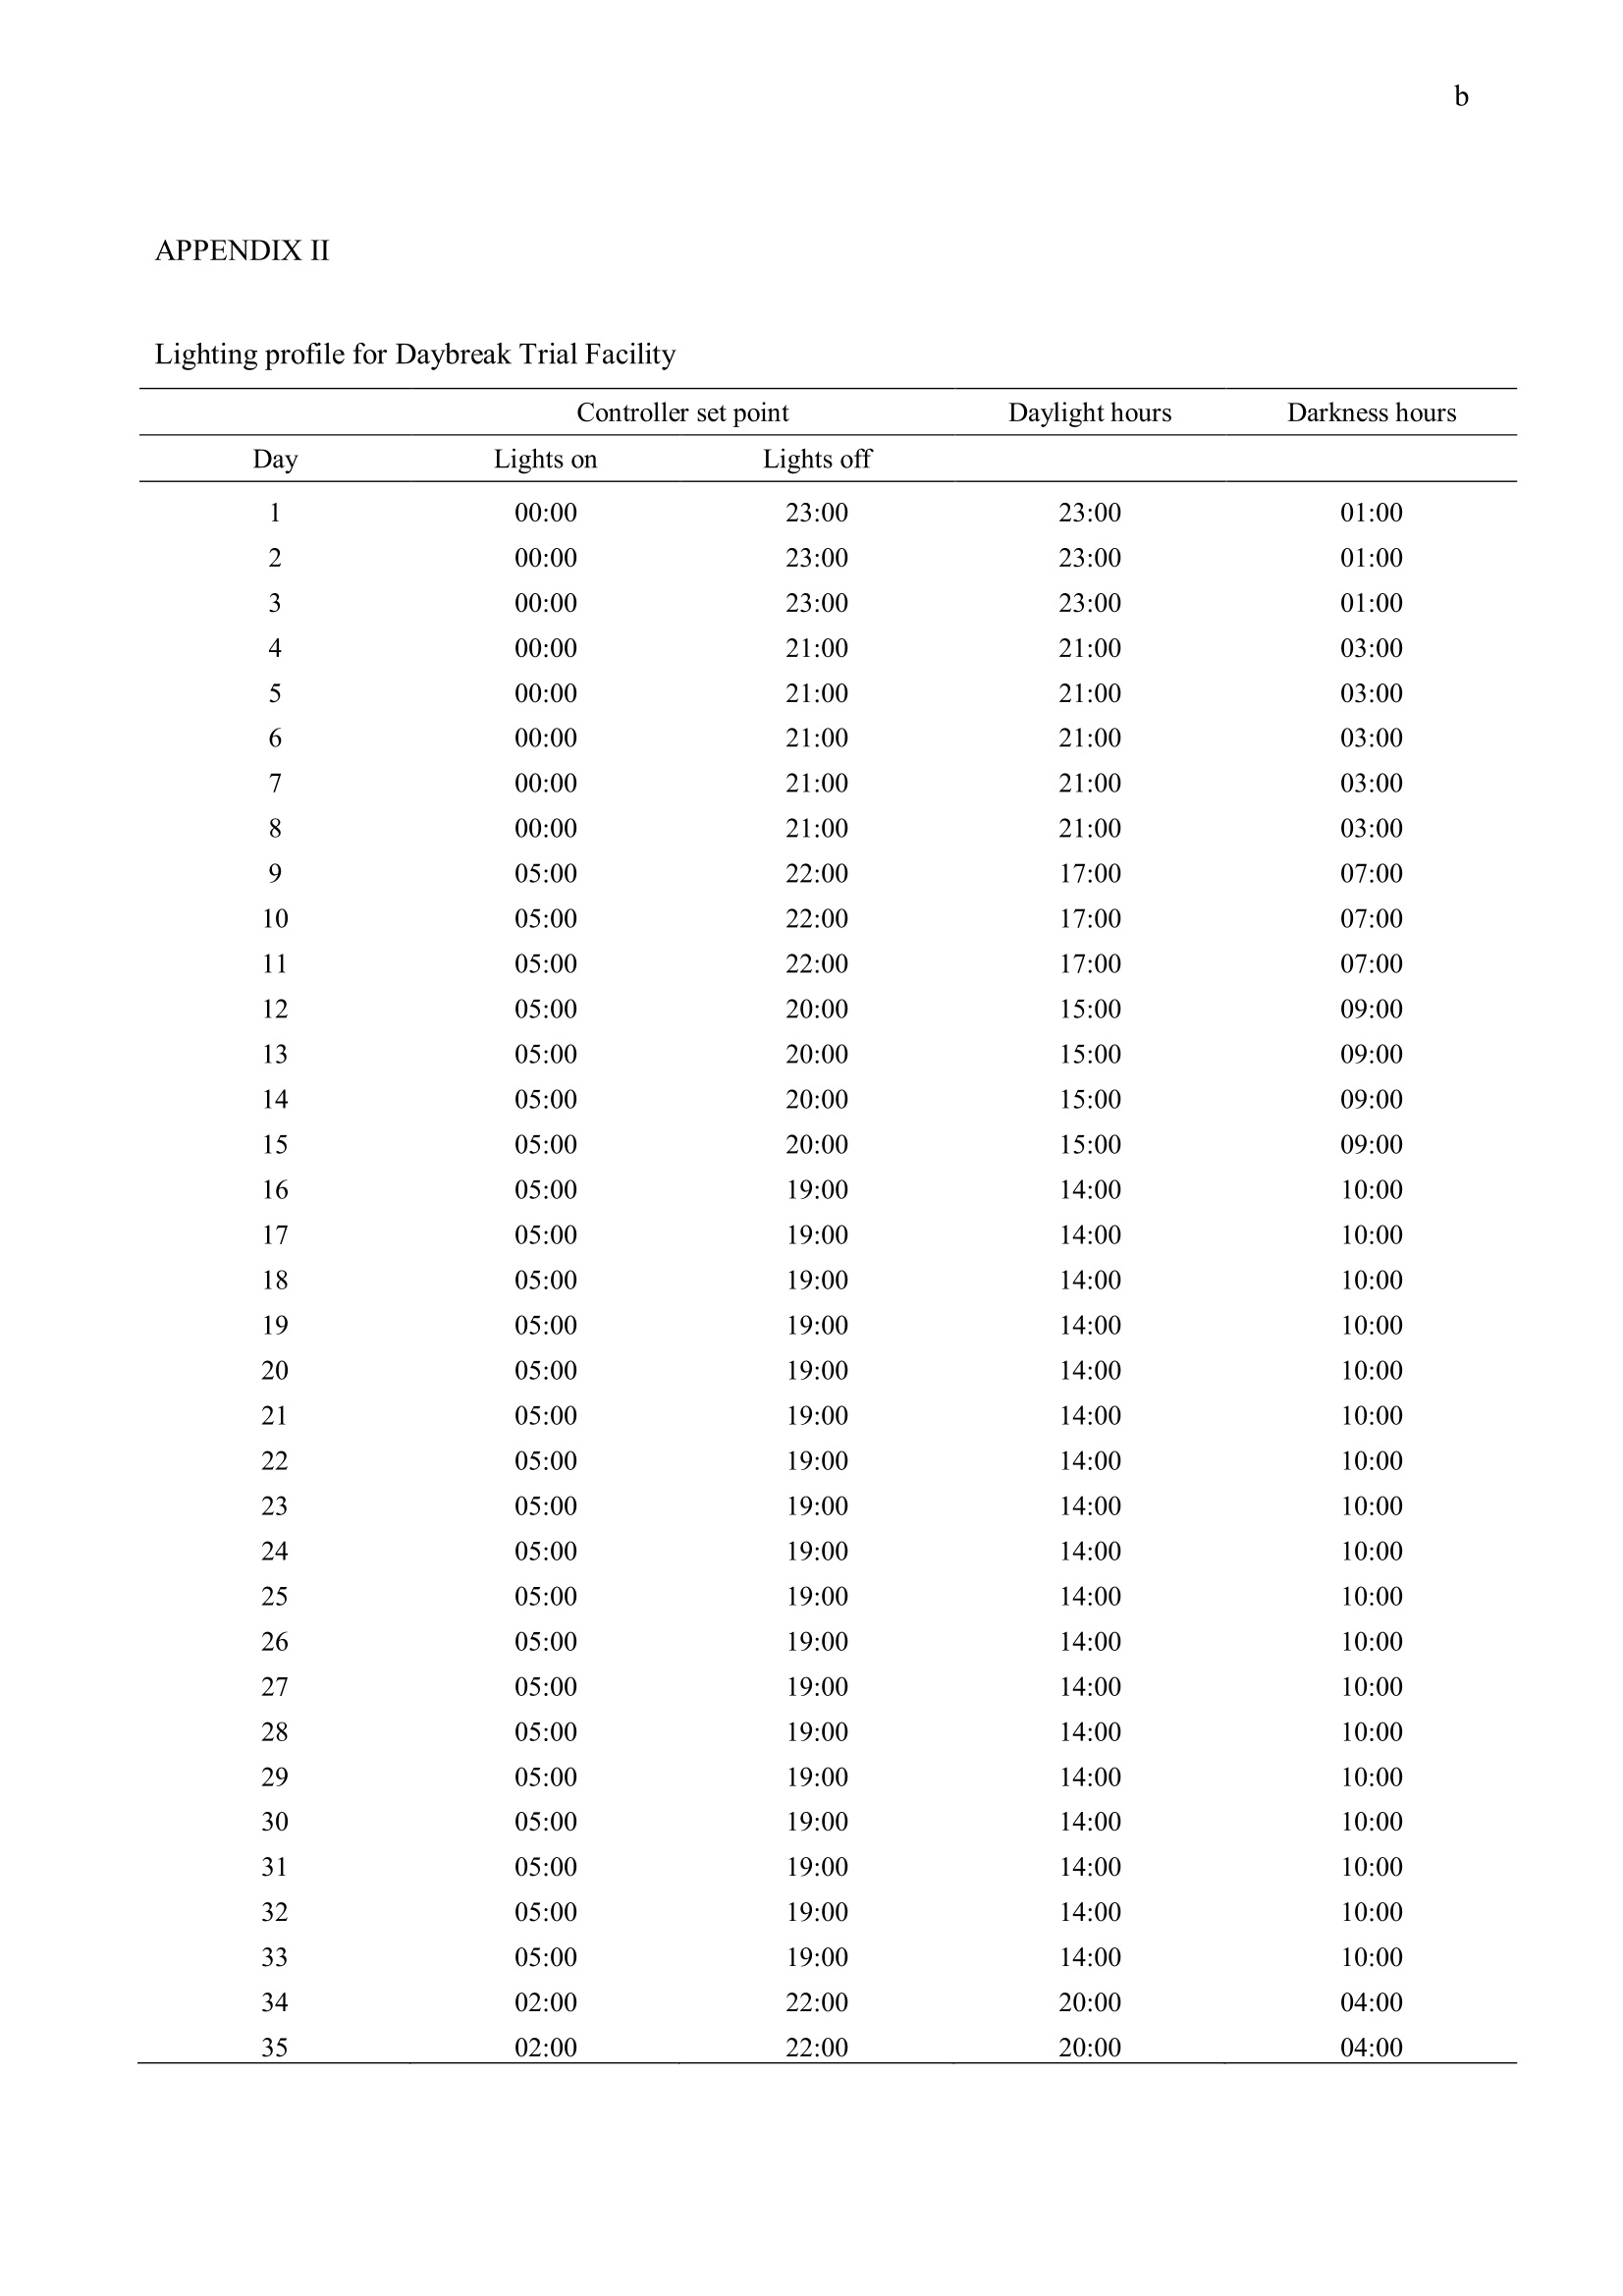
还剩64页未读,是否继续阅读?

产品配置单


中国格哈特为您提供《饲料、肉鸡中总脂肪、蛋白质、粗纤维检测方案(抽提萃取)》,该方案主要用于饲料中营养成分检测,参考标准--,《饲料、肉鸡中总脂肪、蛋白质、粗纤维检测方案(抽提萃取)》用到的仪器有格哈特全自动超级总脂肪测定系统、格哈特凯氏消化系统KT8S、格哈特全自动型纤维分析仪FT12、格哈特杜马斯定氮仪DT N Pro、凯氏定氮催化片、德国移液器MM
相关方案
更多
该厂商其他方案
更多