


方案详情
文
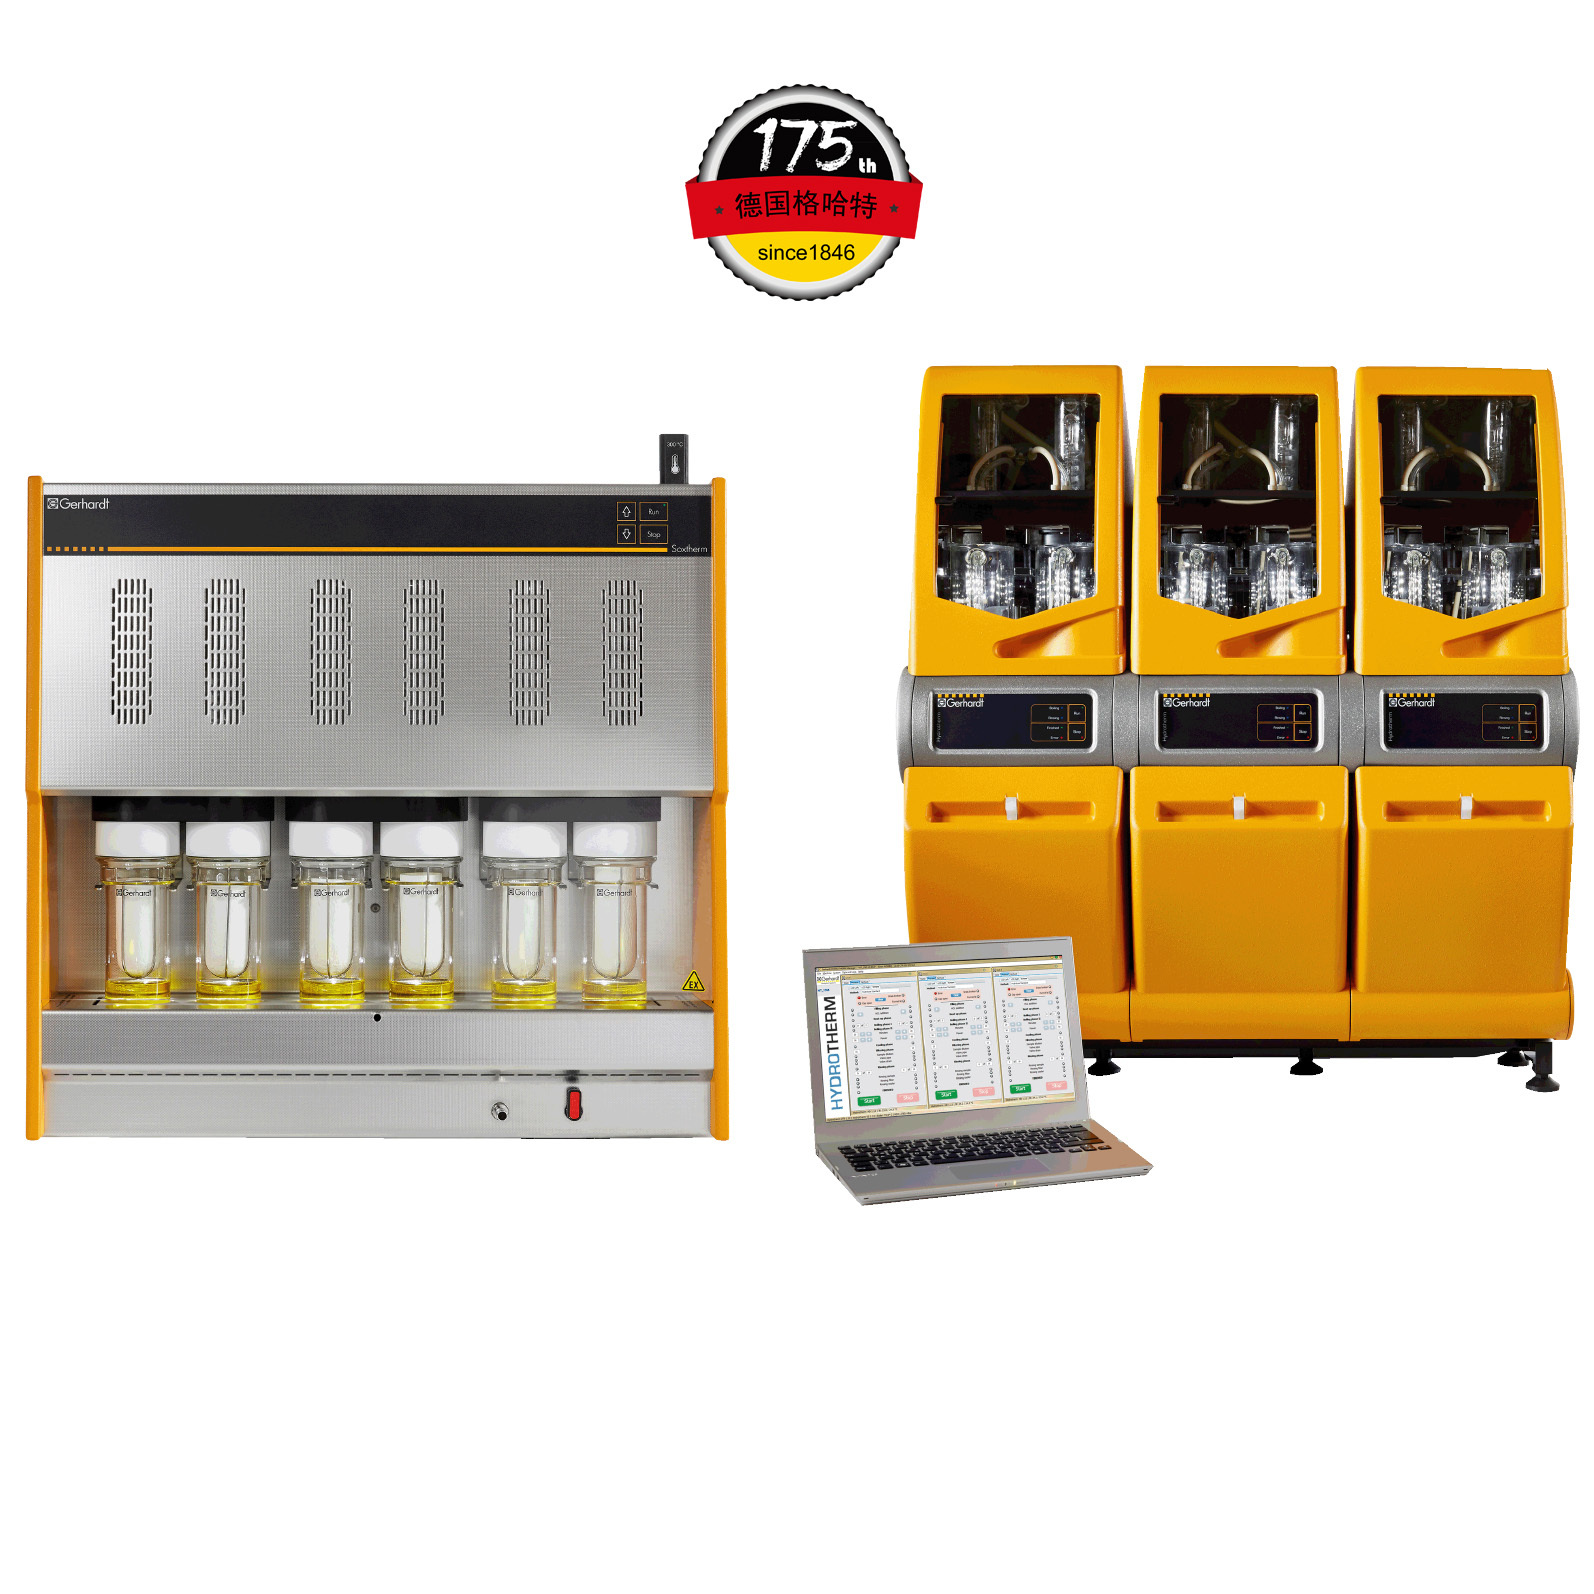
使用格哈特公司凯氏定氮仪测定虹鳟鱼鱼肉,及其粪便中蛋白质含量,使用格哈特公司海卓森Hydrotherm全自动超级酸水解结合索克森Soxtherm全自动快速索氏提取仪测定虹鳟鱼鱼肉,及其粪便中总脂肪含量。
方案详情

Effects of the type of dietary non-protein energy source on the size and composition of the total body bile acid pool, on faecal bile acid loss and on bile acid synthesis were investigated in rainbow trout. Two diets were formulated (similar DP:DE ratio) that differed in the inclusion of either maize starch (Starch) or rapeseed oil (Fat) as main non-protein source. Fish were fed to satiation for 44 days. Type of non-protein energy source did not substantially affect the body bile acid pool composition. However, feeding the Starch diet resulted in a larger total body bile acid pool size compared with the Fat diet, and this despite enhanced faecal bile acid loss when feeding the Starch diet that was related to more faeces being produced. Bile acid synthesis in fish fed the Starch diet was more than two times higher compared with fish fed the Fat diet. The difference in body bile acid pool size between diets suggests upregulation of bile acid synthesis in fish fed the Starch diet beyond the level needed to compensate for the higher faecal bile acid loss and/or downregulation of bile acid synthesis in fish fed the Fat diet. The underlying mechanisms for this difference in synthesis need further investigation.在彩虹鳟鱼中研究了膳食非蛋白质能量来源类型对全身双酸池大小和组成,对粪便双酸损失和双酸合成的影响。制定了两种饮食(类似的DP:DE比率),不同的是包括玉米淀粉(淀粉)或菜籽油(脂肪)作为主要的非蛋白质来源。鱼被喂食了44天。非蛋白质能量来源的类型并没有显著影响身体的双酸池成分。然而,与脂肪饮食相比,喂食淀粉饮食会导致更大的身体总胆酸池大小,尽管当喂食淀粉饮食时,粪便胆酸的损失会增加,这与产生更多的粪便有关。淀粉饲料中的氢氟酸合成量是脂肪饲料中氢氟酸合成量的两倍多。不同饮食之间体内双酸池大小的差异表明,淀粉饮食中鱼类中双酸合成的上调超过了补偿较高粪便双酸损失和/或脂肪饮食中鱼类中双酸合成的下调所需的水平。这种合成差异的根本机制需要进一步研究。Revised: 16 December 2020Accepted: 21 January 2021Received: 22 August 2020DOI: 10.1111/anu.13231 STAESSEN ET AL.Aquaculture Nutrition 1Aquaculture Nutrition. 2021;00:1-15.wileyonlinelibrary.com/journal/anu ORIGINAL ARTICLE 膳食非蛋白质能量来源(淀粉与脂肪)对虹鲜鱼体内胆汁酸池大小和组成、粪便胆汁酸损失和胆汁酸合成的影响 Effect of type of dietary non-protein energy source (starch Vs.fat) on the body bile acid pool size and composition, faecal bileacid loss and bile acid synthesis in rainbow trout (Oncorhynchusmykiss) Thomas W. O.Staessen@ Marc C. J. Verdegem|Marit A. J. NederlofEp H. EdingJohan W. Schrama Aquaculture and Fisheries Group,Wageningen Institute of Animal Science(WIAS),Wageningen University,Wageningen, The Netherlands Correspondence Johan W. Schrama, Aquaculture and Fisheries Group, Wageningen Instituteof Animal Science (WIAS), WageningenUniversity, PO Box 338, 6700 AH Wageningen, The Netherlands. Email: johan.schrama@wur.nl Funding information Nederlandse Organisatie voor Wetenschappelijk Onderzoek, Grant/ Award Number: 022.004.005 and 805-34.025; Horizon 2020 Framework Programme, Grant/Award Number: 652831; Cargill; Evonik Nutrition and CareGmbH; Saria Abstract Effects of the type of dietary non-protein energy source on the size and compositionof the total body bile acid pool, on faecal bile acid loss and on bile acid synthesis wereinvestigated in rainbow trout. Two diets were formulated (similar DP:DE ratio) thatdiffered in the inclusion of either maize starch (Starch) or rapeseed oil (Fat) as mainnon-protein source. Fish were fed to satiation for 44 days. Type of non-protein en-ergy source did not substantially affect the body bile acid pool composition. However,feeding the Starch diet resulted in a larger total body bile acid pool size compared withthe Fat diet, and this despite enhanced faecal bile acid loss when feeding the Starchdiet that was related to more faeces being produced. Bile acid synthesis in fish fedthe Starch diet was more than two times higher compared with fish fed the Fat diet.The difference in body bile acid pool size between diets suggests upregulation of bileacid synthesis in fish fed the Starch diet beyond the level needed to compensate forthe higher faecal bile acid loss and/or downregulation of bile acid synthesis in fish fedthe Fat diet. The underlying mechanisms for this difference in synthesis need furtherinvestigation. KEYWORDSbile acid metabolism, enterohepatic circulation, glycine, Oncorhynchus mykiss, taurine 1 INTRODUCTION Synthesis of primary bile acids occurs in the liver by oxidation ofcholesterol. Thereafter, bile acids are conjugated with either taurineor glycine. In fish, bile acids are predominantly conjugated with tau-rine (Hagey et al., 2010). Bile acids are actively secreted into bileand stored in the gallbladder. After a meal, the gallbladder receiveshormonal signals (cholecystokinin), which results in its contraction and the release of bile and bile acids into the intestine (Hagey et al.,2010). In the intestine (i.e. mainly the colon in mammals), bile acidscan be metabolized by bacteria which convert them into so-calledsecondary bile acids (Midtvedt, 1974). The importance of second-ary bile acids formation in fish is not known. The majority of bileacids are actively reabsorbed within the distal part of the intestine,from where they are returned to the liver for reuse (Cai et al.,2007).Under homeostatic conditions, the total bile acid pool size and ( This is an open access article under the terms of the Creative Commons Attribution-NonCommercial-NoDerivs License, which permits use and distribution inany medium, provided the original work is properly c i ted, the use is non-commercial and no modifications or adaptations are made. ◎ 2021 The Authors. Aquaculture Nutrition published by John Wiley & Sons Ltd ) composition is maintained relatively constant, compensating faecalbile acid loss with de novo synthesis (Lanzini & Lanzarotto, 2000).The process described above is known as the enterohepatic circula-tion of bile acids (EHC). The replacement of fish meal and fish oil by plant ingredients inaquafeeds often results in hampered fat digestion (Forde-Skjaerviket al., 2006; Haidar et al., 2016;Olli & Krogdahl, 1994; Refstie et al.,1999). Bile acids play a key role in digestion and absorption of dietaryfat (Tocher, 2010). One of the proposed mechanisms for hamperedfat digestion is an altered bile acid metabolism (e.g. reduced bile acidpool size, enhanced faecal bile acid loss and/or reduced bile acidsynthesis) in fish fed plant-based diets (reviewed by Romano et al.,2020). Several studies with fish showed that bile acid supplementa-tion to plant-based diets (partly) remediates hampered fat digestion(Gu et al., 2017; Iwashita et al., 2010; Yamamoto et al.,2007). In thecontext of the ongoing replacement of fish meal and fish oil by plantalternatives, this highlights the need to increase our fundamentalunderstanding of the interaction between nutritional factors, thebile acid metabolism and fat digestion in fish. Studies investigating alterations of the bile acid metabolism infish have been predominantly focussed on the adverse effects ofantinutrients in soybean meal-based diets (e.g. saponins) and suchstudies consistently reported a decrease in the bile acid content ofthe chyme, gallbladder and/or blood compared with fish fed fishmeal-based diets (Chikwati et al.,2012; Deng et al., 2013; Gu et al.,2017; Iwashita et al., 2009; Kortner et al., 2013; Krogdahl et al.,2015; Romarheim et al., 2008; Yamamoto et al.,2008). Decreasedchymal bile acid content or gallbladder/blood bile acid concentrationsuggest a reduced total body bile acid pool size and are proposed tobe related to either an increase in faecal bile acid loss or a decreasein bile acid synthesis (Romano et al.,2020). Besides effects of specific antinutritional factors, mammalianstudies show that also dietary macronutrient composition can affectthe bile acid metabolism (reviewed by Chiang, 2013). Macronutrientcomposition can affect bile acid synthesis and the rate of EHC,which in turn were shown to affect bile acid pool size and compo-sition. Hepner (1975) showed that the level of gallbladder contrac-tion, which partly determines the rate of EHC, regulates the bile acidpool size in humans. In that study, lowering the dietary fat level de-creased the level of gallbladder contraction and increased the bileacid pool size. Furthermore, the same study showed that also thebile acid pool composition changed with diet. Decreasing the dietaryfat level resulted in a smaller share of secondary bile acids in thetotal bile acid pool, and this was ascribed to less exposure of pri-mary bile acids to bacteria in the intestine as a result of decreasedgallbladder contraction, and thus decreased EHC. Besides the rateof gallbladder contraction, dietary fat level and fat saturation levelhave also been shown to influence bile acid synthesis. Feeding a diethigh in fat stimulated bile acid synthesis in rats, while a low fat dietdecreased bile acid synthesis (Botham & Boyd, 1983). Furthermore,Cheema et al. (1997) found that the bile acid synthesis in mice wasupregulated (measuring expression of CYP7A1 involved in bile acidsynthesis) in response to a diet high in unsaturated fat. Besides dietary fat level, also dietary carbohydrate level can affect bile acidsynthesis. Andersen and Hellstrom (1980) showed an increase in bileacid synthesis in humans which switched from a diet in which 60%of the energy was supplied by fat to a diet in which the energy wassupplied by carbohydrates. In this study, the increase in bile acid syn-thesis when feeding the high carbohydrate diet was ascribed to thenon-starch polysaccharide fraction. The latter increased faecal bileacid loss, which was consequently compensated by de novo bile acidsynthesis. The effect of dietary macronutrient composition on thebile acid metabolism of fish has not been studied, but could be im-portant to investigate since the increasing use of plant ingredients inaquafeeds translates into increasing dietary carbohydrate fractions(Maas et al., 2020). Based on the above, this study aimed to assess whether the typeof dietary non-protein energy source (Starch vs. Fat) affects the bileacid metabolism (i.e. bile acid pool size and composition, faecal bileacid loss and bile acid synthesis) of rainbow trout (Oncorhynchusmykiss). Two diets were formulated with a similar digestible proteinto digestible energy ratio, but differing in inclusion of either maizestarch (Starch) or rapeseed oil (Fat) as the main non-protein source.Alterations of the bile acid metabolism of fish in response to di-etary changes have until now been shown by indirect measures (e.g.changes in the expression of genes involved in EHC or bile acid syn-thesis, and changes in the bile acid content of the chyme, gallbladderand blood) (Gu et al., 2014; Kortner et al.,2013,2014;Krogdahl et al.,2015; Murashita et al.,2018; Romarheim et al.,2008). Quantitativedata on changes of the bile acid metabolism in response to nutri-tional factors is lacking for fish. Therefore, the current study quanti-fied body bile acid pools and faecal bile acid loss in response to theexperimental diets. Furthermore, using initial and final body bile acidpool size, bile acid intake and faecal bile acid loss, bile acid synthesiswas quantified for the first time in fish by means of a mass balance. 2 MATERIALS AND METHODS This study was conducted in accordance with the Dutch law on theuse of experimental animals (Act on Animal Experiments) and wasapproved by the Central Animal Experiments Committee (CCD) ofThe Netherlands under project number 2017 W.0037. This studywas performed in the experimental facilities of the WageningenUniversity, and fish were kept and handled in agreement with thecurrent EU legislation. 2.1 Feed formulation The experimental diets were formulated to meet or exceed theminimum recommended nutrient requirements of rainbow trout(Oncorhynchus mykiss) according to the National Research Council(NRC,2011). Two diets were formulated with similar digestible protein to di-gestible energy ratio, but differing in the type of main non-protein energy source (Starch vs. Fat). For this, a basal ingredient mixturewas first formulated according to Table 1. Monocalciumphosphateand a vitamin/mineral premix were added to meet the requirementsfor phosphorus, vitamins and other minerals. Methionine and lysinewere supplemented to meet amino acid recommendations. Yttriumoxide was used as inert digestibility marker. This basal ingredientmixture was combined with either maize starch (gelatinized) or rape-seed oil as shown in Table 2. The basal ingredient mixture, eitherwith or without addition of maize starch, was pelleted by extru-sion (3 mm; Research Diet Services, The Netherlands). The rape-seed oil was added to the Fat diet by vacuum coating (WageningenUniversity, The Netherlands). Diets were stored at 4°C throughoutthe experiment. The analysed nutrient content of the diets is shownin Table 2. 2.2 Housing facilities Fish were housed in a flow-through system consisting of 6 glasstanks (90×60× 45 cm; 200 L each). Water temperature was main-tained at 14±1°C and water flow was maintained at 7±0.5Lminusing a water flow meter (MAGFLO MAG 5000, Danfoss A/S,Denmark). Values for NH*-N,NO,-N,NO,-N and conductivity ofthe inlet water were kept <0.5 mg L1,<0.15 mgL,<90 mg Land TABLE 1CComposition of the basal ingredient mixture Ingredients Mixture (parts by weight) Fishmeald 20.00 Wheat 15.49 Wheat gluten 12.00 Soy protein concentrate 12.00 Pea protein concentrate 12.00 Fish oil 1.00 Monocalciumphosphate 1.00 Vitamin/mineral premix 1.00 DL-methionine 0.40 Lysine HCI 0.10 Yttrium oxide 0.01 Total 75.00 Notes:LT fishmeal - crude protein 72%, Triple Nine Fish protein,Esbjerg, Denmark. b Vitamin/mineral premix. Vitamins (IU or g kg-1premix): thiamin, 1 g;riboflavin, 1 g; pyridoxine,1 g; panthotenic acid, 4 g; niacin, 2 g; biotin,0.02 g; cyanocobalamin, 0.0015 g; folic acid,0.2 g; ascorbic acid,10 g; DL-alpha tocopherol acetate, 100 IU; retinyl palmitate,3,000 IU;DL-cholecalciferol, 2,400 IU; sodium menadione bisulphate (51%),1 g; inositol, 40 g; choline, 200 g; butylhydroxytolueen, 10 g; calciumpropionate, 100 g; anti-oxidant BHT (E300-321), 10 g. Minerals (gkgpremix): iron (as FeSO7H,O), 5 g; zinc (as ZnSO·7H,O),3 g; cobalt(as CoSO·7H,O),0.01 g; copper (as CuSO·5H,O),1 g; selenium (asNa,SeO,), 0.05 g; manganese (as MnSO4H,O), 2 g; magnesium (asMgSO ·7H,O), 50 g; chromium (as CrCl·6H,O),0.1 g; calcium (asCalOg·6H2O),0.2g. TABLE 2 Composition and analysed nutrient content of theexperimental diets Dietd Starch Fat Ingredients (parts by weight) Basal ingredient mixture 75 75 Maize starch (gelatinized) 25 Rapeseed oil 10 Total 100 85 Ingredients (gkg~) Basal ingredient mixture 75.0 88.2 Maize starch (gelatinized) 25.0 Rapeseed oil 11.8 Analysed nutrient content(g kgDM) DM(gkgWW) 942 971 Ash 63 73 Crude protein (N×6.25) 474 558 Crude fat 50 178 Total carbohydrates 413 191 Gross energy (kJ g"DM) 20.3 22.4 DP:DE(g MJ-1) 26.2 26.1 Yttrium 0.09 0.10 Total bile acids (umol kg1DM)d 257 330 Abbreviations: DE: digestible energy; DM: dry matter; DP: digestibleprotein; N: nitrogen; WW: wet weight. Starch: diet with maize starch (gelatinized) as main non-protein energysource; Fat: Diet with rapeseed oil as main non-protein energy source.Composition of the basal ingredient mixture is given in Table 1. Total carbohydrates = 1000-(ash+ crude protein + crude fat). “Dietary content of individual bile acids is given in Table 3. <4000 uS cm, respectively. The pH of the inlet water was keptwithin the range of 7.0-8.0. The concentration of dissolved oxygenin the inlet was maintained at a level of 10±0.1 mg Ll by an oxygen-ator, which was controlled by a mass flow controller (Brooks Model5850S; Brooks Instruments) and a microprocessor (Brooks ReadOut and Control Electronics Model 0154; Brooks Instruments). Theoutlet of each tank was located at the lowest point of the slopingbottom and was connected to a swirl separator (44 cm in height,24.5 cm in diameter; Aqua Optima A/S) that collected faeces anduneaten feed pellets. A photoperiod of 12-h light and 12-h darknesswas maintained for the entire duration of the experiment. 2.3 Experimental procedures and sampling Diets were randomly assigned to the experimental units (i.e. tanks)in triplicate. Rainbow trout (Oncorhynchus mykiss) were obtainedfrom the French National Institute for Agricultural Research (INRA,France). At the beginning of the experiment, fish were starved for24 hr to allow emptying of the gastro-intestinal tract. Ten fish from the base population were euthanized by an overdose of anaesthetic(1 ml L-12-phenoxyethanol) and the whole body was sampled fordetermination of body nutrient composition and the total body bileacid pool. The remaining fish (initial body weight (BW) 202 g fishaveraged over diets) were batch weighed and randomly distributedover the experimental units at a stocking density of 25 fish tank.Fish were hand-fed for 44 days, twice daily (9:00 and 16:00 hr), toapparent satiation. The fish were considered to have reached appar-ent satiation when they stopped feeding or when the feeding timeexceeded more than 1 hr. To allow accurate determination of thefeed intake,uneaten feed pellets were collected using the swirl sep-arators and by siphoning of the tanks if necessary. A feed sample of100 g was taken weekly from each diet, pooled per diet and storedat 4°C until analysis. Tanks were checked for mortality twice dailybefore feeding. Faeces were collected overnight using the swirl sep-arators, and faecal collection bottles were submerged in ice water tominimize bacterial decomposition. Faeces were collected and pooledper tank for the entire experimental period starting from week 2.The collected faeces were stored at -20°C awaiting analysis. At theend of the experiment, fish were starved again for 24 hr and batchweighed. From each tank, 10 fish were euthanized by an overdose ofanaesthetic (1 ml L-12-phenoxyethanol) and sampled for determina-tion of final body nutrient composition and body bile acid pool. Bothinitial and final fish samples were stored at -20°C awaiting analysis. 2.4 Analytical methods Faecal samples were dried at 70°C until constant weight. Frozen fishsamples were cut into small pieces using a band saw and homog-enized by grinding two times in a meat mincer with a 4.5 mm die(TW-R 70, Feuma Gastromaschinen GmbH, Germany). A subsam-ple of minced fish was freeze-dried. A mixer mill (MM 200 Retch,Brinkmann, Germany) was used to pulverize the dried faeces (12,000RPM; 1 mm fixed screen opening), diets and freeze-dried fish sam-ples (18,000 RPM; without fixed screen). Proximate composition andbile acids in the diets, faeces and fish was analysed in triplicate. Drymatter (DM), ash and mineral content of the fish were analysed di-rectly on the minced fish samples, while protein, fat, energy and bileacid levels were analysed using the freeze-dried fish samples. Dry matter (DM) was determined gravimetrically by drying sam-ples until constant weight at 103℃ (ISO 6496,1999). Ash contentwas determined gravimetrically by incineration of samples until con-stant weight in a muffle furnace at 550°℃ (ISO 5984,2002).Yttrium,phosphorus, calcium and magnesium content of the samples weremeasured by ICP-OES (NEN 15510,2007). Crude protein (Nx6.25)content was measured according to Kjeldahl's method (ISO 5983-2,2009). Crude fat was determined gravimetrically using acid hydroly-sis (Hydrotherm, C. Gerhardt GmbH & Co. KG) paired with Soxhletextraction using petroleum-ether (Soxtherm, C. Gerhardt GmbH& Co. KG) (ISO 6492, 1999). Gross energy was measured using abomb calorimeter (C7000 IKA, IKA-Werke GmbH & Co. KG) (ISO9831, 1998). Bile acids were extracted from the feed, faeces and fish samples according to the method described by Li et al.(2015)with some minor modifications. Samples (100 mg) were weighed di-rectly into 2.2 ml Eppendorf Safe-Lock Tubes. Two ml of absoluteethanol was added, and samples were sonicated at 55℃ for 30 minusing a bath sonicator (UR-324 T Retsch, Brinkmann, Germany). Thesamples were subsequently heated at 80°C for 30 min using a warmwater bath (SW23, Julabo GmbH). After cooling, samples were cen-trifuged at 11,000 g for 10 min (Centrifuge 5430, Eppendorf AG.Germany). The supernatant was aspirated and retained. The pelletswere resuspended in 2 ml of absolute ethanol, heated and centri-fuged as before. The supernatants were aspirated and each pooledwith the first supernatant. The pellets were subsequently resus-pended a third and fourth time in 2 ml methanol/chloroform (1:1,v/v), with intermediate heating, centrifuging and aspirating as be-fore. The pooled bile acid extracts were evaporated at 40°C (Blockheater SBH200D/3, Stuart, UK) under a continuous stream of air(Sample concentrator SBH CONC/1, Stuart, UK). Samples werereconstituted in 1 ml of methanol and filtered by a syringe-drivenfilter unit (Nylon membrane 0.2 um, VWRQ). Bile acids were mea-sured using liquid chromatography-tandem mass spectrometry(HPLC-MS/MS) (Institute for Clinical Chemistry and LaboratoryMedicine, University of Regensburg, Germany) according to Schereret al. (2009). In total, 21 bile acids were analysed: cholic acid (CA),chenodeoxycholic acid (CDCA), deoxycholic acid (DCA), lithocholicacid (LCA), hyocholic acid (HCA), ursodeoxycholic acid (UDCA), hy-odeoxycholic acid (HDCA), and all their taurine (T-) and glycine (G-)conjugates.Detection limits for each bile acids and extraction recov-eries can be found in Table S1. 2.5 Calculations 2.5.1 Performance indicators Mortality (%) was calculated as ((N-N)/N)x100, where N and N.are the initial and final number of fish per tank, respectively. Feedconversion ratio (FCR; g DM g-) was calculated as (FI xdmF)/(W-W), where Fl is the total feed intake (g fish-), dmF is the DM con-tent of the feed (%), and W, and W. are the mean initial and finalBW (g fish-1), respectively. The geometric mean BW (W,, g fish-1)was calculated as e (n Wt + In W0)/2). Daily feed intake (% BW d-1) wascalculated as ((FI×dmF)/t/W)x100, where t is the length of theexperimental period in days (d). Faeces production (RFP,% BW d)was calculated as ((FIx dmF×(D/F))/t/W)x 100, where D. is thepercentage inert marker of the diet DM, and F. is the percentageinert marker of the faeces DM. Specific growth rate (SGR; % BW d)was calculated as ((In W -In W )/t)×100. 2.5.2 Apparent nutrient digestibility Total carbohydrates (g kg"DM) in feed and faeces was calculated as1000-ash-crude protein-crude fat, with ash, crude protein, crude fat and starch +sugars expressed in g kgDM. The apparent digest-ibility coefficient (ADC;%) of each nutrient was calculated using theformula described by Bureau et al. (2003): 100-(100×(F/D)×(D/F.)), where D is the percentage nutrient (or kJ ggross energy) ofthe diet DM, and F the percentage nutrient (orkJ ggross energy)of the faeces DM. 2.5.3 BBile acids Total dietary bile acid content (Dbiletotai umol kgDM), total bodybile acid pool size (BBAPtotaj; umol kg~DM) and total faecal bile acidcontent (Fbilerotali umol kgDM) were calculated by summing in-dividually measured bile acids. Total bile acid intake (BAltotal), totalfaecal bile acid loss (FBALtotal), total body bile acid pool gain (gainBBAPtotal, total bile acid synthesis (BAStotal, geometric mean totalbody bile acid pool (BBAPetotal) and total fractional turnover ratewere calculated by summing individual bile acids. Intake of indi-vidual bile acids (BAlindividual; umol kg BW d’') was calculated as((FIx dmF)/t/(Wg/1000))xDbileindividua, where Dbileindividual is thecontent of an individual bile acid in the diet (umol gDM). Faecalloss of individual bile acids (FBALindividua; umol kgBW d) wascalculated as (((Fl × dmF)x (D;/F))/t)/(W/1000)x Fbileindividual?where Fbileindividual is the content of an individual bile acid in thefaeces (umol gDM). Gain of individual bile acids in the body bileacid pool (gain BBAPindividuali umol kg-1 BW d~1) was calculated as(BBAPtindividual-BBAP0individua)/t/(W /1000), where BBAPtindividualand BBAPOindividual are, respectively, the final and initial pool sizeof the individual bile acid (umol fish). Synthesis of individualbile acids (BASdividua; umol kgBW d’') was calculated as gainBBAPindividual+FBALindividual -BAl individual· In juvenile fish which arefed to satiation, growth is exponential. As this paper demonstratesthat the size of the body bile acid pool is a function of body weight,it is best to express the bile acid pool size relative to body weight.Assuming exponential growth of the body bile acid pool size inanalogy with body weight, the geometric mean body bile acid poolsize is the most representative for the time interval under investi-gation. The geometric mean body bile acid pool size of individualbile acids (BBAPgeometricndividua; umol kgBW) was calculated ase ((n BBAPtindividual + In BBAPOindividual)/2)/(W/1000). Fractional ttnovrate of individual bile acids (% BBAPgeometric.d) was calcu-lated as (BASindividuai/BBAPgeometricindividual)×100. The change (%)in total faecal bile acid loss between diets explained by the differ-ence in total faecal bile acid content was calculated as ((TFBACstarch-TFBACFat)x((RFPstarch+RFPFat)/2))/(TFBALstarch-FBALFat))×100,where TFBACstarch and TFBACrat are, respectively, the total faecalbile acid content of fish fed the Starch and Fat diet, RFPstareh andRFPraare, respectively, the faeces production of fish fed the Starchand Fat diet, and TFBALstarch and TFBAL Fat are, respectively, thetotal faecal bile acid loss of fish fed the Starch and Fat diet. Similarly,the change (%) in total faecal bile acid loss between diets explainedby the difference in faeces production was calculated as (((RFPstarch-RFPFat)x((FbStarch+FbFat)/2))/(TFBALstarch-TFBALFat))×100. 2.6 Statistical analysis Tanks (n=6) were considered as the experimental units. Data wereanalysed for the effect of diet (i.e. Starch vs. Fat) using one-wayANOVA. The effect of diet was tested against the variation betweentanks. All data were tested for homogeneity of variance by Levene'stest prior to ANOVA. Normal distribution of residuals was checkedusing Kolmogorov-Smirnov test. The correlations between BW andtotal body bile acid pool size were tested using Pearson's correlationtest, and linear regression was used to model the relationship be-tween variables. Statistical significance was tested at the .05 prob-ability level. p-values between .1 and .05 (.1>p≥.05) were definedas close to statistical significance and as indicative for tendencies inthe data. All statistical tests were performed using the program SAS9.4; SAS Institute. 3 RESULTS Although not the focus of the current study, data on fish perfor-mance, ADC and body nutrient composition are given in supplemen-tal tables for completeness. 3.1 Performance, apparent digestibilitycoefficient and body nutrient composition Data on fish performance are shown in Table S2. Mortality was lowand unaffected by diet (1.4% averaged over diets; p=.1). Daily feedintake expressed in dry matter basis was equal for both diets (p≥.1)and averaged 1.57% BW d1. Despite equal feed intake, fish fed theStarch diet produced significantly more faeces expressed in dry mat-ter basis compared with fish fed the Fat diet (0.33 vs. 0.22%BWd;p<.01; Figure 1a; Table S2). Growth and final BW were not affectedby diet (p≥.1). ADC is given in Table S3. The DM ADC of the Starch diet was sig-nificantly lower compared with the Fat diet (79.5 vs. 85.5%; p<.01;Figure 1b; Table S3). The body nutrient composition at the start andend of the experiment is given in Table S4. 3.2 Dietary bile acid content, body bile acidpool and faecal bile acid content Of the 21 bile acids quantified, LCA, T-UDCA, G-UDCA, UDCA,T-HCA, T-HDCA, G-HDCA and HDCA were not detected in any of thesamples. The terms total cholic acid (CA) and total chenodeoxycholicacid (CDCA) denote the sum of both conjugated and the unconju-gated forms of the respective bile acids. Table 3 shows that the pri-mary bile acids total CA and total CDCA were predominant in feed,body and faeces. Regardless of diet, total CA averaged over diets ac-counted with 87.9% for the majority of the total body bile acid pool.Second most abundant in the body pool was total CDCA (11.2%) Diet Diet Diet FIGURE 1 Effect of diet on faeces production (panel a), dry matter digestibility (panel b) and total faecal bile acid loss (panel c) of rainbowtrout fed to satiation for 44 days; ADC: apparent digestibility coefficient; BW: body weight; DM: dry matter; Starch: diet with maize starch(gelatinized) as main non-protein energy source; Fat: diet with rapeseed oil as main non-protein energy source; Statistical data within eachpanel are derived from one-way ANOVA for the effect of diet, and differences between diets are denoted by different superscripts. All threeparameters were affected by diet (p<.01). Error bars indicate standard error of means (Table 3; Figure 2a). All other bile acids combined took a minimalshare of 0.9% of the total body bile acid pool. More than 99.0% of total CA was conjugated with taurine, whilethis was 93.5% of total CDCA. The remaining CDCA was unconju-gated. Glycine-conjugated bile acids represented a negligible shareof 0.4% of the total body bile acid pool. Regardless of diet, total CAand total CDCA accounted for 63.0% and 36.6% of the bile acids inthe faeces, respectively (Table 3; Figure 2b), leaving a share of 0.4%for the secondary bile acids. Similarly to the body bile acid pool, themajority of total CA and total CDCA in the faeces was conjugatedwith taurine (94.8% and 95.2%, respectively) and the remaining CAand CDCA in the faeces were mostly unconjugated. The total dietary bile acid content was similar between diets(Starch: 257 umol kg-1 DM; Fat: 330 umol kgDM; Table 2). Incontrast, the total body bile acid pool size of fish fed the Starchdiet was significantly higher compared with the Fat diet (3687 vs.2449 umol kgDM; p <.05; Figure 3a). The smaller total body bileacid pool size was mainly attributed to lower levels of T-CA and CA(summed 3304 vs. 2102 umol kgDM; p<.1; Table 3). The levelsof all other measured bile acids in the body pool were unaffected bydiet (p≥.5). There was no significant effect of diet on total faecalbile acid content (6265 umol kgDM averaged over diets; p ≥.01;Table 3; Figure 3b).Nevertheless, a significant higher level of the bileacid T-CDCA was present in the faeces of fish fed the Starch dietcompared with the Fat diet (2598 vs. 1796 umol kgDM;p<.05;Table 3). Table 3 shows that the ratios of conjugated to unconjugatedand taurine to glycine-conjugated bile acids were unaffected by dietin the body bile acid pool and faecal bile acid content (p≥.1). In con-trast, feeding the Fat diet tended to decrease the ratio of primary tosecondary bile acids in both the body and faeces (.1>p=.05). 3.3 Faecal bile acid loss and bile acid synthesis Total faecal bile acid loss (Totalabsolute) was more than 1.7 timeshigher for fish fed the Starch diet compared with fish fed the Fatdiet (p <.01; Table 4; Figure 1c). This higher absolute faecal bileacid loss was almost entirely ascribed to higher faecal loss of theprimary bile acids T-CA (12.2 vs. 8.3 umol kgBWd-1;p<.05)and T-CDCA (8.5 vs. 4.0 umol kg1BW d 1;p<.01). The loss of second-ary bile acids was mostly unaffected by diet. The effect of diet ontotal faecal bile acid loss became less significant when expressingit relative to the body pool size (Totalrelative;p<.05) and was 1.97%BBAPgeometric ota pool d averaged over diets. Total bile acid synthesis (Totalabsolute) of fish fed the Starch dietwas more than 2 times higher compared with the Fat diet (p<.01;Table 4). This higher total bile acid synthesis was mainly ascribed tohigher synthesis of both T-CA and T-CDCA in fish fed the Starch dietcompared with the Fat diet (p<.01). The synthesis of secondary bileacids and glycine-conjugated and glycine-unconjugated forms of theprimary bile acids was low, and no clear trend in the effect of diet onsynthesis was present for these bile acids. The fractional turnoverrate of total bile acids was more than 1.8 times higher for fish fed theStarch diet (p<.001; Table 4). Data on bile acid intake and body bileacid pool gain (which were used to calculate bile acid synthesis) aregiven in Table S5 for completeness. 3.4 Fractional turnover rate of cholic acid andchenodeoxycholic acid Fractional turnover rate is bile acid synthesis expressed as a frac-tion of percentage of its total body pool size. Table 5 shows thatthe fractional turnover rate of both total CA and total CDCA weresignificantly higher when feeding the Starch diet compared with theFat diet (p<.001). Regardless of diet, the fractional turnover rate oftotal CDCA was higher compared with total CA. 4 DISCUSSION 4.1 | Composition and size of the body bile acidpool in rainbow trout Quantitative and qualitative data on the bile acid pool in fish isscarce. The few studies that did report fish bile acid data eithermeasured a limited number of bile acids or measured bile acids inspecific tissues rather than the whole body. The main bile acids TABLE3Dietary bile acid content and effect of diet on body bile acid pool and faecal bile acid content of rainbow fed to satiation for44 days Dietary bile acid content Body bile acid pool Faecal bile acid content Diet” Diet Diet p- p- Starch Fat Initial° Starch Fat SEM value Starch Fat SEM value Bile acid (umol kgDM) Primary bile acids T-CA 119 171 3456 3273 2095 212.3 3716 3718 274.0 NS G-CA 8.3 6.1 12.4 6.3 4.6 2.09 NS 3.9 5.5 1.64 NS CA 39.7 63.4 11.7 30.7 7.0 5.83 # 267 136 96.8 NS T-CDCA 21.4 28.3 273 326 299 46.6 NS 2598 1796 178.6 G-CDCA BDL BDL BDL BDL BDL 一 一 4.1 BDL 一 CDCA 40.3 37.3 16.6 24.8 18.8 6.99 NS 174.1 59.1 57.13 NS Secondary bile acids related to CA T-DCA 1.0 BDL 3.0 1.5 0.6 5.53 NS 9.9 11.6 1.18 NS G-DCA 0.1 0.1 0.3 0.8 1.1 0.27 NS 0.01 0.73 0.111 DCA 3.5 3.3 1.5 1.8 1.5 0.62 NS 2.9 2.3 0.61 NS Secondary bile acids related to CDCA T-LCA BDL 0.3 0.2 BDL 0.4 0.8 0.8 0.15 NS G-LCA BDL BDL BDL 1.0 0.3 一 一 0.04 BDL G-HCA 3.9 3.4 3.5 3.3 3.4 0.51 NS 1.3 1.8 0.12 # HCA 20.0 16.3 16.6 18.2 16.8 0.58 NS 9.0 10.4 0.69 NS Bile acid ratio Primary:secondary 8:1 12:1 150:1 144:1 105:1 12.3:1 # 285:1 208:1 22.3:1 # Conjugated:unconjugated 2:1 2:1 81:1 53:1 61:1 13.7:1 NS 20:1 40:1 15.0:1 NS Taurine:glycine 12:1 21:1 231:1 397:1 334:1 106.8:1 NS 986:1 776:1 161.5:1 NS conjugated Total CA:total CDCA 3:1 4:1 12:1 10:1 7:1 1.5:1 NS 1:1 2:1 0.1:1 ** Abbreviations: BDL: below detection limit (detection limits are given in Table S1);DM: dry matter; SEM: standard error of means. T-:tauro;G-:glyco; CA: cholic acid;CDCA: chenodeoxycholic acid; DCA: deoxycholic acid; LCA: lithocholic acid; HCA: hyocholic acid; total CA: sumof both conjugated and unconjugated CA; total CDCA: sum of both conjugated and unconjugated CDCA. Levels of LCA (lithocholic acid), T-UDCA (tauroursodeoxycholic acid), G-UDCA(glycoursodeoxycholic acid), UDCA (ursodeoxycholic acid), T-HCA(taurohyocholic acid), T-HDCA (taurohyodeoxycholic acid), G-HDCA (glycohyodeoxycholic acid) and HDCA (hyodeoxycholic acid) were below thedetection limit in the diets, body and faeces, and are therefore not included in the table. Total dietary bile acid content is given in Table 2. Total bodybile acid pool size and faecal bile acid content are given in Figure 1. PStarch: diet with maize starch (gelatinized) as main non-protein energy source; Fat: diet with rapeseed oil as main non-protein energy source.Initial body bile acid pool at the start of the experiment. “NS, not significant: p ≥.1; #: p<.1;*:p<.05; **: p<.01; P-values for body bile acid pool are derived from one-way ANOVA for the effect of diet andthus do not relate to the values reported for initial body bile acid pool. in biliary bile of salmonids are CA and CDCA (Hagey et al., 2010).Specifically for rainbow trout, Denton et al. (1974) reported levels ofbiliary total CA between 85.4% and 93.6% and total CDCA between6.0% and 14.7%. Denton et al. (1974) also reported that most bileacids were conjugated with taurine. Those findings are in line withthe current study. Several other studies investigated biliary bile acid pool size andcomposition of rainbow trout in the context of fishmeal replacementby soybean meal(SBM) (Iwashita et al., 2008, 2009;Murashita et al.,2013; Yamamoto, Matsunari, et al., 2012; Yamamoto, Murashita,et al., 2012; Yamamoto et al., 2007,2008,2010). SBM consistently resulted in a downregulation of genes involved in both bile acidtransport and synthesis (Kortner et al., 2013; Murashita et al., 2018).The exact compounds in SBM that cause disturbances in the bileacid metabolism are not fully known, but saponins are likely to playa major role (Romano et al., 2020). Since diets of the current studywere formulated without SBM, for comparison of body bile acid poolcomposition and size of the current study with literature, only dataare used for rainbow trout fed animal-based protein diets (thus ex-cluding SBM-based diets). According to literature, T-CA and T-CDCAtake shares of the conjugated biliary bile acid pool of rainbow troutbetween 87.0-93.8% and 6.2-13.0%, respectively (lwashita et al., FIGURE 2EEffect of diet on the body bile acid profile (panel a) and the faecal bile acid profile (panel b) of rainbow trout fed to satiationfor 44 days; T-: tauro; CA: cholic acid; CDCA: chenodeoxycholic acid; Only bile acids representing a share of more than 1% of either the totalbody bile acid pool or 1% of the total faecal bile acid content are shown in this figure 2008, 2009; Murashita et al., 2013; Yamamoto, Murashita, et al.,2012; Yamamoto et al., 2007,2008,2010). This is in line with theaverage value of 88.9% for T-CA and 10.7% for T-CDCA found inthe current study. Besides taurine-conjugated bile acids, Yamamoto et al.(2007),Yamamoto et al.(2008) and Yamamoto, Murashita, et al. (2012) alsofound glycine conjugates in the biliary bile of trout, however, onlywhen diets were supplemented with bovine bile acids (the lattercontaining ±42% glycine-conjugates). The review by Romano et al.(2020) lists taurine as the only amino acid that conjugates with bileacids in several fish species, including rainbow trout. The synthe-sis of total glycine-conjugated bile acids in the current study was-0.13 umol kg-1BW daveraged over the diets. This negative valueindicates that the intake of glycine-conjugated bile acids via thediets (most likely originating from fishmeal and fish oil) was largerthan their faecal loss and gain in the body bile acid pool combined.This suggests that the glycine-conjugated bile acids measured in thebody bile acid pool most likely originated from the diets rather thanfrom de novo synthesis in the fish. The negative values for synthesis of some bile acids might alsobe related to re-conjugation with taurine or conversion into otherbile acids (Denton et al., 1974). To our knowledge, no informationabout the rate of deconjugation and formation of secondary bileacids is available for fish. However, ratios of conjugated to uncon-jugated bile acids in the body of humans (0.9:1), and in the faecesof humans (0.8:1) and rats (0.01:1) (Chen et al., 2020; Hagio et al.,2009; Stellaard et al., 1987) are much lower compared with thosefound in the current study. Furthermore, those studies also re-ported lower ratios of primary to secondary bile acids in the bodyof humans (1.6:1-2.4:1) and rats (6:1), and in the faeces of humans(0.03:1-1.14:1) and rats (0.18:1) compared with this study. Both de-conjugation and formation of secondary bile acids are mediated byintestinal bacteria, and in mammals, secondary bile acids are mainlyformed in the colon (Midtvedt, 1974). The rate of deconjugation andformation of secondary bile acids in rainbow trout seems to be muchlower compared with mammals, which most likely is related to theabsence of a true colon in fish or the cold-water nature of rainbowtrout. Body bile acid composition was not greatly affected by diet FIGURE 3 Effect of diet on total body bile acid pool size (panel a) and total faecal bile acid content (panel b) of rainbow trout fed tosatiation for 44 days; DM: dry matter; Starch: diet with maize starch (gelatinized) as main non-protein energy source; Fat: diet with rapeseedoil as main non-protein energy source. Statistical data within each panel are derived from one-way ANOVA for the effect of diet, anddifferences between diets (p <.05) are denoted by different superscripts. Total body bile acid pool size was affected by diet (p<.05). Totalfaecal bile acid content was unaffected by diet (p≥.1). Error bars indicate standard error of means Faecal bile acid loss Bile acid synthesis Diet” Diet° Bile acid (umol kg1BWd-1)a Starch Fat SEM p-value Starch Fat SEM p-value° Primary bile acids T-CA 12.2 8.3 0.88 23.2 11.8 1.43 ** G-CA 0.01 0.01 0.004 NS -0.12 -0.09 0.022 NS CA 0.9 0.3 0.29 NS 0.4 -0.7 0.28 T-CDCA 8.5 4.0 0.54 ** 9.7 5.4 0.59 ** G-CDCA 0.01 0.01 CDCA 0.6 0.1 0.18 NS 0.06 -0.33 0.125 # Secondary bile acids related to CA T-DCA 0.03 0.03 0.003 NS 0.02 0.02 0.004 NS G-DCA 0.00004 0.0020 * 0.001 0.006 0.004 NS DCA 0.01 0.01 0.002 NS -0.04 -0.04 0.007 NS Secondary bile acids related to CDCA T-LCA 0.003 0.002 0.0004 NS 0.002 -0.001 0.0010 # G-LCA 0.0001 一 0.005 0.003 0.0050 NS G-HCA 0.004 0.004 0.0004 NS -0.04 -0.03 0.005 # HCA 0.03 0.02 0.001 * -0.2 -0.1 0.01 ** Total Totalabsolute 22.2 12.9 1.02 33.0 16.0 1.63 ** Totalrelative (% BBAPgeometrictotal d-1)e 2.2 1.5 0.13 3.3 1.8 0.10 *** Abbreviations: BBAPgeometricrotal geometric mean total body bile acid pool size; BW, body weight; SEM, standard error of means. T-: tauro; G-: glyco; CA: cholic acid; CDCA: chenodeoxycholic acid; DCA: deoxycholic acid; LCA: lithocholic acid; HCA: hyocholic acid. Faecal bile acid loss and bile acid synthesis are expressed on BW as is. The body bile acid pool in Table 3 and Figure 1 is expressed on BW DM. "Starch: diet with maize starch (gelatinized) as main non-protein energy source; Fat: diet with rapeseed oil as main non-protein energy source;-:notcalculated because respective bile acids were below the detection limit in feed, faeces or body. NS, not significant: p ≥.1;#: p <.1;*:p<.05; **: p<.01; ***: p<.001; “Because of rounding, totals do not necessarily add up exactly. For bile acid synthesis, these values represent the total bile acid fractional turnover rate; the fractional turnover rates for total CA and total CDCAare given in Table 5. composition, and none of the bile acid ratios differed significantlybetween diets. There is quite some variation in bile acid compositionbetween taxonomic orders of fish; however, within orders the bileacid composition is generally stable (Hagey et al., 2010; Haslewood,1967). Furthermore, Hagey et al. (2010) stated that within fish or-ders there is no apparent link between diet composition and thecomposition of the bile acid pool. A comparison of total bile acid pool size of rainbow trout withliterature is more difficult to make, since BW of the fish differed be-tween studies. Figure 4a shows the reported total bile acid pool sizeas a function of the BW for both literature and the current study.Total bile acid pool size shows a strong positive correlation with fishweight and an increase of 100 g of BW corresponds with an increaseof 85 umol of the total bile acid pool size. For easier comparisonbetween studies, the bile acid pool was expressed per unit of BW(Figure 4b), highlighting a large variation between studies in themeasured total bile acid pool size (range 580-1729 umol kg1BW). This variation might be ascribed to several factors including geneticdifferences (Lu et al., 2010), differences in the used methodologybetween studies (e.g. tissue sampled), differences in the time be-tween last feeding and sampling of the fish (Romano et al., 2020),differences in the applied feeding levels (Denton et al., 1974), butalso differences in diet composition (Chiang, 2009; Romano et al.,2020). That diet composition can affect the body bile acid pool wasalso shown by the outcome of the current study and will be elabo-rated upon hereafter. 4.2 Effect of diet on body bile acid pool size Data of this study show a smaller total body bile acid pool size of fishfed the Fat diet compared with those fed the Starch diet (Figure 3a).This smaller total body bile acid pool was ascribed to lower levels ofall primary bile acids,although the difference between diets was only significant for T-CA (Table 3). Dietary effects on the bile acid metab-olism have been described in literature for both mammals and fish. Disturbances of the bile acid metabolism of fish caused by spe-cific antinutrients (e.g. high molecular plant proteins, (soy) saponins,non-starch polysaccharides) in ingredients replacing fishmeal (e.g.SBM) have been studied several times (Romano et al.,2020). In con-trast, information about the effects of dietary carbohydrate andfat level on the bile acid metabolism of fish is lacking, this despitedemonstrated effects in mammals (Chiang, 2013). Regardless of thedietary factors and their mechanism of action responsible for thealtered bile acid metabolism, diet-induced changes in the bile acidmetabolism (including changes in the body bile acid pool) are relatedto altered faecal bile acid loss and/or bile acid synthesis in the liver.The effects of diet on faecal bile acid loss and bile acid synthesis are TABLE 5 Effect of dietary main non-protein energy sourceon the fractional turnover rate of total cholic acid and totalchenodeoxycholic acid Fractional turnover rate (%BBAPgeometricindividual d-1)a Diet P-value° Starch Fat SEM Diet Total CA 2.6 1.4 0.11 ** Total CDCA 11.4 5.9 0.26 *** BBAPgeometricndividual:geometric mean body bile acid pool size ofthe corresponding individual bile acid (i.e., BBAPgeometrichotalcA andBBAPgeometricrotalCDCA respectively); SEM: standard error of means.Total CA: sum of both conjugated and unconjugated cholic acid; totalCDCA: sum of both conjugated and unconjugated chenodeoxycholicacid. Total bile acid fractional turnover rates are given in Table 4 (footnotee). Starch: diet with maize starch (gelatinized) as main non-protein energysource; Fat: diet with rapeseed oil as main non-protein energy source.C***: p<.001. 500 discussed in the next paragraphs, as they might provide an explana-tion for the difference in the body bile acid pool size between fishfed the Starch and Fat diet of the current study. 4.3 Effect of diet on faecal bile acid loss This study showed that the total daily bile acid loss relative to thebody bile acid pool size ranged between 1.5 and 2.2% d, depend-ing on diet. For comparison, reported faecal bile acid loss relative tothe total pool size was 1.7% d for rats (Moundras et al.,1997) and1-5% dfor humans (Chiang, 2013; Van Eldere et al., 1996). In thecurrent study, absolute total faecal bile acid loss in trout fed the Fatdiet was lower compared with the loss in trout fed the Starch diet.Previous studies with rainbow trout showed that DM ADC is a fac-tor crucial to determine the level of faecal bile acid loss (Staessenet al., 2020a, 2020b). Despite the absence of a diet effect on faecalbile acid content in those studies,enhanced faeces production whenfeeding diets with low DM ADC resulted in an increased flush-outof bile acids with the faeces. The same mechanism explains the dif-ference in faecal bile acid loss between diets of the current study.Although the total faecal bile acid content was not significantly dif-ferent (Figure 3b), the lower DM ADC and subsequently higher fae-ces production of fish fed the Starch diet resulted in a total faecalbile acid loss that was 1.5 times higher compared with the Fat diet(Figure 1a-c). Total faecal bile acid loss is by definition total faecal bileacid content multiplied with faeces production. Therefore, the rela-tive contribution of both factors to the difference in total faecal bileacid loss between diets was also calculated. Faecal bile acid contentexplained 31% and faeces production 69% of the difference in faecalbile acid loss. Despite a lack of a significant diet effect on faecal bileacid content, the contribution of faecal bile acid content to the dif-ference in faecal bile acid loss between diets stems for a numerically FIGURE 4Relationship between body weight and total bile acid pool size of rainbow trout expressed per fish (panel a), and per kg bodyweight on as is basis (panel b); BW: body weight; Pearson corr.: Pearson correlation coefficient. Data of the current study·(Start: fishsampled before the start of the experiment, Fat: fish fed the Fat diet sampled at the end of the experiment, Starch: fish fed the Starch dietsampled at the end of the experiment), Iwashita et al.(2009)口, Yamamoto et al.(2008) *, lwashita et al.(2008) A. Yamamoto et al.(2007)X, Yamamoto et al.(2010) o, Yamamoto, Murashita, et al.(2012)-, Murashita et al.(2013)+and Yamamoto, Matsunari, et al.(2012)( arepresented for rainbow trout fed diets containing animal-based protein as main protein source (thus excluding diets that induced soybeanmeal-related symptoms such as enteritis); NS, not significant: p ≥.1; ***: p<.001 higher faecal bile acid content when feeding the Starch diet. The lat-ter is most likely related to a higher total body bile acid pool size, aswas also observed in rats (Moundras et al., 1997). Numerous otherdietary components, including high molecular plant protein (Iwamiet al., 1990; Murashita et al., 2013), (soy) saponins (Gu et al., 2014;Kregiel et al., 2017; Krogdahl et al.,2015; Murashita et al., 2018) andnon-starch polysaccharides (Ikegami et al., 1990; Moundras et al.,1997; Sinha et al., 2011) can enhance faecal bile acid loss by eitherdirectly interacting (e.g. bind, entrap, etc.) with bile acids or caus-ing symptoms that reduce bile acid reabsorption (e.g. soybean meal-related enteritis) (Krogdahl et al., 2015; Yamamoto et al.,2007). Suchcomponents could theoretically have been present in the diets aspart of the basal ingredient mixture. However, as the basal ingredi-ent mixture was more diluted in the Starch diet (by addition of maizestarch) than in the Fat diet (by addition of rapeseed oil), their effectson faecal bile acid loss, if any, is ought to have been negligible. Higherfaecal bile acid loss has also been linked to higher fat intake in mam-mals (Reddy, 1992; Reddy et al., 1977). Especially, polyunsaturatedfatty acids were suggested to inhibit reabsorption of bile acids in theintestine (Ammon & Phillips, 1974). Cummings et al. (1978) showedthat an increase in faecal fat loss could explain an increase in faecalbile acid loss. This is probably because bile acids associate with fat inmicelles and are in this way lost with fat excreted via faeces (Leroyet al., 1986). Despite the higher fat intake associated with the Fatdiet, higher fat ADC of the Fat diet resulted in faecal fat loss notbeing significantly different between diets (data not shown), so alsothe effect of fat on faecal bile acid loss is ought to have been negligi-ble in this study. Regardless of which mechanism(s) was responsible,the difference in faecal bile acid loss between diets of the currentstudy does not explain the difference in total body bile acid pool size.Faecal loss removes bile acids from EHC, and under homeostasis fae-cal bile acid loss is compensated with de novo bile acid synthesis inthe liver (Lanzini & Lanzarotto,2000). Increased removal of bile acidsfrom EHC leads to a decrease of the bile acid pool when bile acidsynthesis is at its maximum (Dowling et al.,1970). Despite higher fae-cal bile acid loss, fish fed the Starch diet maintained a higher bodybile acid pool by increasing bile acid synthesis. This increased bileacid synthesis was probably partly related to a compensation for thehigher faecal bile acid loss when feeding the Starch diet. However,a compensatory mechanism does not explain a difference in bodybile acid pool size at the end of the experiment. The difference intotal body bile acid pool size at the end of the experiment implies anincrease in bile acid synthesis beyond the level needed to compen-sate enhanced faecal bile acid loss of fish fed the Starch diet and/or adecrease in bile acid synthesis of fish fed the Fat diet. 4.4 Effect of diet on bile acid synthesis In fish, several dietary factors, including taurine (de Moura et al.,2019; Kim et al., 2015; Nguyen et al., 2015; Richard et al., 2017),cholesterol (Deng et al., 2013; Kortner et al., 2014; Yun et al.,2011)and soybean antinutrients (Gu et al., 2014; Kortner et al., 2013; Krogdahl et al., 2015; Murashita et al., 2018), were suggested toaffect bile acid synthesis. However, bile acid synthesis has neverbeen actually quantified. The presence of aforementioned dietarycompounds is expected not to have differed substantially betweenthe diets of the current study, and therefore, their effects on bileacid synthesis are ought to have been negligible. Mammalian stud-ies showed that diet macronutrient composition can affect bileacid synthesis by altering both bile acid kinetics and expression ofgenes involved in bile acid synthesis. The cycling frequency of bileacids within EHC is partly determined by the extend of gallbladdercontraction. The gallbladder (functioning as storage organ for bileacids between meals) contracts in response to the presence of fatand amino acids in the proximal intestine, subsequently releasingbile acids (Aldman & Holmgren,1995). Fat diets result in a strongercontraction of the gallbladder and a higher cycling frequency ofbile acids compared with carbohydrate diets (Hepner, 1975).Bisschop et al. (2004) showed a decrease in primary bile acid pro-duction of humans fed an extremely high-fat diet (83%) comparedwith an intermediate fat diet (41%). Those authors observed thatthe fractional turnover rate (% synthesis of a bile acid relative toits pool) of both primary bile acids were lower, suggesting a moreefficient reabsorption of bile acids in the intestine by higher activ-ity of bile acid transporters. Both higher cycling frequency and anincreased reabsorption of bile acid when feeding fat diets weresuggested to increase the flux of bile acids through the liver, re-sulting in decreased bile acid synthesis by downregulation of 70-hydroxycholesterol (CYP7A1; the first rate-limiting enzyme in theclassical biosynthesis pathway) through activation of the farnesoidX receptor (FXR)(Hofmann et al.,2010;Romano et al., 2020). In thecurrent study, feeding fish the Fat diet resulted in lower fractionalturnover rates of total CA and total CDCA compared with fish thatwere fed the Starch diet (Table 5). Together with the assumptionof a stronger gallbladder contraction, an increased bile acid fluxthrough the liver of fish fed the Fat diet would explain lower bileacid synthesis of fish fed the Fat diet through activation of FXR andinhibition of CYP7A1. To the best of our knowledge, there are nopapers on the effect of gut loading (volume) on bile acid synthe-sis and bile acid pool size. Despite a more or less equal daily DMfeed intake between diets, lower DM digestibility (Table S3) of theStarch diet should have resulted in a larger volume of intestinalcontent compared with the Fat diet. Furthermore assuming lessgallbladder contraction in fish fed the Starch diet, the concentra-tions of bile acids in the intestinal content might have been lowerin fish fed the Starch diet, which through positive feedback regula-tion to the liver, could also (partly) explain an increase in bile acidsynthesis and an higher total bile acid pool size. Differences in bileacid synthesis between diets could have been further enhanced bystarch and fat directly. Li et al. (2012) showed that spikes in glu-cose and insulin stimulate human and murine CYP7A1 and enlargethe bile acid pool size. It is not known whether glucose and insulinhave the same effect in fish, but it could (partly) explain the higherbile acid synthesis of fish fed the Starch diet. High-fat diets stimu-lated bile acid synthesis in rats (Bertolotti et al., 1995; Botham & Boyd, 1983). CYP7A1 was upregulated in mice fed fat-rich diets,especially when the fat source was rich in polyunsaturated fattyacids (Cheema et al., 1997). Furthermore, rapeseed oil used in theFat diet of the current study most likely provided phytosterols.Phytosterols can compete with cholesterol for uptake in the intes-tine, which leads to increased faecal cholesterol loss (Miller et al.,2008). In order to conserve cholesterol, cholesterol synthesis inthe liver is upregulated and bile acid synthesis downregulated asshown in Atlantic salmon (Liland et al., 2013). Perhaps, the pres-ence of phytosterols in rapeseed oil can (partly) explain the lowerbile acid synthesis of fish fed the Fat diet. 4.51 Total bile acid pool size and fat apparentdigestibility The fat ADC of the Fat diet used in the current study was highercompared with the Starch diet, and this despite a smaller total bodybile acid pool size of fish fed the Fat diet. The instinctive assumptionthat a larger total bile acid pool size results in better fat digestiondoes not necessarily hold true. Also, the dietary fatty acid profile isan important determinant for fat digestibility (Hua & Bureau,2009).The difference in fatty acid profile between the Starch and Fat dietof the current study might explain the higher fat ADC found for thelatter. Using the model of Hua and Bureau (2009) to predict digest-ible fat content and a theoretical fatty acid profile of fish oil (Lee &Ahn,2003) and rapeseed oil (Zambiazi et al., 2007), the estimatedfat ADC for the Starch and Fat diet was 89.6% and 91.1%, respec-tively, thus predicting a slightly better ADC of the fat used in theFat diet. 4.6l Intestinal conservation of cholic acid andchenodeoxycholic acid Regardless of diet, the ratio of total CA to total CDCA in the faeceswas lower than in the body (Table 3; Figure 2a,b). Furthermore, alsothe fractional turnover rate of total CA was lower compared withtotal CDCA for both diets (Table 5). The discrepancy between thebody and faecal bile acid profile, and the lower fractional turnoverrate of total CA suggest a better intestinal conservation of total CAover total CDCA in rainbow trout. Information about intestinal con-servation of specific bile acids is not available for fish. In contrast tothe current study, better intestinal conservation of CDCA over CAwas reported for humans (Angelin et al., 1976; Einarsson et al., 1979)and rats (Schiff et al., 1972). The better intestinal conservation ofCDCA (a dihydroxy bile acid) compared with CA (a trihydroxy bileacid) observed in humans and rats was ascribed to the less polar na-ture of CDCA which allows some passive absorption along the wholelength of the small intestine (Angelin et al., 1976; Schiff et al.,1972).In rainbow trout, an apical sodium-dependent bile acid transporterhas been identified (Murashita et al., 2014), but no information isavailable on absorption efficiency of specific bile acids. Using data from both the current study and from literature, a linearrelationship was demonstrated between the bile acid pool size andthe BW of rainbow trout. However, the current study demonstratesthat the rate of the increase in body bile acid pool size with BW is(partly) dependent on diet composition (e.g. type of non-proteinenergy source). Regardless the type of non-protein energy source,taurocholic acid and taurochenodeoxycholic acid were sequentiallymost abundant in the total body bile acid pool, accounting for morethan 90% of bile acids. In other words, dietary non-protein energysource does not seem to have a substantial impact on the body bileacid pool composition of rainbow trout. The total body bile acid poolsize of fish fed the Starch diet was larger compared with the Fat dietat the end of the experiment, and this despite higher faecal bile acidloss when feeding the Starch diet. This larger bile acid pool size waspossible because bile acid in fish fed the Starch diet was more than2 times higher compared with the Fat diet. The difference in finaltotal body bile acid pool size between diets cannot be explained bya higher bile acid synthesis that compensates for the higher faecalbile acid loss when feeding the Starch diet. Instead, results suggest afurther upregulation of bile acid synthesis in fish fed the Starch dietand/or a downregulation for the Fat diet. The exact mechanism(s)responsible for the difference in bile acid synthesis between dietscannot be identified from this study, but both changes in the rate ofEHC and direct effects of the type of non-protein energy source onbile acid synthesis most likely played a role. Despite a smaller bodybile acid pool size, the fat ADC of the Fat diet was better comparedwith the Starch diet. A smaller bile acid pool size is thus not neces-sarily synonym for a lower fat digestibility, and other factors need tobe taken into account(e.g. fatty acid profile). Furthermore, this studyshows that the level of unconjugated and secondary bile acids in thebody and faeces of rainbow trout are remarkably lower comparedwith those reported in mammalian studies. Finally, the discrepancybetween the bile acid profile of the body and faeces and the lowerfractional turnover rates of cholic acid, regardless of diet, suggest abetter intestinal conservation of cholic acid compared with cheno-deoxycholic acid in rainbow trout. ACKNOWLEDGMENTS The authors would like to thank Menno ter Veld and the staff of theaquaculture research facilities of Wageningen University for theirtechnical support in running the experiment. Furthermore, we wouldlike to acknowledge Ronald Booms, Tino Leffering, Erik van denBrink and Samara Hutting for their support during the laboratoryanalysis. Data on fish performance and body composition belong tothe AquaExcel2020 project 'D6.1: Effect of early life water oxygenconcentration on experimental outcomes at later life in rainbowtrout. The analyses of bile acids were funded by The NetherlandsOrganization for Scientific Research (NWO) under grant agreementNo. 022.004.005, Cargill, Evonik Nutrition and Care GmbH andSaria. The aquatic metabolic unit used in this study was cofoundedby the NWO (code 805-34.025). This project has received funding from the European Union'sHorizon 2020 research and innovation programme under grantagreement No. 652831 (AQUAEXCEL2020). This output reflects onlythe author's view and the European Union cannot be held responsiblefor any use that may be made of the information contained therein. ORCID ( Thomas W.O.Staessen ht t ps://orcid.org/0000-0001-5551 - 1586 ) ( REFERENCES ) ( Aldman, G., & Holmgren,S. (1995). Intraduodenal fat and amino acids ac- tivate gal l bladder motility in the rainbow trout, Oncorhynchus my- kiss. General and Comparative Endocrinology, 100(1),27-32. https:// doi.org/10.1006/gcen.1995.1128 ) ( Ammon, H. V . , & Phillips, S. F. (1974). Inhibition of i leal water absorptionby intraluminal fatty acids: i nfluence of chain lenght, hydroxylation and conjugation of fatty acids. The Journal of Clinical Investigation,53(1), 205-210. https://doi.org/10.1172/JCI107539 ) ( Andersen, E., & Hel l strom, K. (1980). Influence of fat - rich versuscarbohydrate-rich diets on bile acid kinetics, biliary lipids, andnet steroid balance in hyperlipidemic subjects. Metabolism: Clinical and Experimental, 29(5), 400-409. https://doi. org/10.1016/0026-0495(80)90163-8 ) ( Angelin, B., Einarsson, K., & Hellstrom, K. (1976). Evidence for the ab-sorption of bile acids in the proximal small intestine of normo- and hyperlipidaemic subjects. Gut, 17(6), 420-425. https://doi. org/10.1136/gut.17.6.420 ) ( Bertolot t i, M., Spady,D. K., & Dietschy,J.M.(1995). Regulation of hepaticcholesterol metabolism in the rat in vivo: effect of a synthetic fat-free diet on sterol synthesis and low-density l ipoprotein transport.Biochimica Et Biophysica Acta (BBA) - Lipids and Lipid. Metabolism,1255(3),293-300.https://doi.org/10.1016/0005-2760(94)00245-t ) ( Bisschop, P. H., Bandsma, R. H. J., Stellaard, F., ter Harmsel, A., Meijer, A. J., Sauerwein, H. P . , Kuipers, F., & Romijn,J.A.(2004).Low-fat,high-carbohydrate and high-fat, low-carbohydrate diets decrease pri-mary bile acid synthesis in humans. The American Journal of Clinical Nutrition, 79(4), 570-576.https://doi . org/10.1093/ajcn/79.4.570 ) ( Botham, K. M., & Boyd, G. S. (1983). The effect of dietary fat on bile salt synthesis in rat liver. Biochimica Et Biophysica Acta (BBA) - Lipids and Lipid Metabolism, 752(2), 307-314 . https://doi. org/10.1016/0005-2760(83)90128-5 ) ( Bureau, D. P., Kaushik, S. J., & Cho, C. Y. (2003). Bioenergetics. In J. E. Halver, & R. W. Hardy (Eds.), Fish nutrition (3 ed., pp. 1-59): Academic Press. ) ( Cai, S.-Y., Xiong, L., Wray, C. G., Ballatori, N., & Boyer, J. L. (2007). Thefarnesoid X receptor FXRα/NR1H4 acquired l igand specificity forbile salts late in vertebrate evolution. American Journal of Physiology- Regulatory Integrative and Comparative Physiology, 293(3),R1400-R1409.https://doi.org/10.1152/ajpregu.00781.2006 ) ( Cheema, S. K., Cikaluk, D., & Agellon, L. B. (1997). Dietary fats modu-late the regulatory potential of dietary cholesterol on cholesterol 7 alpha-hydroxylase gene expression. Journal of Lipid Research,38(2), 315-323. ) ( Chen, W., Wei, Y.,Xiong, A. , Li, Y., Guan, H., Wang, Q., Miao, Q.1., Bian,Z., Xiao, X., Lian, M., Zhang, J., Li, B. O., Cao, Q., F an, Z., Zhang, W., Qiu, D., Fang, J., Gershwin, M. E., Yang, L. I . , . .. Ma, X. (2020).Comprehensive analysis of serum and fecal bile acid profiles andinteraction with gut microbiota in primary biliary cholangitis.Clinical Reviews in Allergy & Immunology,58(1),25-38. https://doi.org/10.1007/s12016-019-08731-2 ) ( Chiang, J. Y. L. (2009). Bile acids: regulation of synthesis. Journal of LipidResearch, 50(10), 1955-1966. https://doi.org/10.1194/jlr.R9000 10-JLR200 ) ( Chiang, J.Y.L. (2013). Bile acid metabolism and signaling. Comprehensive Physiology, 3(3), 1191-1212. https://doi.org/10.1002/cphy. c120023 ) ( Chikwati, E.M., Venold, F. F., Penn, M. H., Rohloff, J., Refstie, S., Guttvik, A., & Krogdahl, A. (2012). Interaction of soyasaponins with plant ingredients in diets for Atlantic salmon, Salmo salar L. British Journal of Nutrition, 107(11),1570-1590. https://doi.org/10.1017/S0007 114511004892 ) ( Cummings, J. H., Wiggins, H. S., Jenkins, D. J . , Houston, H. , Jivraj, T . ,Drasar, B. S., & Hill, M. j. (1978) . Influence of diets high and low inanimal fat on bowel habit, gastrointestinal transit time, fecal micro- flora, bile acid, and fat excretion. The Journal of Clinical Investigation,61(4), 953-963.https://doi.org/10.1172/JCI109020 ) ( de Moura, L. B . , Diogenes, A. F., Campelo, D. A. V., de Almeida, F. L. A.,Pousao-Ferreira, P. M., Furuya, W. M., Peres, H., & Oliva-Teles, A.(2019). Nutrient digestibility, digestive enzymes activity, bile drain-age alterations and plasma metabolites of meagre (Argyrosomus re-gius) feed high plant protein diets supplemented with taurine andmethionine. Aquaculture, 511, 734231. https://doi.org/10.1016/j.aquaculture.2019.734231 ) ( Deng, J . M. , Bi , B. L ., Kang, B., Kong, L. F. , Wang, Q. J., & Zhang,X.(2013). Improving the growth performance and cholesterol metabolismof rainbow trout (Oncorhynchus mykiss) fed soyabean meal-baseddiets using dietary cholesterol supplementation. British Journalof Nutrition, 110(1), 29-39. https://doi.org/10.1017/S000711451 2004680 ) ( Denton, J. E., Yousef , M. K., Yousef, I. M., & Kuksis, A. (1974). Bile acidcomposition of rainbow trout, Salmo Gairdneri. L i pids, 9(12),945-951. https://doi.org/10.1007/BF02533816 ) ( Dowling, R. H . , Mack, E., & Small, D. M. (1970). Effects of controlled in- terruption of the enterohepatic circulation of bile salts by bi l iarydiversion and by i leal resection on bile sal t secretion, synthesis,andpool size in the rhesus monkey. The Journal of Clinical Investigation,49(2),232-242.https://doi.org/10.1172/JCI106232 ) ( Einarsson, K. A., Gundy, S. M. , & Hardison, W. G. (1979). Enterohepaticcirculation rates of cholic acid and chenodeoxycholic acid in man.Gut, 20(12), 1078-1082.https://doi.org/10.1136/gut.20.12.1078 ) ( Forde-Skjaervik, O., Refstie, S., Aslaksen, M. A., & Skrede, A. (2006). Digestibi l ity of diets containing different soybean meals in Atlanticcod (Gadus morhua); comparison of collection methods and map-ping of digestibility in different sections of the gastrointestinal tract. Aquaculture, 261(1), 241-258. https://doi.org/10.1016/j. aquaculture.2006.07.009 ) ( Gu, M., Bai, N., & Kortner, T. M. (2017). Taurocholate supplementa-tion attenuates the changes in growth performance, feed ut i li-zation, lipid digestion, liver abnormality and sterol metabolismin turbot (Scophthalmus maximus) fed high level of plant protein. Aquaculture,468, 597-604. https://doi.org/10.1016/j.aquac ulture.2016.11.022 ) ( Gu, M., Kortner, T . M., Penn, M., Hansen, A. K., & Krogdahl, A. (2014). Effects of dietary plant meal and soya-saponin supplementation onintestinal and hepatic lipid droplet accumulation, l ipoprotein and sterol metabolism in Atlantic salmon (Salmo salar L.). British Journal of Nutrition, 111(3),432-444.https://doi.org/10.1017/S000711451 4000415 ) ( Hagey, L. R., Moller , P. R., Hofmann, A. F., & Krasowski, M. D. (2010). Diversity of bile salts in fish and amphibians: evolution of a complex biochemical pathway. Physiological and Biochemical Zoology, 83(2),308-321.https://doi.org/10.1086/649966 ) ( Hagio,M.,Matsumoto , M., Fukushima,M.,Hara, H., & Ishizuka,S.(2009).Improved analysis of bile acids in tissues and intestinal contents ofrats using LC/ESI-MS. Journal of Lipid Research, 50(1), 173-180.https://doi.org/10.1194/jlr.D800041-JLR200 ) ( Haidar, M. N., Petie, M., Heinsbroek, L. T. N., Verreth, J. A. J., & Schrama, J. W. (2016). The effect of type of carbohydrate(starch vs. nonstarch polysaccharides) on nutrients digestibility, ) ( energy retention and maintenance requirements in Nile tila-pia. Aquaculture, 463, 241-247. https://doi.org/10.1016/j.aquac ulture.2016.05.036 ) ( Haslewood, G. A. D. (1967). Bile salt evolution. Journal of Lipid Research, 8(6),535-550. ) ( Hepner, G. W.(1975). Effect of decreased gallbladder stimulation on en-terohepatic cyc l ing and kinetics of bile acids. Gastroenterology,68(6),1574-1581. https://doi.org/10.1016/S0016-5085(75)80147-8 ) ( Hofmann, A. F., Hagey, L. R., & Krasowski, M. D. (2010). Bile salts of vertebrates: Structural variation and possible evolutionary sig- ni f icance. Journal of Lipid Research, 51(2), 226-246. https://doi. org/10.1194/jlr.R000042 ) ( Hua, K., & Bureau,D. P.(2009). Development of a model to estimate di - gestible l ipid content of salmonid fish feeds. Aquaculture,286(3-4 ) ,271-276. https : //doi.org/10.1016/j.aquaculture.2008.09.028 ) ( Ikegami , S . , Tsuchihashi , F., Harada, H., Tsuchihashi, N., Nishide, E., &Innami, S. (1990). Effect of viscous indigestible polysaccharides on pancreatic-biliary secretion and digestive organs in rats. The Journalof Nutrition, 120(4),353-360.https://doi.org/10.1093/jn/120.4.353 ) ( lwami, K . , Kitagawa, M., & Ibuki, F. (1990). Effect of dietary proteinsand/or their digestive products on intestinal taurocholate absorp- tion. Journal of Nutritional Science and Vitaminology, 36(Suppl. 2), S141-S146. https://doi.org/10.3177/jnsv.36.supplementii _ s141 ) ( lwashita , Y., Suzuki, N., Matsunari, H., Furuita, H., Sugita, T., Amano, S.,& Yamamoto, T. (2010). Influence of cholestyramine supplementedto a casein-based semi-purified diet and soya saponin and soya iso-flavone supplemented to a soy protein concentrate-based diet on liver morphology of fingerling rainbow trout (Oncorhynchus mykiss). Aquaculture Science, 58(3), 411-419. https://doi.org/10.11233/ aquaculturesci.58.411 ) ( lwashita, Y., Suzuki, N., Matsunari, H., Sugita, T., & Yamamoto, T.(2009). Influence of soya saponin, soya lect i n, and cholyltaurine supple-mented to a casein-based semipurified diet on intestinal morphol- ogy and biliary bile status in fingerling rainbow trout Oncorhynchus mykiss. Fisheries Science,75(5),1307-1315.https://doi.org/10.1007/ s12562-009-0158-1 ) ( Iwashita, Y., Suzuki, N., Yamamoto, T., Shibata, J. - I., Isokawa, K., Soon,A. H., & Goto, T . (2008). Supplemental effect of cholyltaurine and soybean lecithin to a soybean meal-based fish meal-freediet on hepatic and intestinal morphology of rainbow troutOncorhynchus mykiss. Fisheries Science, 74(5), 1083-1095. https://doi.org/10.1111/j.1444-2906.2008.01628.x ) ( Kim, S. - K., Kim, K.-G., Kim, K.-D., Kim, K. - W., Son, M.-H., Rust, M., & Johnson, R. (2015). Effect of dietary taurine levels on the conju-gated bile acid composition and growth of juvenile Korean rockfish Sebastes schlegeli (Hilgendorf). Aquaculture Research, 46(11), 2768- 2775. https://doi.org/10.1111/are.12431 ) ( Kortner, T . M., Bjorkhem, I., Krasnov, A., Timmerhaus, G., & Krogdahl, A. (2014). Dietary cholesterol supplementation to a plant-based diet suppresses the complete pathway of cholesterol synthesis and in-duces bile acid production in Atlantic salmon (Salmo salar L.). BritishJournal of Nutrition, 111(12), 2089-2103. https://doi.org/10.1017/ S0007114514000373 ) ( Kortner, T. M., Gu, J., Krogdahl, A., & Bakke, A. M. (2013). Transcriptional regulation of cholesterol and bile acid metabolism after dietary soyabean meal treatment in Atlantic salmon (Salmo salar L.). British Journal of Nutrition, 109(4), 593-604. https://doi.org/10.1017/ SO007114512002024 ) ( Kregiel, D . , Berlowska, J., Witonska, I ., Antolak, H., Proestos, C., Babic,M., & Zhang, B. (2017). Saponin-based, biological-active surfac- tants from plants. In R. Najjar (Ed.), Application and characterization of surfactants, 1st ed.(pp. 183-205). InTech. ) ( Krogdahl, A., Gajardo, K. , Kortner, T. M. , Penn, M., Gu, M., Berge, G . M., & Bakke, A. M. (2015). Soya saponins induce enteritis in Atlantic salmon (Salmo salar L.). Journal of Agricultural and Food Chemistry, 63(15),3887-3902.https://doi.org/10.1021/jf506242t ) ( Lanzini , A., & Lanzarotto, F. (2000). Review article: the ‘mechanical pumps' and the enterohepatic c i rculation of bile acids - defects incoeliac disease. Alimentary Pharmacology & Therapeutics, 14(Suppl.2), 58-61. https://doi.org/10.1046/j.1365-2036.2000.014s2058.x ) ( Lee, E. J., & Ahn, D. U.(2003). Production of volatiles from fatty acids andoils by irradiation. Journal of Food Science, 68(1), 70-75. https://doi.org/10.1111/j.1365 - 2621.2003.tb14116.x ) ( Leroy, C., Lepage, G., Morin, C. L., Bertrand, J. M., Dufour-Larue, O.,& Roy, C. C. (1986). Effect of dietary fat and residues on fecalloss of sterols and on their microbial degradation in cystic fibro-sis. Digestive Diseases and Sciences, 31(9), 911-918. https://doi.org/10.1007/BF01303210 ) ( Li , K., Buchinge r , T . J., Bussy, U. , Fissette, S. D., Johnson, N. S., & Li, W. (2015). Quantification of 15 bile acids in lake charr feces by ultra- high performance l iquid chromatography-tandem mass spectrom- etry. Journal of Chromatography B: Analytical Technologies in the Biomedical and Life Sciences, 1001,27-34.https://doi.org/10.1016/j. ichromb.2015.07.028 ) ( Li, T., Francl , J. M., Boehme, S., Ochoa, A., Zhang, Y., Klaassen, C. D.,Erickson, S. K., & Chiang, J. Y. L. (2012). Glucose and insul i n induc- tion of bile acid synthesis: mechanisms and implication in diabe-tes and obesity. Journal of Biological Chemistry,287(3),1861-1873 . https://doi.org/10.1074/jbc.M111.305789 ) ( Li l and, N. S., Espe, M., Rosenlund, G., Waagbo, R., Hjelle, J . 1., Lie, o.,& Torstensen, B. E. (2013). High levels of dietary phytosterols af-fect l ipid metabolism and increase l iver and plasma TAG in Atlantic salmon (Salmo salar L . ). British Journal of Nutrition, 110(11),1958- 1967. https://doi.org/10.1017/S0007114513001347 ) ( Lu, Y., Feskens, E. J . , Boer, J. M., & Muller, M. (2010). The potential in-fluence of genetic variants in genes along bile acid and bile met-abolic pathway on blood cholesterol levels in the population.Atherosclerosis, 210(1), 14-27.https://doi.org/10.1016/j.atheroscle rosis.2009.10.035 ) ( Maas, R. M., Verdegem, M. C. J., Wiegertjes, G. F., & Schrama, J. W. (2020). Carbohydrate utilisation by ti l apia: A meta-analytical ap- proach. Reviews in Aquaculture,https://doi.org/10.1111/raq.12413 ) ( Midtvedt, T. (1974). Microbial bile acid transformation. The AmericanJournal of Clinical Nutrition, 27(11), 1341-1347. https://doi.org/10.1093/ajcn/27.11.1341 ) ( Miller, M. R., Nichols, P. D. , & Carter, C. G. (2008). The digestibility and accumulation of dietary phytosterols in Atlantic salmon (Salmo salarL.) smolt fed diets with replacement plant oils. Lipids, 43(6),549-557.https://doi.org/10.1007/s11745-008-3175 - 4 ) ( Moundras, C., Behr, S. R., Remesy, C., & Demigne, C. (1997). Fecal losses of sterols and bile acids induced by feeding rats guar gum are due to greater pool size and liver bile acid secretion. The Journal of Nutrition,127(6),1068-1076. https://doi.org/10.1093/jn/127.6.1068 ) ( Murashita, K., Akimoto, A., Iwashita,Y.,Amano,S., Suzuki,N., Matsunari, H., & Yamamoto,T.(2013). Effects of biotechnologically processedsoybean meals in a nonfishmeal diet on growth performance, bileacid status, and morphological condition of the distal intestine and liver of rainbow trout Oncorhynchus mykiss. Fisheries Science, 79(3), 447-457. https://doi.org/10.1007/s12562-013-0617-6 ) ( Murashita, K., Ronnestad, I . , Furuita, H., Matsunari, H., Oku, H., & Yamamoto, T. (2018). Effects of dietary soybean meal on the bile physiology in rainbow trout, Oncorhynchus mykiss.Aquaculture, , 490, ,3 303-310. https://doi.org/10.1016/j.aquac ulture.2018.02.047 ) ( Murashita, K., Yoshiura, Y., Chisada , S., Furuita, H., Sugita , T.,Matsunari, H. , & Yamamoto,T.(2014 ) . Homologue gene of bile acid transport-ers ntcp, asbt, and ost-alpha in rainbow trout Oncorhynchus my-kiss: tissue expression, effect of fasting, and response to bile acidadministration. Fish Physiology and Biochemistry, 40(2), 511-525.https://doi.org/10.1007/s10695-013-9862-Y ) ( Nguyen, H. P., Khaoian, P. , Fukada,H.,Suzuki, N., & Masumoto,T.(2015).Feeding fermented soybean meal diet supplemented with taurine ) ( to yellowtail Seriola quinqueradiata affects growth performance and lipid digestion. Aquaculture Research, 46(5), 1101-1110. https://doi. org/10.1111/are.12267 ) ( NRC(2011). Nutrient Requirements of Fish and Shrimp. National Academies Press. ) ( Olli, J. J., & Krogdahl, A. (1994). Nutritive value of four soybean prod - ucts as protein sources in diets for rainbow trout (Oncorhynchus mykiss, Walbaum) reared i n fresh water. Acta Agriculturae Scandinavica,Section A -Animal Science, 44(3), 185-192. https://doi.org/10.1080/09064709409410896 ) ( Reddy, B. S.(1992). Dietary fat and colon cancer: Animal model studies. Lipids, 27(10),807-813.https://doi.org/10.1007/BF02535855 ) ( Reddy, B. S . , Mangat, S. , Sheinfil, A., Weisburger, J. H., & Wynde r , E. L. (1977). Effect of type and amount of dietary fat and1,2-dimethylhydrazine on biliary bile acids, fecal bile acids, andneutral sterols in rats. Cancer Research, 37(7 Pt. 1 ) ,2132-2137. ) ( Refstie, S ., Svihus, B., Shearer, K. D., & Storebakken, T. (1999). Nutrient digestibility in Atlantic salmon and broiler chickens related to vis-cosity and non-starch polysaccharide content in different soyabeanproducts. Animal Feed Science and Technology, 79(4), 331-345.https://doi.org/10.1016/s0377-8401(99)00026-7 ) ( Richard,N., Colen,R.,&Aragao,C.(2017).Supplementing taurine to plant- based diets improves l ipid digestive capacity and amino acid reten-tion of Senegalese sole (Solea senegalensis) juveniles. Aquaculture,468,94-101.https://doi.org/10.1016/j.aquaculture.2016.09.050 ) ( Romano, N., Kumar, V. , Yang, G., Kajbaf, K., Rubio, M. B., Overturf, K., Brezas, A., & Hardy, R. (2020). Bile acid metabolism in fish: distur-bances caused by fishmeal alternatives and some mitigating effectsfrom dietary bile inclusions. Reviews in Aquaculture, https://doi. org/10.1111/raq.12410 ) ( Romarheim, O. H., Skrede, A., Penn, M., Mydland, L. T., Krogdahl, A., & Storebakken,T.(2008).Lipid digestibility, bile drainage and development of morphological intestinal changes in rainbow trout(Oncorhynchus my-kiss) fed diets containing defatted soybean meal.Aquaculture,274(2-4), 329-338. https://doi.org/10.1016/j.aquaculture.2007.11.035 ) ( Scherer,M.,Gnewuch, C.,Schmitz, G., & Liebisch,G.(2009).Rapid quantifica- tionofbileacids and theirconjugates in serumbyliquidchromatography-tandem mass spectrometry. Journal of Chromatography B: Analytical Technologies in the Biomedical and Life Sciences, 877(30),3920-3925. https://doi.org/10.1016/j.jchromb.2009.09.038 ) ( Schiff, E. R., Smal l , N. C., & Dietschy, J. M. (1972). Characterization ofthe kinetics of the passive and active transport mechanisms forbile acid absorption in the small intestine and colon of the rat.The Journal of Clinical Investigation, 51(6), 1351-1362. https://doi.org/10.1172/JCI106931 ) ( Sinha, A. K . , Kumar, V.,Makkar, H. P. S.,De Boeck, G. , & Becker, K. (2011).Non-starch polysaccharides and their role in fish nutr i tion-A re-view. Food Chemistry,127(4),1409-1426.https://doi.org/10.1016/j. foodchem.2011.02.042 ) ( Staessen, T.W.O., Verdegem,M. C. J., Koletsi,P.,& Schrama,J . W.(2020). The effect of dietary protein source ( f ishmeal vs. plant protein)and non-starch polysaccharide level on fat digestibility and faecalbile acid loss in rainbow trout (Oncorhynchus mykiss). AquacultureResearch, 51(3), 1170-1181.https://doi.org/10.1111/are.14467 ) ( Staessen, T . W. O., Verdegem, M. C. J., Weththasinghe, P., & Schrama, J. W. (2020) . The effect of dietary non-starch polysaccharide leveland bile acid supplementation on fat digestibility and the bile acidbalance in rainbow trout (Oncorhynchus mykiss). Aquaculture, 523,735174. https://doi.org/10.1016/j.aquaculture.2020.735174 ) ( Stellaard, F., Sackmann, M., Berr, F., & Paumgartner, G. (1987). Simultaneous determination of pool sizes and fractional turnoverrates, of deoxycholic acid, cholic acid and chenodeoxycholic acid in man by isotope dilution with 2H and 13C labels and serum sam- pling. Biomedical & Environmental Mass Spectrometry, 14(11), 609-611.https://doi.org/10.1002/bms.1200141106 ) ( Tocher, D. R.(2010). Metabolism and functions of l ipids and fatty acids in teleost fish. Reviews in Fisheries Science, 11(2), 107-184. https://doi.org/10.1080/713610925 ) ( Van Eldere, J., Celis , P., De Pauw, G., Lesaffre, E., & Eyssen, H.(1996). Tauroconjugation of cholic acid stimulates 7 alpha-dehydroxylation by fecal bacteria. Applied and Environmental Microbiology, 62(2), 656-661. https://doi.org/10.1128/ AEM.62.2.656-661.1996 ) ( Yamamoto, T., Goto, T., Kine, Y., Endo, Y., Kitaoka, Y., Sugita, T . , Furuita, H., Iwashita, Y., & Suzuki, N. (2008). Effect of an alco- hol extract from a defatted soybean meal supplemented witha casein-based semi-purified diet on the biliary bile status andintestinal conditions in rainbow trout Oncorhynchus mykiss (Walbaum). Aquaculture Research, 39(9), 986-994. https://doi. org/10.1111/j.1365-2109.2008.01969.x ) ( Yamamoto, T . , Iwashita, Y.,Matsunari,H. , Sugita , T., Furuita, H., Akimoto,A., Okamatsu, K., & Suzuki, N. (2010) . Inf l uence of fermenta- tion conditions for soybean meal in a non-fish meal diet on thegrowth performance and physiological condition of rainbow troutOncorhynchus mykiss. Aquaculture, 309(1-4 ) , 173-180. https://doi.org/10.1016/j.aquaculture.2010.09.021 ) ( Yamamoto, T . , Matsunari, H., Sugita, T., Furuita, H., Masumoto, T., Iwashita, Y., Amano, S., & Suzuki, N. (2012). Optimization of thesupplemental essential amino acids to a fish meal - free diet basedon fermented soybean meal for rainbow trout Oncorhynchus mykiss. Fisheries Science, 78(2), 359-366. https://doi.org/10.1007/s1256 2-011-0456-2 ) ( Yamamoto, T . , Murashita, K., Matsunari, H., Sugita, T., Furuita, H., Iwashita, Y., Amano, S., & Suzuki, N. (2012). Influence of dietarysoy protein and peptide products on bile acid status and distalintestinal morphology of rainbow trout Oncorhynchus mykiss.Fisheries Science,78(6),1273-1283.https://doi.org/10.1007/s1256 2-012-0551-Z ) ( Yamamoto, T . , Suzuki, N., Furuita, H., Sugita, T., Tanaka, N., & Goto,T. (2007). Supplemental effect of bile salts to soybean meal- based diet on growth and feed utilization of rainbow trout Oncorhynchus mykiss. Fisheries Science, 73(1), 123-131 . https://doi. org/10.1111/j.1444-2906.2007.01310.x ) ( Yun, B. , Mai, K., Zhang, W., & Xu, W. (2011). Effects of dietary cholesterolon growth performance, feed intake and cholesterol metabolismin juvenile turbot (Scophthalmus maximus L.) fed high plant proteindiets. Aquaculture, 319(1-2), 105-110. https://doi.org/10.1016/j.aquaculture.2011.06.028 ) ( Zambiazi, R. C., Przybylski, R., Zambiazi, M. W., & Mendonca, C. B.(2007) . Fatty acid composition of vegetable oils and fats. Boletim doCentro De Pesquisa De Processamento De Alimentos,25(1),111-120.https://doi.org/10.5380/cep.v25i1.8399 ) SUPPORTING INFORMATION Additional supporting information may be found online in theSupporting Information section.
确定
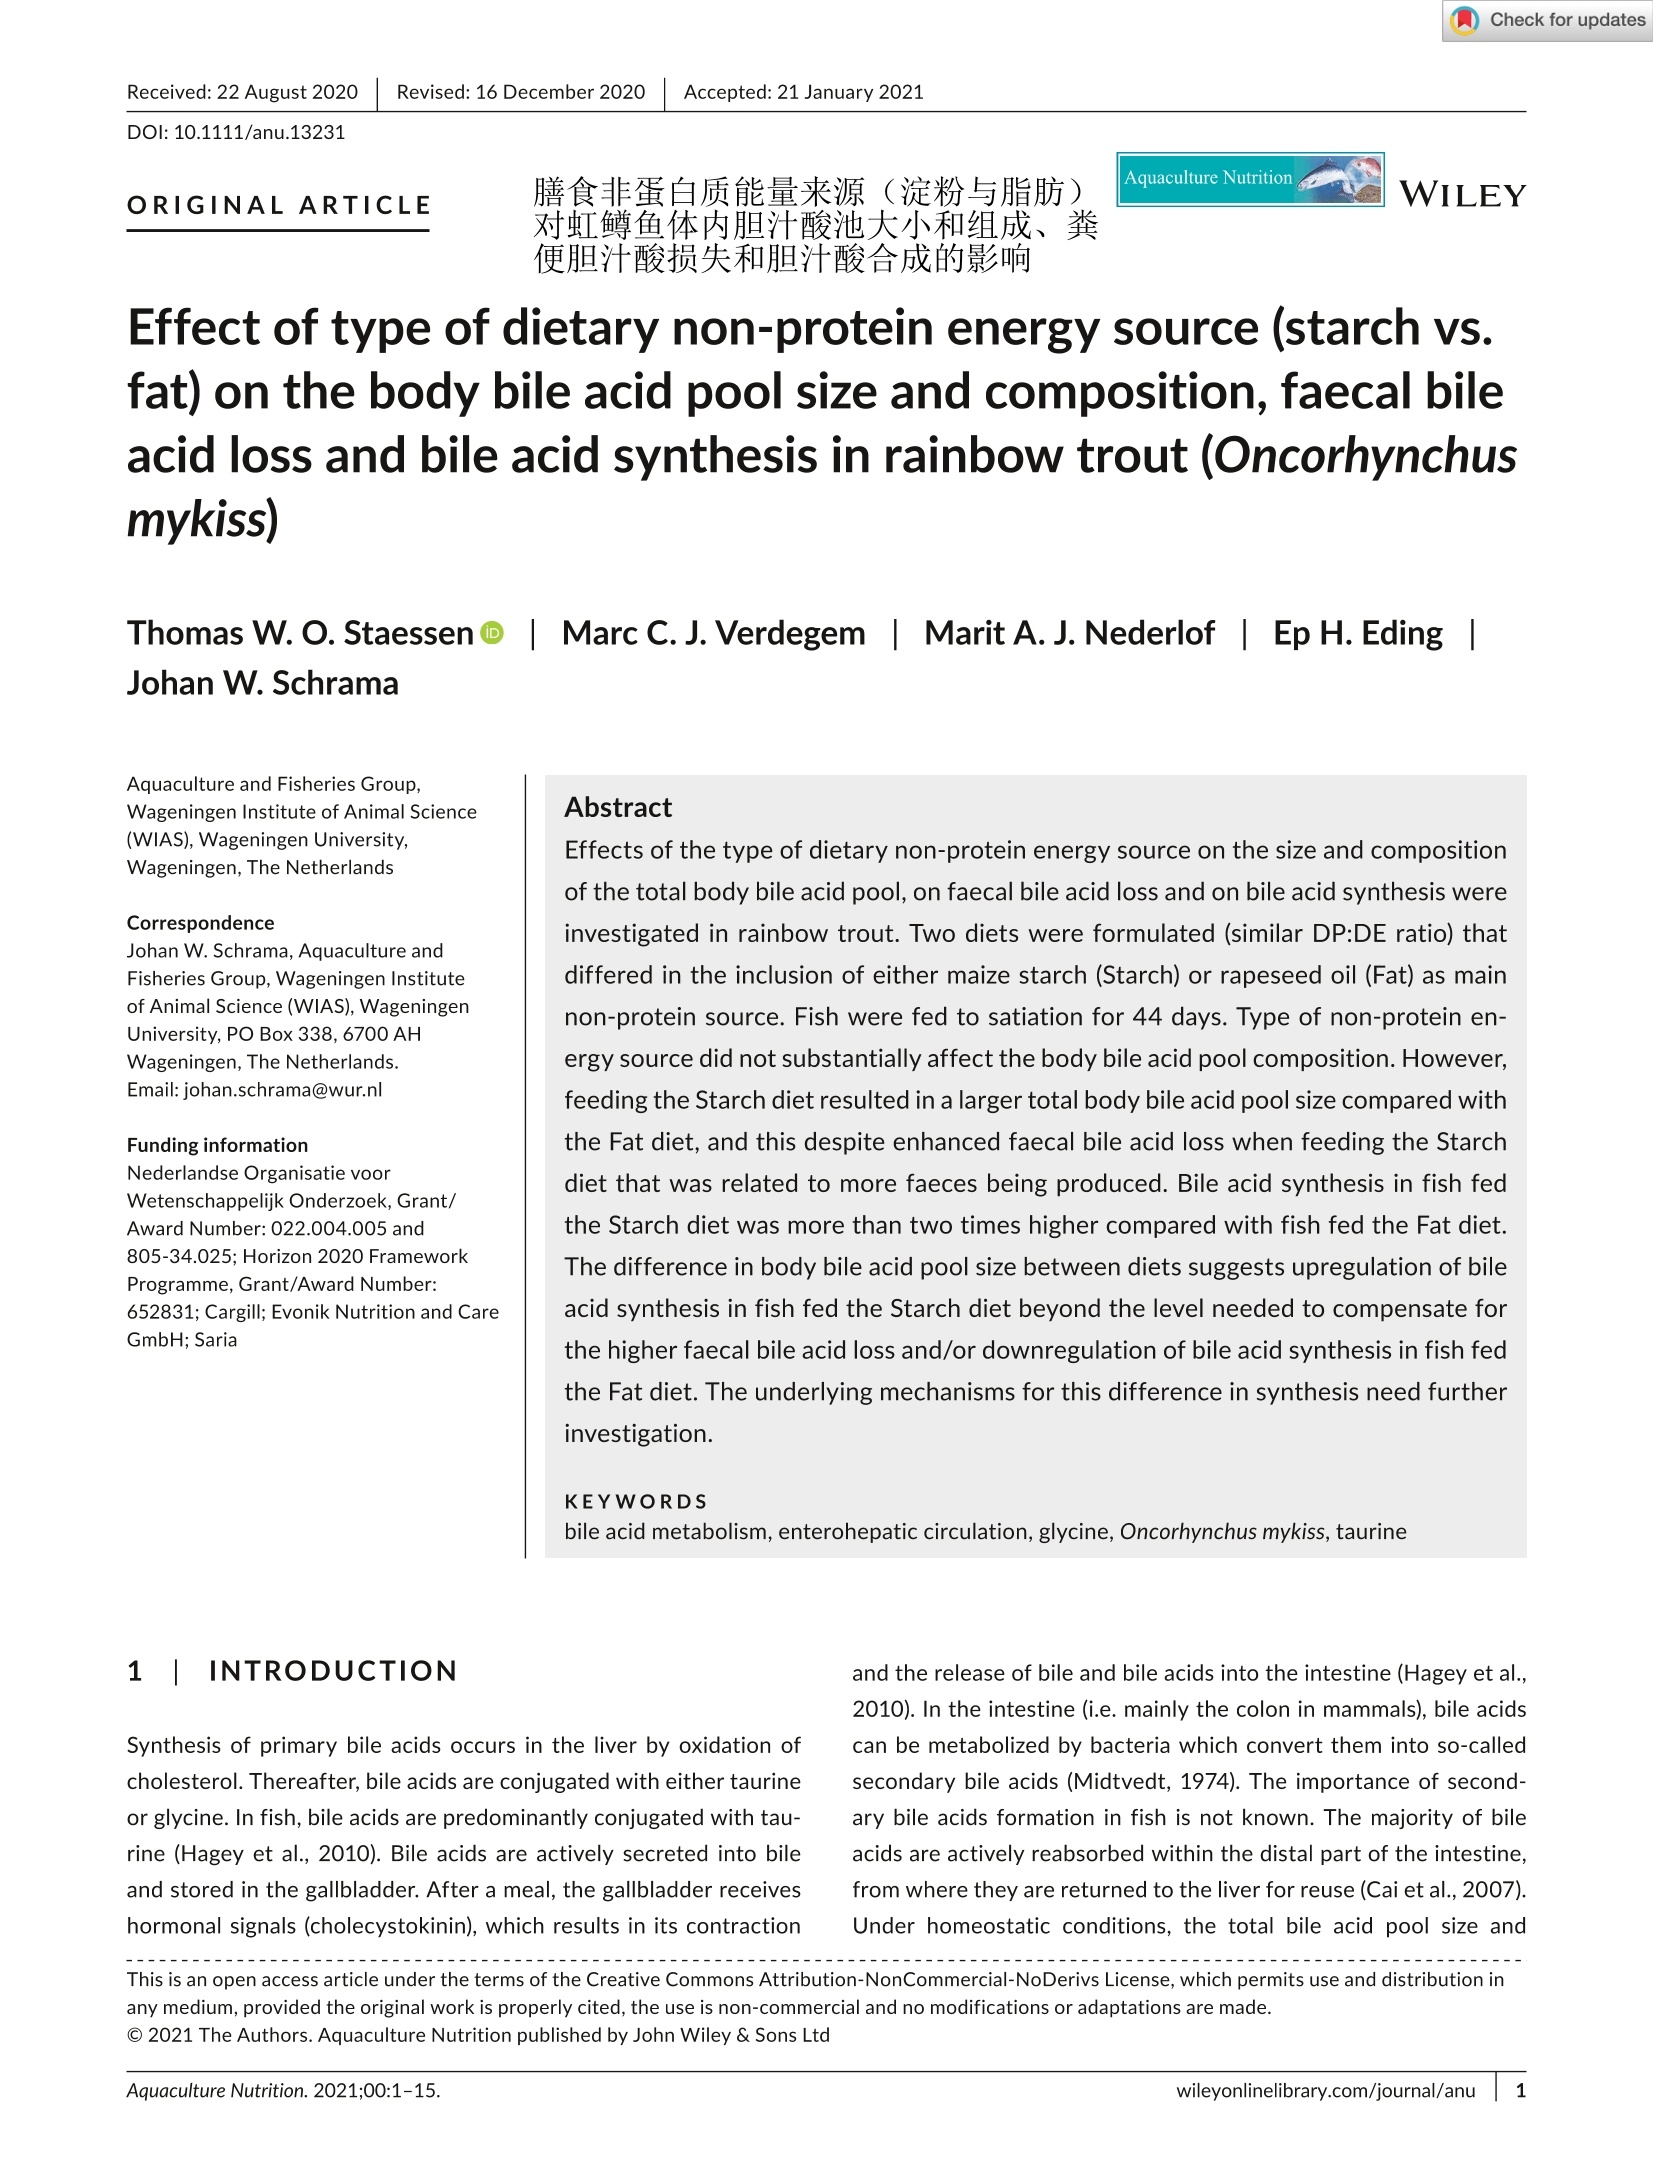

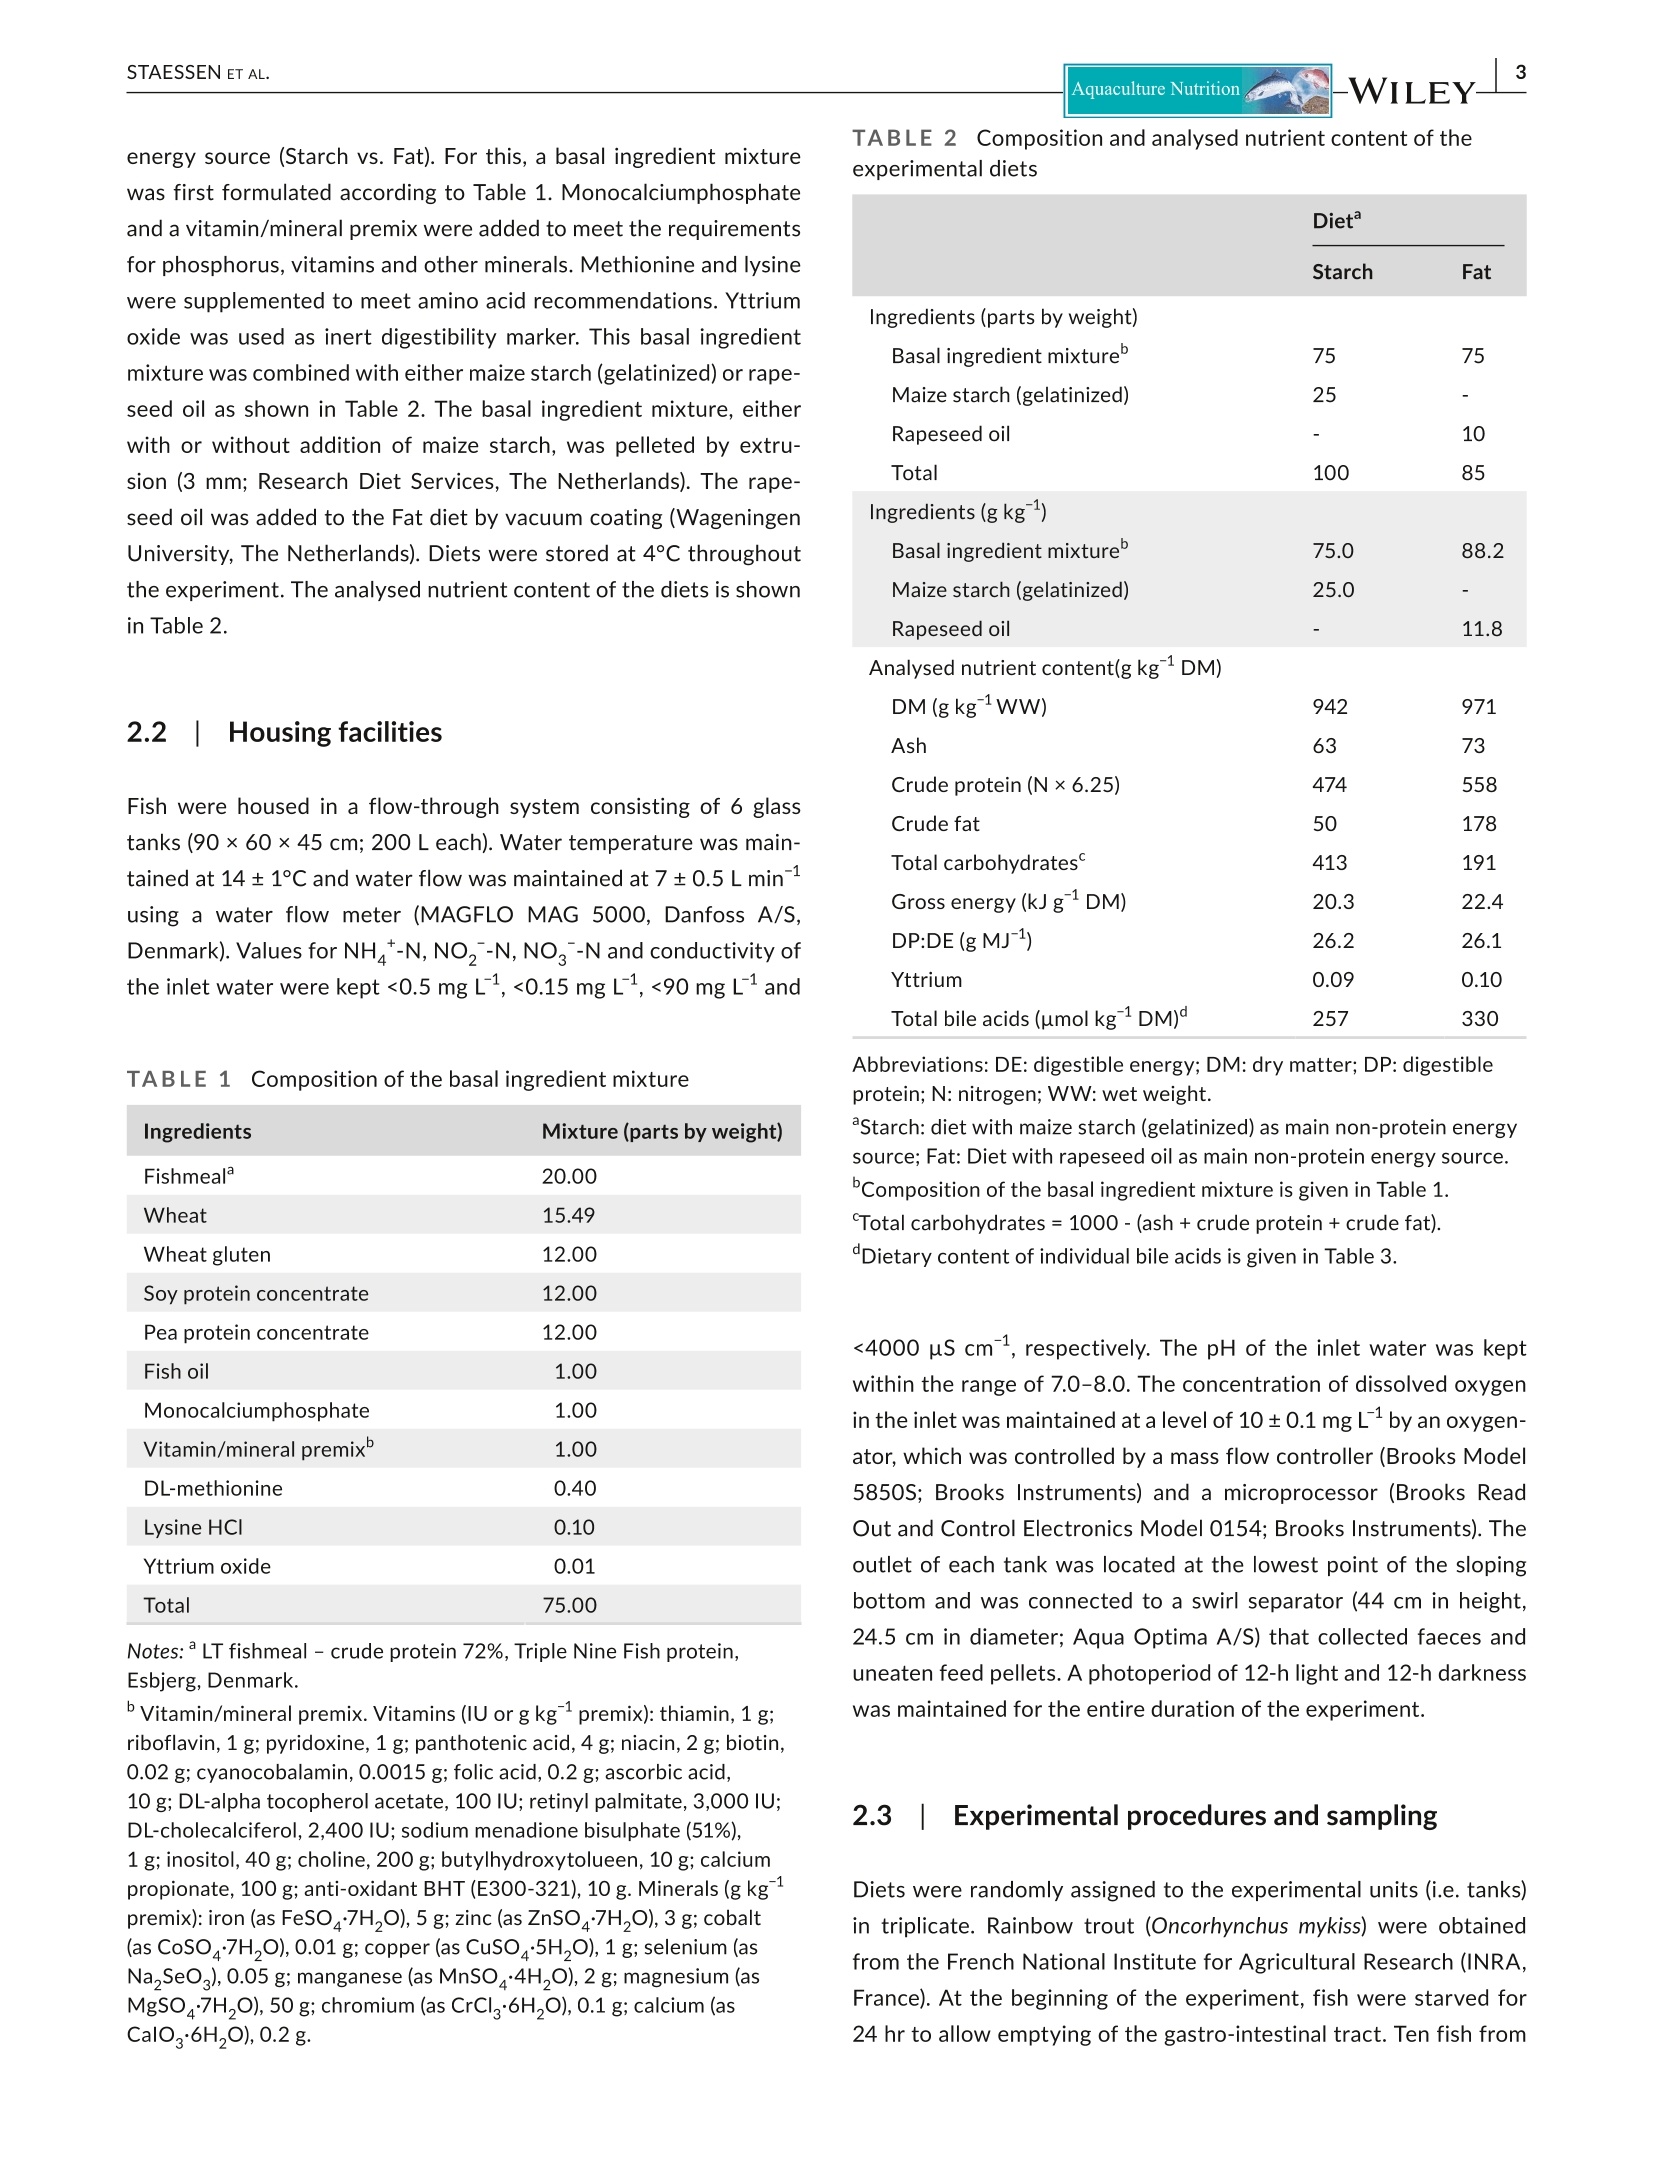
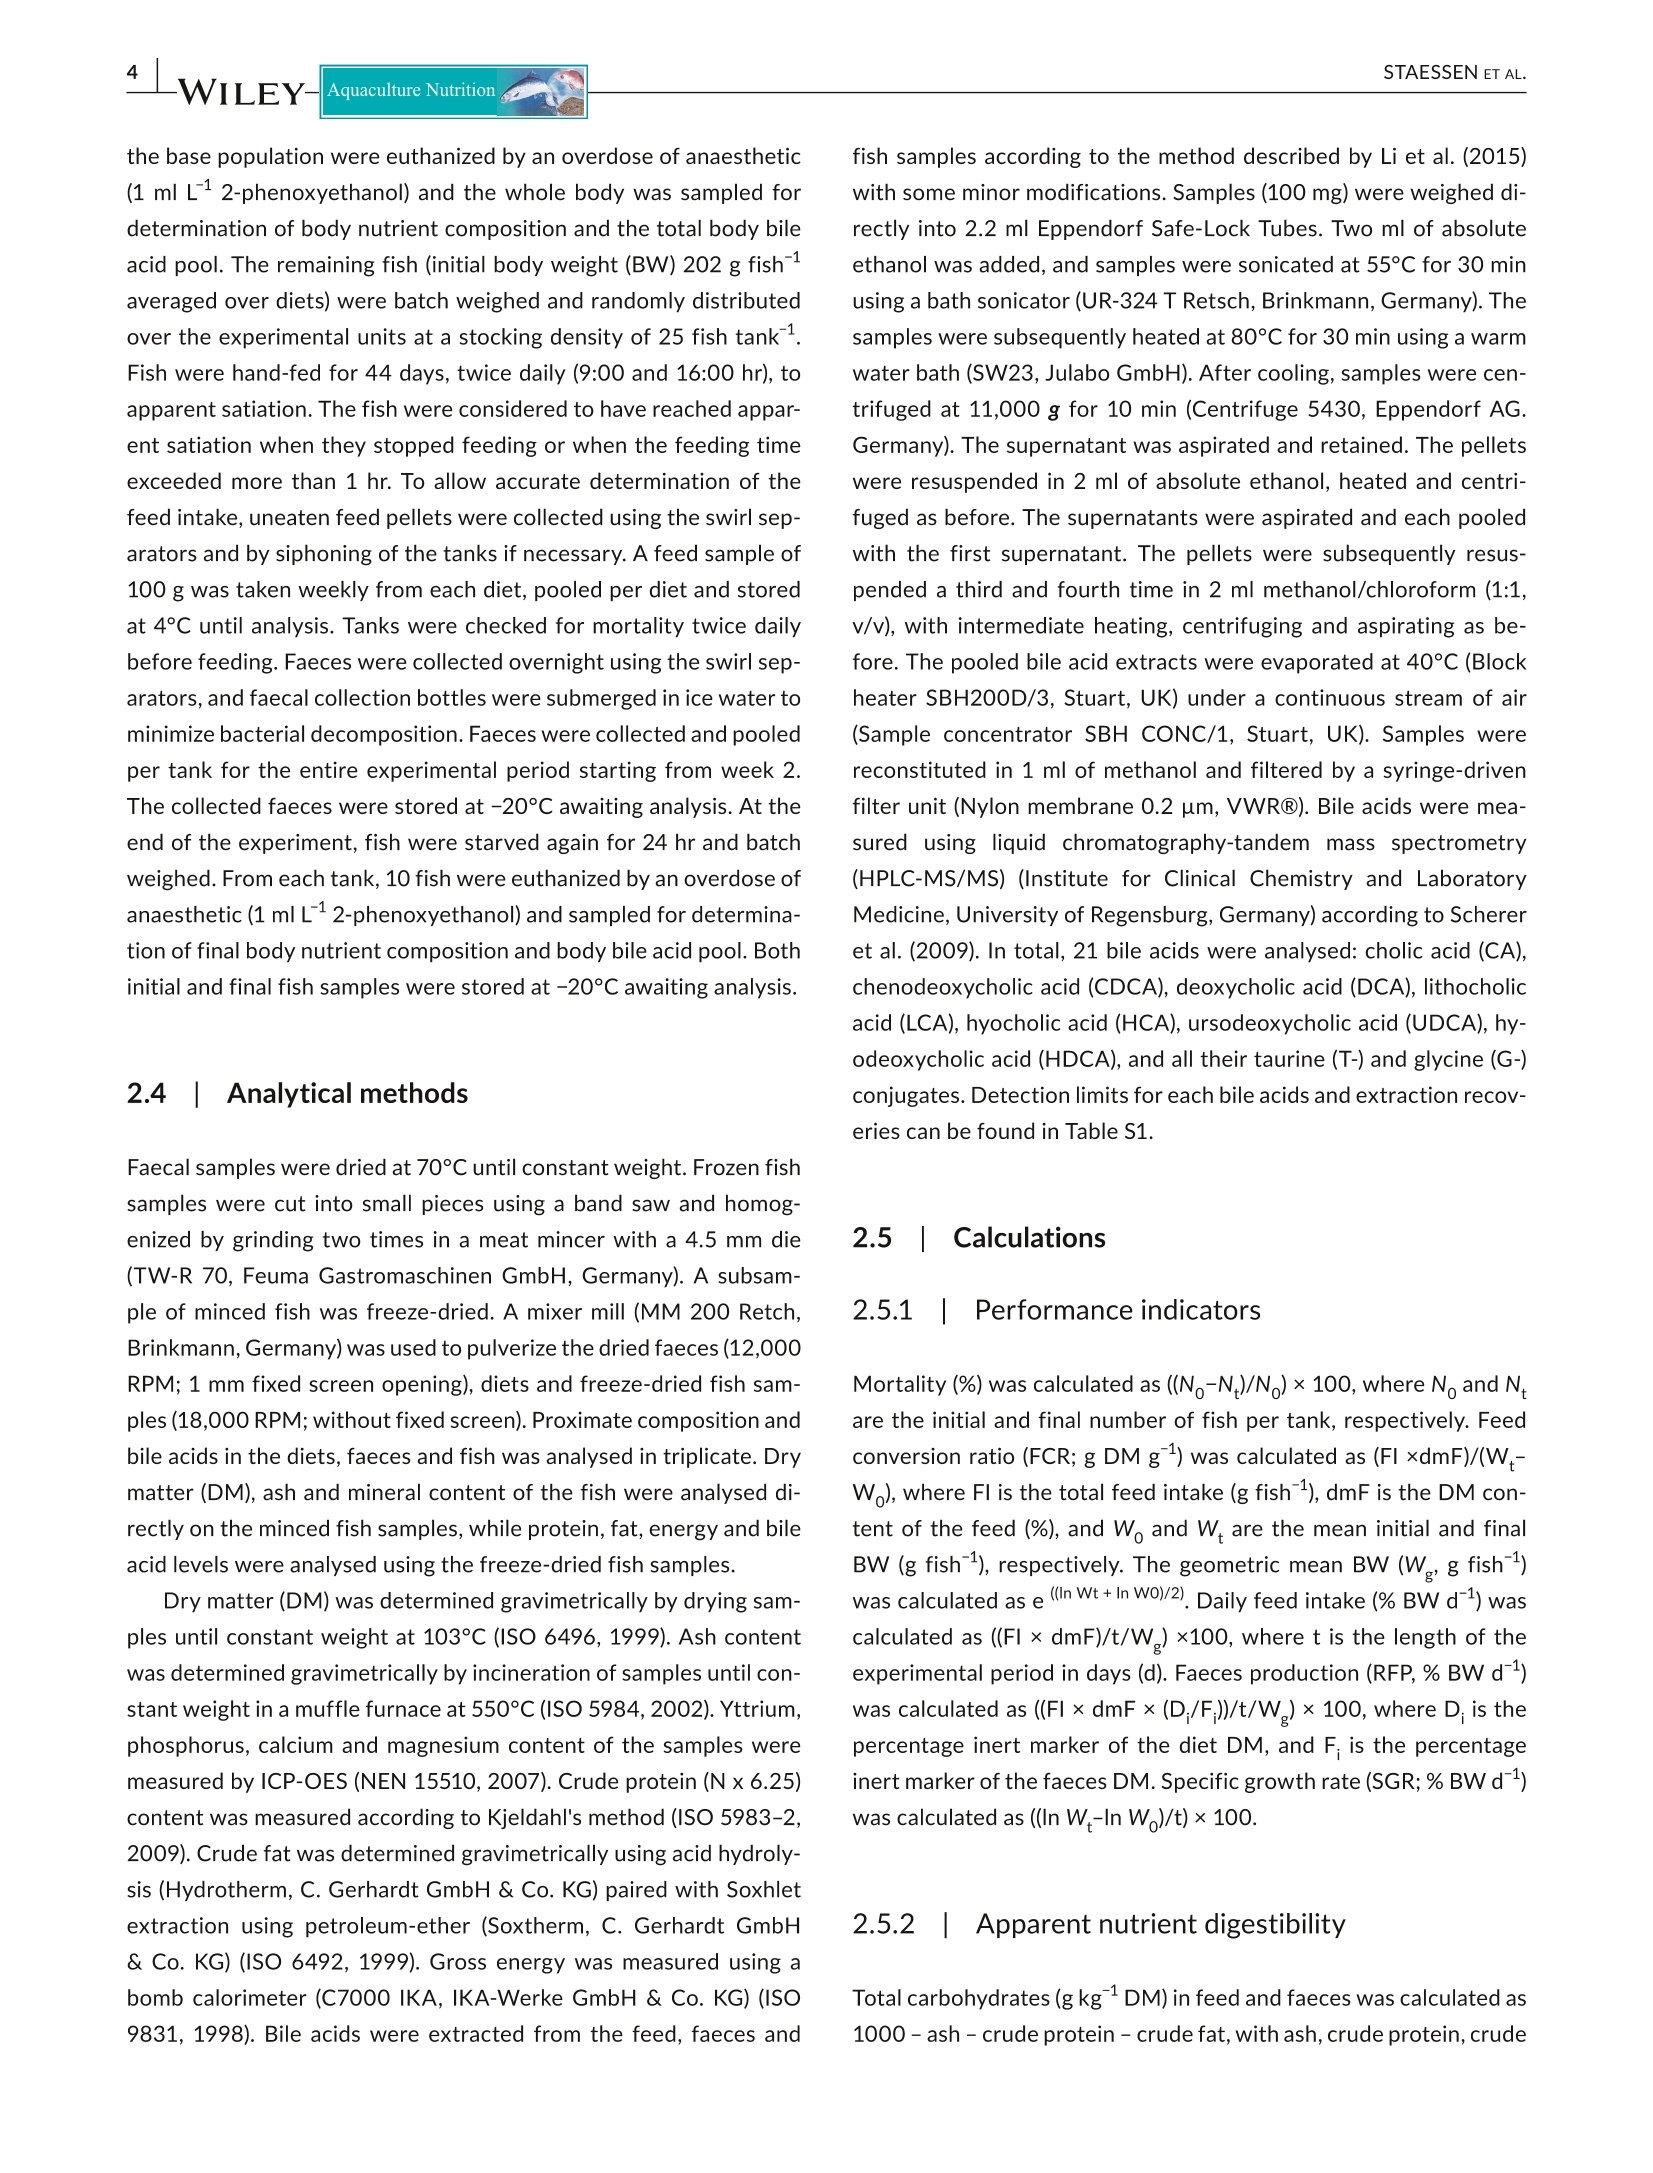
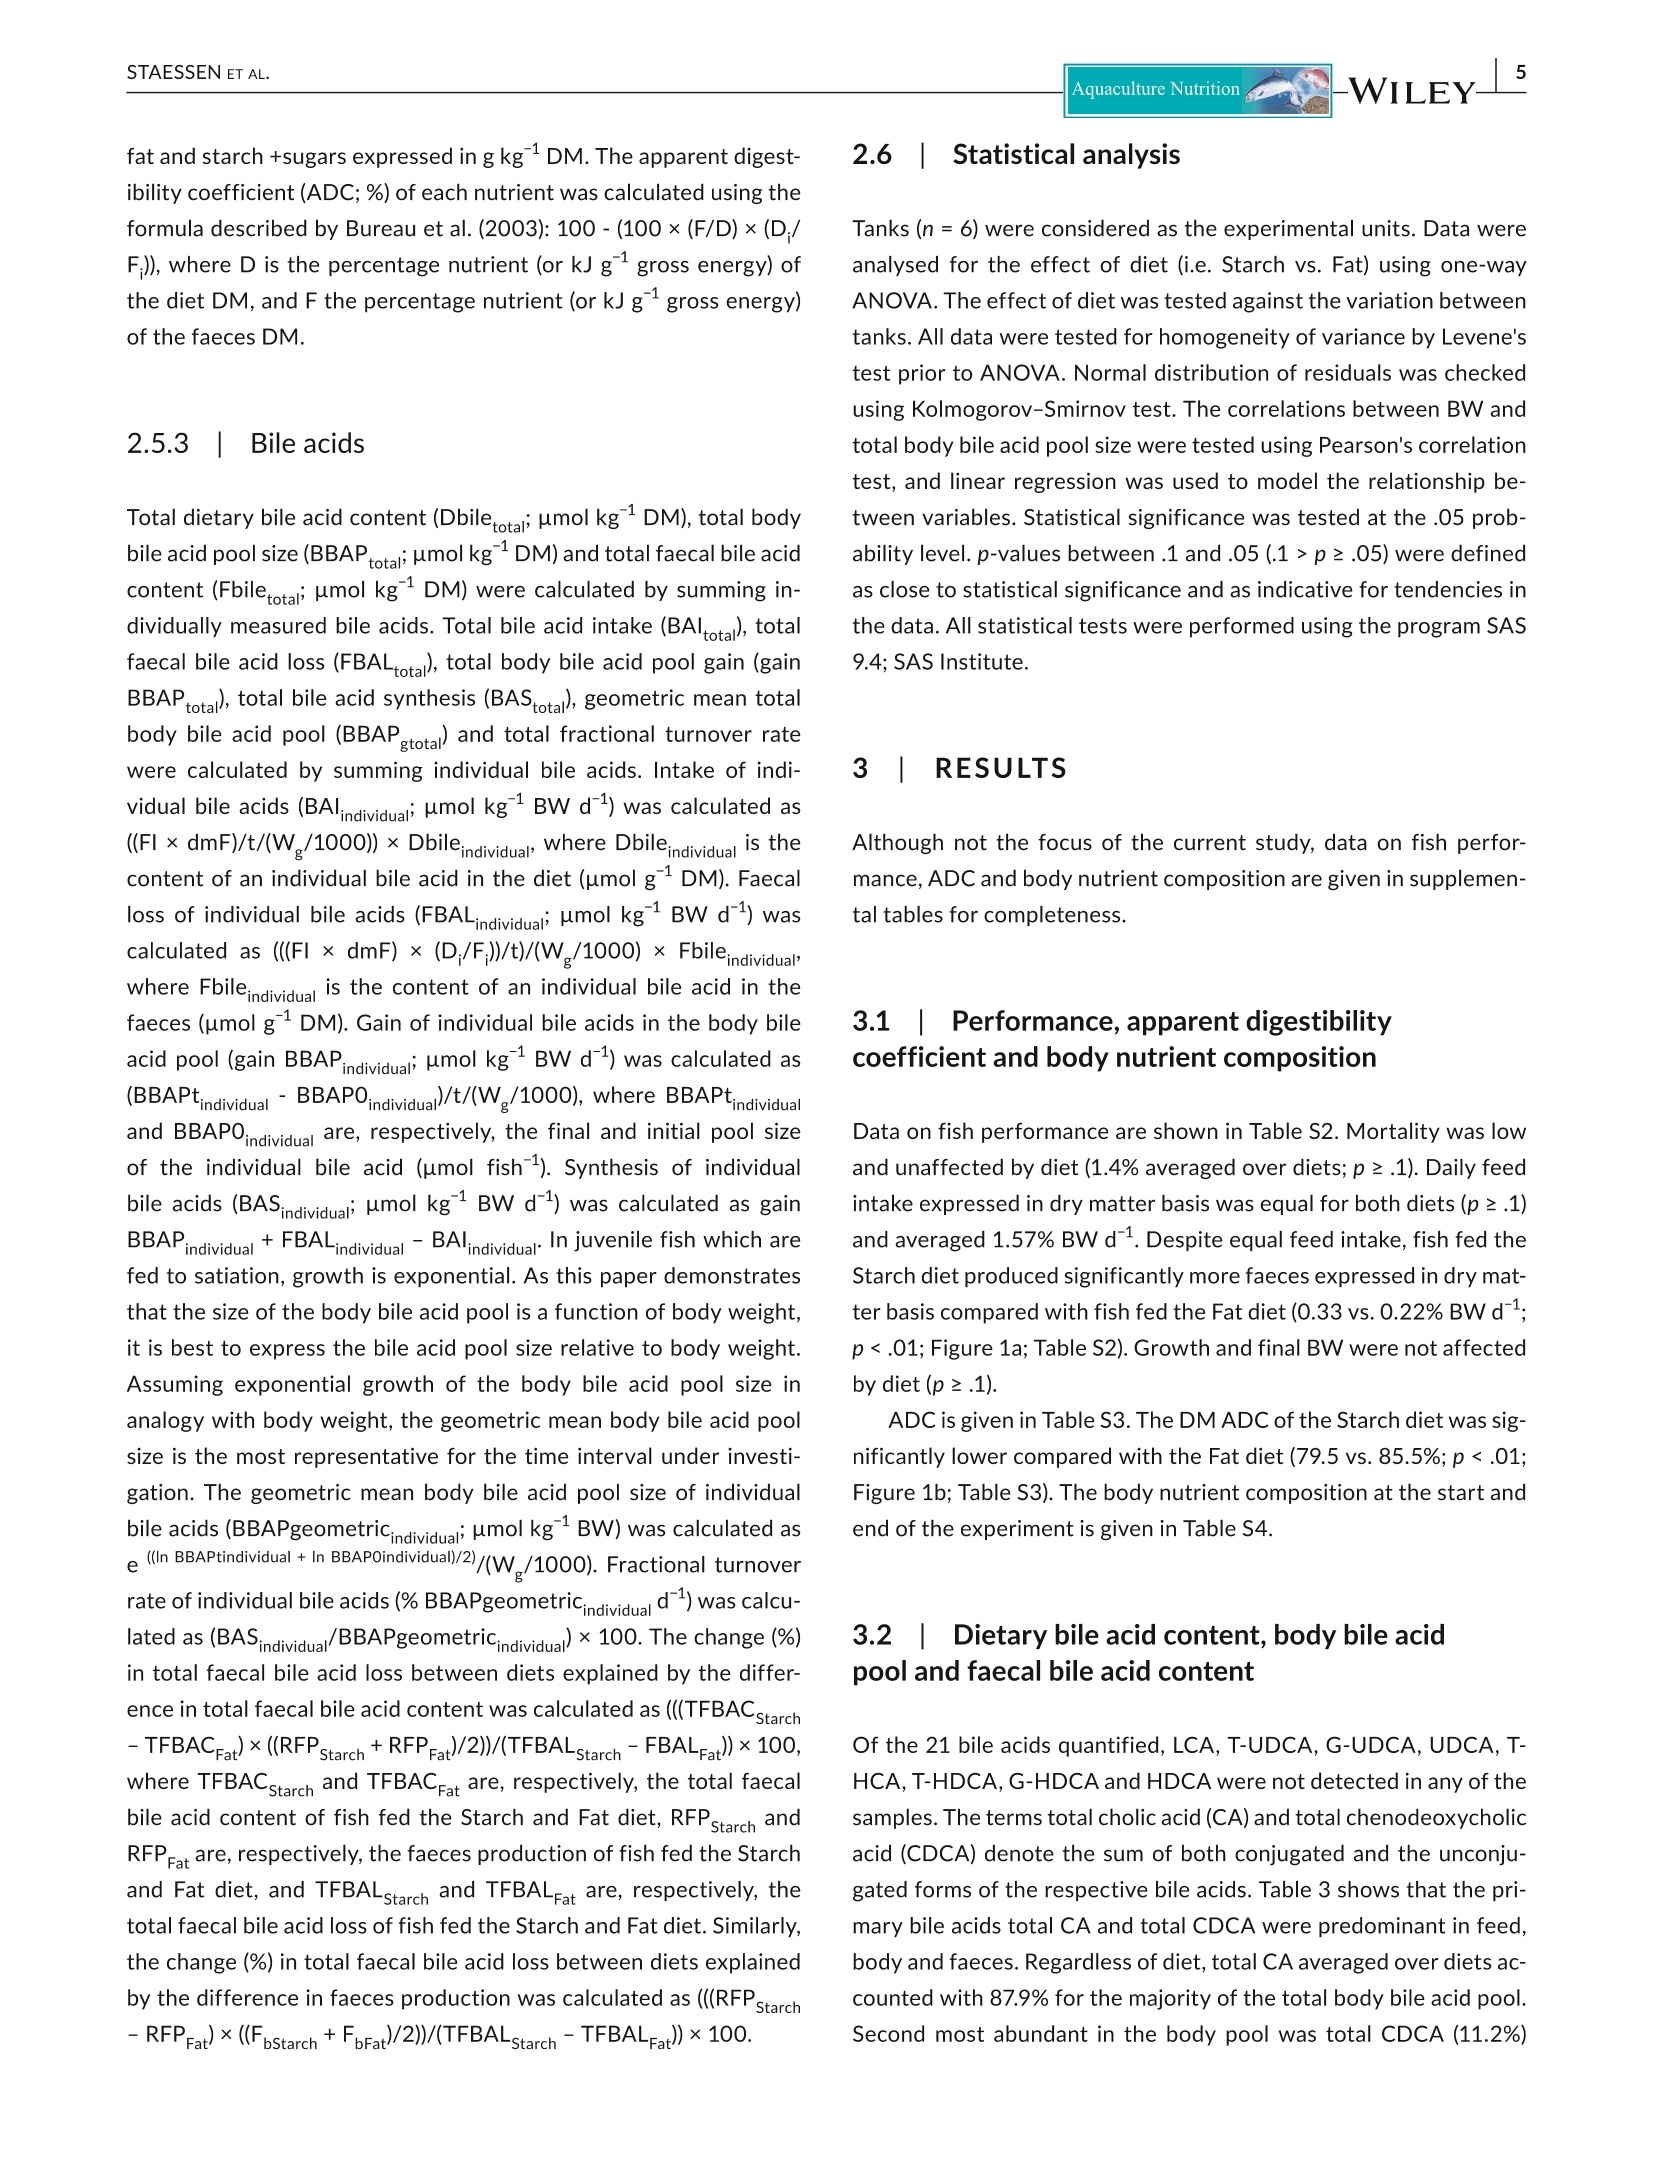
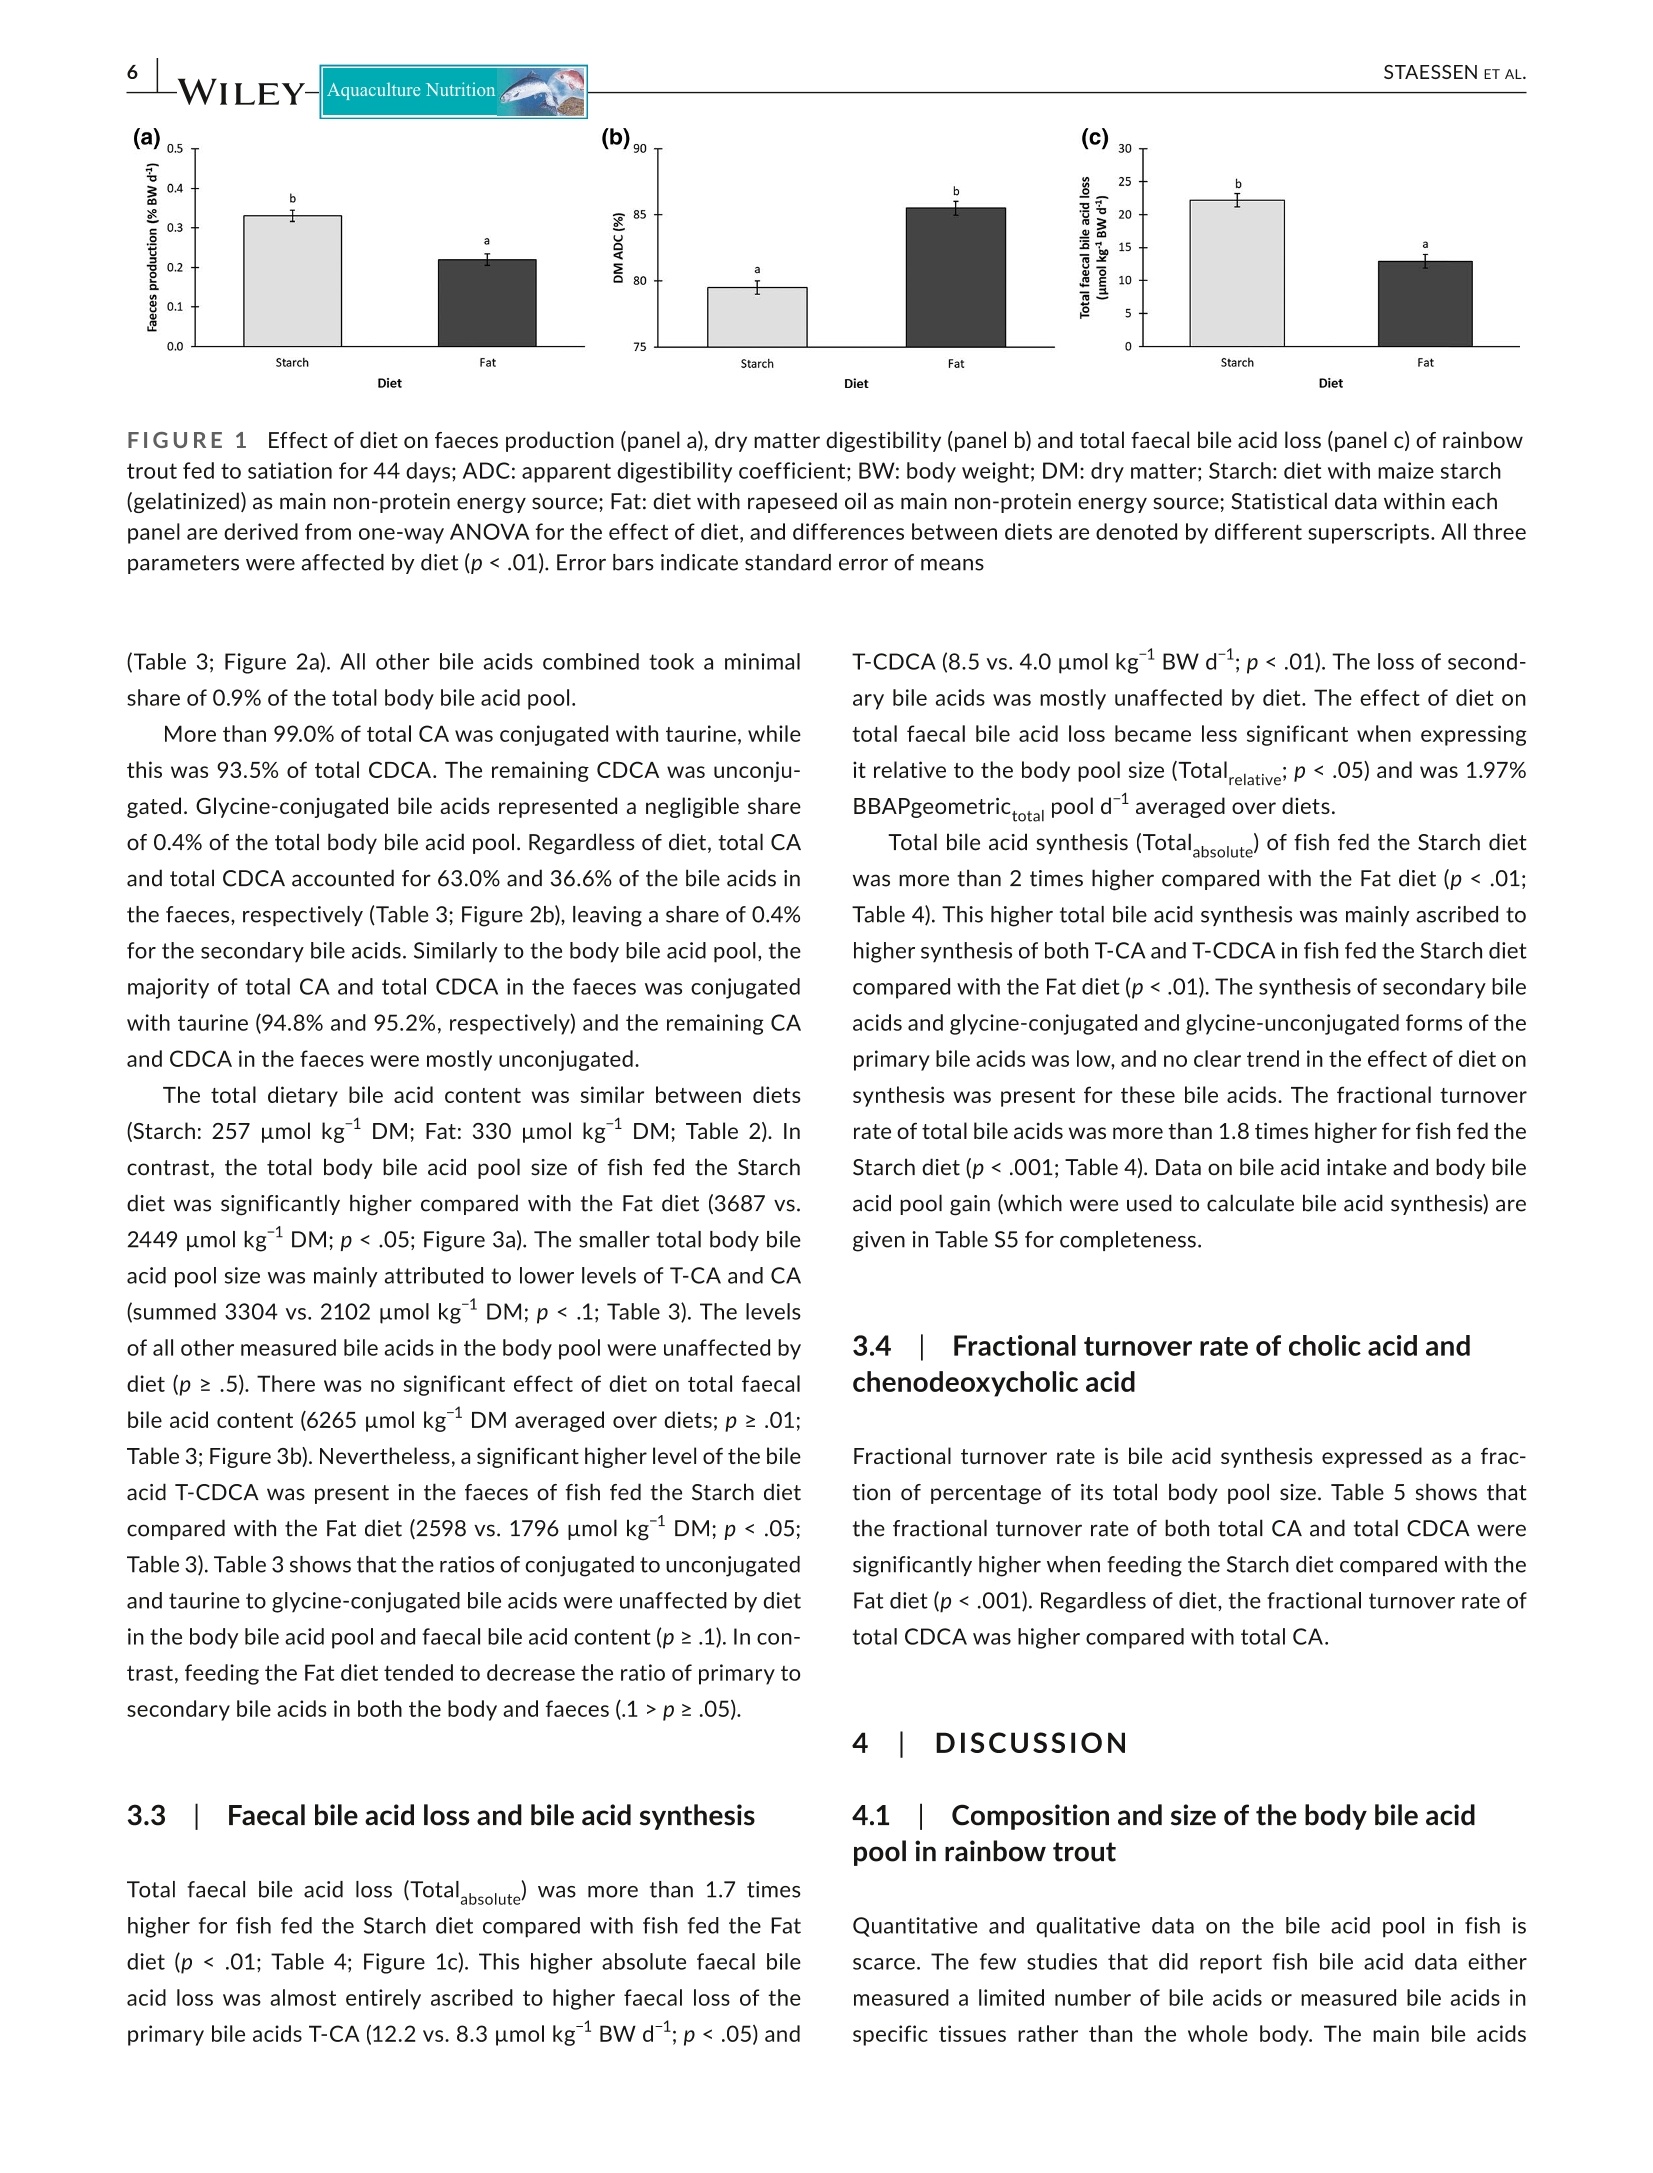
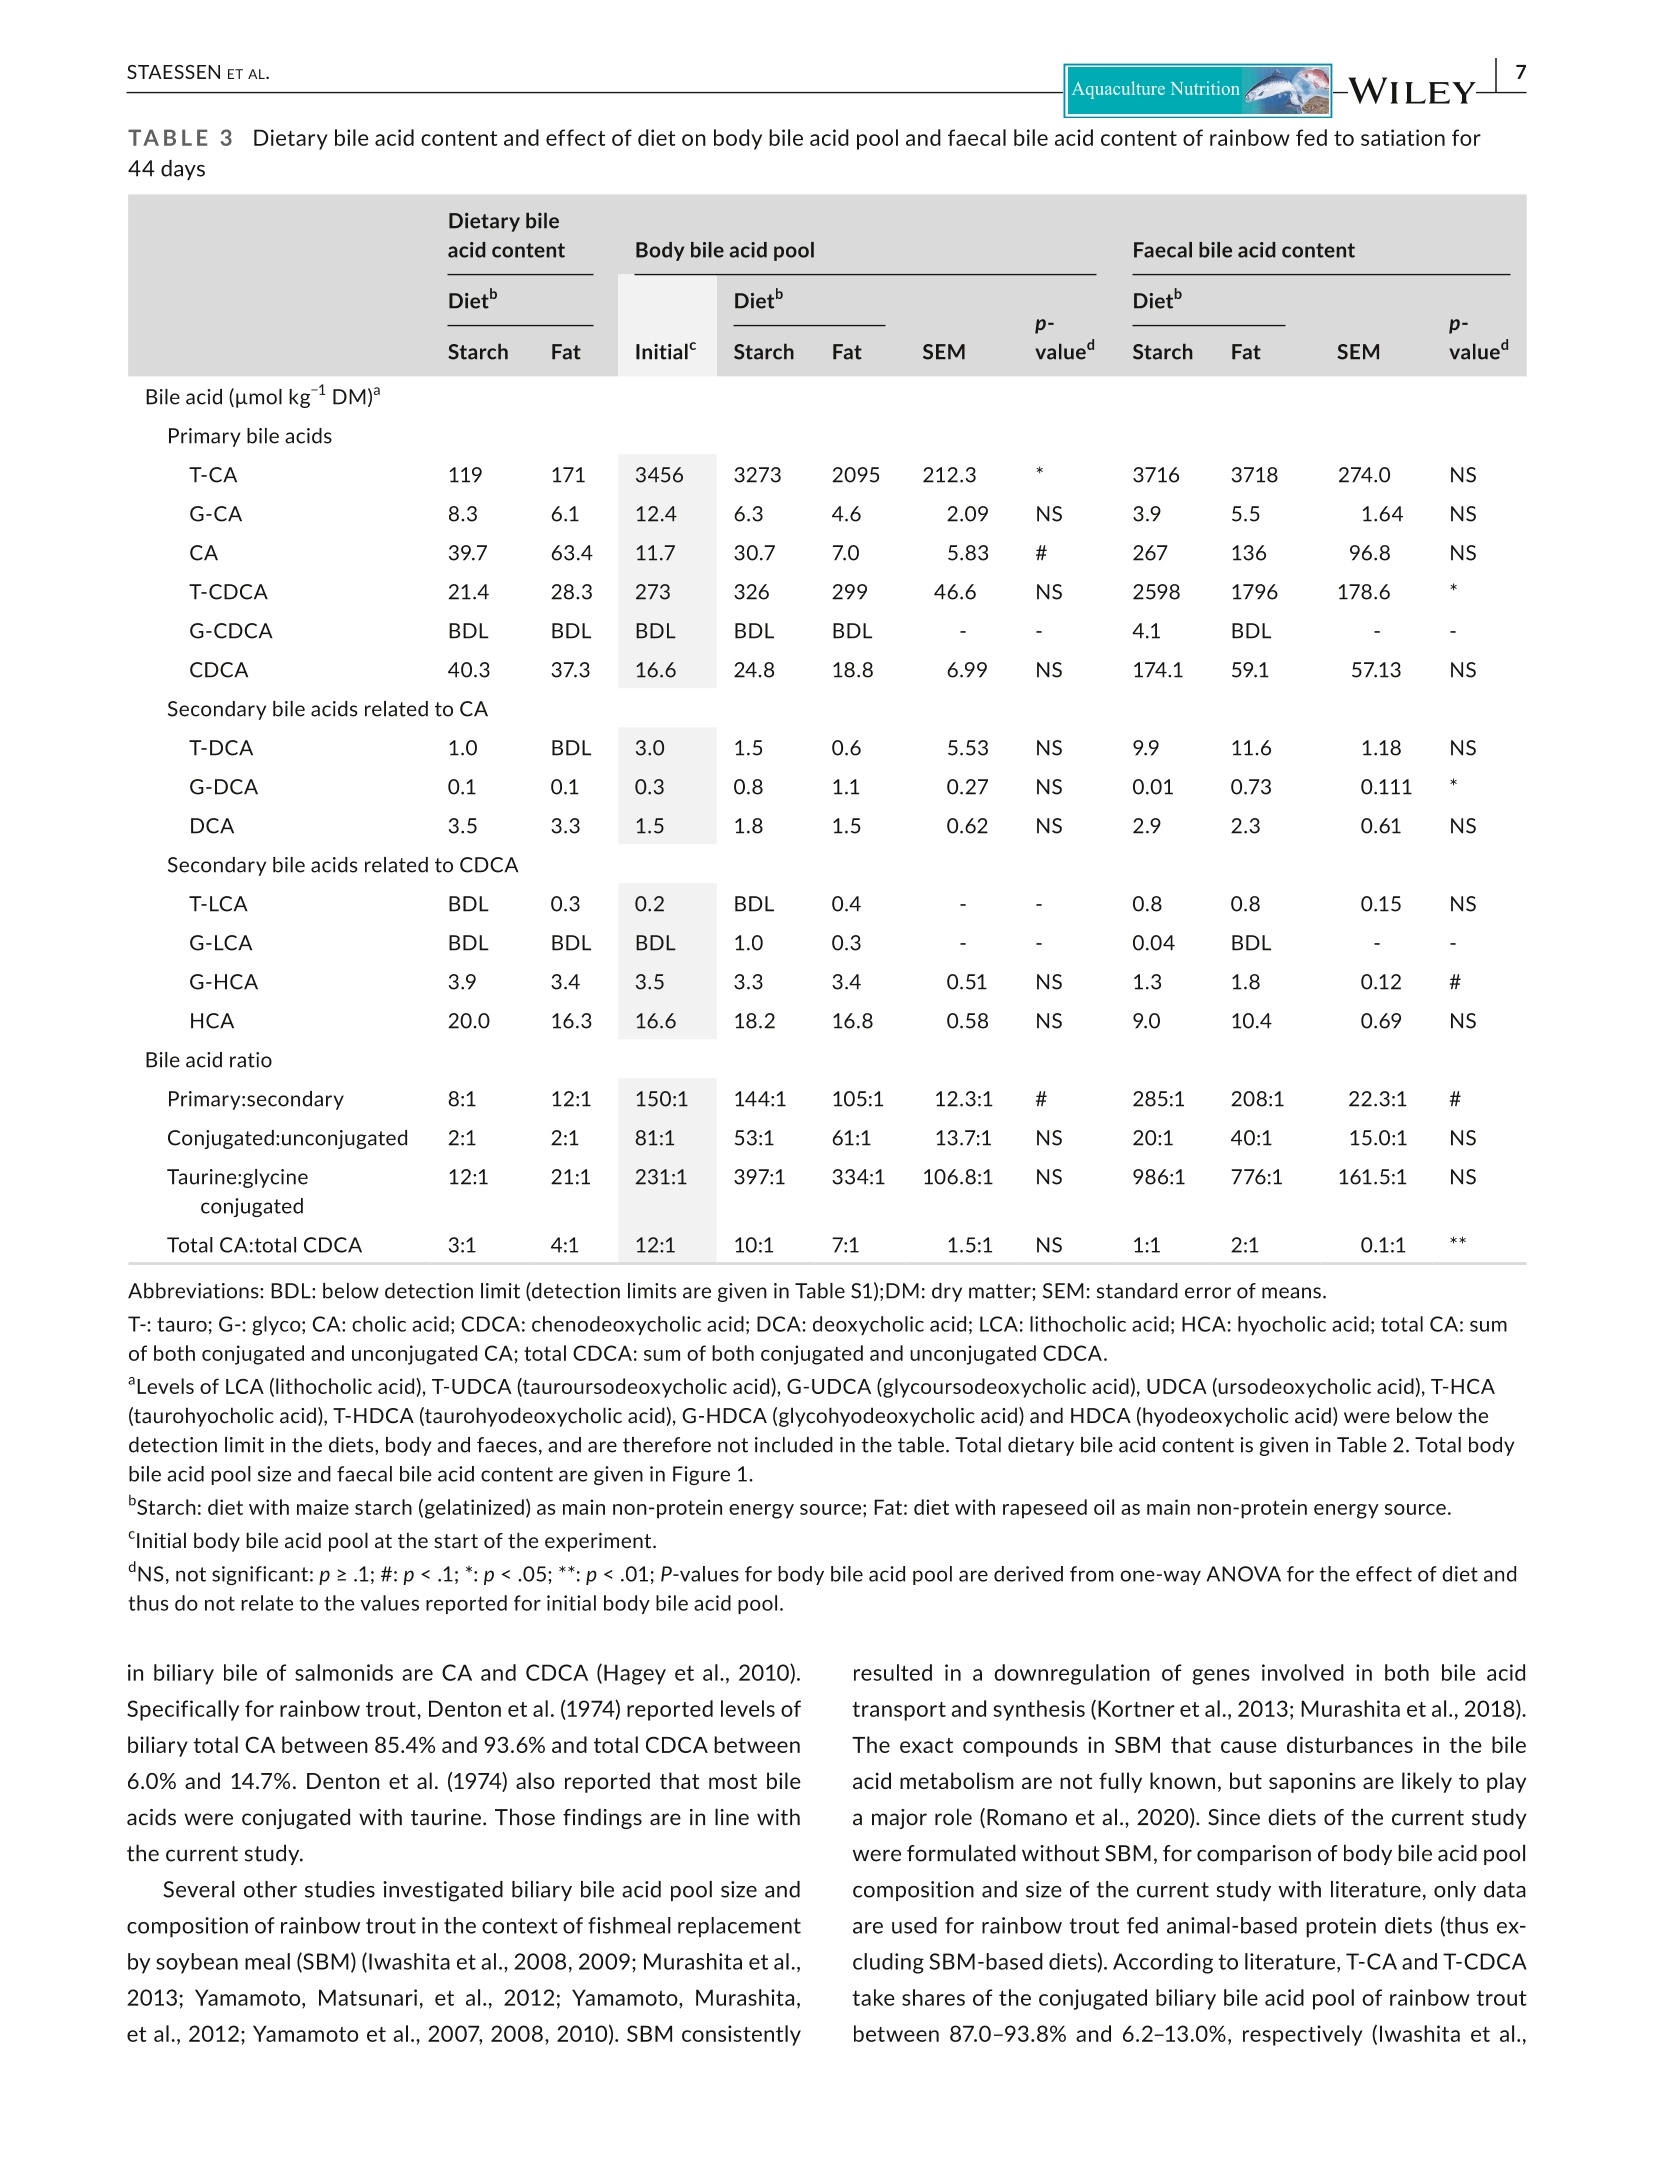
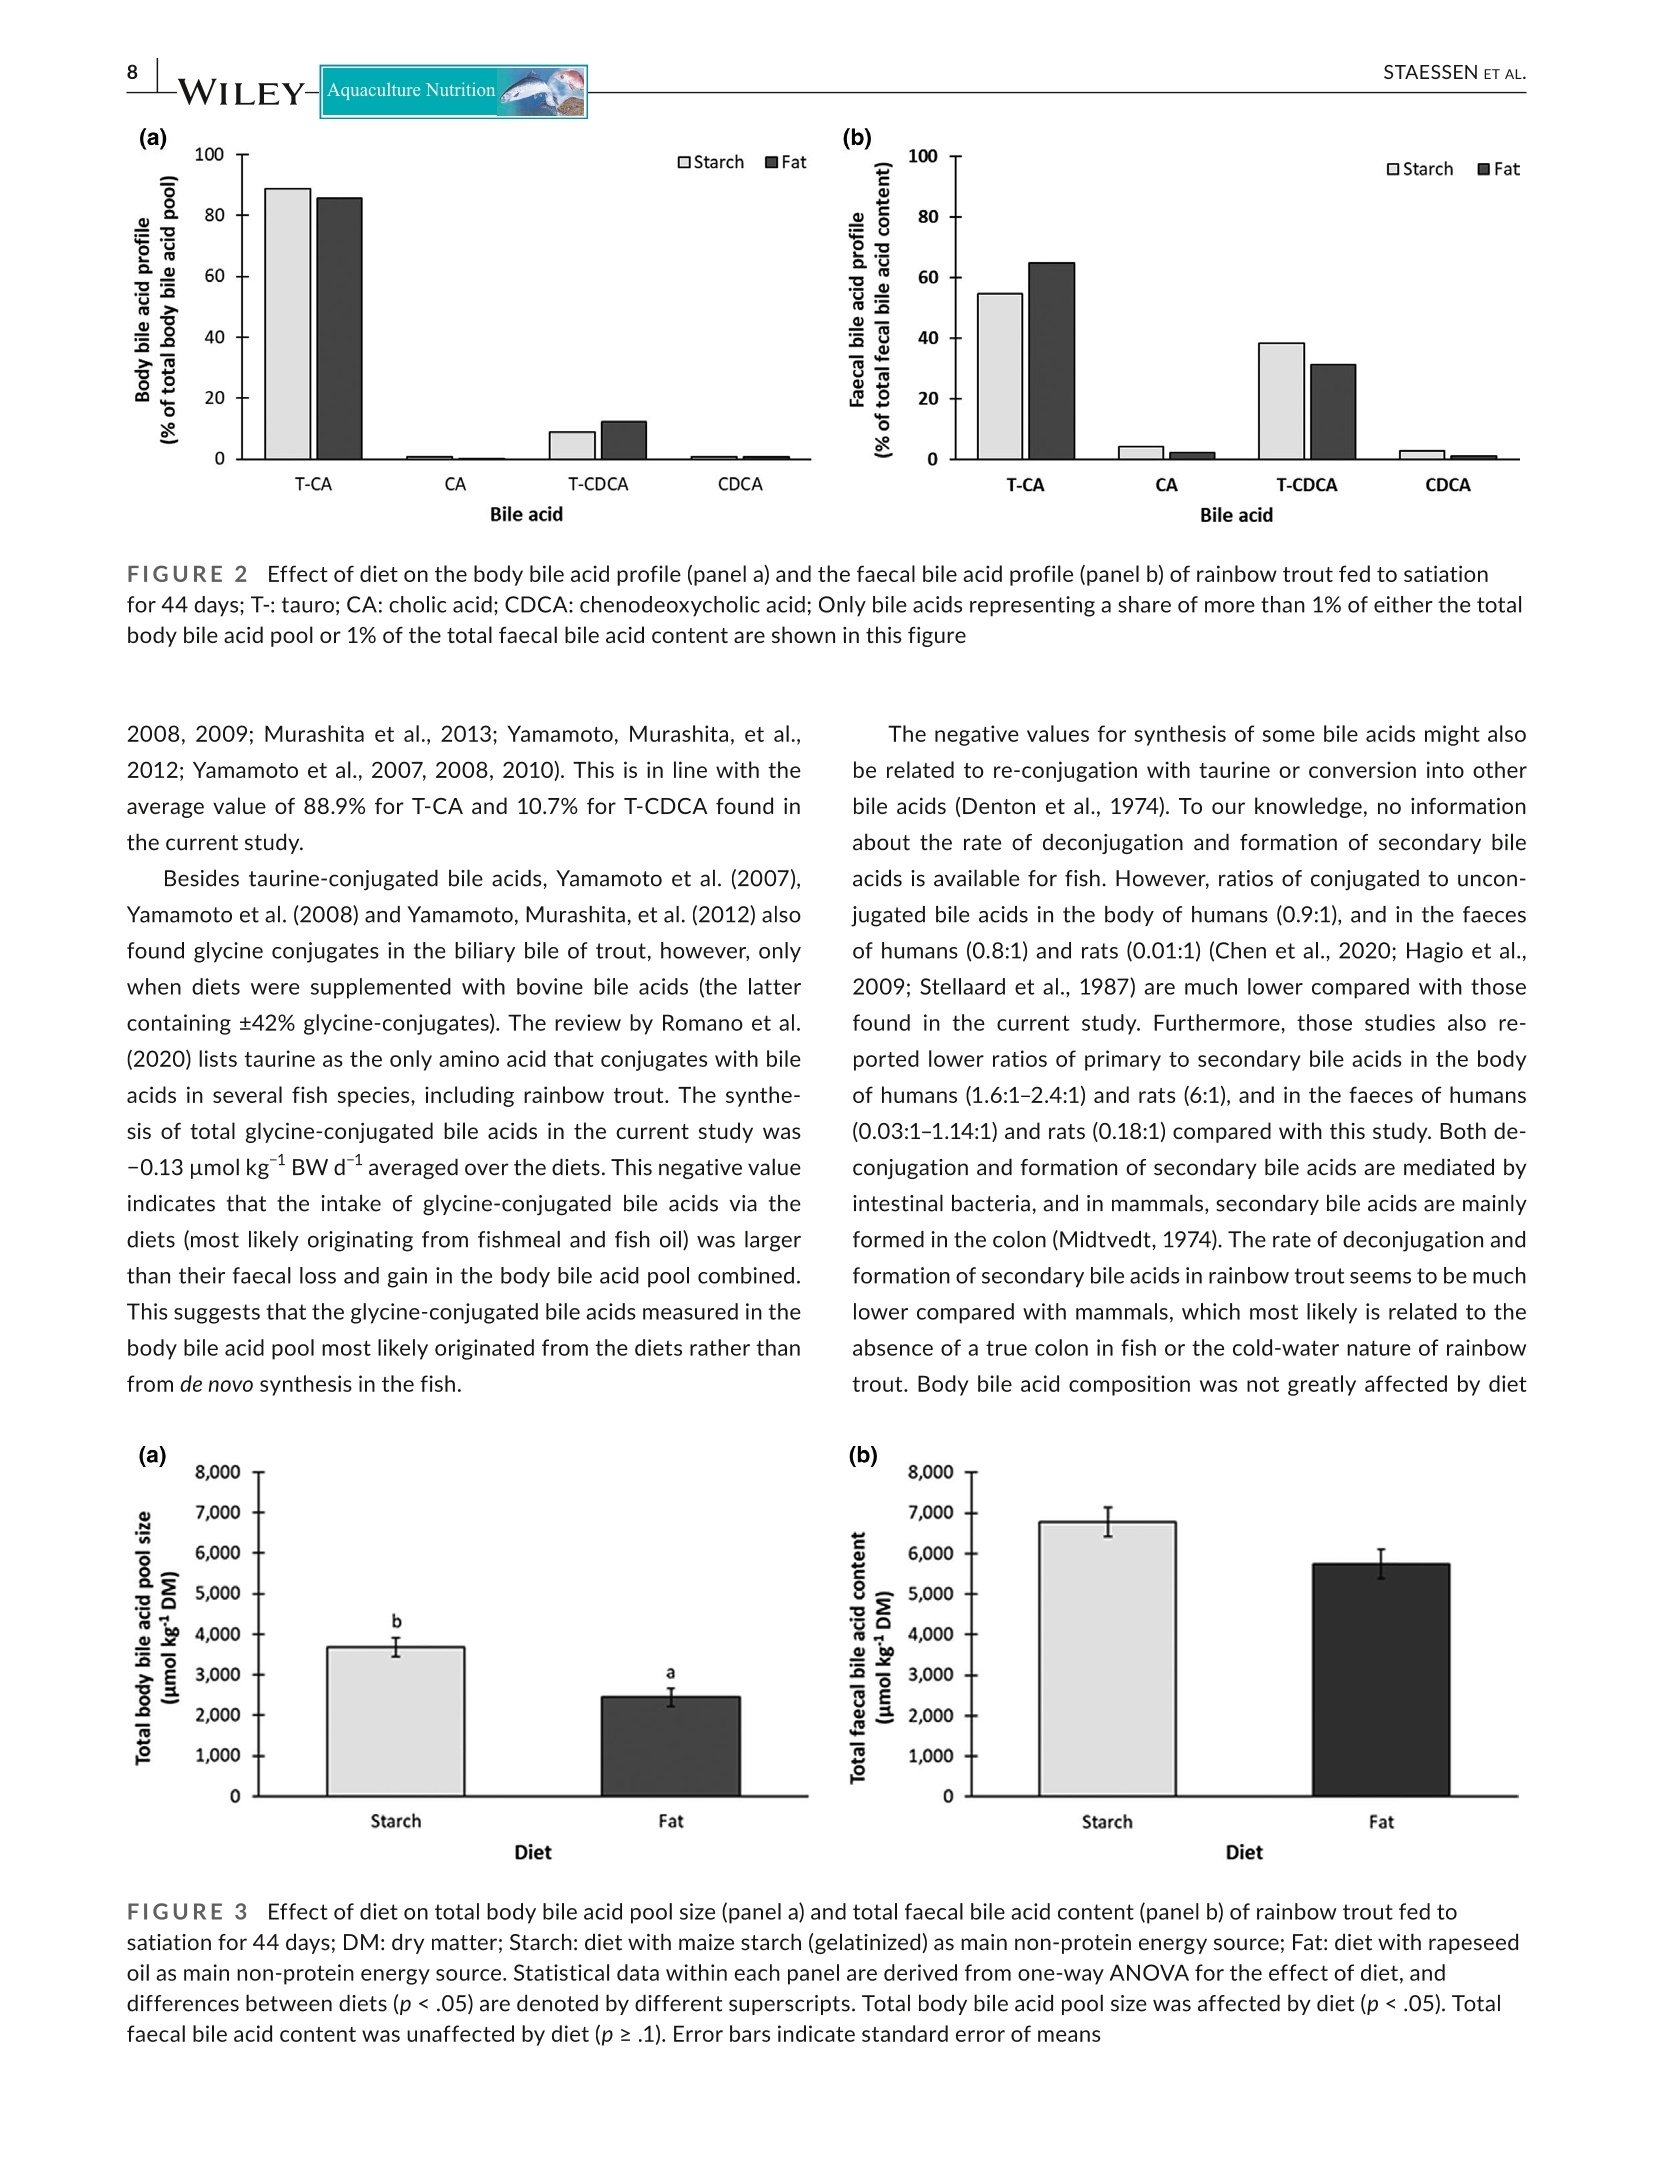
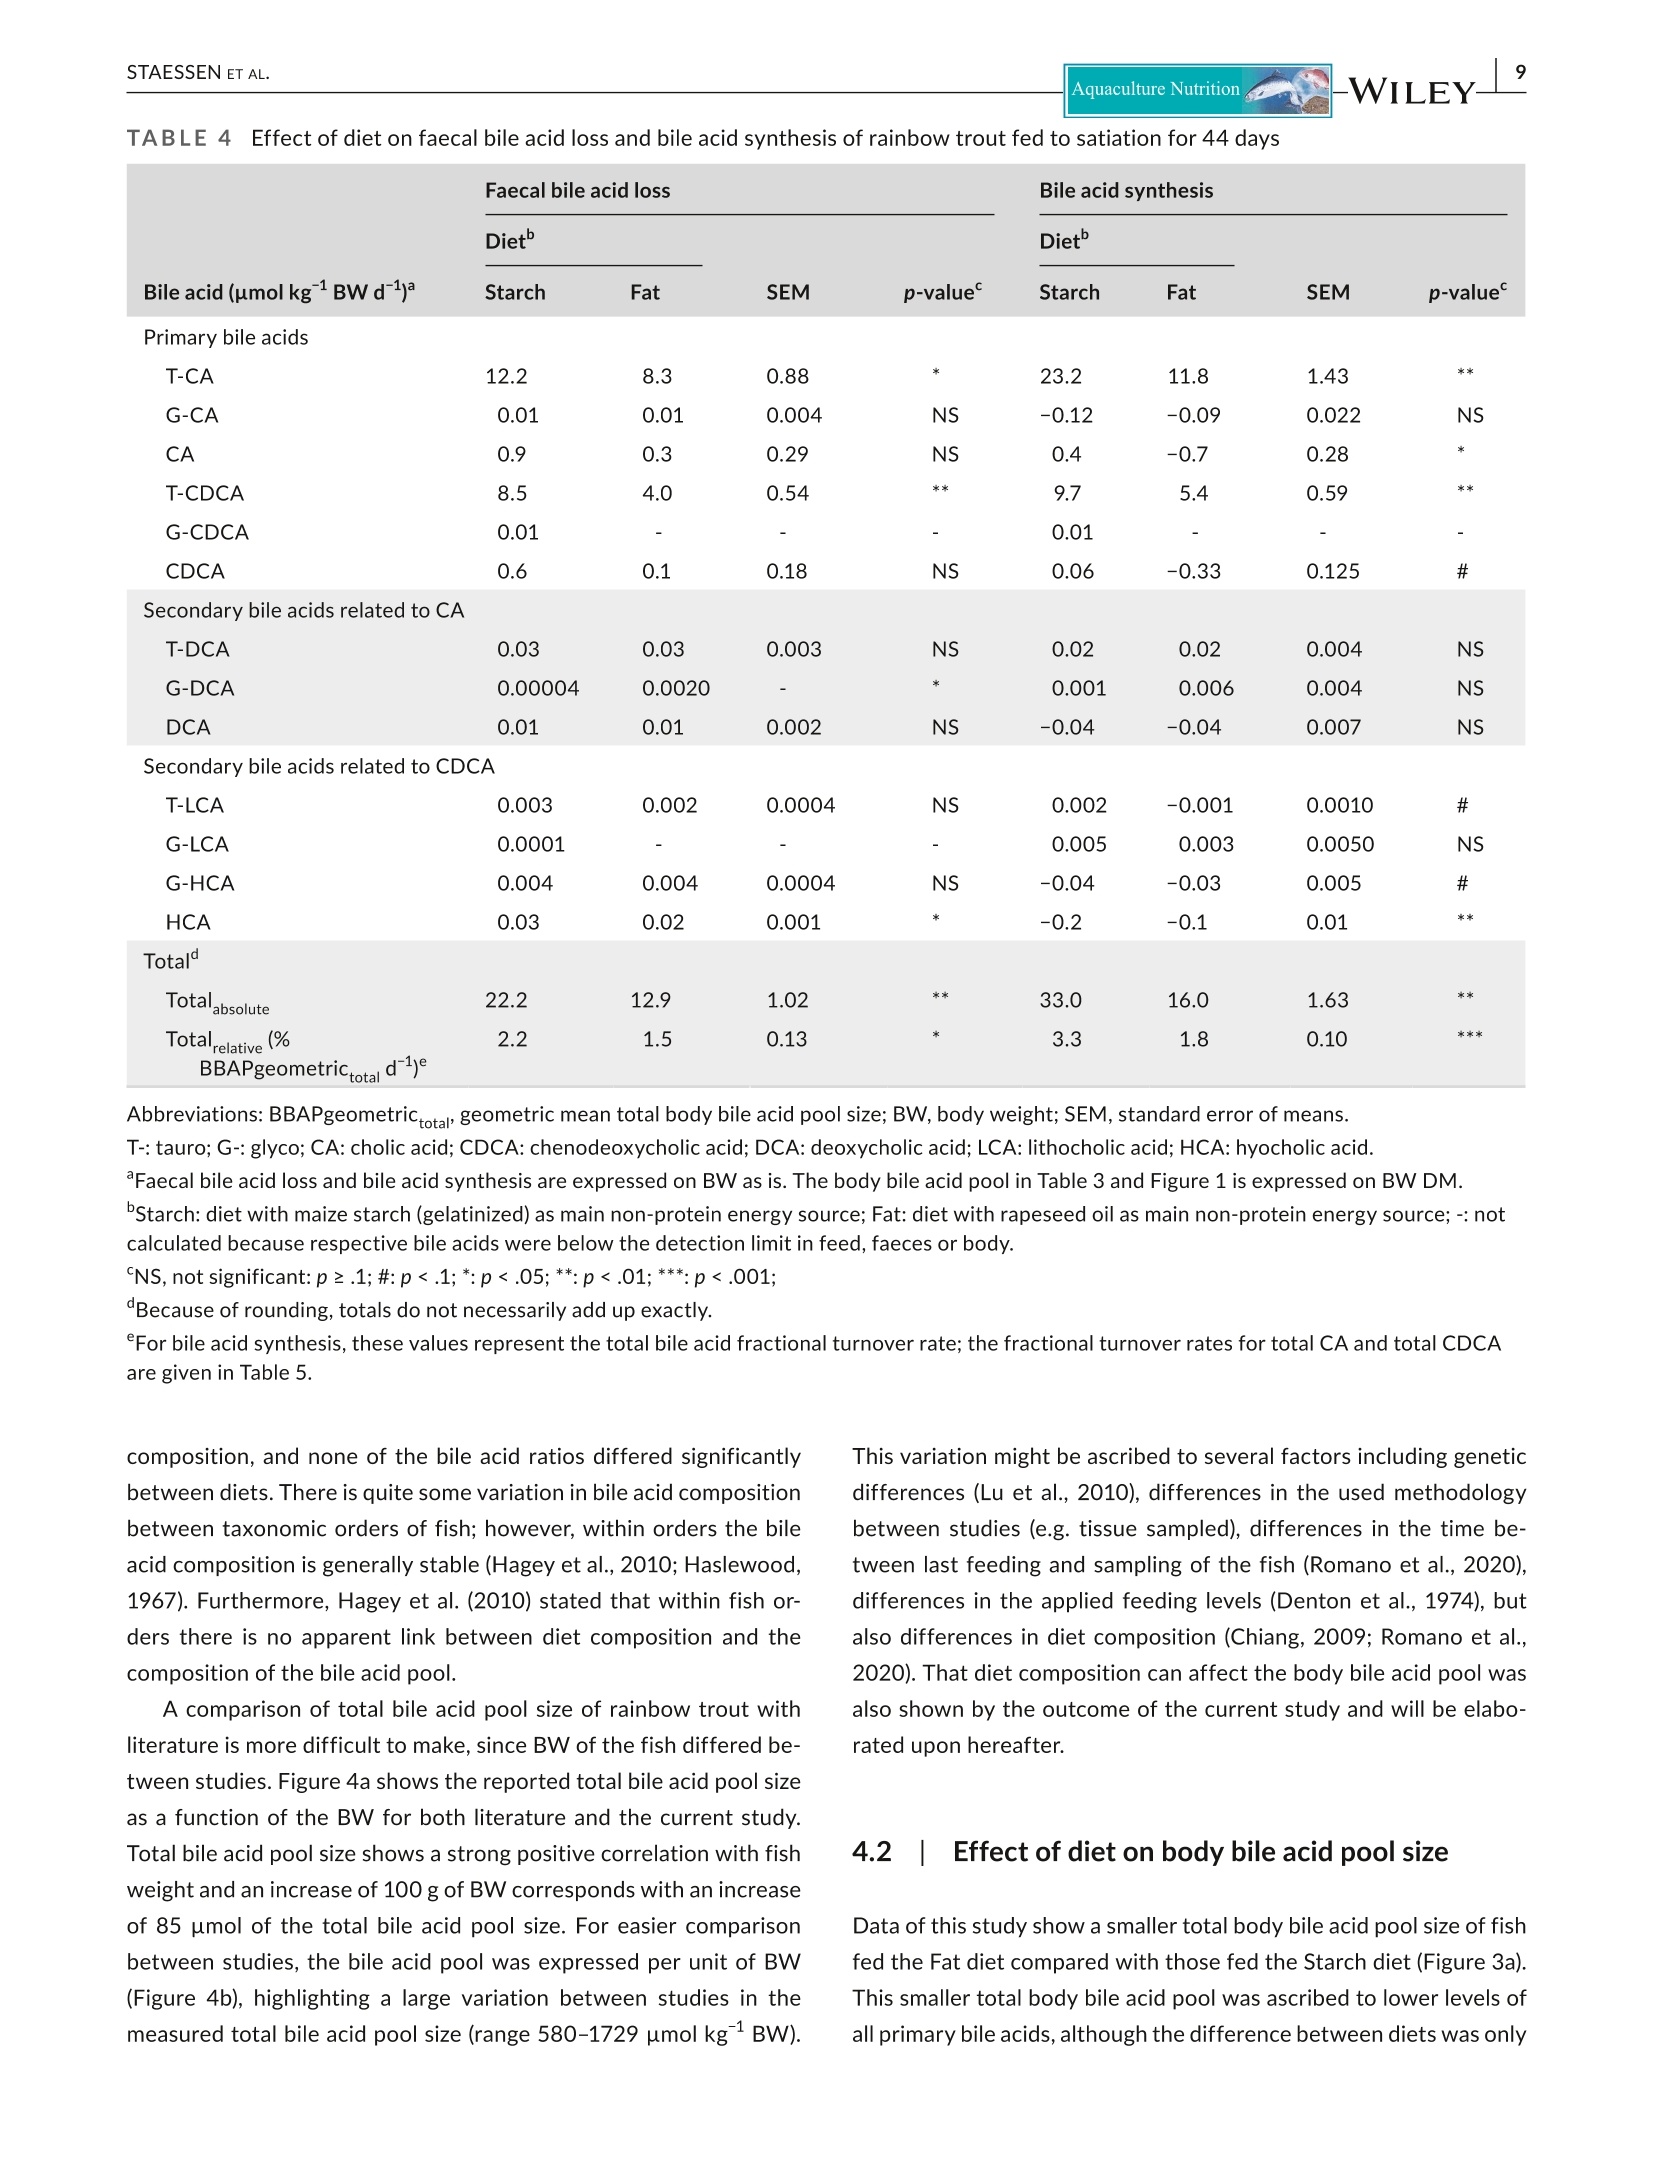
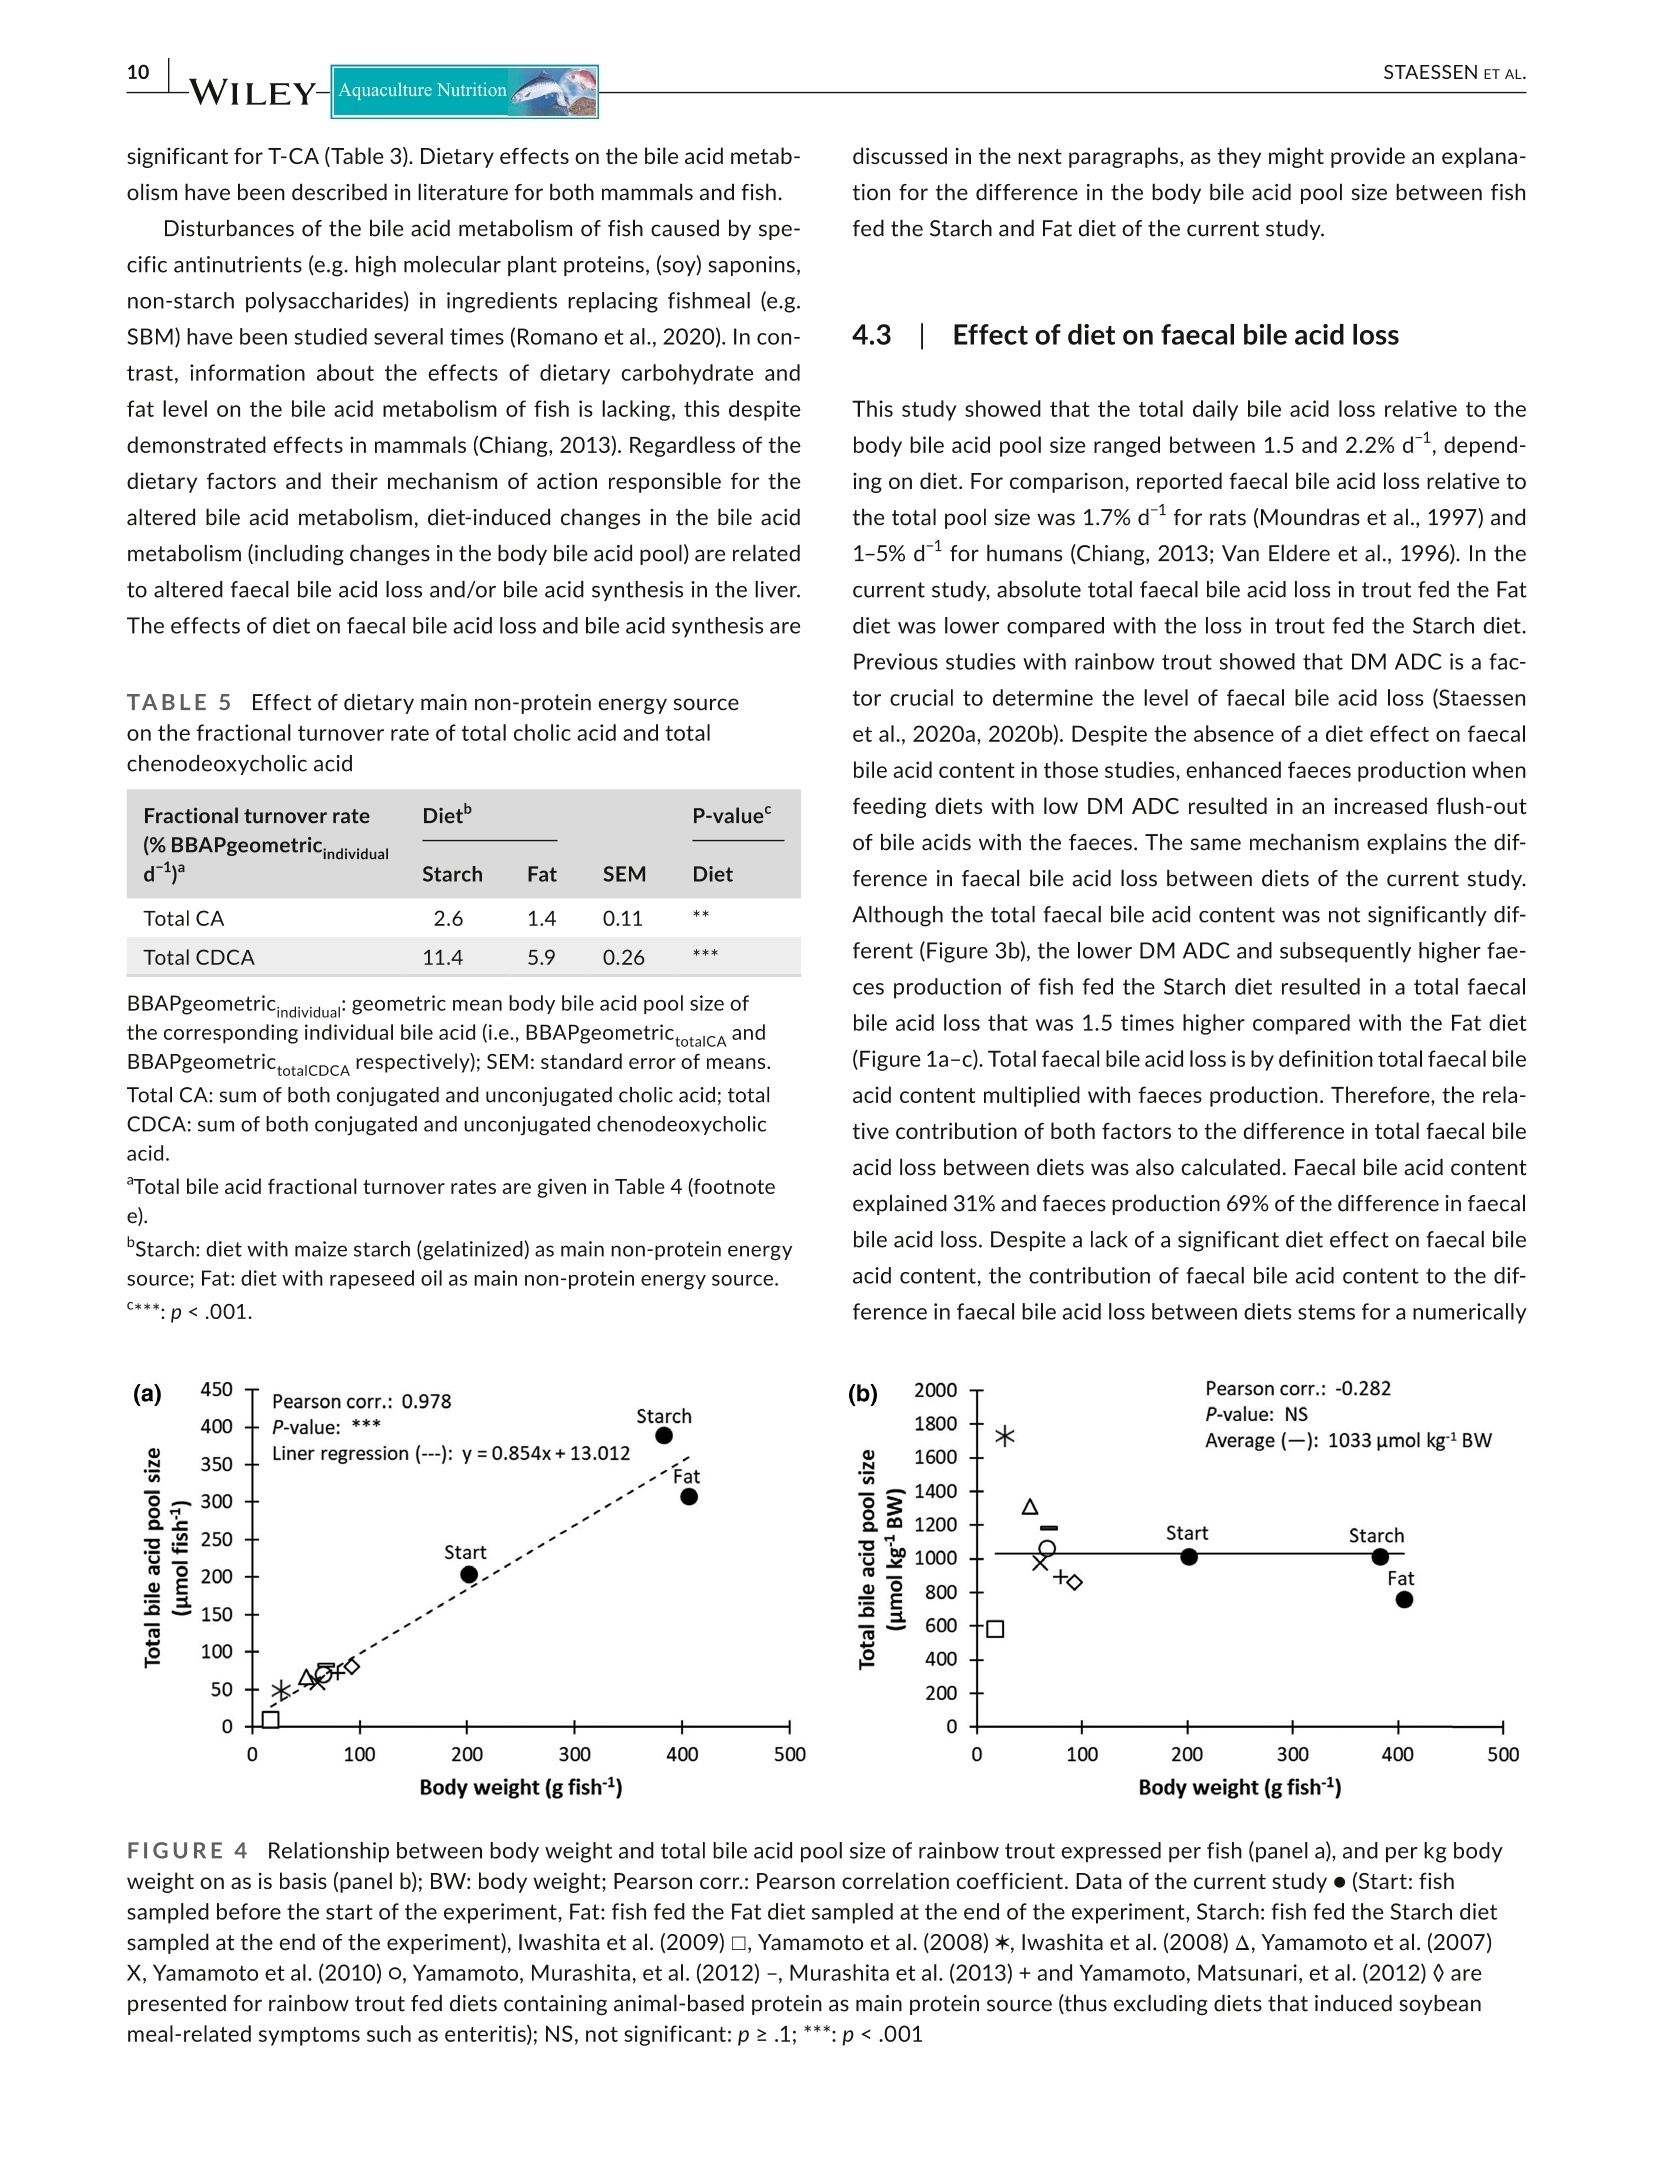
还剩13页未读,是否继续阅读?

产品配置单


中国格哈特为您提供《虹鳟鱼粪便中总脂肪、蛋白质检测方案(抽提萃取)》,该方案主要用于渔业中营养成分检测,参考标准--,《虹鳟鱼粪便中总脂肪、蛋白质检测方案(抽提萃取)》用到的仪器有格哈特全自动超级总脂肪测定系统、格哈特维克松无水低能耗废气涤气系统VS、格哈特凯氏消化系统KT8S、格哈特带自动进样器全自动凯氏定氮仪VAP500C、德国移液器MM
相关方案
更多
该厂商其他方案
更多