


方案详情
文
In the last decade, the EBSD technique has evolved - thanks
to its combination with EDS - from being a tool for texture
quantification to a complete microstructure characterization
method. It is now more systematically used for quantifying
grain size, phase distribution, grain boundary analysis and
phase identification. EBSD analysis has become a standard
analytical tool in Earth Sciences.
方案详情

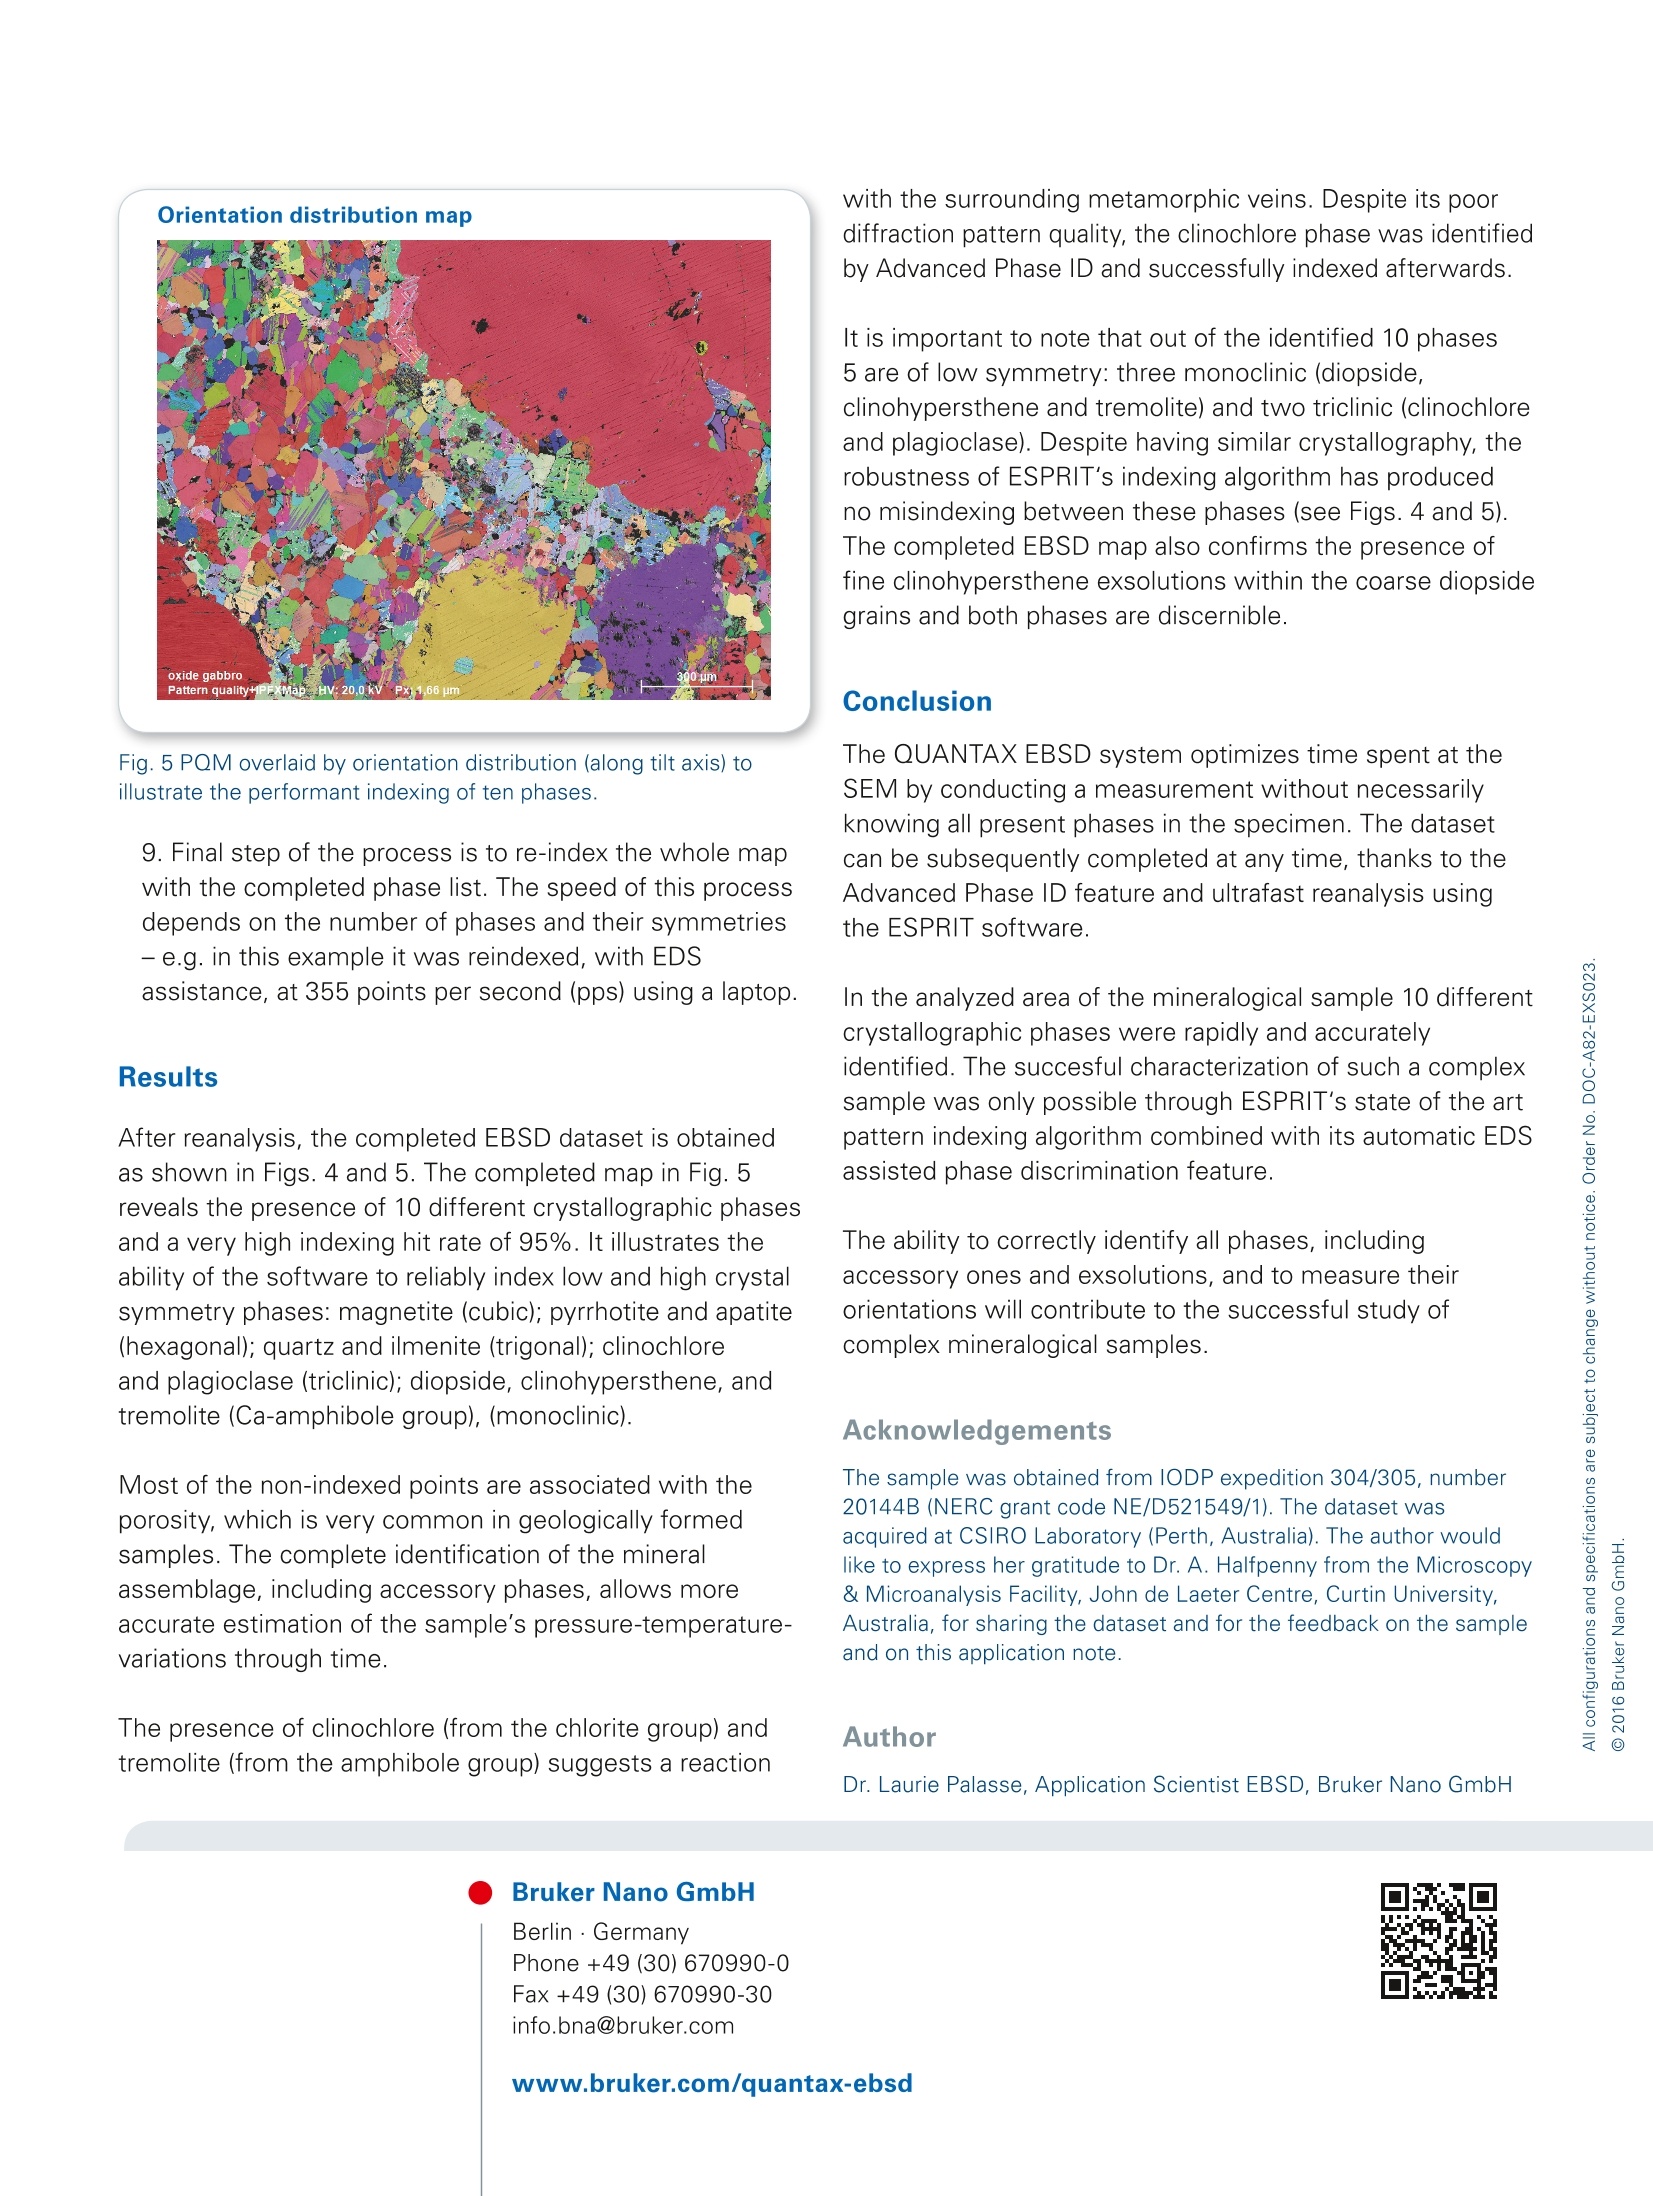
EDS spectrum EBSD Phase Map e Flash Application Note # EBSD-03 Phase identification and distributionon a mineralogical sample In the last decade, the EBSD technique has evolved - thanksto its combination with EDS - from being a tool for texturequantification to a complete microstructure characterizationmethod. It is now more systematically used for quantifyinggrain size, phase distribution, grain boundary analysis andphase identification. EBSD analysis has become a standardanalytical tool in Earth Sciences. Limitations can arise when the specimen containsseveral phases. However, phases with similar chemicalcompositions but different crystallographic structurescan be distinguished by EBSD, whilst EDS discriminatesphases with similar crystallographic structures but ofdifferent chemical compositions. Using a specimen whichcontains both types of phases, it can be demonstrated thatsimultaneous measurement and combined processing ofEDS and EBSD data can overcome these limitations. This application example reveals the benefit of the AdvancedPhase Identification (ID) feature of the Bruker ESPRIT softwarefor the characterization of a complex mineralogical sample. Notonly does Advanced Phase ID assist in finding all the phases ina semi-automated procedure, it also improves indexing qualityby determining the best fitting phase out of nearly 500,000entries from the available databases (ICSD - regularly updated,AMCSD, COD,Bruker). Methodology Manual phase identification via optical microscope or SEMis time-consuming,laborious, and the quality of its results isuser-dependent. These pitfalls are avoided with the use ofBruker's Advanced Phase ID. This software feature employs the automated collectionof a chemical spectrum via EDS, as well as correspondingcrystallographic orientation via EBSD for every pointanalyzed. Combining chemical and crystallographicinformation allows accurate phase(s) identification andincreases indexing rate and measurement accuracy whencompared to analysis with manually detected phases. Missed phases can also be identified offline using theAdvanced Phase ID procedure and ultrafast re-indexing,without need of additional time on the SEM. In addition, the robust indexing algorithm of the ESPRITsoftware and the automatic selection of reflectors for eachphase prevent misindexing between the numerous low andhigh crystal symmetries phases, as typically encountered ingeologically formed mineralogical samples. The sample shown in Fig. 1 is a multiphase mineralogicalsample of an oceanic oxide gabbro. It was collected froman Oceanic Core Complex and has been sampled during theIntegrated Ocean Drilling Program Expedition 304/305 fromHole U1309D. Fig. 1 ARGUSTM BSE image of the measured area. It shows the"chemical contrast"in grayscale. The sample 137R-2-40 was extracted from the center of a9 cm wide oxide gabbro intrusion in section U1309D-137R-2located at 679 m depth. The bulk of this core section isamphibole bearing gabbro which exhibits greenschist faciesalteration and serpentinization. The modal mineralogy ofthe thin section consists of 55% feldspar, 25% pyroxene,10% opaques, and 10% alteration phases (talc, tremolite,and chlorite). The ARGUSTM atomic contrast image in Fig. 1 reveals thecomplexity of the phase distribution in the sample. Fromthis image the presence of at least four different phases andfine exsolutions can be inferred. The sample is a standard 30 pm mechanically polished thinsection with a final stage using 0.04 pm colloidal silica Measurement conditions A simultaneous EBSD/EDS measurement of the samplewas performed with a Bruker QUANTAX system consisting. of an XFlash@ detector with 30 mm2 active area and ane-Flash HR+EBSD detector. mAcceleration voltage: 20 kV Probe current: ~7 nA Exposure time: 12 ms Reanalysis speed: 280 pps (8:04 min) Total map size: 1658 x 1244 pm2 EBSP resolution: 160 x120 pixels mHit rate: 94.3% Average grain size: 41 pm Online Advanced Phase ID Prior to running the automated combined EBSD/EDSmeasurement, one phase was identified by the followingprocedure: 1. Acquisition of an EDS spectrum and a diffractionpattern (EBSP) at the same position (Fig.2). 2. The databases were searched for candidate phasesbased on the major elements in the EDS spectrum(containing Fe and O). In this analysis it results in 384possible phases. Phase identification 3. Automatic (or interactive) band detection of the EBSP(Fig. 2c). 4. Subsequent automated software analysis is performedwithin five seconds to index the EBSP with the 384candidate phases. Solutions are classified based on thequality of fit. 5. The best fitting phase file (magnetite) is added to thephase list. Offline Advanced Phase ID After measurement, both EDS and EBSD datasets areautomatically saved in one file. It is not necessary tosave diffraction patterns since Kikuchi band positionsare automatically saved and generally provide sufficientinformation. Using the ESPRIT software, the EDS information isextracted from the combined EBSD/EDS data into theHyperMap shown in Fig. 3.HyperMap is Bruker's dataformat used to illustrate the chemical distribution of the areausing the full EDS spectrum at every pixel. The HyperMapis quantified for later EDS assisted indexing in order todistinguish phases of similar crystallography. The identification of the remaining phases was performedoffline in a similar manner as online. Either Kikuchi bandpositions or diffraction patterns can be used. The offlineprocedure is described in steps 6-9. Fig. 3 EDS HyperMap showing the chemical distribution in themeasured area. Note that the exsolution within the large grains iscalcium deprived. 6. Using the Spot Mode feature, a point on the map isselected where no phase has been determined. Thecorresponding EDS and EBSD data are automaticallydisplayed. 7. Carrying out Advanced Phase ID. The best fittingsolution is added to the map phase list followed byultrafast re-indexing. 8. Steps 6 and 7 must be repeated until all phases havebeen identified. Fig. 4 PQM and unprocessed EBSD phase map revealing the completed phase distribution after Advanced Phase ID and re-indexing. Thenon-indexed points are displayed in black. The re-indexing procedure was combined with automatic EDS assisted phase discrimination inorder to distinguish the fine clinohypersthene exsolutions within the coarse diopside grains. Fig.5 PQM overlaid by orientation distribution (along tilt axis) toillustrate the performant indexing of ten phases. 9. Final step of the process is to re-index the whole mapwith the completed phase list. The speed of this processdepends on the number of phases and their symmetries- e.g. in this example it was reindexed, with EDSassistance, at 355 points per second (pps) using a laptop. Results After reanalysis, the completed EBSD dataset is obtainedas shown in Figs. 4 and 5. The completed map in Fig. 5reveals the presence of 10 different crystallographic phasesand a very high indexing hit rate of 95%. It illustrates theability of the software to reliably index low and high crystalsymmetry phases: magnetite (cubic); pyrrhotite and apatite(hexagonal); quartz and ilmenite (trigonal); clinochloreand plagioclase (triclinic); diopside, clinohypersthene, andtremolite (Ca-amphibole group), (monoclinic). Most of the non-indexed points are associated with theporosity, which is very common in geologically formedsamples. The complete identification of the mineralassemblage, including accessory phases, allows moreaccurate estimation of the sample’s pressure-temperature-variations through time. The presence of clinochlore (from the chlorite group) andtremolite (from the amphibole group) suggests a reaction with the surrounding metamorphic veins. Despite its poordiffraction pattern quality, the clinochlore phase was identifiedby Advanced Phase ID and successfully indexed afterwards. It is important to note that out of the identified 10 phases5 are of low symmetry: three monoclinic (diopside,clinohypersthene and tremolite) and two triclinic (clinochloreand plagioclase). Despite having similar crystallography, therobustness of ESPRIT's indexing algorithm has producedno misindexing between these phases (see Figs. 4 and 5).The completed EBSD map also confirms the presence offine clinohypersthene exsolutions within the coarse diopsidegrains and both phases are discernible. Conclusion The QUANTAX EBSD system optimizes time spent at theSEM by conducting a measurement without necessarilyknowing all present phases in the specimen. The datasetcan be subsequently completed at any time, thanks to theAdvanced Phase ID feature and ultrafast reanalysis usingthe ESPRIT software. In the analyzed area of the mineralogical sample 10 differentcrystallographic phases were rapidly and accuratelyidentified. The succesful characterization of such a complexsample was only possible through ESPRIT's state of the artpattern indexing algorithm combined with its automatic EDSassisted phase discrimination feature. The ability to correctly identify all phases, includingaccessory ones and exsolutions, and to measure theirorientations will contribute to the successful study ofcomplex mineralogical samples. Acknowledgements The sample was obtained from IODP expedition 304/305, number20144B (NERC grant code NE/D521549/1). The dataset wasacquired at CSIRO Laboratory (Perth, Australia). The author wouldlike to express her gratitude to Dr. A. Halfpenny from the Microscopy& Microanalysis Facility, John de Laeter Centre, Curtin University,Australia, for sharing the dataset and for the feedback on the sampleand on this application note. Author Bruker Nano GmbH Berlin·Germany Phone +49(30) 670990-0Fax +49 (30)670990-30info.bna@bruker.com The QUANTAX EBSD system optimizes time spent at theSEM by conducting a measurement without necessarilyknowing all present phases in the specimen. The datasetcan be subsequently completed at any time, thanks to theAdvanced Phase ID feature and ultrafast reanalysis usingthe ESPRIT software.In the analyzed area of the mineralogical sample 10 differentcrystallographic phases were rapidly and accuratelyidentified. The succesful characterization of such a complexsample was only possible through ESPRIT‘s state of the artpattern indexing algorithm combined with its automatic EDSassisted phase discrimination feature.The ability to correctly identify all phases, includingaccessory ones and exsolutions, and to measure theirorientations will contribute to the successful study ofcomplex mineralogical samples.
确定


还剩2页未读,是否继续阅读?

产品配置单

布鲁克电子显微纳米分析仪器部为您提供《矿物质中元素含量检测方案(EBSD系统)》,该方案主要用于非金属矿产中痕量元素检测,参考标准--,《矿物质中元素含量检测方案(EBSD系统)》用到的仪器有布鲁克 电子背散射衍射仪 EBSD、布鲁克 电子背散射衍射仪 EBSD、布鲁克 ESPRIT 四合一分析软件、布鲁克 QUANTAX EDS 能谱仪(TEM)、布鲁克 , EDS, 能谱仪, SEM, TEM
相关方案
更多