


方案详情
文
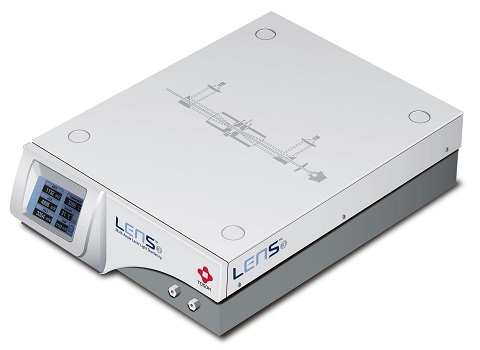
本应用中使用粒径2 um的TSKgel UP-SW2000尺寸排阻色谱柱并配合Tosoh Bioscience的超高灵敏度光散射检测器LenS3使用,可对重组蛋白的绝对分子量及其聚集水平进行精确测量和表征。
方案详情

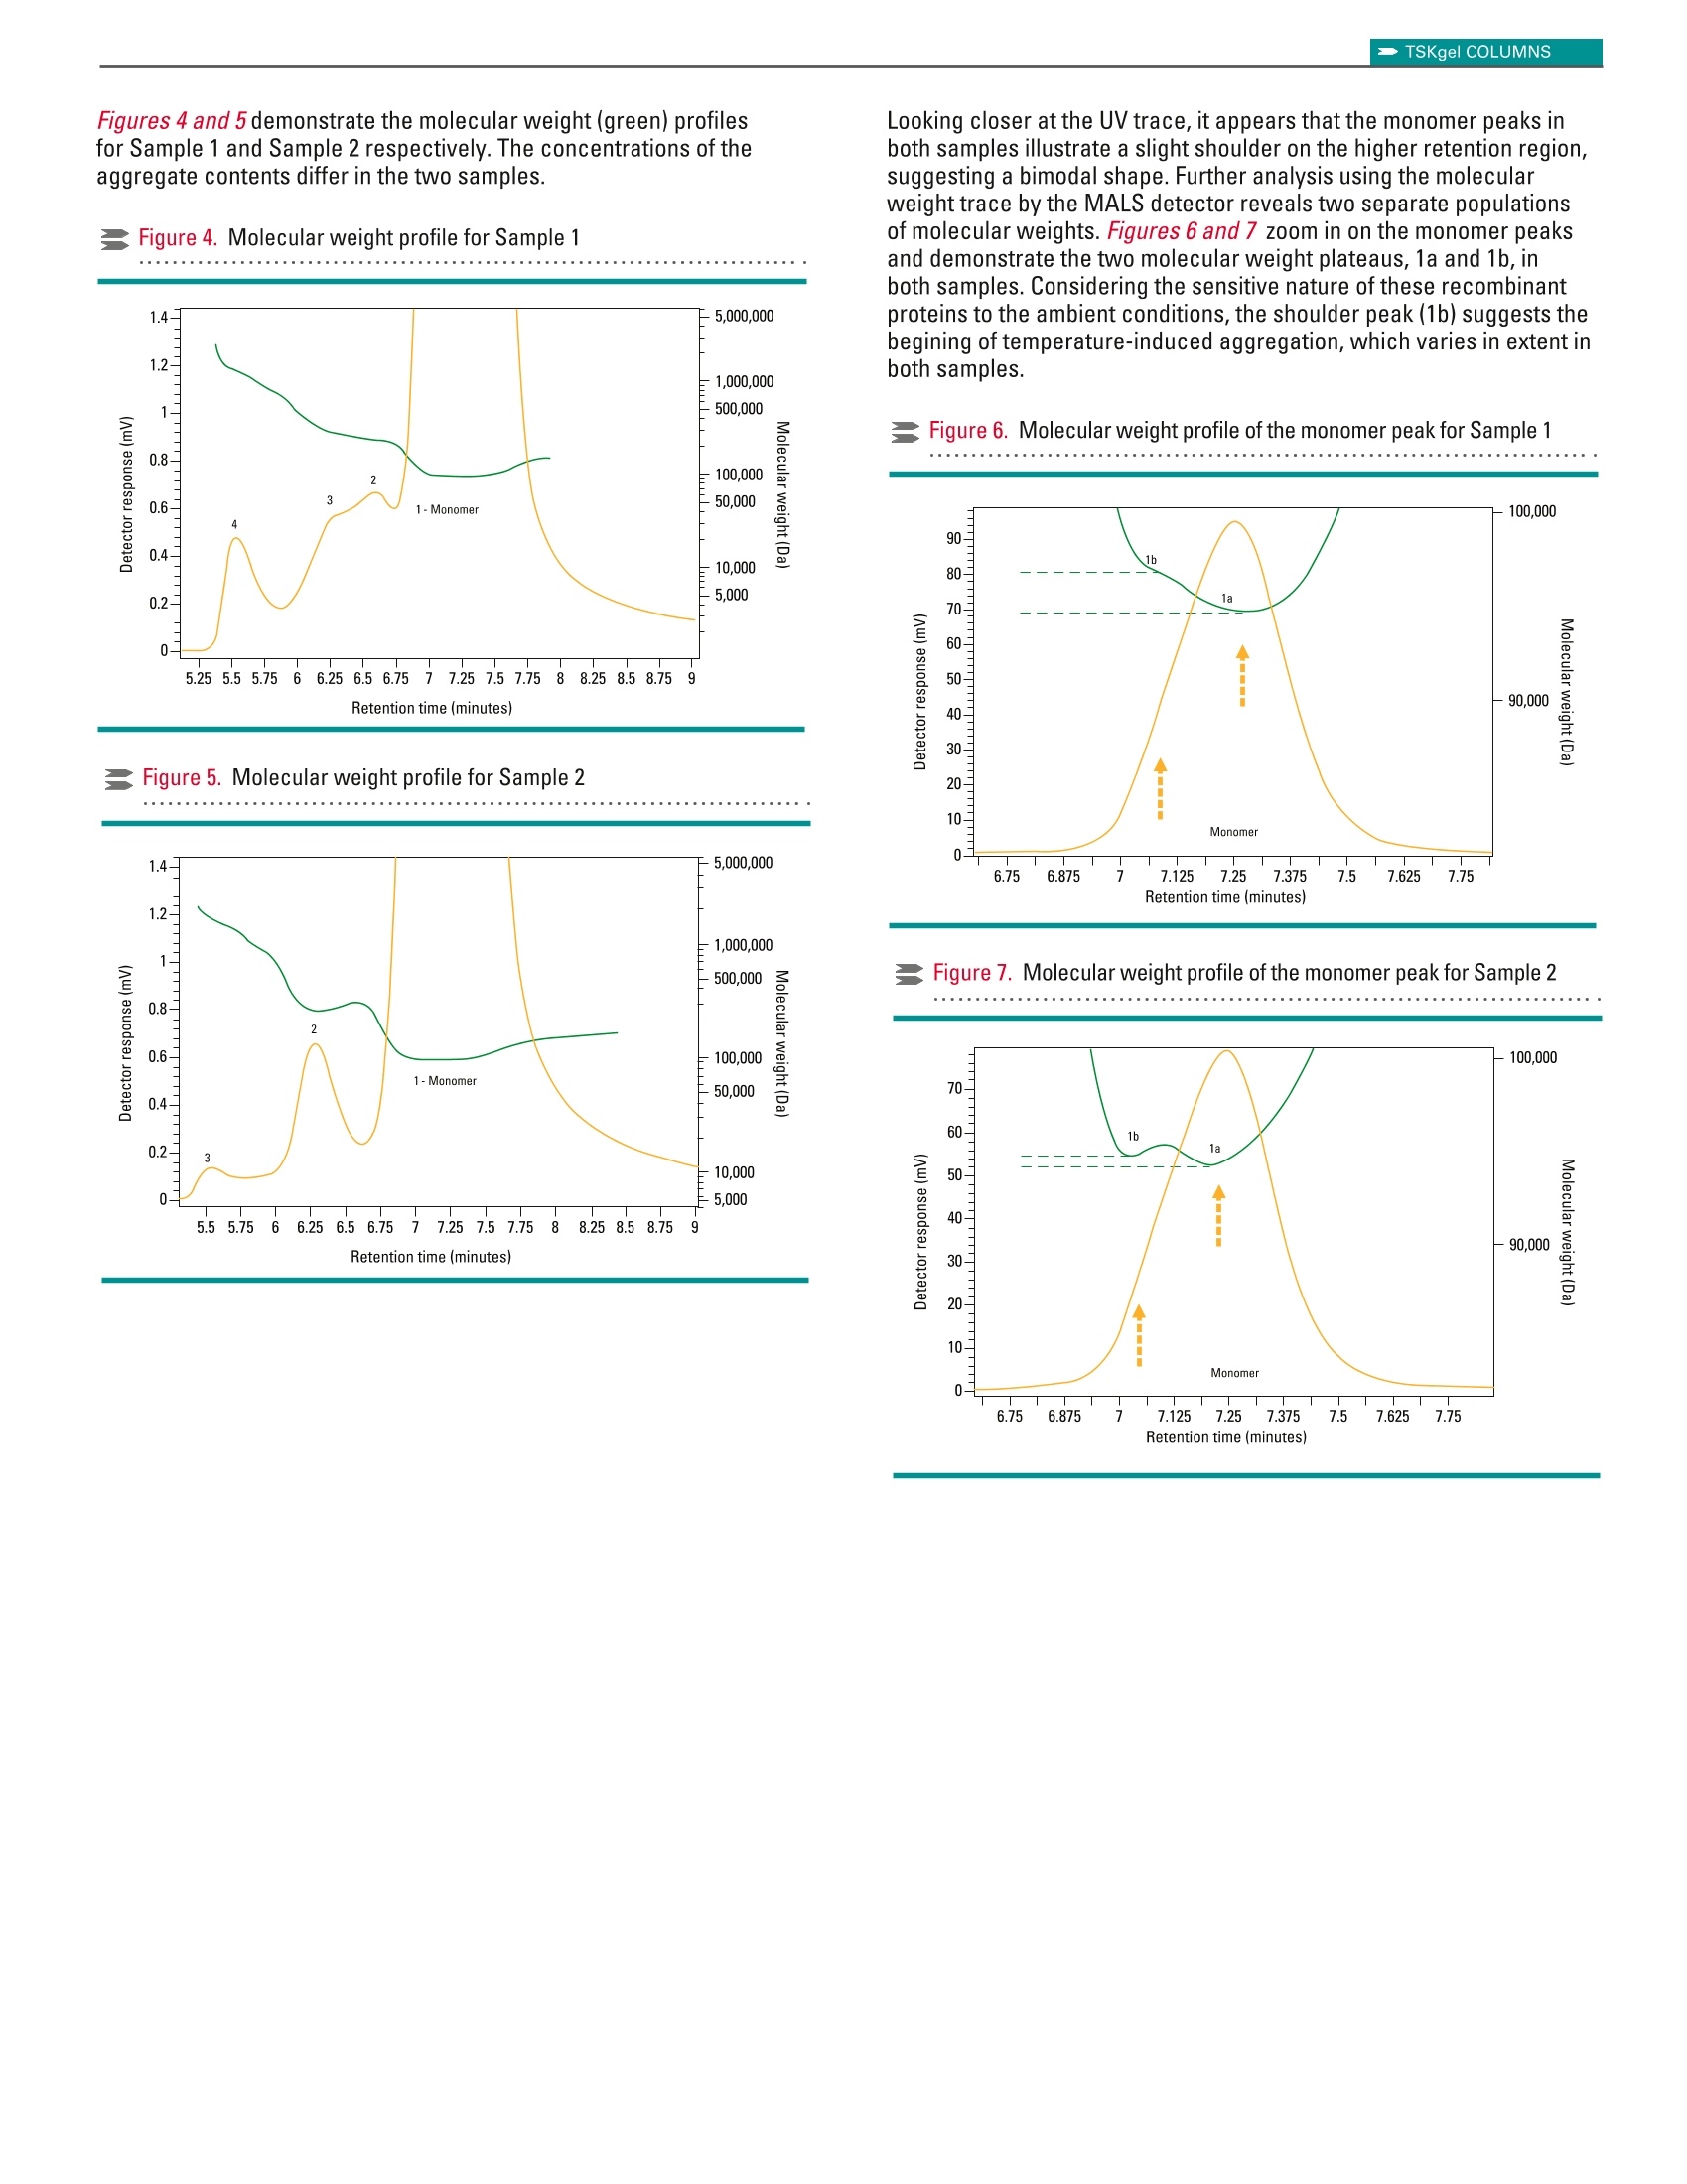
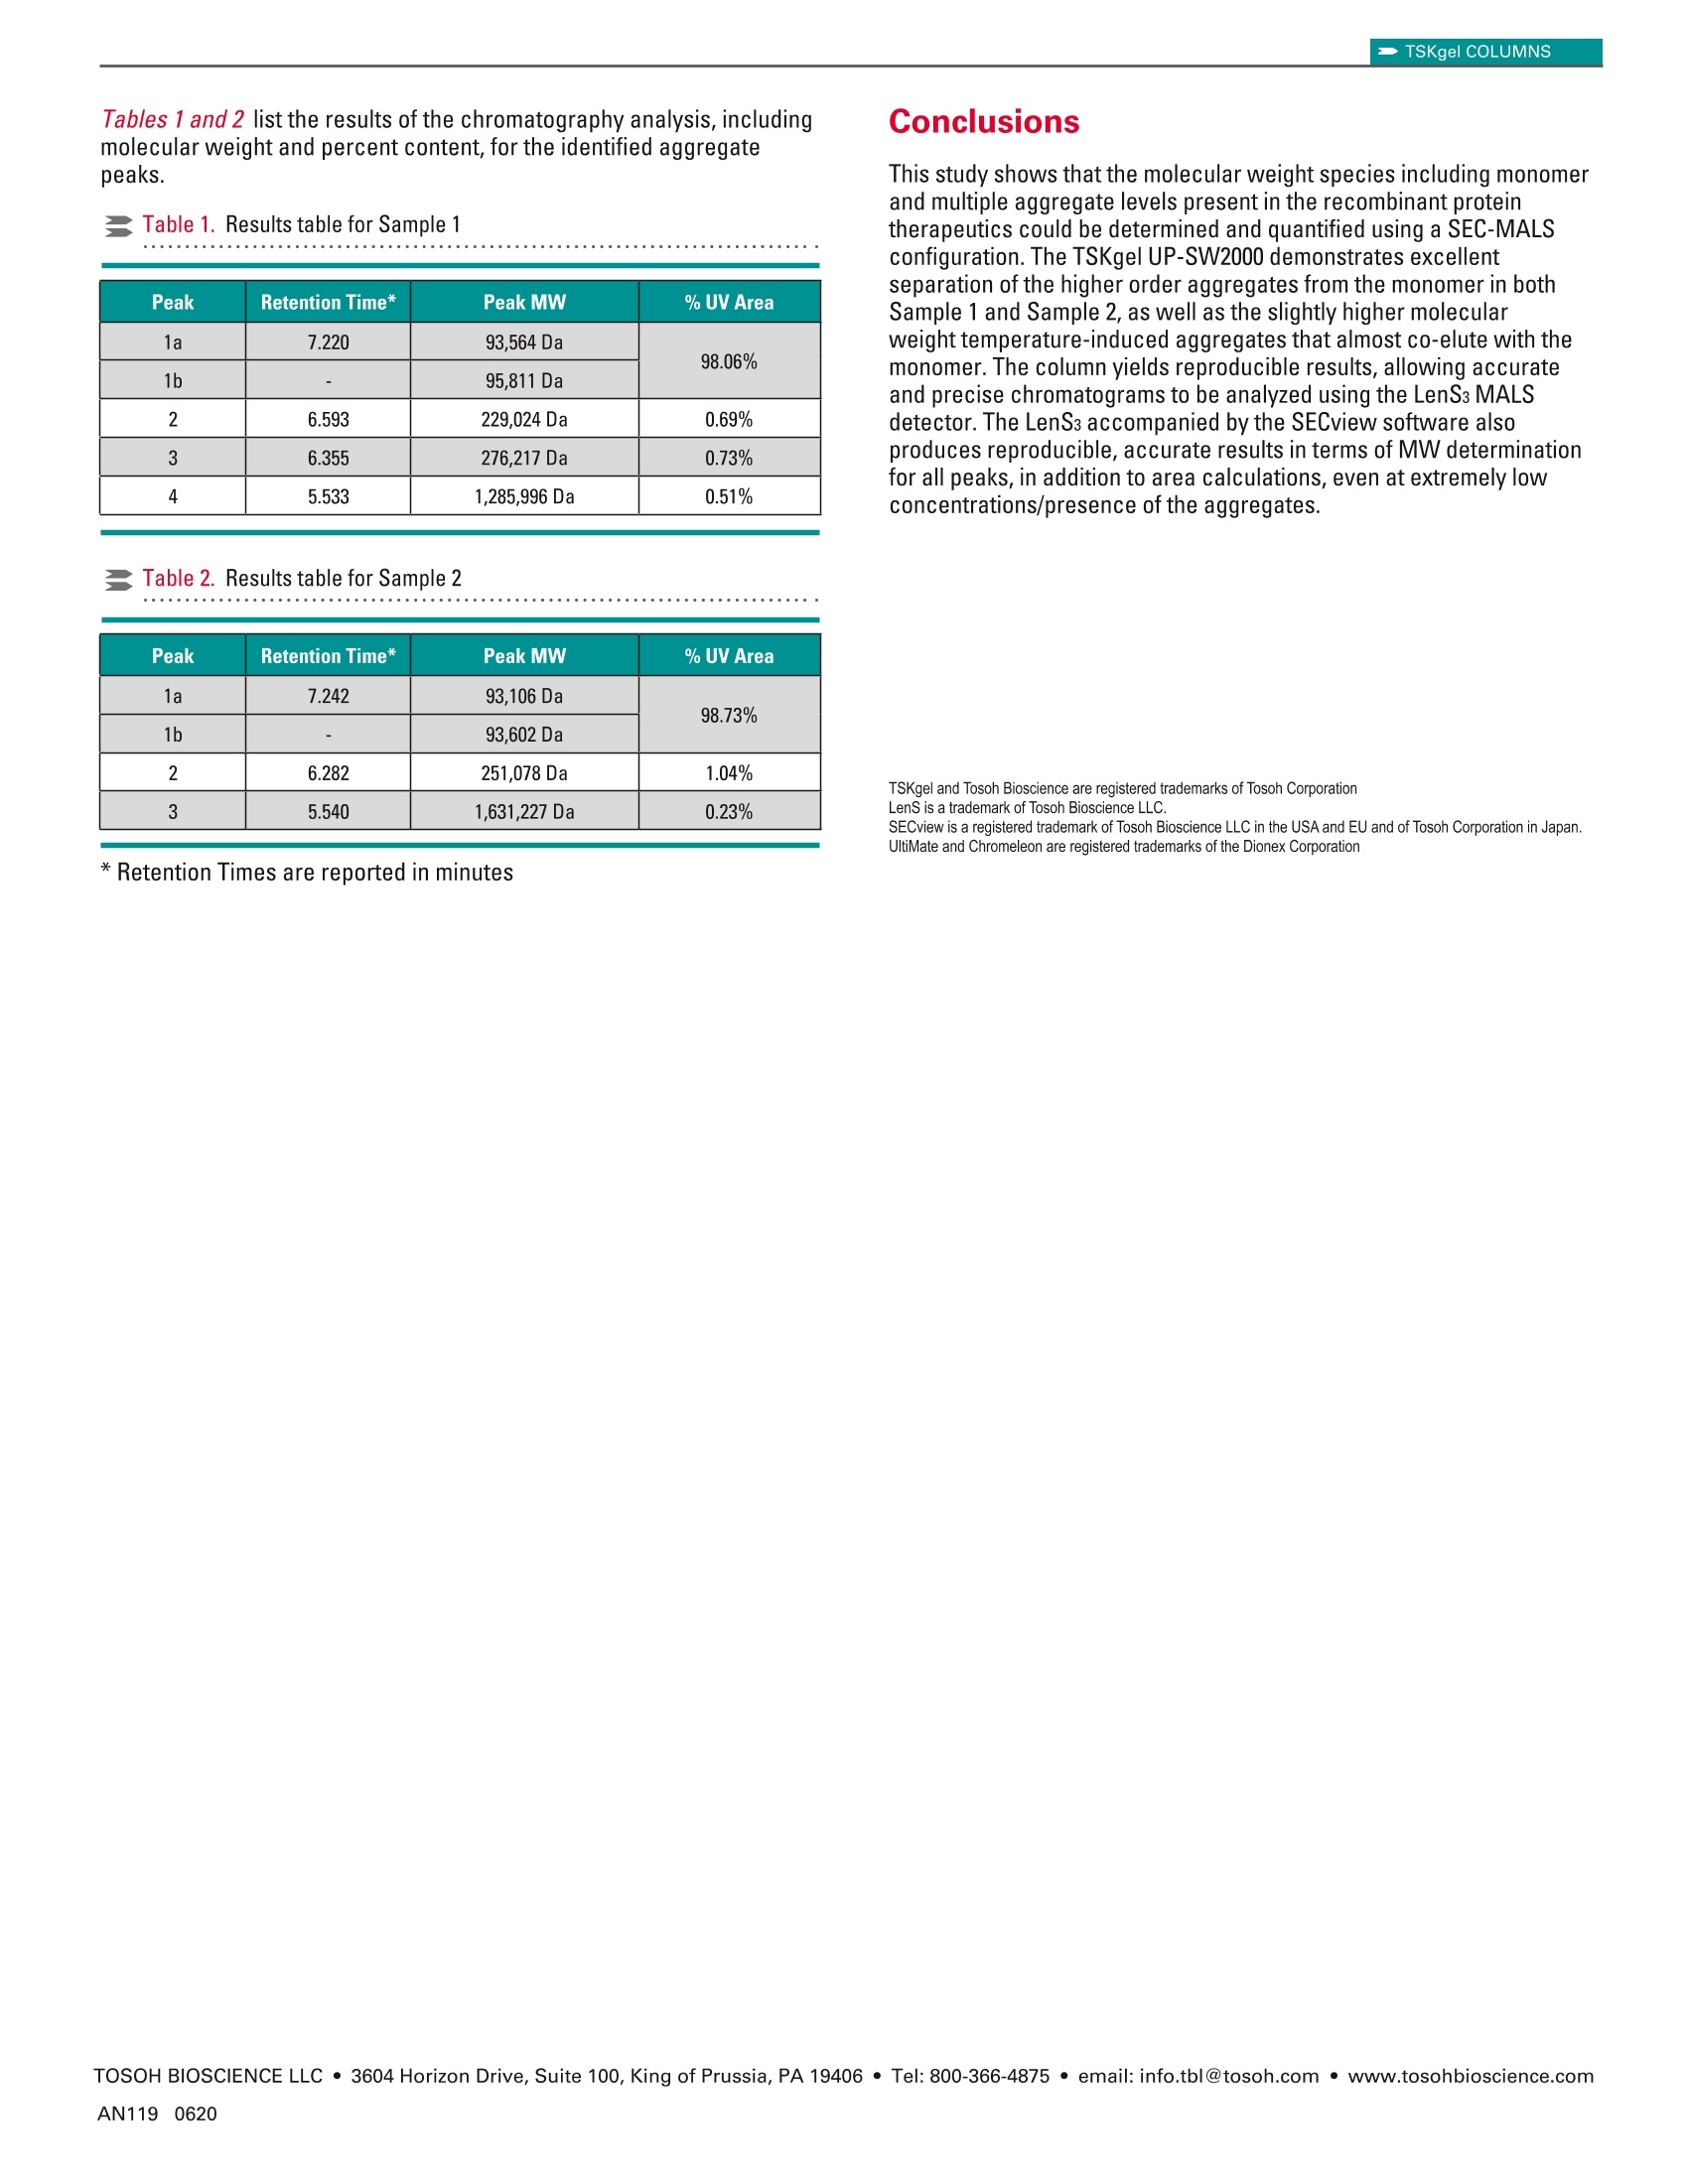
TSKgel COLUMNSApplication Note TSKgel COLUMNS TOSOH BIOSCIENCE LLC ·3604 Horizon Drive, Suite 100, King of Prussia, PA 19406·Tel: 800-366-4875 · email: info.tbl@tosoh.com·www.tosohbioscience.comAN119 0620 Characterization of Recombinant Protein Biotherapeutic usingTSKgelUP-SW2000 Size Exclusion Chromatography ColumnIn-Line with LenS3TMMALS Detector Introduction Biotherapeutics are generally larger molecules such as peptides,proteins and monoclonal antibodies with monomer molecular weightranging from 3,000-150,000 Da. The drug must remain free fromimpurities such as fragment,dimer and other higher order aggregatesas they may cause severe immunogenic response. This becomes evenmore important particularly if the biotherapeutic protein is thermallysusceptible. Historically, size exclusion is the preferred mode ofchromatography used for separation and characterization of suchapplications. Here we report the online detection of absolute molecularweight of two recombinant protein samples using a 2 pm size exclusionchromatography(SEC) column directly connected to the LenS3Multi-Angle Light Scattering (MALS) detector. Materials and Methods Samples: BSA (Calibration standard)Sample 1 -Recombinant Proteins (~90 kDa)at 1.72 mg/mL in mobile phaseSample 2-Recombinant Proteins (~90 kDa)at 3.64 mg/mL in mobile phase The samples were stored at-20C and thawed to 8°C just beforeanalysis. The concentration was adjusted by diluting the sample inmobile phase pre-chilled at 8°C. Chromatographic Conditions Results and Discussion The multi-detector setup was calibrated using a freshly preparedbovine serum albumin (BSA) solution. Figure 1 shows the overlay traceof UV and MALS detectors. The one-step calibration procedure in theSECviewTM software adjusted the dead volume between the detectorsand corrected for the band-broadening effect caused by the in-seriesdetector configuration while determining the detectors'calibrationconstants and offsets. Figure 1. Calibration of the detectors using BSA protein standard Figures 2 and 3 illustrate the UV detector overlays for two consecutiveinjections of Sample 1 and Sample 2 respectively. Zoomed-in figures (inset) show the excellent separation resolution between the monomerand the aggregates obtained from TSKgel UP-SW2000 column. Figure 2. UV detector overlay for Sample 1 -two consecutive injections Figure3. UV detector overlay for Sample 2-two consecutive injections Figures 4 and 5 demonstrate the molecular weight (green) profilesfor Sample 1 and Sample 2 respectively. The concentrations of theaggregate contents differ in the two samples. Figure 4. Molecular weight profile for Sample 1 Figure 5. Molecular weight profile for Sample 2 Looking closer at the UV trace, it appears that the monomer peaks inboth samples illustrate a slight shoulder on the higher retention region,suggesting a bimodal shape.Further analysis using the molecularweight trace by the MALS detector reveals two separate populationsof molecular weights. Figures 6 and 7 zoom in on the monomer peaksand demonstrate the two molecular weight plateaus, 1a and 1b, inboth samples. Considering the sensitive nature of these recombinantproteins to the ambient conditions, the shoulder peak(1b) suggests thebegining of temperature-induced aggregation, which varies in extent inboth samples. Figure 6. Molecular weight profile of the monomer peak for Sample 1 Figure 7. Molecular weight profile of the monomer peak for Sample 2 Tables 1 and 2 list the results of the chromatography analysis, includingmolecular weight and percent content, for the identified aggregatepeaks. Table 1. Results table for Sample 1 Peak Retention Time* Peak MW %UV Area 1a 7.220 93,564 Da 98.06% 1b - 95,811 Da 2 6.593 229,024 Da 0.69% 3 6.355 276,217 Da 0.73% 4 5.533 1,285,996 Da 0.51% Table 2. Results table for Sample 2 Peak Retention Time* Peak MW %UV Area 1a 7.242 93,106 Da 98.73% 1b 一 93,602 Da 2 6.282 251,078 Da 1.04% 3 5.540 1,631,227 Da 0.23% *Retention Times are reported in minutes Conclusions This study shows that the molecular weight species including monomerand multiple aggregate levels present in the recombinant proteintherapeutics could be determined and quantified using a SEC-MALSconfiguration. The TSKgel UP-SW2000 demonstrates excellentseparation of the higher order aggregates from the monomer in bothSample 1 and Sample 2, as well as the slightly higher molecularweight temperature-induced aggregates that almost co-elute with themonomer. The column yields reproducible results, allowing accurateand precise chromatograms to be analyzed using the LenS3 MALSdetector. The LenSs accompanied by the SECview software alsoproduces reproducible, accurate results in terms of MW determinationfor all peaks, in addition to area calculations, even at extremely lowconcentrations/presence of the aggregates. TSKgel and Tosoh Bioscience are registered trademarks of Tosoh Corporation LenS is a trademark of Tosoh Bioscience LLC. SECview is a registered trademark of Tosoh Bioscience LLC in the USA and EU and of Tosoh Corporation in Japan. UltiMate and Chromeleon are registered trademarks of the Dionex Corporation 本应用中使用粒径2 um的TSKgel UP-SW2000尺寸排阻色谱柱并配合Tosoh Bioscience的超高灵敏度光散射检测器LenS3使用,可对重组蛋白的绝对分子量及其聚集水平进行精确测量和表征。
确定
还剩1页未读,是否继续阅读?

产品配置单

东曹(上海)生物科技有限公司为您提供《重组蛋白中分子量检测方案(色谱检测器)》,该方案主要用于生物药品药物研发中分子量检测,参考标准--,《重组蛋白中分子量检测方案(色谱检测器)》用到的仪器有东曹TOSOH多角度光散射检测器(HPLC/UHPLC系统兼容)、TSKgel UP-SW2000 色谱柱
相关方案
更多
该厂商其他方案
更多