


方案详情
文
采用LaVision公司独特的层析PIV测试技术对约束喷射冲击沸腾过程中的蒸汽诱导流动结构进行了研究。
方案详情

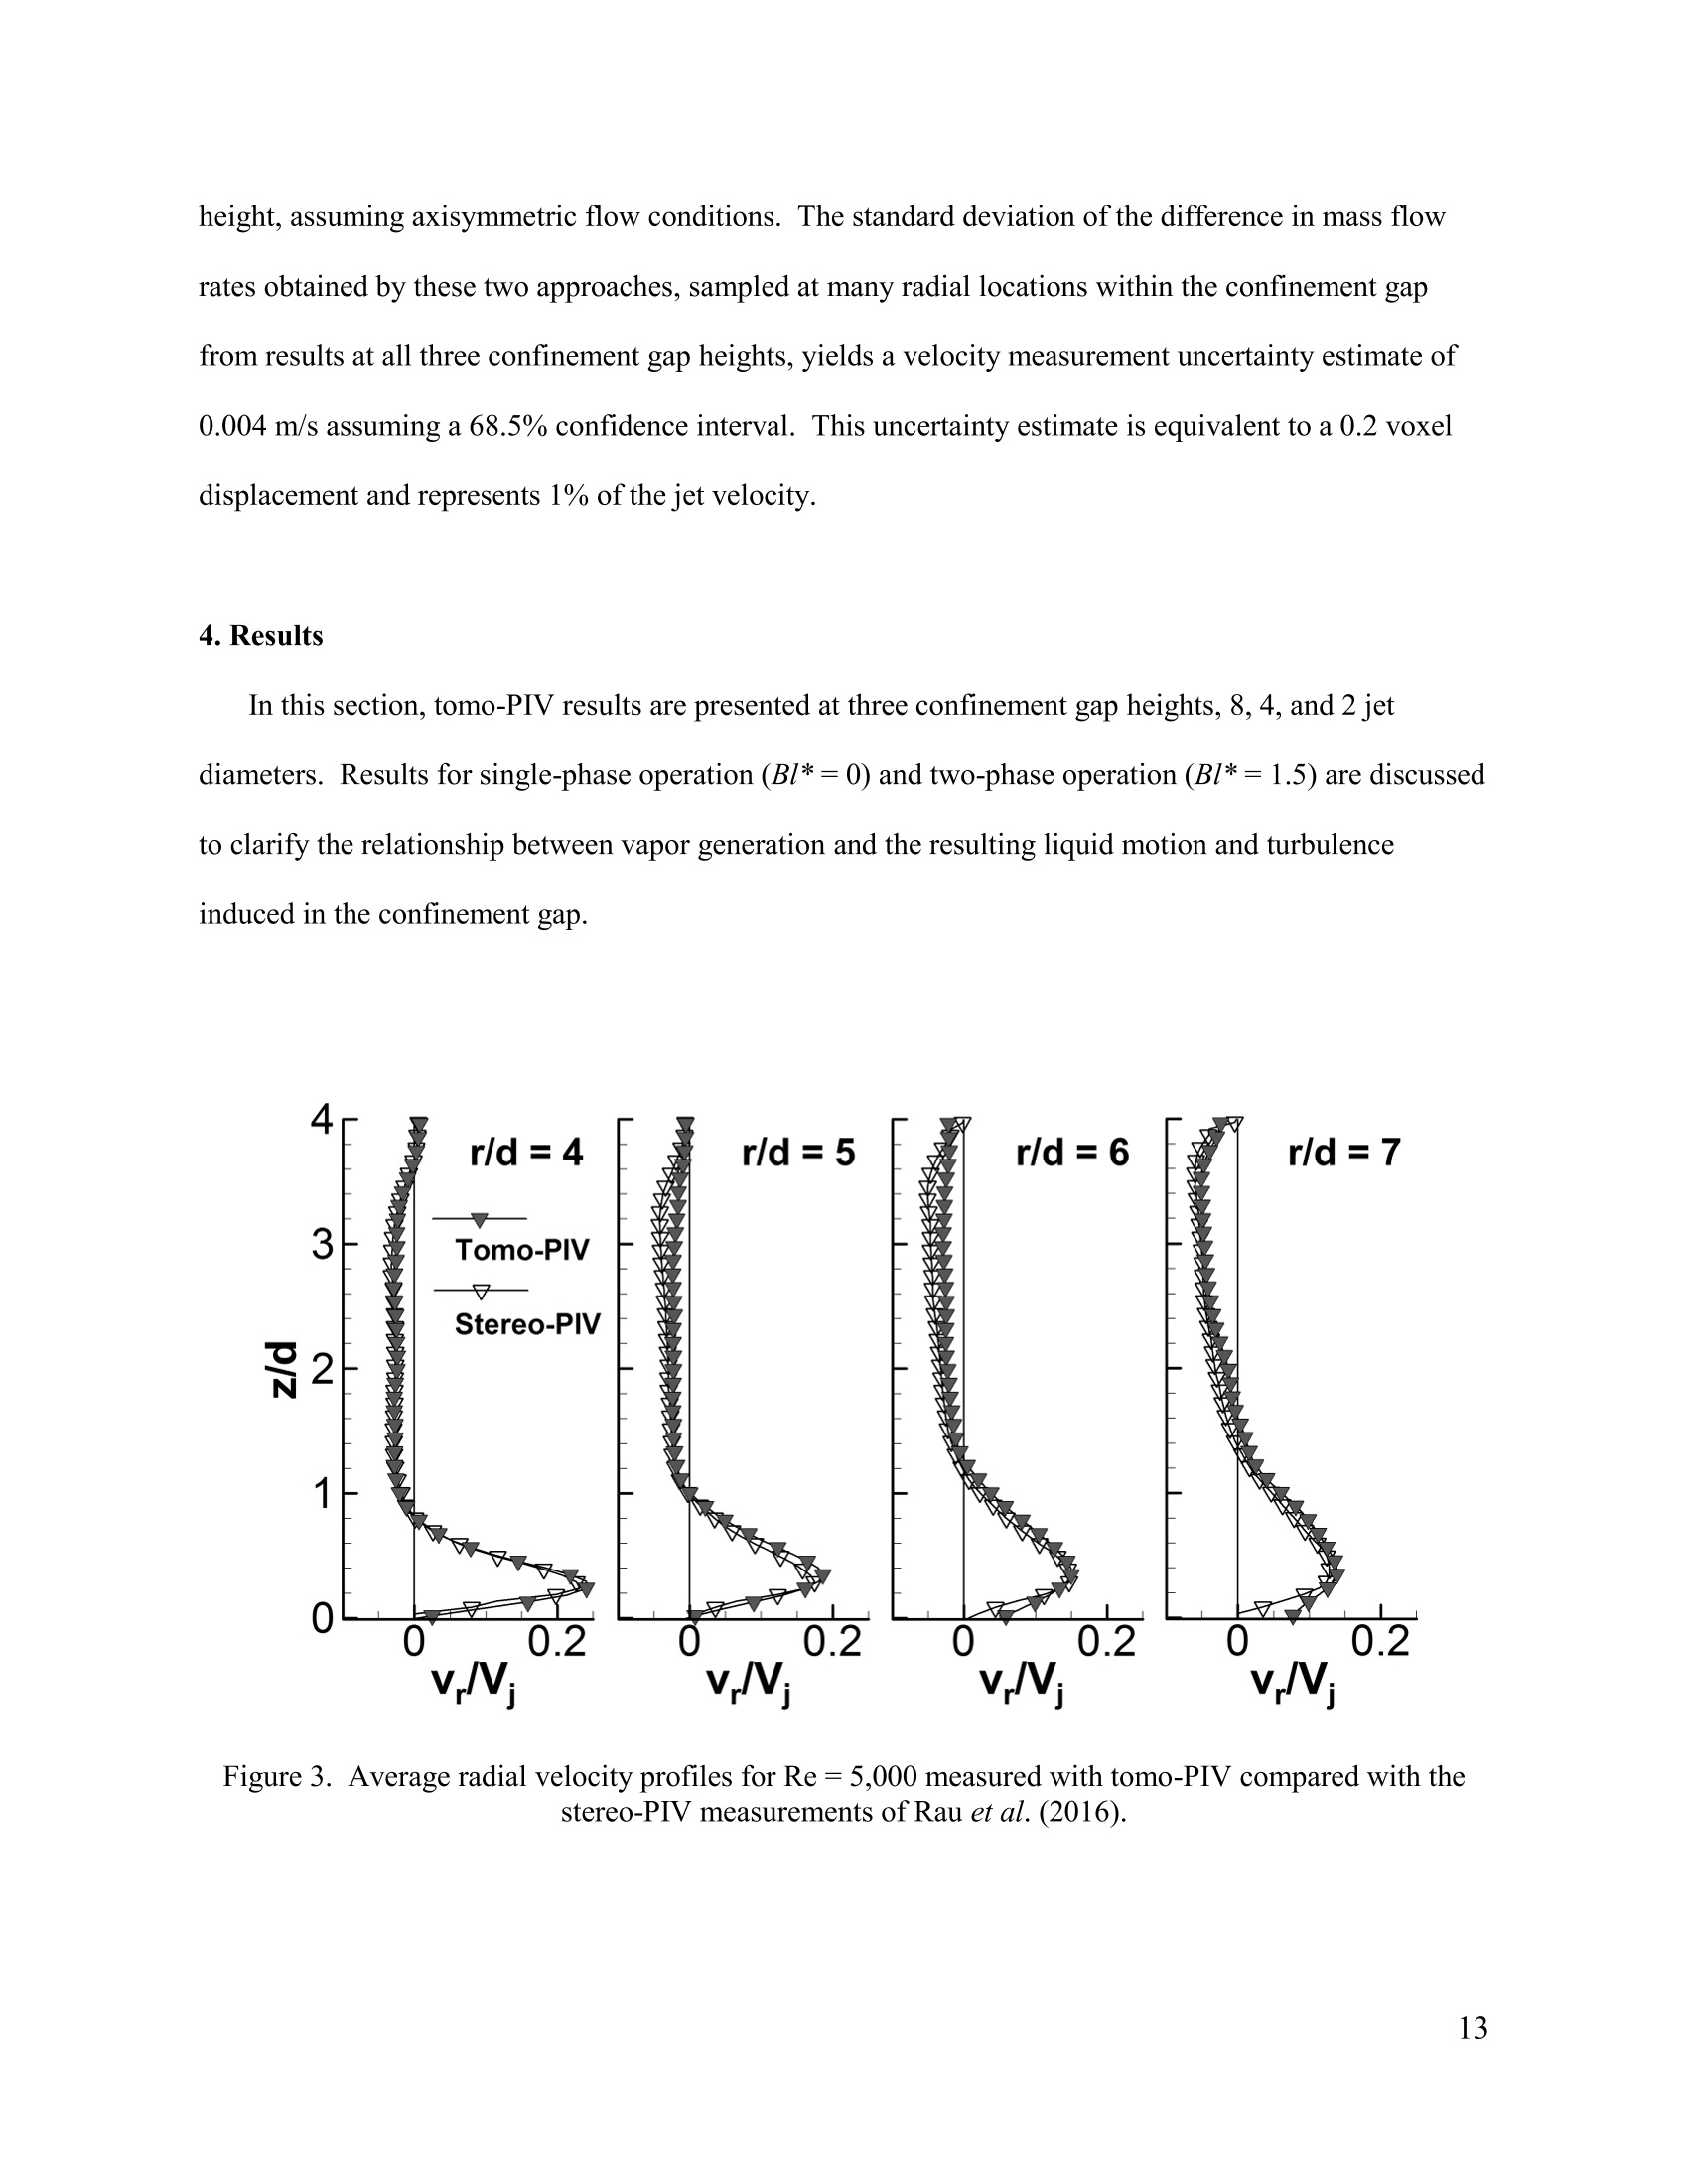
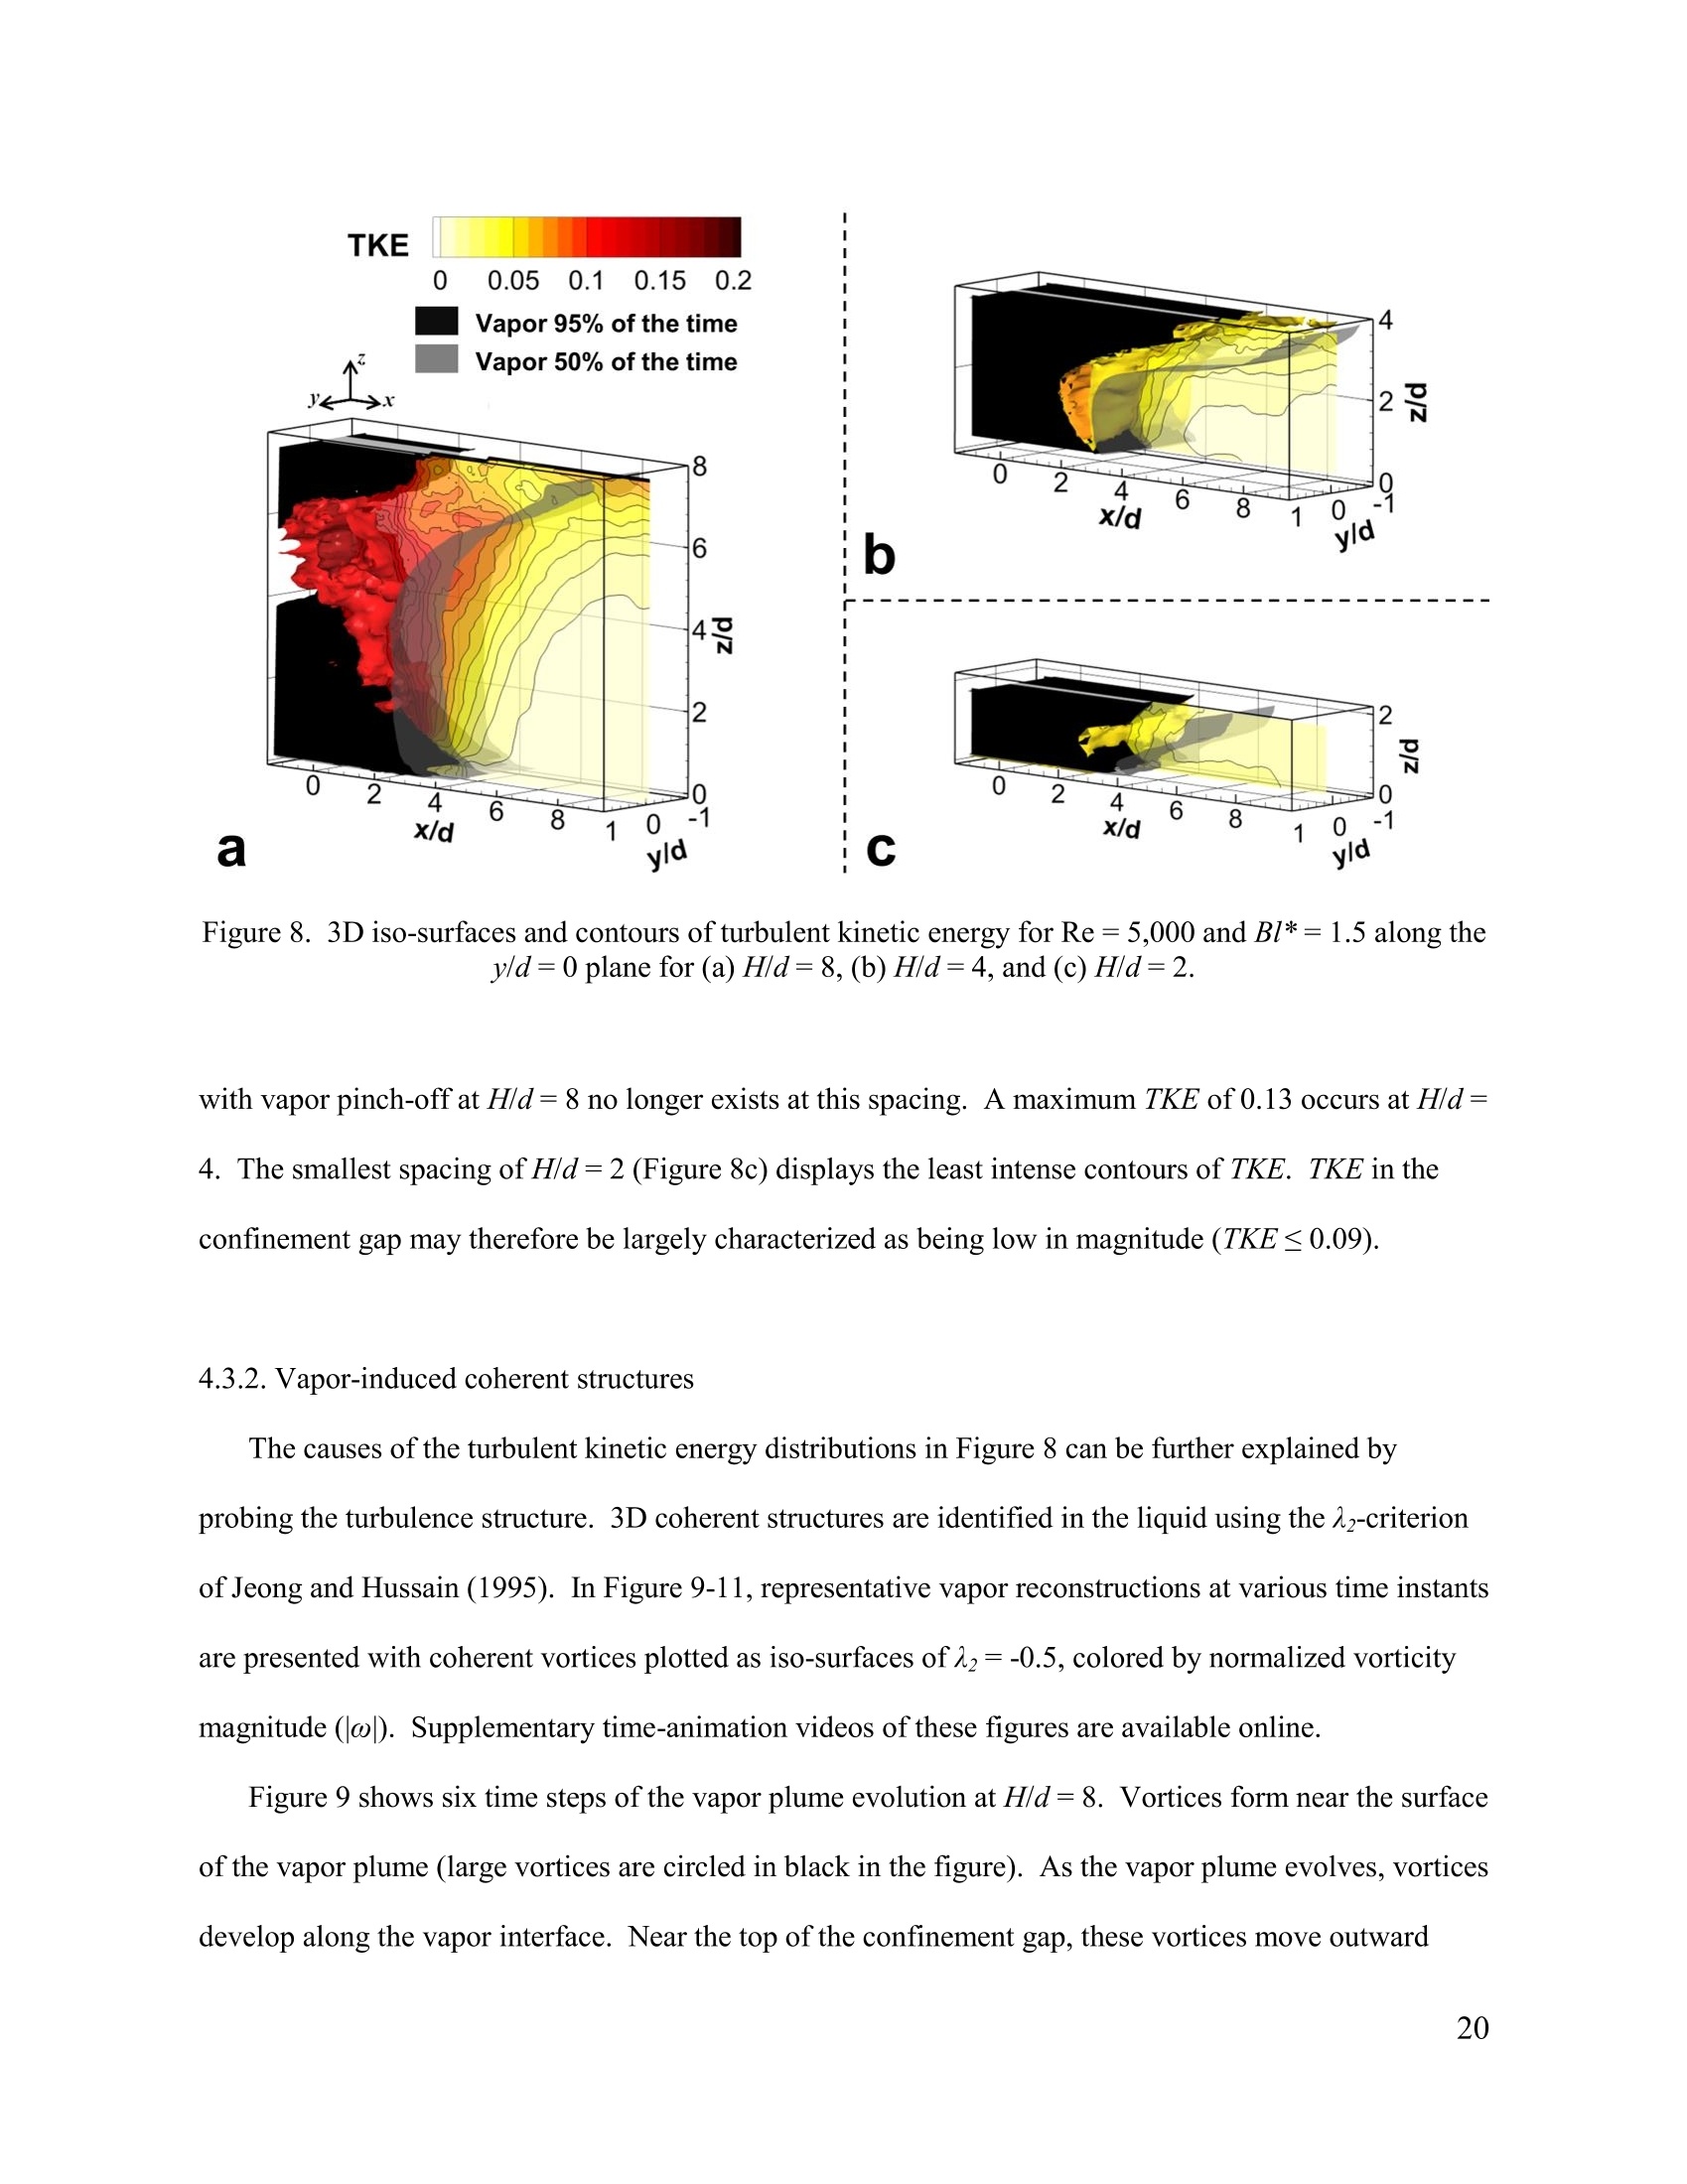
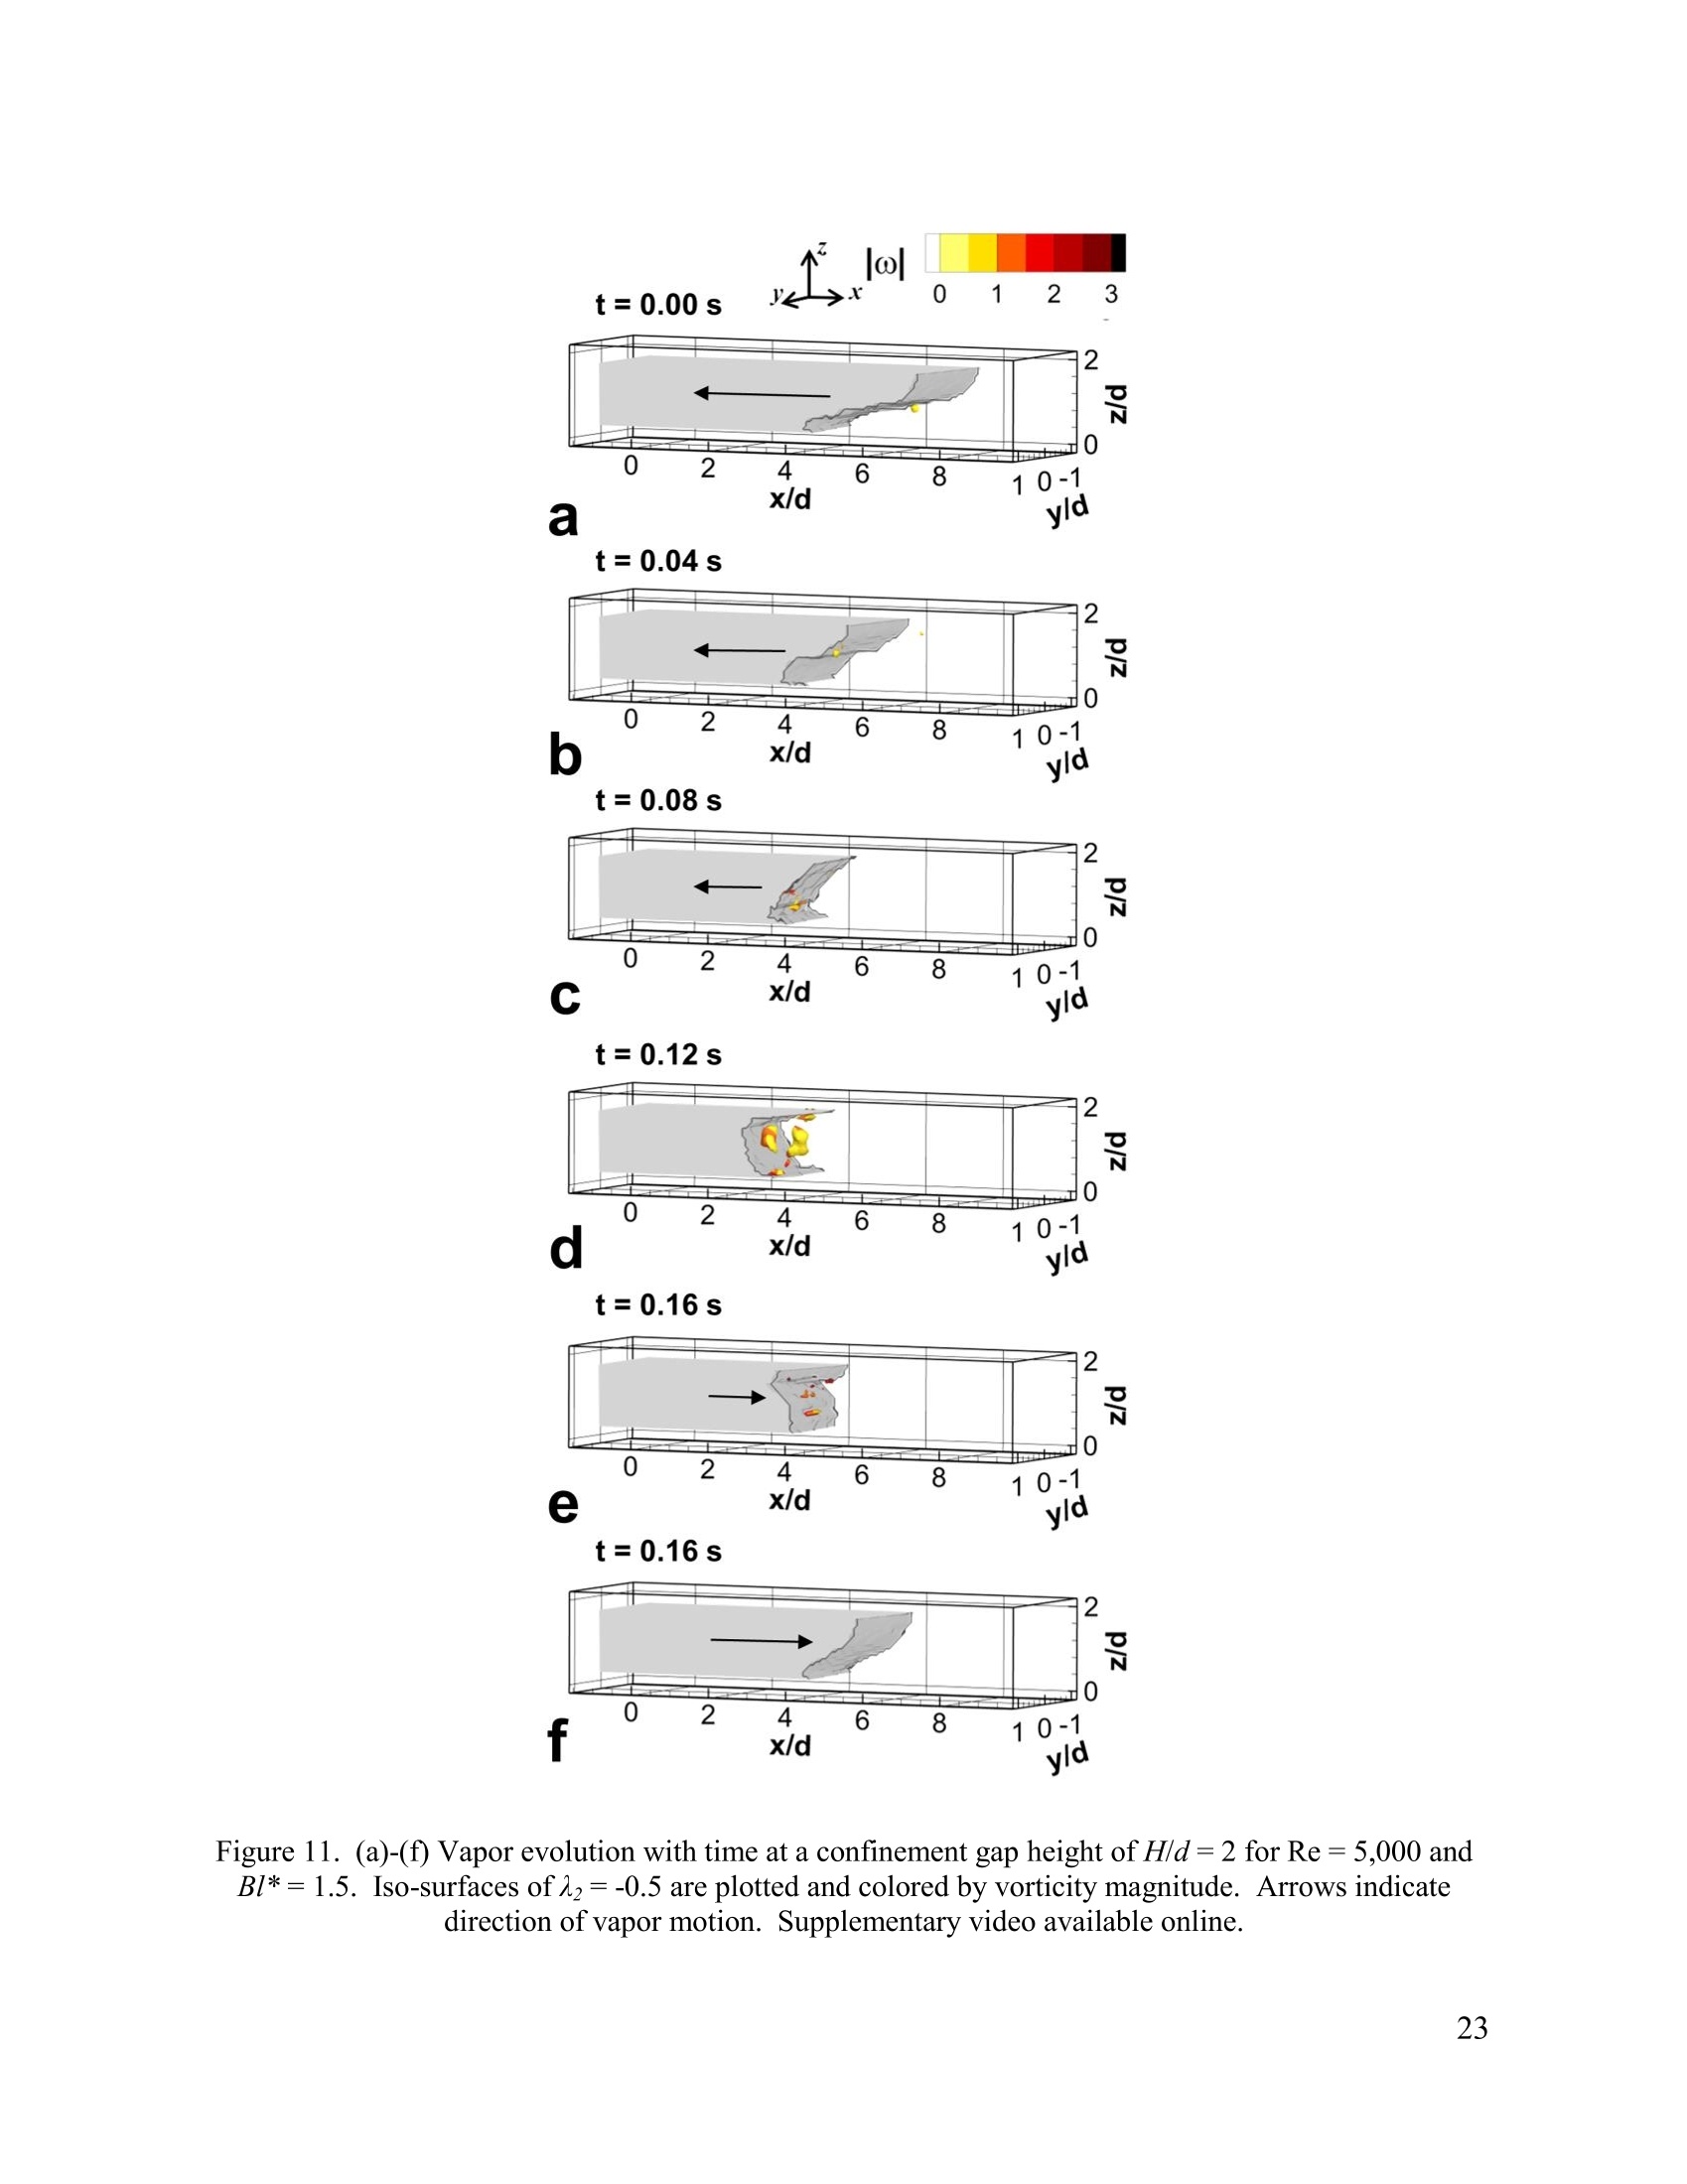
Purdue UniversityPurdue e-Pubs CTRC Research Publications Cooling Technologies Research Center 2016 A Tomographic-PIV Investigation of Vapor-Induced Flow Structures in Confined JetImpingement Boiling M.J.Rau P.PVlachos S V. Garimella Follow this and additional works at: http://docs.lib.purdue.edu/coolingpubs A Tomographic-PIV Investigation of Vapor-Induced Flow Structures inConfined Jet Impingement Boiling Matthew J. Rau, Pavlos P. Vlachos, Suresh V. Garimella School of Mechanical Engineering, Purdue University, 585 Purdue Mall, West Lafayette, IN 47907 USA Abstract Tomographic particle image velocimetry (PIV) is used to study the effect of confinement gap heighton the liquid flow characteristics in jet impingement boiling. This first application of tomographic PIV toflow boiling is significant given the complexity of confined two-phase jet impingement. A jet ofsubcooled water at a Reynolds number of 5,000 impinges onto a circular heat source undergoing boilingheat transfer at a constant heat input. Confinement gap heights of 8, 4, and 2 jet diameters areinvestigated. A visual hull method is used to reconstruct the time-varying regions of the vapor in theflow. The vapor motion is found to govern the liquid flow pattern and turbulence generation in theconfinement gap. Time-averaged velocities and regions of turbulent kinetic energy in the liquid arehighest for a confinement gap height of 8 jet diameters, with lower velocity magnitude and turbulencebeing observed for the smaller spacings. Coherent vortical structures identified with the A2-criterion arefound to occur most frequently near the moving vapor interface. The most intense regions of turbulentkinetic energy do not coincide with the location of coherent structures within the flow. Irrotationalvelocity fluctuations in the liquid phase caused by vapor bubble pinch-off are the primary cause of thehigh turbulent kinetic energy measured in these regions. At a gap height of H/d=2 the vapor plume isconstrained as it grows from the heat source, causing bulk flow oscillations in the downstream region ofthe confinement gap. ( Submitted for consideration in International Journal ofMultiphase Flow, Feb r uary 2016 ) Keywords two-phase jet impingement, boiling, turbulence, tomographic PIV, visual hull reconstruction, voidfraction, fluorescence imaging 1. Introduction Flow boiling heat transfer yields the high heat removal rates necessary to cool modern high-powerelectronics devices. Recent advances in two-phase jet impingement have demonstrated that high heattransfer coefficients can be achieved while maintaining low pressure drops that are generally insensitiveto vapor quality in this flow boiling configuration (Rau and Garimella, 2014; Rau et al.,2015). Thesecharacteristics make two-phase jet impingement attractive as a potential drop-in replacement for single-phase power electronics cooling arrangements. The occurrence of phase change can complicate the design of liquid-cooled electronics packages.Vapor bubbles can modify liquid flow paths and act as a source of turbulence (Roy et al., 1993; Roy etal., 1997). One obstacle to implementation of confined two-phase jet impingement is a lack ofunderstanding of the liquid-vapor interactions, particularly as the confinement height is reduced to thesmall dimensions encountered in compact electronics packaging. Understanding these liquid-vapordynamics will aid in the avoidance of flow instabilities common to many two-phase flow systems (Boureet al., 1973) and guide the design of high-performance flow boiling cooling systems. Current understanding of the interactions between vapor bubbles and the liquid in flow boiling isprimarily derived from single-point measurements, such as those obtained with laser Doppler velocimetryor hot-wire anemometry. Single-point velocity statistics are useful for determining average properties;however, linking these results to dynamic phase interactions, such as vapor-induced coherent structures, isdifficult. Increases in turbulent kinetic energy observed in such two-phase flow studies have beenattributed to many different factors including: liquid displacement caused by vapor bubble motion (Lanceand Bataille, 1991; Roy et al., 1993), and increased shear stresses caused by the bubble velocity (Theofanous and Sullivan, 1982; Serizawa and Kataoka, 1990). The dominant mechanism for turbulenceenhancement due to boiling is not yet clear. Whole-field visualization-based flow measurement methods such as particle image velocimetry (PIV)can provide the vapor bubble size, shape, and position in the flow with simultaneous liquid-phasevelocimetry measurements. This allows researchers to probe the spatial flow structure. Lindken andMerzkirch (2002) used PIV to study bubbles rising in stagnant water. They detected regions of highvorticity and shear in the wake of rising bubbles. The flow structure behind bubbles oscillating laterallyin an upward flow arrangement has also been captured with PIV (Bruicker, 1999; Tokuhiro et al., 1998;1999); the oscillations were shown to create additional vorticity in the bubble wake and a more uniformdistribution of turbulent kinetic energy. Hassan et al. (2001) studied the three-dimensional motion of asingle rising air bubble in a narrow pipe with stereo particle tracking velocimetry. The vortex structuresin the wakes of the bubbles showed a lack of symmetry that resulted from the three-dimensional spiralingand rocking motion of the bubble as it rose in the liquid. Tomographic PIV (tomo-PIV) is a technique that extends the measurement capabilities of PIV tothree dimensions. These capabilities, which allow resolution of the full three-dimensionality of the flowincluding coherent turbulence structures, have seen much recent progress (Scarano, 2013). Time-resolvedtomo-PIV, where the measurements are acquired at a high repetition rate, has been used to study thevortex dynamics of free jets (Violato and Scarano, 2011) and impinging jets (Violato et al., 2012), wherevortical structures were shown to enhance convective heat transfer from an impinging jet formed with achevron nozzle. When applied to two-phase flow, time-resolved tomo-PIV allows simultaneous vapor-phasevisualization with time- and space-resolved liquid velocity measurements; these high-fidelitymeasurement capabilities can provide fundamental insights into two-phase flow behavior that werepreviously not possible. Tomo-PIV has seen limited application to multiphase flows, having beenprimarily used to study the flow around solid objects such as fish and zooplankton (Adhikari and Longmire,2013,Gemmell et al., 2014, Adhikari et al., 2015, Murphy et al., 2012). Flow boiling has notyet been studied with tomo-PIV. In a recent study, Rau et al. (2016) used time-resolved stereo-PIV to study the two-phase flow fieldduring confined jet impingement boiling. The results showed that vapor production due to boilingmodified the liquid flow at a confinement gap height of 4 jet diameters. The purpose of the currentinvestigation is to study the effects of different confinement gap heights on the flow characteristics oftwo-phase jet impingement and to test the applicability of tomo-PIV to study flow boiling. A single,circular 3.75 mm-diameter (d) jet of water is studied with jet-to-target spacings (H)of 8, 4, and 2 jetdiameters. The liquid flow field in the confinement gap is measured using tomo-PIV at a jet Reynoldsnumber of 5,000 during boiling. A vapor volume reconstruction technique is presented and used toexplain the relationship between vapor bubble dynamics and liquid motion in the gap. The influence ofconfinement gap height on coherent structures in the flow, and their relation to turbulence, is alsopresented. 2. Experimental Facility The experiments are performed in a custom-developed two-phase jet impingement facility describedin Rau et al. (2016). Key details are provided here for completeness. Water is circulated through theflow loop using a magnetically-coupled gear pump and the mass flow rate is measured by a Coriolis flowmeter (CMFS015M, Emerson) with an uncertainty of± 0.1%. The flow loop is operated in an open-loopconfiguration, where deionized water is boiled continuously in the reservoir while venting to theatmosphere through reflux condensers to maintain degassed conditions. The test section remains unchanged from the previous study of Rau et al. (2016), and is made frompolyether ether ketone (PEEK) with front and back polycarbonate walls for optical access. The jet ofwater is formed by a 3.75 mm diameter, 7.5 mm long sharp-edged orifice located in the center of acircular confining orifice plate mounted at the end of a plenum. Three different confinement gap heights(H), defined as the spacing between the jet orifice and impingement surface as shown in Figure 1b, are a Figure 1. (a) A top-view schematic drawing of the tomo-PIV measurement system oriented around the jetimpingement test section, (b) a three-dimensional cartoon of the laser illumination and measurementvolume, and (c) the normalized average illumination intensity profile. investigated: 8,4,and 2 jet diameters. The jet impinges onto the center of a 25.4 mm-diameter gold-plated copper heat source that is mounted flush with the bottom of the test section. The confinement gapextends 9.3 jet diameters radially (r) downstream from the jet axis. Spent fluid from the impinging jetand any vapor generated from boiling exit through a return port at the top of the test section. The jet inlet temperature is measured by a T-type thermocouple positioned just upstream of the jetorifice plate. The uncertainty in the calibrated thermocouple measurements is estimated to be ±0.3 C.The heat source is powered by embedded cartridge heaters. The heat flux into the fluid is calculated fromthe electrical heat input after subtracting heat losses, which are estimated based on a numerical heat lossmodel (Rau and Garimella, 2014). The water saturation temperature is determined based on the pressureinside the test section chamber, maintained at 103 kPa absolute, as measured by a transducer with a 0 to206 kPa absolute pressure range and a measurement uncertainty of ±0.3 kPa. 3. Experimental Methods 3.1. Time-resolved tomographic particle image velocimetry Multi-camera visualization is used to provide time-resolved tomographic PIV measurements withsimultaneous visualization of the vapor plume created during boiling. The PIV particles and vaporbubbles are illuminated with a high-speed Nd:YLF laser (Terra PIV, Continuum), which delivers a pulseof 527 nm light at 750 Hz. The laser beam is expanded using a beam collimator and two cylindricallenses to form an illumination volume approximately 16 mm thick (ts). A mirror (83-536, EdmundOptics) is mounted on the bottom wall of the test section to reflect the laser light across the confinementgap, as shown in Figure la. The illumination volume is positioned parallel to the front and rear walls ofthe test section, with the jet orifice centered within the illumination thickness, as shown in Figure 1b. PIV images are acquired with four high-speed cameras (Phantom Miro M340, Vision Research)arranged around the test section as shown in Figure 1a. The cameras are positioned on a common planeparallel to the bottom of the test section. This horizontal mounting configuration is required to imagewithin the narrow confinement gap without obstruction. The cameras view the experiment through 105mm lenses (Micro-Nikkor, Nikon) with apertures of f/11. A Scheimpflug lens-tilt adapter is used onCamera 1 (a=30°) to align the focal plane of the camera with the illumination volume (Prasad andJensen, 1995). A lens tilt adapter is not needed on Cameras 2,3 and 4 due to their smaller viewing angles(a=18,-7, and 11°, respectively) relative to the light-sheet-normal direction. The overlapping camera views and illuminated region result in the measurement volume shown in Figure 1b. Images are acquiredwith a resolution of 1304×1600 pixels. 3.2. PIV particles for boiling water Fluorescence illumination with long-pass optical filters is necessary to image particles in closeproximity to vapor bubbles (Hassan et al., 1992). Fluorescent red (peak emission wavelength 1 =584nm) polystyrene particles, 10 um in diameter (PSF-010UM, Magsphere), are used in the currentexperiments. Long-pass optical filters with a 550 nm cut-on wavelength (FELH0550, Thor Labs)installed on the cameras eliminate high-intensity laser reflections from the images. The fluorescentparticles, moderate light emission from the PEEK walls (Rau et al., 2016), and the optical filtering resultin clean experimental images of both the PIV particles and vapor structures, as shown in Figure 5. Theparticle density (p= 1.05 g/cm’) is close to that of water at 100℃ (p=0.958 g/cm’), which avoidsparticle settling in the measurement volume. The melting temperature of polystyrene (exceeding 200 ℃) is high enough to avoid melting duringthe experiment; however, the heat source surface does reach the glass transition temperature of theparticles (107°C, Rieger, 1996) during boiling. Particles were found to soften during experiments andallow the embedded fluorescent dye to leach out. Over time, the dye would contaminate the heatedsurface and cause the wetted area to become hydrophobic. A rigorous cleaning procedure is implementedto clean the heat source, test section, and flow loop prior to each boiling experiment. The heater surfaceis cleaned sequentially with toluene, acetone, and isopropanol. Post-experimentation, the flow loop isfiltered using a 7 um particulate filter to remove particles from the water. The test section and reservoirare then thoroughly cleaned with isopropanol and the entire flow loop is flushed with clean water. Thiscleaning procedure kept the heated surface from becoming hydrophobic. The surface wettability wastested prior to each experiment and remained consistent throughout testing. 3.3. Test procedure The plenum height is adjusted to set the desired confinement gap height. Deionized water is degassedby circulating through the flow loop while boiling the water using both the inline heater and immersionheater in the reservoir. The reservoir is simultaneously vented to the atmosphere through Graham refluxcondensers. After two hours of degassing, the water flow rate and power to the inline heater are adjustedto maintain a jet inlet subcooling of 10 °℃ and a jet Reynolds number of 5,000. Throughout the rest of theexperiment, degassed conditions are maintained by continuously boiling the water in the reservoir withthe immersion heater while venting through the Graham condensers. Once a steady operating condition is reached, PIV images of the single-phase jet impingement flowfield (prior to boiling) are acquired. The single-phase flow field is used for measurement validation andto serve as a baseline case for comparison with the two-phase flow field. The single-phase images arealso used for the tomo-PIV self-calibration procedure. Fifty ml of degassed water is extracted from thereservoir and mixed with 5.0 ml of 2.5% w/v (weight per volume) PIV particles. This mixture is injectedinto the reservoir and PIV images are acquired. The open operation of the flow loop allows any airintroduced into the reservoir through particle seeding to be continuously evacuated, ensuring thatdegassed conditions are maintained. This seeding procedure results in a uniform distribution of particleswithin the measurement domain, with an average particle image density of 0.02 particles per pixel. PIVimages are acquired for 2.6 s, corresponding to a set of 1,985 time-resolved images. Following imageacquisition, the water in the loop is filtered and the heater is then powered to the desired heat input.Particle seeding and image acquisition is repeated once steady state boiling is reached. Rau et al. (2016) introduced a modified boiling number for heat flux non-dimensionalization as Bl*=—9 (1)me,(Tsat-T) where q is the heat input to the fluid (after subtracting heat losses from the electrical power input), m isthe mass flow rate, c, is the specific heat, Tsat is the saturation temperature, and T is the jet inlet Figure 2. The visual-hull vapor reconstruction steps showing (a) the camera images, (b) mask creation,and (c) the resulting 3D vapor volume within the measurement depth. temperature. A modified boiling number of Bl*= 1 implies that saturated conditions are reached in theflow based on the heat input and sensible heat capacity of the liquid flow. The heat flux used for thecurrent investigation represents Bl*=1.5, indicating that saturated conditions are surpassed for theboiling cases presented. 3.4. Vapor volume reconstruction Three-dimensional bubble shapes have been reconstructed using a variety of methods in the literature.Hassan et al. (2001) determined the bubble centroid position and orientation from stereoscopicexperimental images and fit an oblate spheroid to this position in 3D space. Fujiwara et al. (2004)acquired shadowgraph images of isolated bubbles from perpendicular viewing angles, allowing the integration of the bubble shape captured in one view through the profile captured in the second view. Inthe current study, the vapor forms a plume-like structure above the heat source rather than a collection ofdiscrete bubbles. A visual hull reconstruction method is chosen as it allows time-resolved vaporreconstruction directly from the tomo-PIV images. Vapor reconstruction is performed by first masking vapor regions in each camera image, creating abinary image of each view as shown in Figure 2a and Figure 2b. The image processing steps used tocreate the binary masks are presented in Rau et al. (2016). A vapor volume is then created by projectingeach camera mask using a Multiplicative Line-of-Sight (MLOS) algorithm and the camera calibrationmapping functions. The resulting volume contains the intersecting regions from each camera projection.An example set of vapor image masks and the resulting visual hull-reconstructed volume is shown inFigure 2b and Figure 2c. The visual hull reconstruction technique has been applied to the flow around falling solid objects(Adhikari and Longmire 2012) and to the study of fish and zooplankton using tomo-PIV (Adhikari andLongmire 2013; Gemmell et al. 2014; Adhikari et al. 2015; Murphy et al. 2012). Adhikari and Longmire(2012) described the strengths and limitations of the visual hull method when applied to tomo-PIVimages. Reconstruction accuracy is limited by the number of camera views available. Fewer camerasand shallow viewing angles result in reconstructions that can be incorrectly elongated through the depthof the viewing system. The limited optical access offered by the present confined boiling geometrynecessitates the use of shallow camera viewing angles. Because the vapor plume structures are widerthan the illumination volume, any resulting elongation in the vapor reconstruction would cause only areduction in curvature of the plume interface. The corresponding error in the volume due to this reductionin curvature is likely small. In contrast, this visual hull method would not be appropriate for thereconstruction of small discrete bubbles in the flow as the resulting error would be much more significant.Thus, the two-phase flow conditions in the current study are an appropriate first application for tomo-PIVusing a visual hull method for vapor reconstruction. 3.5. Tomographic PIV processing The cameras are calibrated prior to the experiments using a single-level dot-matrix target as describedin Rau et al. (2016). The target is traversed from -10 mm to +10 mm in 1 mm increments (21 calibrationplanes total) through the depth of the measurement volume. Mapping functions relating the image pixelcoordinates to the physical coordinates of the measurement volume are then fit to the calibration dotsusing a third-order polynomial function in DaVis 8 software (LaVision). A volumetric self-calibrationusing PIV images captured prior to boiling is also performed to refine the mapping functions as outlinedby Wieneke (2008). The PIV images are preprocessed using steps similar to those outlined by Violato et al. (2011) andAdhikari and Longmire (2012). The minimum gray-level intensity at each pixel, calculated from theentire image set, is first subtracted followed by subtraction of a sliding minimum calculated from a 3 ×3pixel window. Intensities are then normalized across a 16 ×16 pixel window, and a 5×5 pixel Gaussianfilter is applied. The resulting images have spatially uniform particle intensities with zero backgroundintensity; these qualities are advantageous for the self-calibration and particle volume reconstruction(Elsinga et al.,2006;Wieneke,2008). Particle volumes are reconstructed using the SMART algorithm (Atkinson and Soria, 2009)implemented in DaVis 8 with five MART iterations. A reconstruction quality (O) (defined as thenormalized correlation coefficient of the exact and reconstructed particle intensity distributions) above the0.75 threshold recommended by Elsinga, et al. (2006) is expected with this number of iterations given theparticle seeding density and the use of four cameras. Figure 1c shows a representative average profile ofthe normalized particle volume intensity through the measurement depth. The Gaussian-shapeddistribution of illumination from the laser light is evident for the region -8 mm8 mm is representative of the ghost particleintensity. Elsinga et al. (2006) recommend a signal-to noise ratio of 2 or more when comparingreconstructed vs. ghost particle intensity; the interrogation region in the present work is limited to -4 mmx t =0.012 s 18 8 e x/d yld f x/d yld Figure 9. (a)-(f) Vapor evolution with time at a confinement gap height of H/d=8 for Re=5,000 andBl*=1.5. Iso-surfaces of 12=-0.5 are plotted and colored by vorticity magnitude. Arrows indicatedirection of vapor motion. Supplementary video available online. Figure 10. (a)-(f) Vapor evolution with time at a confinement gap height of H/d = 4 for Re=5,000 andBl*=1.5. Iso-surfaces of 12=-0.5 are plotted and colored by vorticity magnitude. Arrows indicatedirection of vapor motion. Supplementary video available online. following the vapor and liquid motion in this region and slowly dissipate. When the plume pinches off att= 0.036 s (Figure 9d) additional vortices are created in the resulting void. These structures are destroyedonce the separate vapor regions merge into a single plume structure, as shown in Figure 9f. At H/d =4 (Figure 10), a bubble is shown to break off from the main plume before moving outwardalong the top wall, causing the surface of the vapor plume to recoil (Figure 10b). Subsequently, vorticesare formed in the liquid near the fluctuating vapor interface and in the wake of the departing bubble. Alarge vortex can be seen to develop behind the bubble as it leaves the confinement gap in thesupplementary video file. The vortex circled in black in Figure 10e and f is a remnant of this motion. Figure 11. (a)-(f) Vapor evolution with time at a confinement gap height of H/d=2 for Re=5,000 andBl*=1.5. Iso-surfaces of 12=-0.5 are plotted and colored by vorticity magnitude. Arrows indicatedirection of vapor motion. Supplementary video available online. Figure 11 shows the vapor motion at H/d=2. The confined vapor plume at this spacing (shown inFigure 5c) grows until one side of the plume reaches an edge of the confinement gap. The time instants inFigure 11a-c show the vapor as it is exiting the left side of the confinement gap (out of the measurementdomain); thus, the visible portion of the plume retracts towards the heat source before again growingthrough the measurement domain in Figure 11e and f. Vortices are absent in the flow shown at thisspacing except for when the plume is at its most retracted position between t=0.08 s and 0.18 s, asshown in the supplementary video file and at the time step of t= 0.12 s in Figure 11d. A lack of vorticesis characteristic of the relatively slow retraction and growthof the plume at this spacing, which is incontrast with the chaotic, vortex-generating motion of the vapor at the larger confinement gap heights. A statistical representation of vortical structures in the flow is shown Figure 12. The contoursindicate the percentage of the time for which A2<-0.5, indicating the presence of coherent structures.Contour values through the measurement depth are projected onto one plane for plotting and shown withthe average plume position as the thick black line. Vortices occur most frequently at H/d=8 and H/d=4(Figure 12a and b) with maximum values of 57% for H/d=8(at r/d=4, z/d=4) and 45% for H/d=4(r/d=3.5,z/d=1.6). The distribution of vortices in the flow is concentrated near the average plumeposition at these confinement gap heights. In contrast, very few vortices are observed at H/d=2 (Figure12c), with a maximum occurrence of only 11%. Comparing Figure 12 with Figure 8, it is evident that vortices are not concentrated in the regionswhere the most intense TKE is observed. TKE is highest in the region where pinch-off occurs at H/d=8(Figure 8a). Vortices form near the vapor interface due to the plume motion (as shown in Figure 9) andare instead most concentrated near the average plume position (as shown in Figure 12). Thus, irrotationalliquid displacement caused by pinch-off, rather than coherent vortices, is the main source of TKE in thisflow. This conclusion is similar to the findings of Lance and Bataille (1991), who found that irrotationalperturbations due to the helical motion of the ellipsoidal bubbles in their upward bubbly flow experimentswere the dominant cause of increased turbulent energy. Given the large size of the vapor structures in thepresent study, this conclusion also agrees with the conclusion that irrotational fluctuations have a larger 入<-0.5 r/d Figure 12. Statistical mappings of the occurrence of coherent structures in the confinement gap for Re =5,000 and Bl*=1.5 at (a) H/d=8,(b)H/d=4, and (c) H/d=2. The 50% plume position is indicatedwith the thick black line. effect on TKE compared to vortices when the gas phase components are large in size (Bunner andTryggvason,2002). 4.4. Vapor volume effects on downstream unsteadiness Coherent vortices and TKE are most prevalent at the larger confinement gap heights; however, bulkflow oscillations can cause additional unsteadiness when boiling occurs in narrow gaps. Theseoscillations can potentially lead to flow instabilities (Boure et al., 1973). To quantify these effects, theinstantaneous radial mass flux (g=pv.) near the edge of the confinement gap (rld=8) is normalized with Figure 13. (a) Definition of Veg for the void fraction calculation. Liquid mass flux across the confinementgap edge plotted with vapor void fraction as a function of time for (b) H/d=8,(c) H/d=4, and (d) H/d=2. Grey shading indicates sections where increasing void fraction and peaks in mass flux coincide. the mass flux of the jet (g;), and plotted in Figure 13 as a function of time (sign indicates flow direction).The radial mass flux is calculated by integrating the radial velocities across the measurement depth andheight. The vapor void fraction is also estimated by determining the volume of the visual hullreconstruction (Vvapor) contained within the wedge (Veg) bound by the confinement gap top and bottom walls and the sector centered at the jet axis within the illumination volume , shown in Figure 13a. Theestimated void fraction is then calculated as a=Vvapor/Veg. The liquid mass flux at the confinement gap edge displays strongly unsteady behavior with time, asshown in Figure 13. The variations are most extreme at H/d=2 (Figure13d), where the normalized massflux has a standard deviation of 0.12. In contrast, the standard deviations at the larger spacings are 0.06and 0.09 for the H/d=4 and H/d=8 confinement gaps, respectively. The void fraction also changes mostdrastically at H/d=2, varying from a= 0.1 to 0.7 and displays a marked periodic signal with a phaseoffset from the mass flux. Peaks in radial mass flux occur as the vapor volume increases; sections in theplot where a peak in the mass flux coincides with an increase in void fraction are indicated by the shadedgray regions of the plot. The cross-correlation coefficient between the mass flux and time-derivative of void fraction (da/dt)is obtained to indicate the strength of the correlation between the change in void fraction and themeasured radial mass flux. The signals cross-correlate with coefficients of 0.51, 0.32, and 0.22 for theconfinement gap heights of H/d=2, 4, and 8, respectively. Correlation coefficients can vary between 0and 1, with 1 indicating complete correlation. The smallest gap height of H/d=2 has the largestcorrelation coefficient, indicating that as the confinement gap height is reduced, the vapor growthcharacteristics have a greater influence on the bulk liquid flow in the gap. Conclusions Tomographic PIV measurements of the liquid flow in the confinement gap of two-phase jetimpingement are performed at three different gap heights (H/d=8, 4, and 2) for a jet Reynolds number of5,000. Results are presented at Bl*=0 (single-phase operation) and Bl*=1.5, where large vapor bubblesform a plume-like structure above the heated surface. Visual-hull reconstructions of the vapor-phaseallow masking ofthe liquid velocity vectors and an estimation of the vapor void fraction within theconfinement gap. The motion of the vapor plume is shown to govern the time-averaged liquid flow in the confinementgap at all three confinement gap heights investigated. At spacings of H/d=8 and H/d=4, liquid flowpatterns follow the vapor motion in the gap with the highest average liquid velocities occurring within theaverage plume position. Vapor growth and pinch-off at the spacing of H/d=8 cause high liquidvelocities and augment circumferential motion. At H/d=2, the vapor plume is confined by the top andbottom walls, which results in less chaotic plume motion and lower-magnitude average liquid velocities. Coherent vortices within the liquid form due to the motion of the vapor interface. TKE is found to bemost affected by irrotational liquid displacement due to vapor pinch-off, rather than from the presence ofcoherent structures in the liquid. In contrast with the larger spacings, few coherent structures are formedin the liquid at H/d=2. The gap height of H/d=2 displays the largest temporal variation in downstream radial mass fluxcompared to the larger gaps. Time-resolved analysis reveals that the confined vapor growth dynamics atthis spacing correlate with the large-amplitude oscillations in the mass flux. Relatively smaller-amplitudeoscillations at the larger gap heights are a result of the entrainment due to pinch-off rather than confinedgrowth of the vapor plume. Time-resolved tomographic PIV is applied to a flow boiling application for the first time in this work.When combined with simultaneous reconstruction of vapor regions, this technique has the capability ofmeasuring the three-dimensional interaction of turbulent liquid with vapor structures in the flow. Furtherdevelopment of this experimental technique with superior vapor-reconstruction strategies will allow itsapplication to more complex dispersed multiphase flow situations and yield further insights into turbulentmultiphase flows. References Adhikari,D., Gemmell, B.J., Hallberg, M.P., Longmire, E.K., Buskey, E.J.,2015. SimultaneousMeasurement of 3D Zooplankton Trajectories and Surrounding Velocity Field in Complex Flows, J.Exp. Biol. 218,3534-3540. Adhikari, D., Longmire, E.K., 2012. Visual hull method for tomographic PIV measurement of flowaround moving objects, Exp. Fluids 53, 943-964. Adhikari, D., Longmire, E.K., 2013. Infrared tomographic PIV and 3D motion tracking system applied toaquatic predator-prey interaction, Meas. Sci. Technol. 24,024011. Atkinson,C., Soria, J., 2009. An efficient simultaneous reconstruction technique for tomographic particleimage velocimetry, Exp. Fluids 47, 553-568. Boure, J.A., Bergles, A.E., Tong, L.S., 1973.Review of two-phase flow instabilities, Nucl. Eng. Des.25,165-192. Bricker, C., 1999. Structure and dynamics of the wake of bubbles and its relevance for bubbleinteraction, Phys. Fluids 11, 1781-1796. Bunner, B., Tryggvason, G., 2002. Dynamics of homogeneous bubbly flows Part 2. velocity fluctuations,J. Fluid Mech. 466, 53-84. Charonko,J.J., Vlachos, P.P., 2013. Estimation of uncertainty bounds for individual particle imagevelocimetry measurements from cross-correlation peak ratio, Meas. Sci. Technol. 24, 065301. Elsinga, G.E.Scarano, F., Wieneke, B., van Oudheusden, B.W., 2006.Tomographic particle imagevelocimetry, Exp. Fluids 41, 933-947. Fitzgerald, J.A., Garimella, S.V., 1997. Flow field effects on heat transfer in confined jet impingement, J.Heat Transf. 119, 630-632. Fitzgerald, J.A., Garimella, S.V., 1998. A study of the flow field of a confined and submerged impingingjet, Int. J. Heat Mass Tran. 41,1025-1034. Fujiwara, A., Danmoto, Y., Hishida, K., Maeda, M., 2004. Bubble deformation and flow structuremeasured by double shadow images and PIV/LIF, Exp. Fluids 36, 157-165. Gemmell, B.J., Adhikari, D., Longmire, E.K., 2014. Volumetric quantification of fluid flow reveals fish’suse ofhydrodynamic stealth to capture evasive prey, J. R. Soc. Interface 11, 20130880. Garimella, S.V., 2000.Heat transfer and flow fields in confined jet impingement, Ann. Ref. Heat Transfer11,413-494. Hassan, Y.A., Blanchat, T.K., Seeley, C.H., Canaan, R.E., 1992. Simultaneous velocity measurements ofboth components of a two-phase flow using particle image velocimetry, Int. J. Multiphase Flow 18,371-395. Hassan, Y.A., Ortiz-Villafuerte, J., Schmidl, W.D., 2001. Three-dimensional measurements of singlebubble dynamics in a small diameter pipe using stereoscopic particle image velocimetry, Int. J.Multiphas. Flow 27, 817-842. Jeong,J., Hussain, F., 1995. On the identification of a vortex, J. Fluid Mech. 285, 69-94. Lance, M., Bataille, J., 1991. Turbulence in the liquid phase of a uniform bubbly air-water flow, J. FluidMech.222.95-118. Lindken, R., Merzkirch,W., 2002. A novel PIV technique for measurements in multiphase flows and itsapplication to two-phase bubbly flows, Exp. Fluids 33, 814-825. Lynch,K., Scarano, F., 2013. A high-order time-accurate interrogation method for time-resolved PIV,Meas. Sci. Technol.24,035305. Murphy, D.W., Webster, D.R., Yen, J., 2012. A high-speed tomographic PIV system for measuringzooplanktonic flow, Limnol. Oceanogr.: Methods. 10,1096-1112. Prasad, A.K., Jensen,K., 1995. Scheimpflug stereocamera for particle image velocimetry in liquid flows,Appl.Optics 34, 7093-7099. Rau, M.J., Garimella, S.V., 2013. Local two-phase heat transfer from arrays of confined and submergedimpinging jets. Int. J. Heat Mass Tran. 67, 487-498. Rau, M.J., Garimella, S.V., 2014. Confined jet impingement with boiling on a variety of enhancedsurfaces. J. Heat Transf. 136, 101503. Rau, M.J., Garimella, S.V., Dede, E.M., Joshi, S.N., 2015. Boiling heat transfer from an array of roundjets with hybrid surface enhancements. J. Heat Transf. 137,071501. Rau, M.J., Guo, T., Vlachos, P.P., Garimella, S.V., 2016. Stereo-PIV measurements of vapor-inducedflow modifications in confined jet impingement boiling, Int. J. Multiphas. Flow, in review. Rieger, J., 1996. The glass transition temperature of polystyrene, J. Thermal Analysis, 46, 965-972. Roy, R.P., Hasan, A., Kalra, S.P., 1993. Temperature and velocity fields in turbulent liquid flow adjacentto a bubbly boiling layer, Int. J. Multiphase Flow 19, 765-795. Roy,R.P., Velidandla, V., Kalra, S.P., 1997. Velocity field in turbulent subcooled boiling flow, J. HeatTransf. 119,754-766. ( Scarano,F. , 2013. Tomographic PIV: prin c iples and practice, Meas. Sci. Technol. 24, 012001. ) Sciacchitano, A., Wieneke, B., Scarano, F., 2013. PIV uncertainty quantification by image matching,Meas. Sci.Technol. 24,045302. Serizawa, A., Kataoka, I., 1990. Turbulence suppression in bubbly two-phase flow, Nucl. Eng. Des. 122,1-16. Theofanous, T.G., Sullivan, J.,1982. Turbulence in two-phase dispersed flows, J. Fluid Mech. 116, 343-362. Timmins, B.H., Wilson, B.W., Smith, B.L., Vlachos, P.P., 2012. A method for automatic estimation ofinstantaneous local uncertainty in particle image velocimetry measurements, Exp. Fluids 53, 1133-1147. Tokuhiro, A., Fujiwara, A., Hishida, K., Maeda, M., 1999. Measurement in the wake region oftwobubbles in close proximity by combined shadow-image and PIV techniques,J. Fluid. Eng. 121, 191-197. Tokuhiro, A.,Maekawa, M., Iizuka, K., Hishida, K., Maeda, M., 1998. Turbulent flow past a bubble andan ellipsoid using shadow-image and PIV techniques, Int. J. Multiphas. Flow 24, 1383-1406. Violato, D.,Ianiro, A., Cardone, G., Scarano, F., 2012. Three-dimensional vortex dynamics andconvective heat transfer in circular and chevron impinging jets, Int. J. Heat Fluid Fl. 37, 22-36. Violato, D., Scarano,F., 2011. Three-dimensional evolution of flow structures in transitional circular andchevron jets, Phy. Fluids 23,124104. Weiland, C., Vlachos, P.P., 2013. Round gas jets submerged in water, Int. J. Multiphas. Flow 48, 46-57. Wieneke, B., 2008.Volume self-calibration for 3D particle image velocimetry, Exp. Fluids 45, 549-556. Xue, Z., Charonko, J.J., Vlachos, P.P., 2015. Particle image pattern mutual information and uncertaintyestimation for particle image velocimetry, Meas. Sci. Technol. 26, 074001. List of Figures Figure 1. (a) A top-view schematic drawing of the tomo-PIV measurement system oriented around the jetimpingement test section, (b) a three-dimensional cartoon of the laser illumination and measurementvolume, and (c) the normalized average illumination intensity profile. Figure 2. The visual-hull vapor reconstruction steps showing (a) the camera images, (b) mask creation,and (C) the resulting 3D vapor volume within the measurement depth. Figure 3. Average radial velocity profiles for Re =5,000 measured with tomo-PIV compared with thestereo-PIV measurements of Rau et al. (2016). Figure 4. Time-averaged single-phase (Bl*=0) jet impingement flow fields for Re =5,000 with aconfinement gap height of (a) H/d=8, (b)H/d=4, and (c) H/d=2. The impinging jet is shown withvelocity surfaces plotted across horizontal slices, while streamtraces show the flow downstream in theconfinement gap. Figure 5. Representative images of boiling at Re =5,000 and Bl*=1.5 for (a) H/d =8, (b) H/d=4, and(c)H/d=2. Figure 6. Time-averaged flow fields for Re=5,000 and Bl*= 1.5 with a confinement gap height of (a)H/d=8,(b)H/d=4, and (c) H/d=2. The 50% plume position is shown with the grey iso-surfaces andthe black volumes represent regions occupied by vapor 95% of the time or more. Streamtraces show themean liquid motion. Figure 7. Circumferential velocity contours for Re=5,000 at H/d=8 plotted along the y/d=0 planeshowing time-averaged velocities for (a) Bl*=0 and (b) Bl*=1.5. (C) Instantaneous velocities for Bl*=1.5 at three time steps with vapor shown in grey and arrows indicating direction of vapor motion.Regions of high inward velocity are circled with the dashed line and regions of high outward velocitywith the compound line in (C). Figure 8. 3D iso-surfaces and contours of turbulent kinetic energy for Re=5,000 and Bl*=1.5 along they/d=0 plane for (a) H/d=8, (b) H/d=4, and (c) H/d=2. Figure 9. (a)-(f) Vapor evolution with time at a confinement gap height of H/d=8 for Re=5,000 andBl*=1.5. Iso-surfaces of 12=-0.5 are plotted and colored by vorticity magnitude. Arrows indicatedirection of vapor motion. Supplementary video available online. Figure 10. (a)-(f) Vapor evolution with time at a confinement gap height of H/d=4 for Re=5,000 andBl*=1.5. Iso-surfaces of 12=-0.5 are plotted and colored by vorticity magnitude. Arrows indicatedirection of vapor motion. Supplementary video available online. Figure 11. (a)-(f) Vapor evolution with time at a confinement gap height of H/d=2 for Re =5,000 andBl*=1.5. Iso-surfaces of 12=-0.5 are plotted and colored by vorticity magnitude. Arrows indicatedirection of vapor motion. Supplementary video available online. Figure 12. Statistical mappings of the occurrence of coherent structures in the confinement gap for Re=5,000 and Bl*=1.5 at (a) H/d=8, (b) H/d=4, and (c)H/d=2. The 50% plume position is indicatedwith the thick black line. Figure 13. (a) Definition of Veg for the void fraction calculation. Liquid mass flux across theconfinement gap edge plotted with vapor void fraction as a function of time for (b) H/d=8,(c) H/d=4, and (d) H/d=2. Grey shading indicates sections where increasing void fraction and peaks in mass fluxcoincide. This document has been made available through Purdue e-Pubs, a service of the Purdue University Libraries. Please contact epubs@purdue.edu foradditional information. ‘ Corresponding author, Tel: + E-mail address: sureshg@purdue.edu Tomographic particle image velocimetry (PIV) is used to study the effect of confinement gap heighton the liquid flow characteristics in jet impingement boiling. This first application of tomographic PIV toflow boiling is significant given the complexity of confined two-phase jet impingement. A jet ofsubcooled water at a Reynolds number of 5,000 impinges onto a circular heat source undergoing boilingheat transfer at a constant heat input. Confinement gap heights of 8, 4, and 2 jet diameters areinvestigated. A visual hull method is used to reconstruct the time-varying regions of the vapor in theflow. The vapor motion is found to govern the liquid flow pattern and turbulence generation in theconfinement gap. Time-averaged velocities and regions of turbulent kinetic energy in the liquid arehighest for a confinement gap height of 8 jet diameters, with lower velocity magnitude and turbulencebeing observed for the smaller spacings. Coherent vortical structures identified with the λ2-criterion arefound to occur most frequently near the moving vapor interface. The most intense regions of turbulentkinetic energy do not coincide with the location of coherent structures within the flow. Irrotationalvelocity fluctuations in the liquid phase caused by vapor bubble pinch-off are the primary cause of thehigh turbulent kinetic energy measured in these regions. At a gap height of H/d = 2 the vapor plume isconstrained as it grows from the heat source, causing bulk flow oscillations in the downstream region ofthe confinement gap.
确定


还剩32页未读,是否继续阅读?

产品配置单


北京欧兰科技发展有限公司为您提供《约束喷射冲击沸腾过程中蒸汽诱导流动结构检测方案(工作站及软件)》,该方案主要用于其他中蒸汽诱导流动结构检测,参考标准--,《约束喷射冲击沸腾过程中蒸汽诱导流动结构检测方案(工作站及软件)》用到的仪器有LaVision DaVis 智能成像软件平台、体视层析粒子成像测速系统(Tomo-PIV)、PLIF平面激光诱导荧光火焰燃烧检测系统、LaVision HighSpeedStar 高帧频相机
相关方案
更多
该厂商其他方案
更多