


方案详情
文
A survey is conducted to quantitatively visualise the wake flow behind a circular cylinder at Reynolds numbers of 180 to 2500. A time-resolved tomographic PIV method is used to measure the
sequence of three-dimensional vector fields evolving in time. The attention is focused upon the unsteady 3D wake organization with the interaction of primary rollers (Karman-Benard) and the secondary vortices resulting from 3D instability of the vortex wake.
方案详情

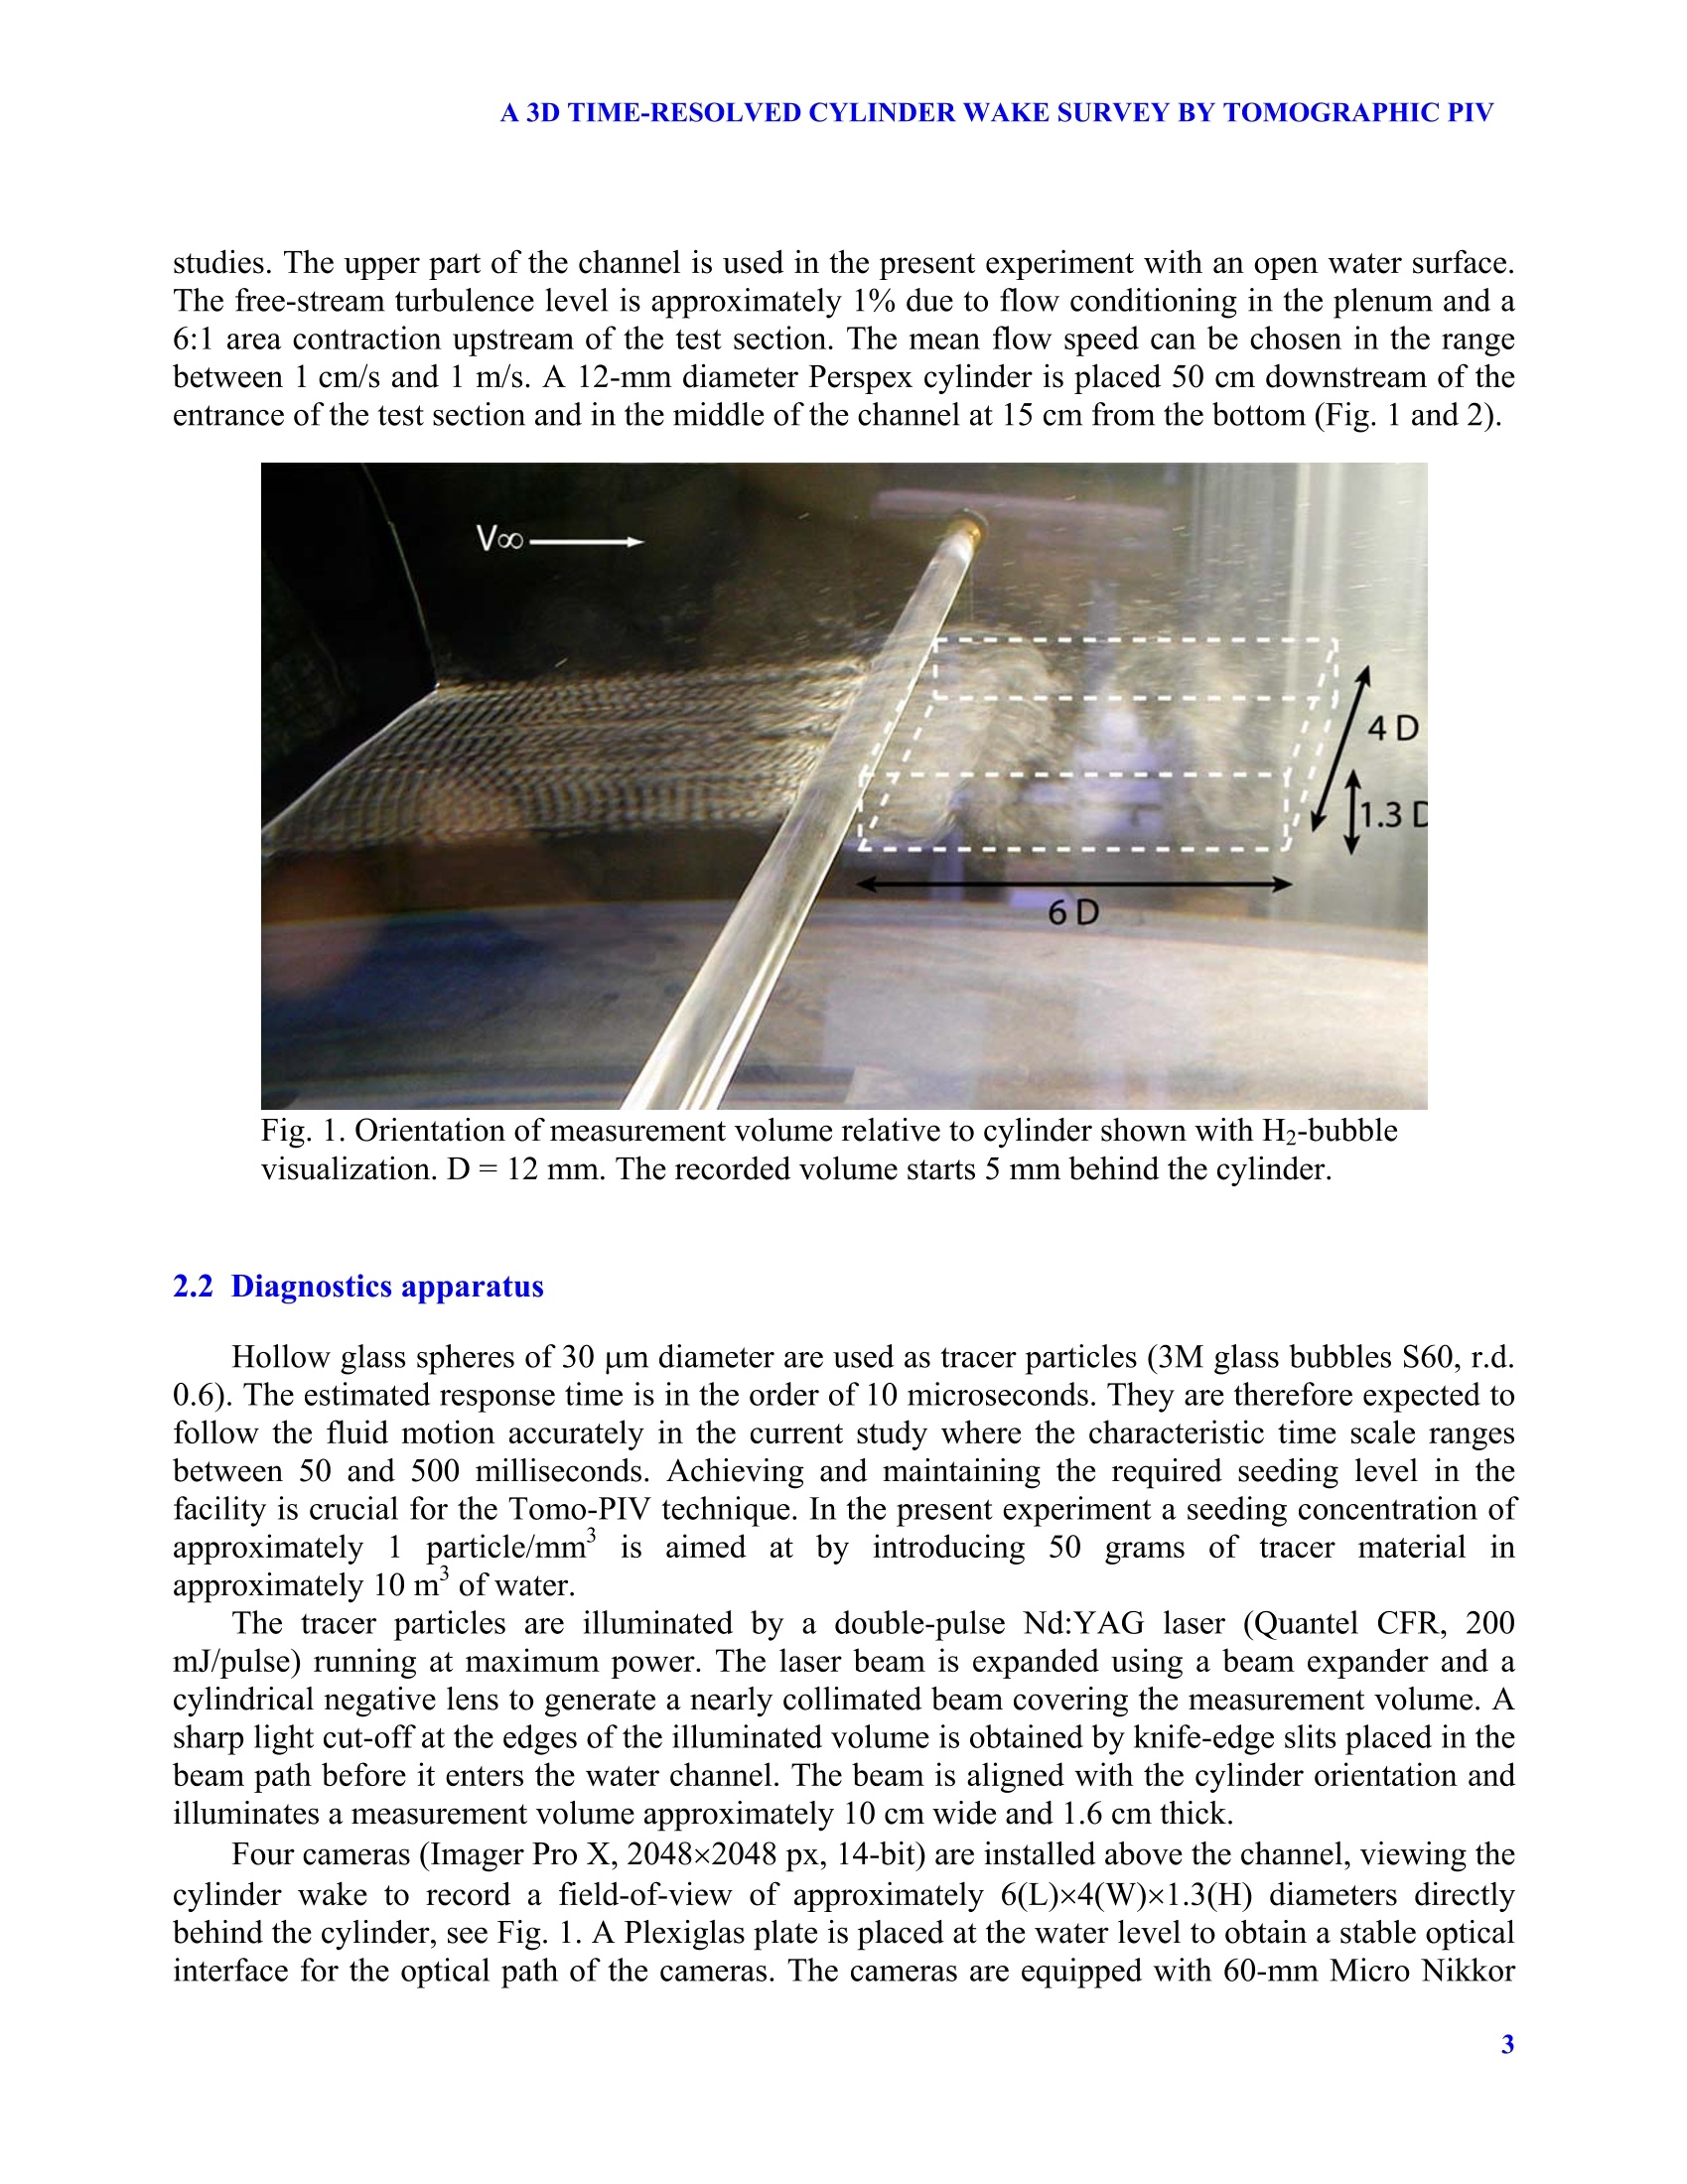
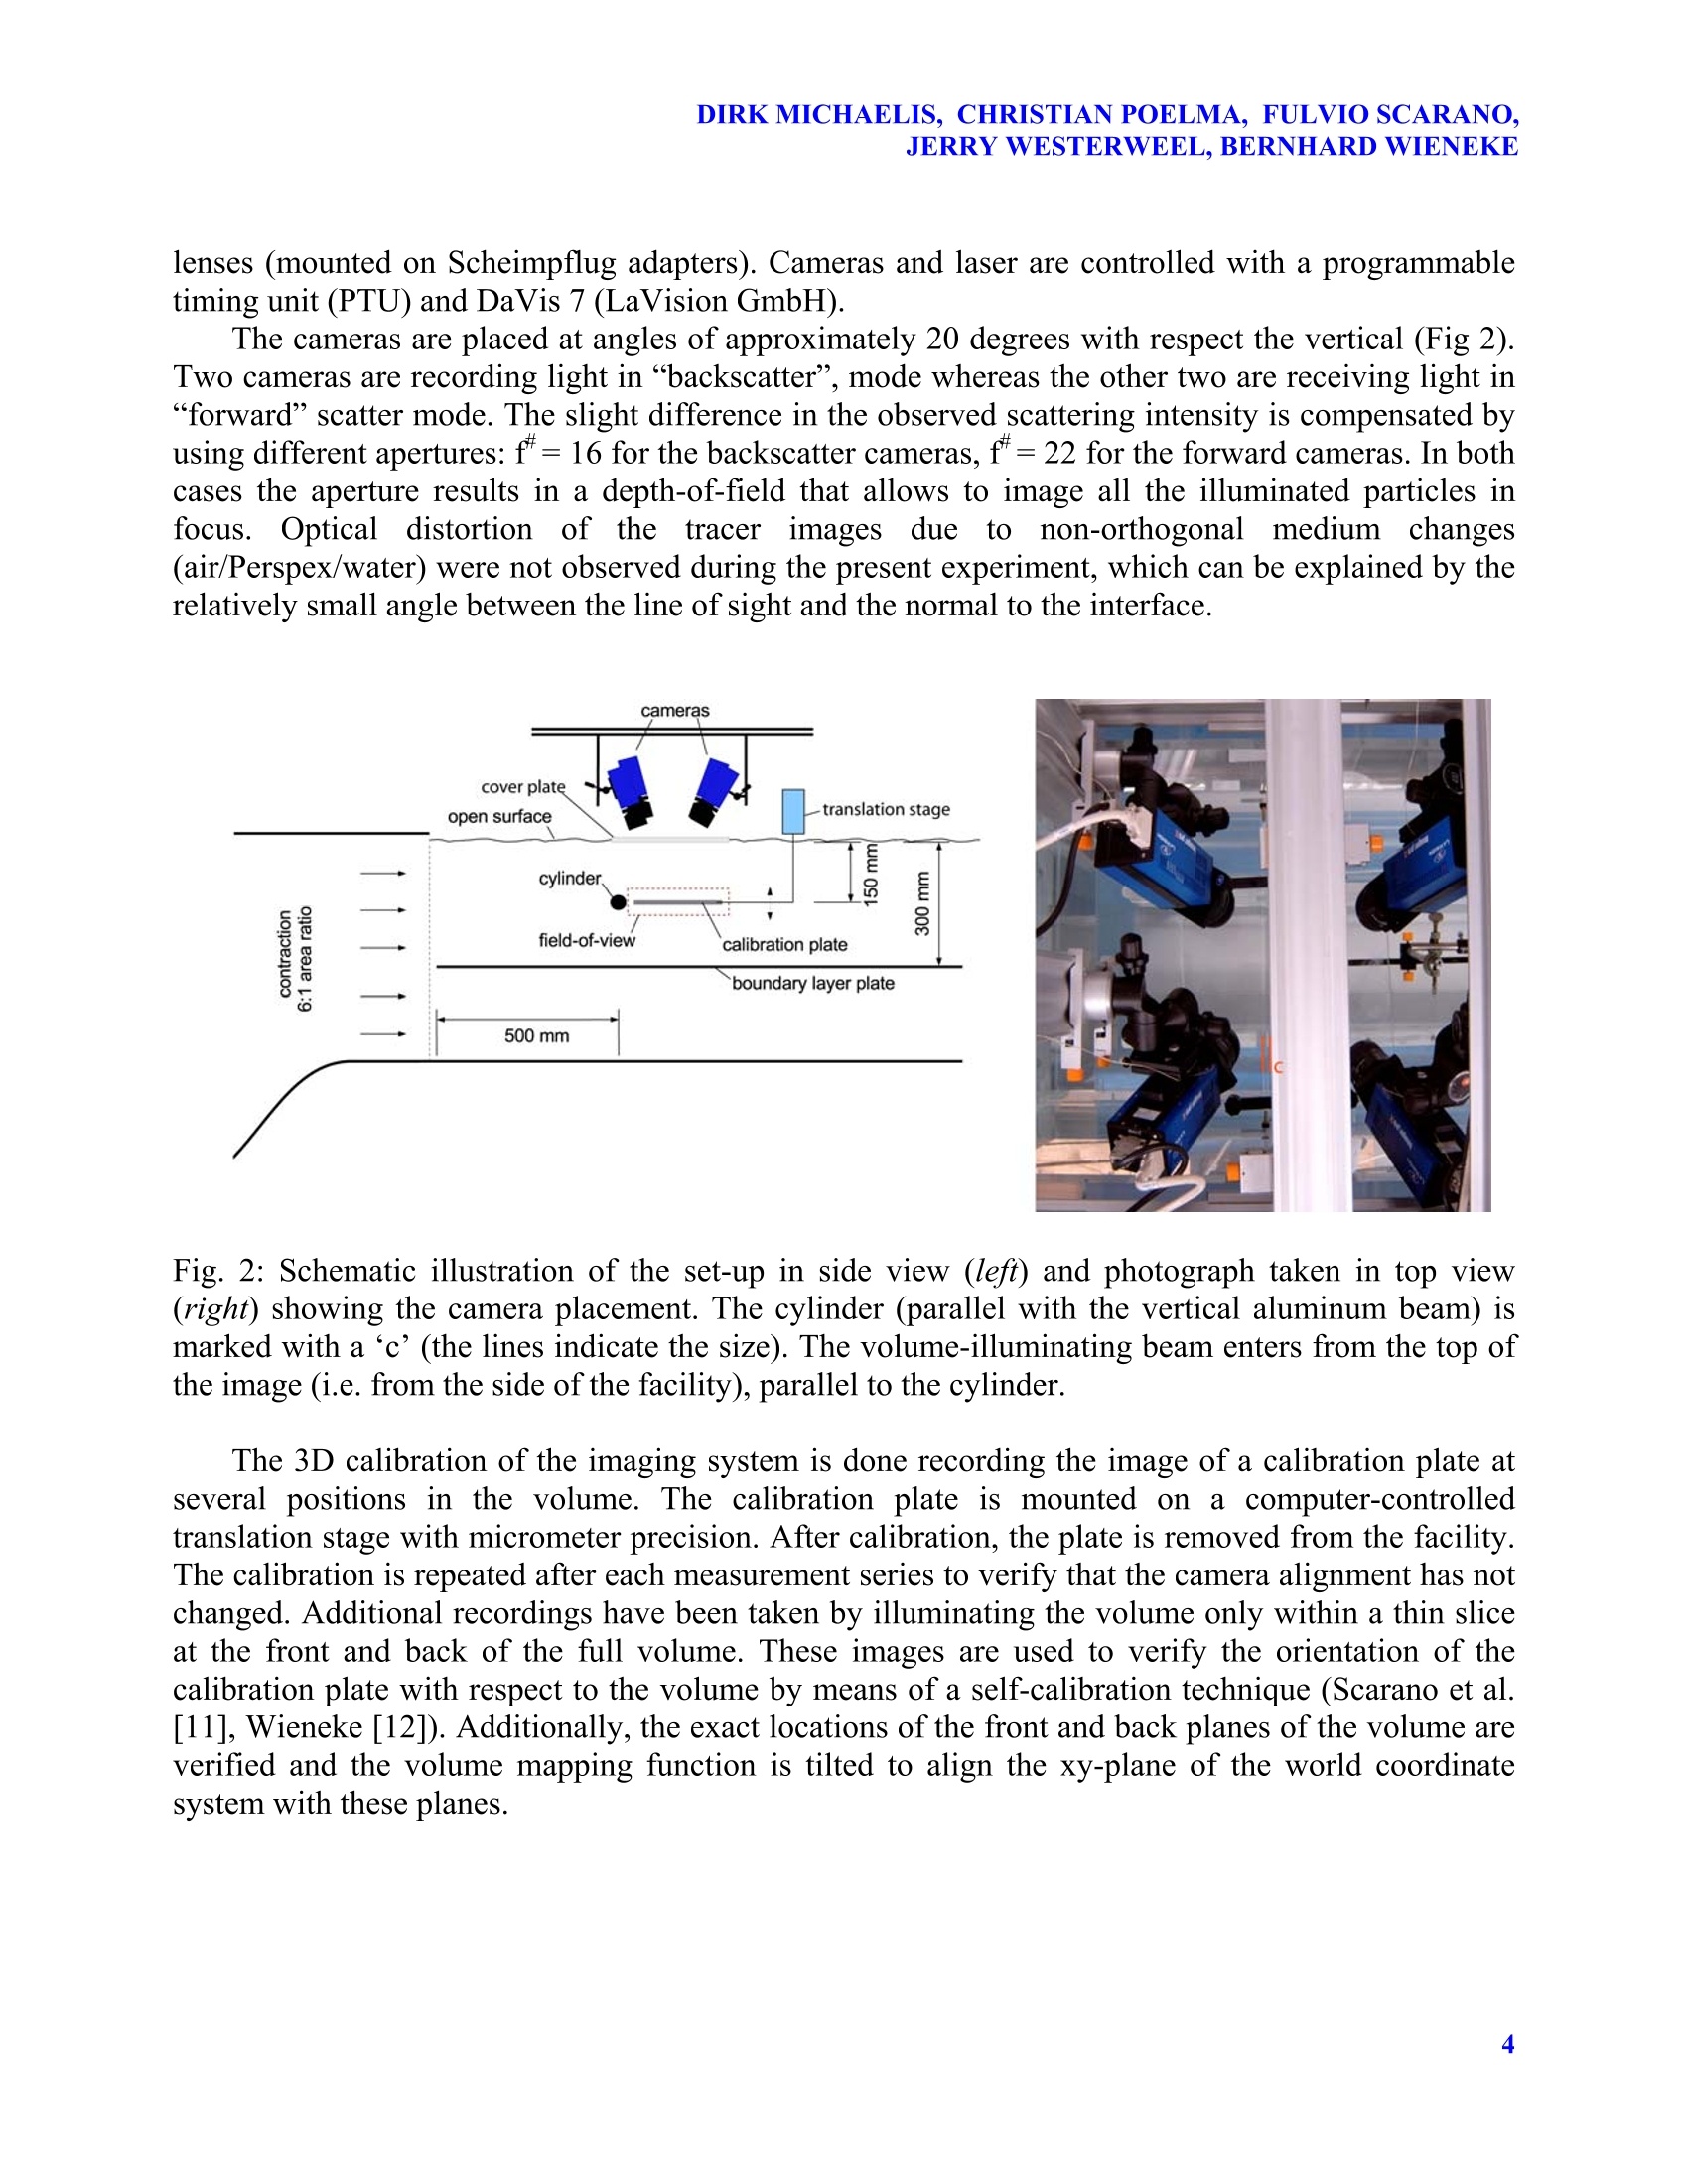
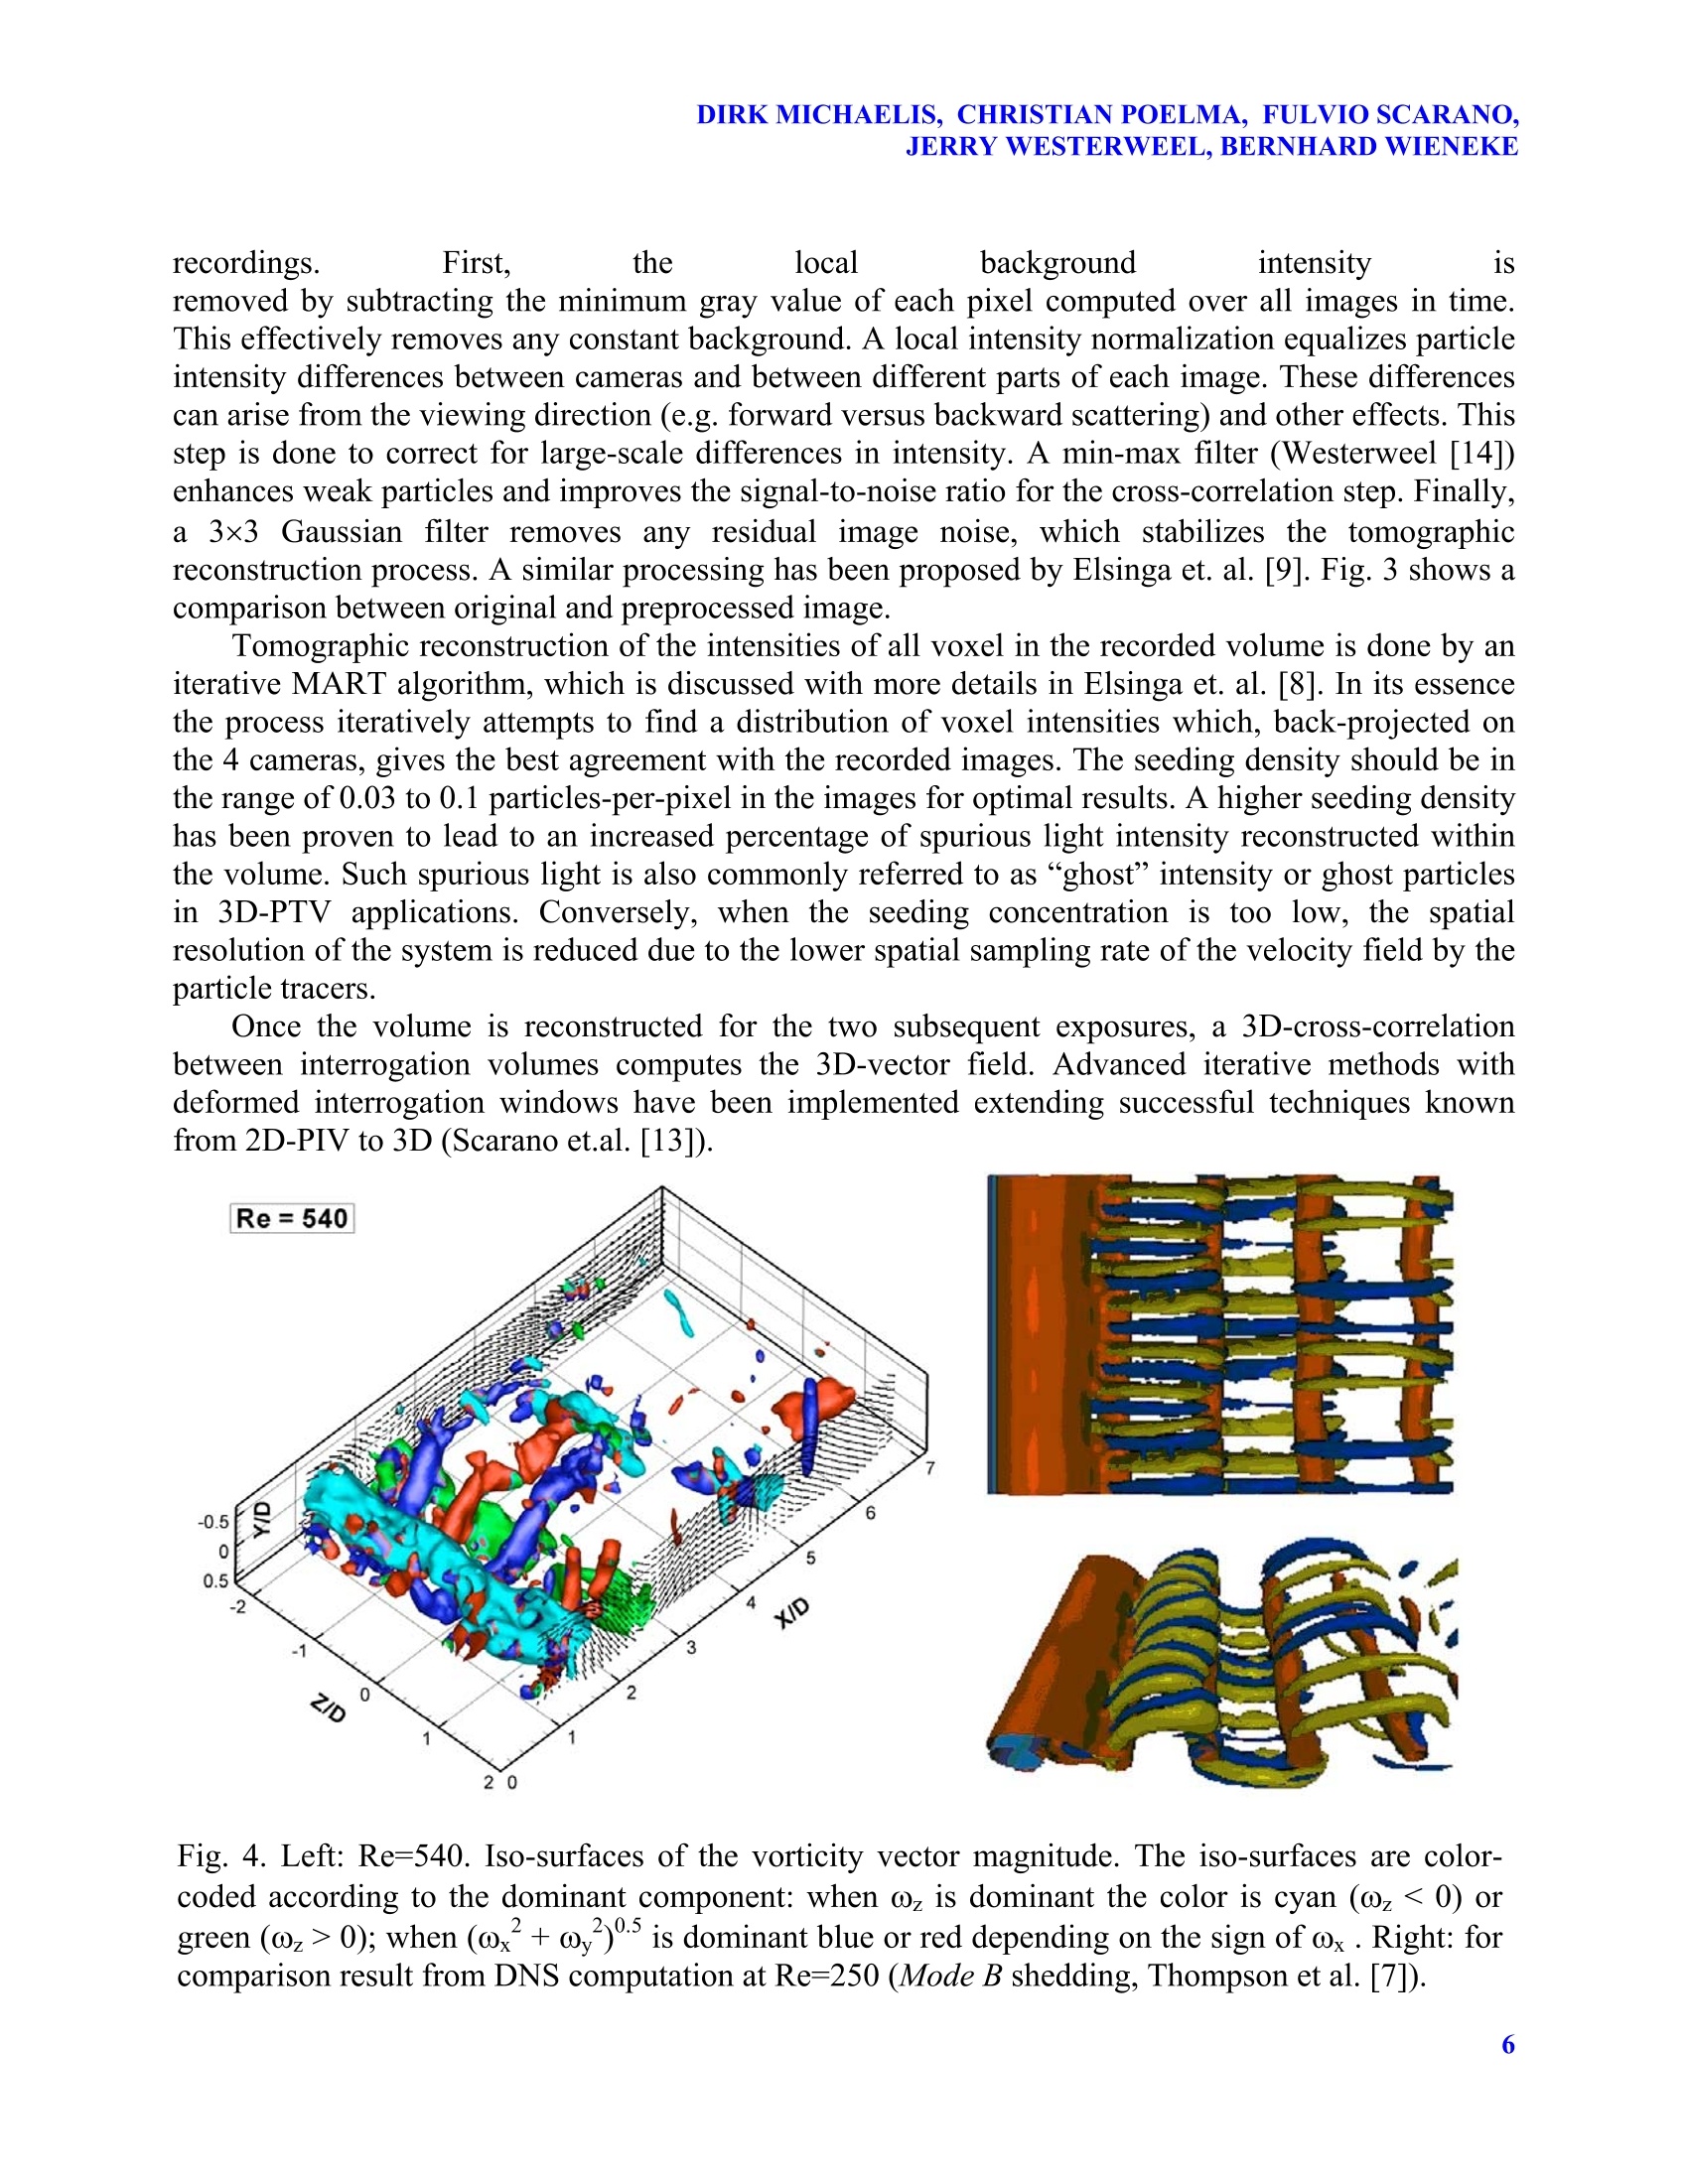
12TH INTERNATIONAL SYMPOSIUM ON FLOW VISUALIZATIONSeptember 10-14, 2006, German Aerospace Center (DLR), Gottingen, Germany DIRK MICHAELIS, CHRISTIAN POELMA, FULVIO SCARANO,JERRY WESTERWEEL,BERNHARD WIENEKE A 3D TIME-RESOLVED CYLINDER WAKE SURVEY BYTOMOGRAPHIC PIV Dirk Michaelis , Christian Poelma , Fulvio Scarano ,Jerry Westerweel, Bernhard Wieneke LaVision GmbH, Gottingen, Germany "Laboratory for Aero- and Hydrodynamics, Delft University of Technology,NetherlandsAerospace Eng. Dept., Delft University of Technology, Netherlands Keywords: circular cylinder wake, time-resolved tomographic PIV, 3D-visualisation ABSTRACT A survey is conducted to quantitatively visualise the wake flow behind a circular cylinder atReynolds numbers of 180 to 2500. A time-resolved tomographic PIV method is used to measure thesequence of three-dimensional vector fields evolving in time. The attention is focused upon ltheunsteady 3D wake organization with the interaction ofprimary rollers (Karman-Benard) and thesecondary vortices resulting from 3D instability of the vortex wake. A cylinder of 12 mm diameter is immersed in a water channel of 600x600 mm’test section ofwhich only the upper halfchannel is used. A volume of 80x50x16 mm’is illuminated by a 2x200 mJlaser and recorded by 4 cameras with 2kx2k pixels viewing the volume from different directionsdistributed over a solid angle of 45 degrees. The images are processed by a modified MARTtomographic reconstruction algorithm to first reconstruct the intensities of all voxels in theilluminated volume. The volume reconstruction is followed by a three-dimensional cross-correlationbetween interrogation volumes returning approximately 300.000 vectors at every snapshot. At lowfree-stream velocity, the recording system is operated in continuous-mode achieving a recordingrate of 20 Hz, which provides time-sequences with higher temporal resolution. However, atvelocities exceeding 5 cm/s only acquisition in double-frame mode can ensure the appropriate timeseparation for cross-correlation. Nevertheless, the time resolution is sufficient for the description ofdynamic events up to a flow speed of 15 cm/s. To the authors knowledge, this type of measurement is unprecedented: for the first time it has beenpossible to measure small-scale 3D-flow features in a complete volume time-resolved with highspatial resolution. Sample results are presented showing the evolution ofspanwise vortices and pairsof counter-rotating secondary interconnecting structures, characterized by different spacing as afunction of the Reynolds number. The high-computational load for data processing keeps theinvestigation still in progress at present time. The transition from the two-dimensional vortex shedding regime behind circular cylinders to three-dimensional flow governed by the Reynolds number has been investigated extensively, especially at Reynolds numbers in the order of 10-10. More background about these studies can be found inthe work by e.g. Williamson et al. [1, 2, 3]. The Reynolds number is defined here as Re =V.D/v,with V.. denoting the free-stream velocity, D the cylinder diameter and v the kinematic viscosity ofthe fluid. For relatively low Reynolds numbers (Re =50-190), the dominating features of the wakeare the well-known alternating rollers, i.e. a von Karmán vortex street (Williamson,[3]). The wake isquasi-two-dimensional in this regime. The earliest 3D transition is associated with the inception ofvortex loops in the main rollers around Re=190, which distort the primary rollers with a spanwisewavelength 入z between 3 and 4 diameters (Mode A, Williamson and Roshko [1]). Increasing the Reynolds number to about 250, a transition from Mode A (vortex loops) to ModeB (stream-wise vortex pairs, Williamson [2,3]) can be observed. These two modes have beenidentified as the two dominant modes for the three-dimensional organisation of coherent structures inthe 3D cylinder wake regime. In particular Mode B is characterised by a shorter span wisewavelength (入z/D=1 between counter-rotating stream-wise rollers). The application of PIV alloweda quantitative analysis of these secondary vortices. Brede et al.[4] obtained 入z/D=4.5 for Mode Aand confirmed 入/D=1.0 for Mode B. At Reynolds numbers exceeding 10 the interaction betweenthe streamwise and the Karmán rollers has been investigated by Bays-Muchmore and Ahmed [5],who used planar laser fluorescence to visualise mushroom-shaped structures interconnecting thespanwise rollers. A recent PIV survey along orthogonal planes performed in the range Re =2,000-10,000 byHuang et al. [6] showed a more chaotic wake structure, which was attributed to the transitionoccurring within the separated shear layers. The full three-dimensional wake structure can nowadaysbe simulated with DNS, as performed by Thompson et al.[7]. However, experimental data is lackingfor a comparison of the full three-dimensional wake structure and even the latest planar velocimetrysurveys do not render the instantaneous 3D organisation of the wake. From the above experimentalstudies, a number of issues are not yet elucidated. In particular at higher Reynolds numbers, thesecondary vortices model is based on planar cross-sections and the instantaneous three-dimensionalorganisation of the flow field has therefore not been sufficiently understood. Moreover, the quantitative characterisation of the secondary vortices dynamics requires anevaluation of the stretching term in the Navier-Stokes equations in vorticity form. This term has notbeen investigated experimentally due to the technical limitation of the planar PIV technique. Thepresent study approaches the analysis of the instantaneous three-dimensional organisation of thecoherent flow structures present in the vortex wake applying the recently developed 3D velocimetrytechnique Tomographic PIV (Tomo-PIV, Elsinga et al.[8,9]). Previous work done in air at Re=2700 (Scarano et al.[10]) has shown the potential of Tomo-PIV for characterising quantitatively the three-component velocity vector field over a volumecontaining the cylinder wake. The current work uses larger format CCDs and further extents theanalysis to a range of Re-numbers from 180 to 2500. By recording time-resolved velocity fields italso provides insights in the temporal evolution and interaction of flow features. The experiments are performed in a water channel with a 60x60 cmcross-section and a test sectionwith 5 meters length. The channel is split in two parts by a flat plate installed for boundary layer studies. The upper part of the channel is used in the present experiment with an open water surface.The free-stream turbulence level is approximately 1% due to flow conditioning in the plenum and a6:1 area contraction upstream of the test section. The mean flow speed can be chosen in the rangebetween 1 cm/s and 1 m/s. A 12-mm diameter Perspex cylinder is placed 50 cm downstream of theentrance of the test section and in the middle of the channel at 15 cm from the bottom (Fig. 1 and 2). Fig. 1. Orientation of measurement volume relative to cylinder shown with H2-bubblevisualization. D=12 mm. The recorded volume starts 5 mm behind the cylinder. 2.2 Diagnostics apparatus Hollow glass spheres of 30 um diameter are used as tracer particles (3M glass bubbles S60,r.d.0.6). The estimated response time is in the order of 10 microseconds. They are therefore expected tofollow the fluid motion accurately in the current study where the characteristic time scale rangesbetween 50 and 500 milliseconds. Achieving and maintaining the required seeding level in thefacility is crucial for the Tomo-PIV technique. In the present experiment a seeding concentration ofapproximately1 particle/mm’ is aimed at by introducing 50 ggrraammss ooff tracer materiall iinapproximately 10 mof water. The tracer particles are illuminated by a double-pulse Nd:YAG laser (Quantel CFR, 200mJ/pulse) running at maximum power. The laser beam is expanded using a beam expander and acylindrical negative lens to generate a nearly collimated beam covering the measurement volume. Asharp light cut-off at the edges of the illuminated volume is obtained by knife-edge slits placed in thebeam path before it enters the water channel. The beam is aligned with the cylinder orientation andilluminates a measurement volume approximately 10 cm wide and 1.6 cm thick. Four cameras (Imager Pro X, 2048×2048 px, 14-bit) are installed above the channel, viewing thecylinder wake to record a field-of-view of approximately 6(L)x4(W)x1.3(H) diameters directlybehind the cylinder, see Fig. 1. A Plexiglas plate is placed at the water level to obtain a stable opticalinterface for the optical path of the cameras. The cameras are equipped with 60-mm Micro Nikkor lenses (mounted on Scheimpflug adapters). Cameras and laser are controlled with a programmabletiming unit (PTU) and Da Vis 7 (LaVision GmbH). The cameras are placed at angles of approximately 20 degrees with respect the vertical (Fig 2).Two cameras are recording light in“backscatter”, mode whereas the other two are receiving light in“forward”scatter mode. The slight difference in the observed scattering intensity is compensated byusing different apertures: f*=16 for the backscatter cameras, f*= 22 for the forward cameras. In bothcases the aperture results in a depth-of-field that allows to image all the illuminated particles infocus. Optical distortion of the tracer imagesdue to non-orthogonal medium changes(air/Perspex/water) were not observed during the present experiment, which can be explained by therelatively small angle between the line of sight and the normal to the interface. Fig. 2: Schematic illustration of the set-up in side view (left) and photograph taken in top view(right) showing the camera placement. The cylinder (parallel with the vertical aluminum beam) ismarked with ac’(the lines indicate the size). The volume-illuminating beam enters from the top ofthe image (i.e. from the side of the facility),parallel to the cylinder. The 3D calibration of the imaging system is done recording the image of a calibration plate atseveral positions in the volume. The calibration plate is mounted on a computer-controlledtranslation stage with micrometer precision. After calibration, the plate is removed from the facility.The calibration is repeated after each measurement series to verify that the camera alignment has notchanged. Additional recordings have been taken by illuminating the volume only within a thin sliceat the front and back of the full volume. These images are used to verify the orientation of thecalibration plate with respect to the volume by means of a self-calibration technique (Scarano et al.[11], Wieneke [12]). Additionally, the exact locations of the front and back planes of the volume areverified and the volume mapping function is tilted to align the xy-plane of the world coordinatesystem with these planes. 2.3 Experiment campaign The flow facility and the measurement system allowed time resolved experiments within therange of Re=180-2520, which was obtained changing the free-stream flow velocity in the range ofV.=0.015-0.21 m/s. Table 1 contains the details of the experimental conditions. In all experimentsthe cameras are used in double-frame mode except for the lowest flow velocity where a single-framecontinuous recording is also attempted. The interpulse time dtaser is varied in order to maintain thereference particle displacement constantly equal to 0.5 mm (approximately 10 voxels). The timeelapsing between subsequent velocity measurements dtvector depends essentially on the acquisitionrate of the imaging system, which in the present case varied between 7 and 10 Hz. Only for the caseat lowest velocity with the continuous acquisition mode the effective acquisition frequency isapproximately doubled to 20 Hz. The tomographic system is operated at a digital resolution of 24voxels/mm. Reynolds V. dtjaser dtvector reconstructed volume number 「m/s1 ms ms mml voxell 180 0.015 50.9 50.9 73×46×16 1730×1089×377 180 0.015 33.0 101.8 73×46×16 1730×1089×377 360 0.030 17.0 101.8 73×46×16 1730×1089×377 360 0.030 33.0 101.8 73×46×16 1730×1089×377 540 0.045 11.0 101.8 73×46×16 1730×1089×377 720 0.060 8.0 101.8 73×46×16 1730×1089×377 900 0.075 7.0 101.8 73×46×16 1730×1089×377 900 0.075 7.0 137.3 73×66×16 1730×1566×377 1080 0.090 6.0 101.8 73×46×16 1730×1089×377 1260 0.105 5.0 101.8 73×46×16 1730×1089×377 1440 0.120 4.0 101.8 73×46×16 1730×1089×377 1800 0.150 3.3 101.8 73×46×16 1730×1089×377 2160 0.180 2.8 101.8 73×46×16 1730×1089×377 2520 0.210 2.4 101.8 73×46×16 1730×1089×377 Table 1. Recording parameter. The volume is specified in streamwisex spanwise ×height dimension. The scaling factor is 0.0424 mm/voxel. 3 DATA PROCESSING The tomographic reconstruction technique basedon the MART method (Herman and Lent [15])requires a low background noise level in therecordings. This is achieved by digital processingofthe images, which allows to remove backgroundand decrease the random noise present in the Fig. 3. Comparison of original (left) andpreprocessed image (right). Area show is140×100 pixel. recordings. First. the local background intensity is removed by subtracting the minimum gray value of each pixel computed over all images in time.This effectively removes any constant background. A local intensity normalization equalizes particleintensity differences between cameras and between different parts of each image. These differencescan arise from the viewing direction (e.g. forward versus backward scattering) and other effects. Thisstep is done to correct for large-scale differences in intensity. A min-max filter (Westerweel [14])enhances weak particles and improves the signal-to-noise ratio for the cross-correlation step. Finally,a13:x3 Gaussian filter removes any residual image noise, which stabilizes the tomographicreconstruction process. A similar processing has been proposed by Elsinga et. al. [9]. Fig. 3 shows acomparison between original and preprocessed image. Tomographic reconstruction of the intensities of all voxel in the recorded volume is done by aniterative MART algorithm, which is discussed with more details in Elsinga et. al.[8]. In its essencethe process iteratively attempts to find a distribution of voxel intensities which, back-projected onthe 4 cameras, gives the best agreement with the recorded images. The seeding density should be inthe range of 0.03 to 0.1 particles-per-pixel in the images for optimal results. A higher seeding densityhas been proven to lead to an increased percentage of spurious light intensity reconstructed withinthe volume. Such spurious light is also commonly referred to as “ghost”intensity or ghost particlesin 3D-PTV applications. Conversely, when the seeding concentration is too low, the spatialresolution of the system is reduced due to the lower spatial sampling rate of the velocity field by theparticle tracers. Once the volume is reconstructed for the two subsequent exposures, a 3D-cross-correlationbetween interrogation volumes computes the 3D-vector field. Advanced iterative methods withdeformed interrogation windows have been implemented extending successful techniques knownfrom 2D-PIV to 3D (Scarano et.al.[13]). Fig. 4. Left: Re=540. Iso-surfaces of the vorticity vector magnitude. The iso-surfaces are color-coded according to the dominant component: when ωz is dominant the color is cyan (@z<0) orgreen (@z>0); when ( x+ωy3)0.5 is dominant blue or red depending on the sign of ωx. Right: forcomparison result from DNS computation at Re=250 (Mode B shedding, Thompson et al.[7]). Fig. 5. Instantaneous vector fields for Re= 360 to 1260. Same coloring as in Fig. 4. The iso-contourvalue is increasing for larger Re-numbers from 6 to 30 s. At Re=1080 a series of spanwise alignedvertical vortices is indicated by arrows. The data has been processed with DaVis 7 using a final interrogation window size of 48x48×48voxels (2x2×2 mm’, approximately 10 particles inside the interrogation box) with a 75% overlapleading to 141×89×29=360k vectors. The vector spacing is approximately 0.5 mm. Final, the vectorfield has been validated by a normalized median test (Westerweel and Scarano [16]). The totalprocessing time for one volume vector field is about 4 hours on a PC with 4 dual-core CPUs. 4 RESULTS Above about Re=190 the the onset of three-dimensional instabilities in the vortex wake becomesmore evident and different type of secondary vortices is observed. The snapshot at Re=540 returns aa series of counter-rotating streamwise vortices finger-shaped, which interconnect counter-rotatingprimary rollers. (Mode B, Williamson et al.[2,3]). The vorticity iso-surfaces show that the structuresare spanwise organized following a periodic pattern (color blue/red in Fig.4) at X/D=2 with aspacing close to 1 D in agreement with existing experimental observations, however in les agreementwith DNS computations returning a smaller spacing at even lower Re (Thompson et al.[7]), see Fig.4 right. The experimental data at higher Re-number increases the range of flow scales as expected,which however makes the direct inspection of the wake structure somewhat less intuitive byvisualization. The flow pattern measured for different Re-numbers is compared in Fig. 5. As ageneral trend, the spanwise coherence tends to be recovered at higher Reynolds, where the effect ofthe secondary structures becomes less pronounced and their length scale is reduced. In the snapshotat Re=1080 a series periodic structures aligned approximately in the vertical direction is captured atX/D=3. The vertical position for the axis of the fingers corresponds approximately to their midpoint where an inflexion is supposedly taking place. The further evolution of these structures on the Fig. 6. Cut through xz-plane at y close to mid-plane with vorticity @y forRe=540 (left) and Re=1080 (right). The spacing between streamwise fingersis 0.75 D and 0.5 D, respectively. upper part of the main roller is not in view in the present experiment due to the edge of thereconstructed domain. One entire shedding period downstream, at X/D= 7, a similar organization isrepeated again, indicating a correlation between spanwise aligned events also in the in the stream-wise direction. Fig. 6 shows a comparison of the vorticity field between Re=540 and Re=1080. Aplane in the middle of the observation volume is selected and the vertical vorticity component ωy isdisplayed. The cross-section of the finger-like structures is approximately circular and their spacingalong the spanwise coordinate is inferred as approximately 0.5 D and 0.75 D for Re=1080 and 540,respectively. Generally the 3D vortex break-down mechanism occurs more frequently for larger Re-numbers.Moreover oblique vortex shedding has also been observed to take place a number of times, which isascribed to the limited control over the boundary conditions at side walls. A time evolution of the full 3D flow pattern is shown in Fig. 7 for Re=540. The intensity of thesecondary flow structures equals or surpasses that of the main rollers, in terms of the local vorticitydistribution. Althought the vorticity pattern of the karman wake seems to vanish downstream of 5diameters, the streamwise rollers show a significant persistence even up to the limit ofthe observeddomain (X/D=7). [3]. Interestingly, a wider range of flow scales is observed very close to thecylinder within X/D<2, which then tends to decrease downstream. This can be explained eitheraccepting a higher measurement noise close to the cylinder or speculating upon the effect ofviscosity on the flow re-laminarization process. This aspect will be given attention in a furtheranalysis of the experiments. Moreover, not the complete roller is covered by the recorded volumeand further experiments should be conducted with smaller and larger cylinders to be able to look atthe evolution of larger as well as smaller scale structures in more detail. 5 SUMMARY Tomographic PIV has been employed as a high-resolution full-volume digital technique toquantitatively measure the wake flow behind a circular cylinder in water at Re =180 to 2500. Themeasurement volume was 6(L)x4(W)x1.3(H) cylinder diameters directly behind the cylinder. Eachinstantaneous flow field contains 360k vectors with a spatial resolution of 0.5 mm. The repetitionrate of the 4 cameras with 2k×2k pixel was high enough for time-resolved measurements to analyzethe development and flow structure interaction of secondary 3D-instabilities. For the first time it hasbeen possible to measure small-scale 3D-flow features in a complete volume time-resolved with highspatial resolution. Many flow features described before in the literature have been identified in thepreliminary analysis of the data. Further processing is necessary to fully exploit the informationcontained in the tomograms. The authors would like to acknowledge D.J. Kuik for hisassistance in setting up theexperiments. 1 Re=540 2Re=540 Fig. 7. Time series at Re =540. Coloring is the same as in Fig. 5. 1. Williamson CHK and Roshko A. Measurement of base pressure in the wake of a cylinder at lowReynolds number. Flugwiss Z. Weltraumforsch, Vol. 14, pp. 38,1990. 2. Williamson CHK. Three-dimensional wake transition. J Fluid Mech, Vol. 328, pp. 345,1996. 3. Williamson CHK. Vortex dynamics in the cylinder wake. Annu Rev Flu Mech, Vol. 28, p. 477,1996. 4. Brede M, Eckelmann H and Rockwell D. On secondary vortices in the cylinder wake. Phys Fluids,Vol.8,pp.2117,1996. 5. Bays-Muchmore B and Ahmed A. On streamwise vortices in turbulent wakes of cylinders. Phys.Fluids A, Vol. 5, pp.387,1992. 6. Huang JF, Zhou Y and Zhou T. Three-dimensional wake structure measurement using a modifiedPIV technique. Exp Fluids,Vol. 41, published online, 2006. 7. Thompson M, Hourigan K and Sheridan J. Three-dimensional instabilities in the cylinder wake. Int.Colloq.Jets, Wakes, Shear Layers, Melbourne, AUS, 1994. 8. G.E. Elsinga GE, Scarano F, Wieneke B and van Oudheusden BW. (2005) Tomographic particleimage velocimetry. 6"h Int Symp on Particle Image Velocimetry, Pasadena, California, USA, 2005. 9. Elsinga GE, Van Oudheusden BW and Scarano F. Experimental assessment of tomographic-PIVaccuracy. 13"h Int. Symposium Applications of Laser Techniques to Fluid Mechanics, Lisbon,Portugal, 2006. 10.儿.Scarano F, Elsinga G, Bocci E and van Oudheusden BW. Investigation of 3-D Coherent Structures inthe Turbulent Cylinder Wake using Tomo-PIV. 13" Int Symp on Applications of Laser Techniques toFluid Mechanics, Lisbon, Portugal, 2006. 111.. SScarano F, David L, Bsibsi M and Calluaud D. S-PIV comparative assessment: image dewarping +misalignment correction and pinhole +geometric back projection. Exp Fluids, Vol 39, pp 257-266,2005. 12 Wieneke B. Stereo-PIV using self-calibration on particle images. Exp Fluids, Vol. 39, pp 267-280,2005. 13..SScarano F and Riethmuller ML. Advances in iterative Multigrid PIV image processing. Exp Fluids,Suppl, S51,2000 14. Westerweel J. Digital Particle Image Velocimetry - theory and practice, PhD thesis Delft Universityof Technology, 1993 15.).Herman GT and Lent A. Iterative reconstruction algorithms. Compt Biol Med, Vol. 6, pp. 273-294,1976. 16. Westeerweel J and Scarano F. A universal detection criterion for the median test. Exp. Fluids, Vol.39, p. 1096,2005.
确定


还剩9页未读,是否继续阅读?

产品配置单


北京欧兰科技发展有限公司为您提供《流体中时间分辨3D3C速度矢量场检测方案(粒子图像测速)》,该方案主要用于其他中时间分辨3D3C速度矢量场检测,参考标准--,《流体中时间分辨3D3C速度矢量场检测方案(粒子图像测速)》用到的仪器有体视层析粒子成像测速系统(Tomo-PIV)、LaVision HighSpeedStar 高帧频相机
相关方案
更多
该厂商其他方案
更多