


方案详情
文
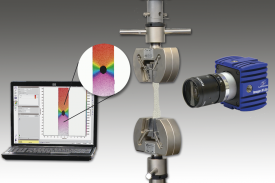
采用LaVision的StrainMaser应变形变测量系统。测量人类活动造成的岩土沉积层,在含水情况下发生崩塌,崩溃的规律。目的是为了预警防范如泥石流等地质灾害的发生。
方案详情

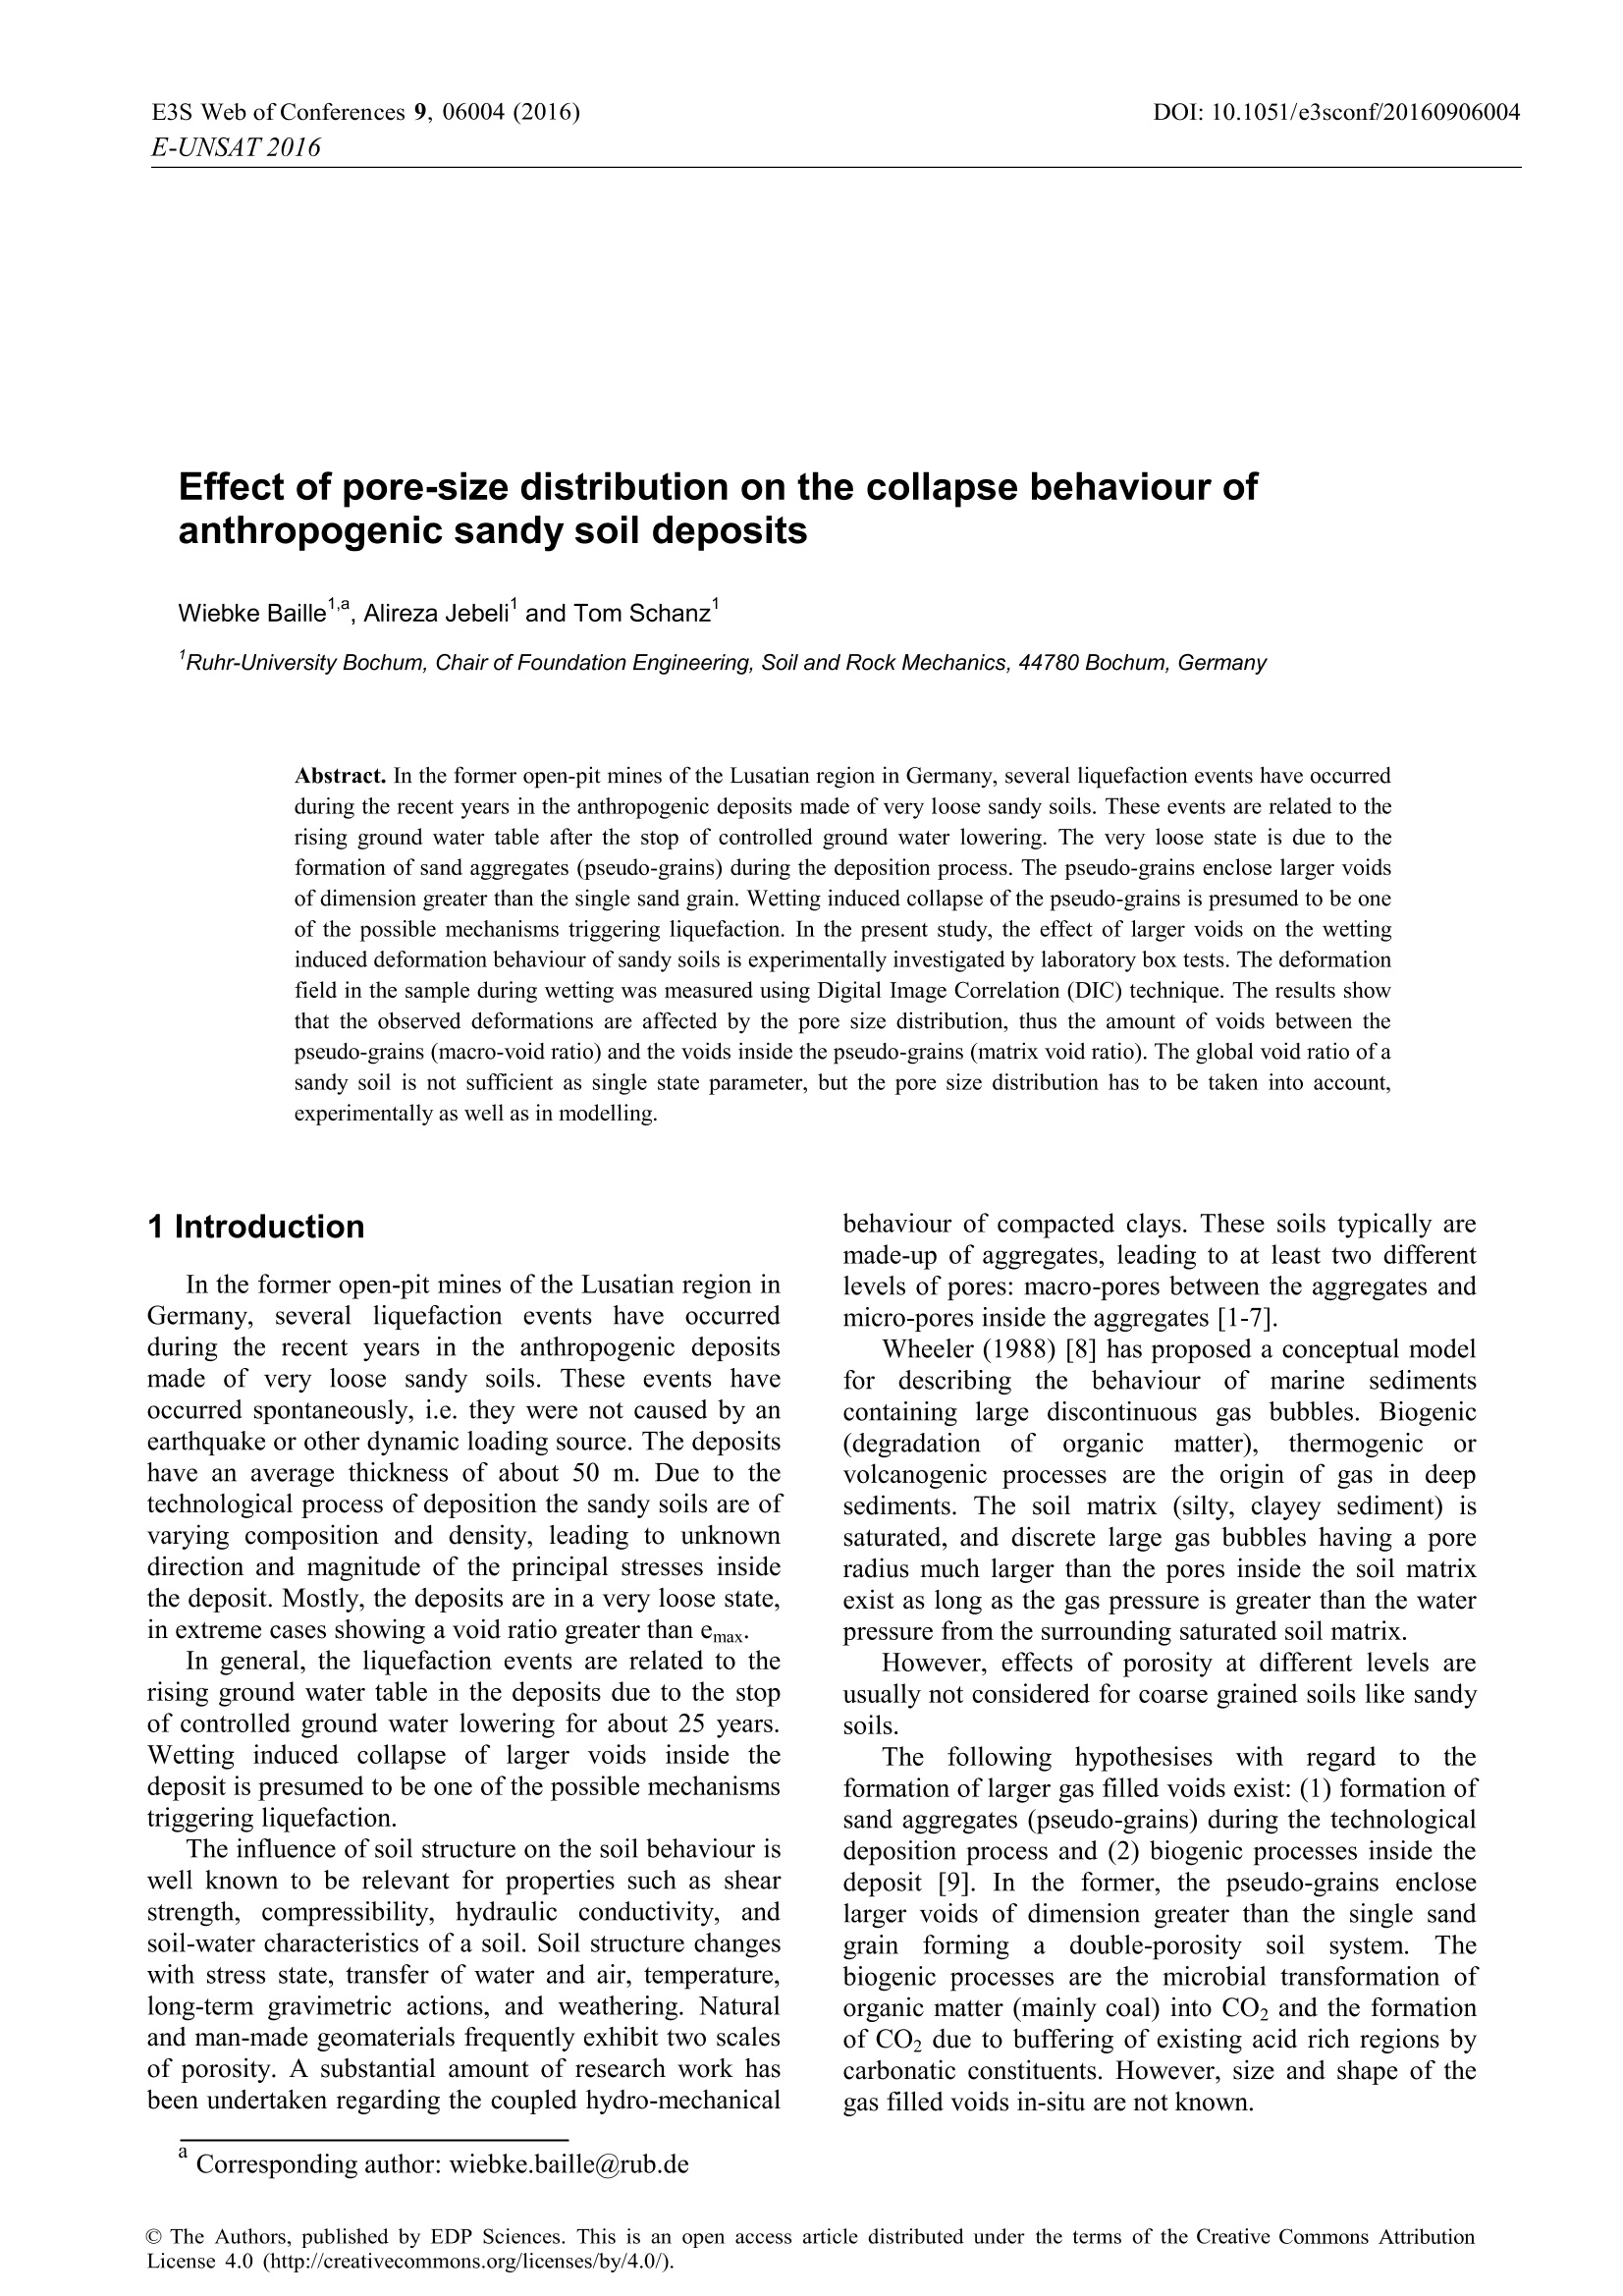
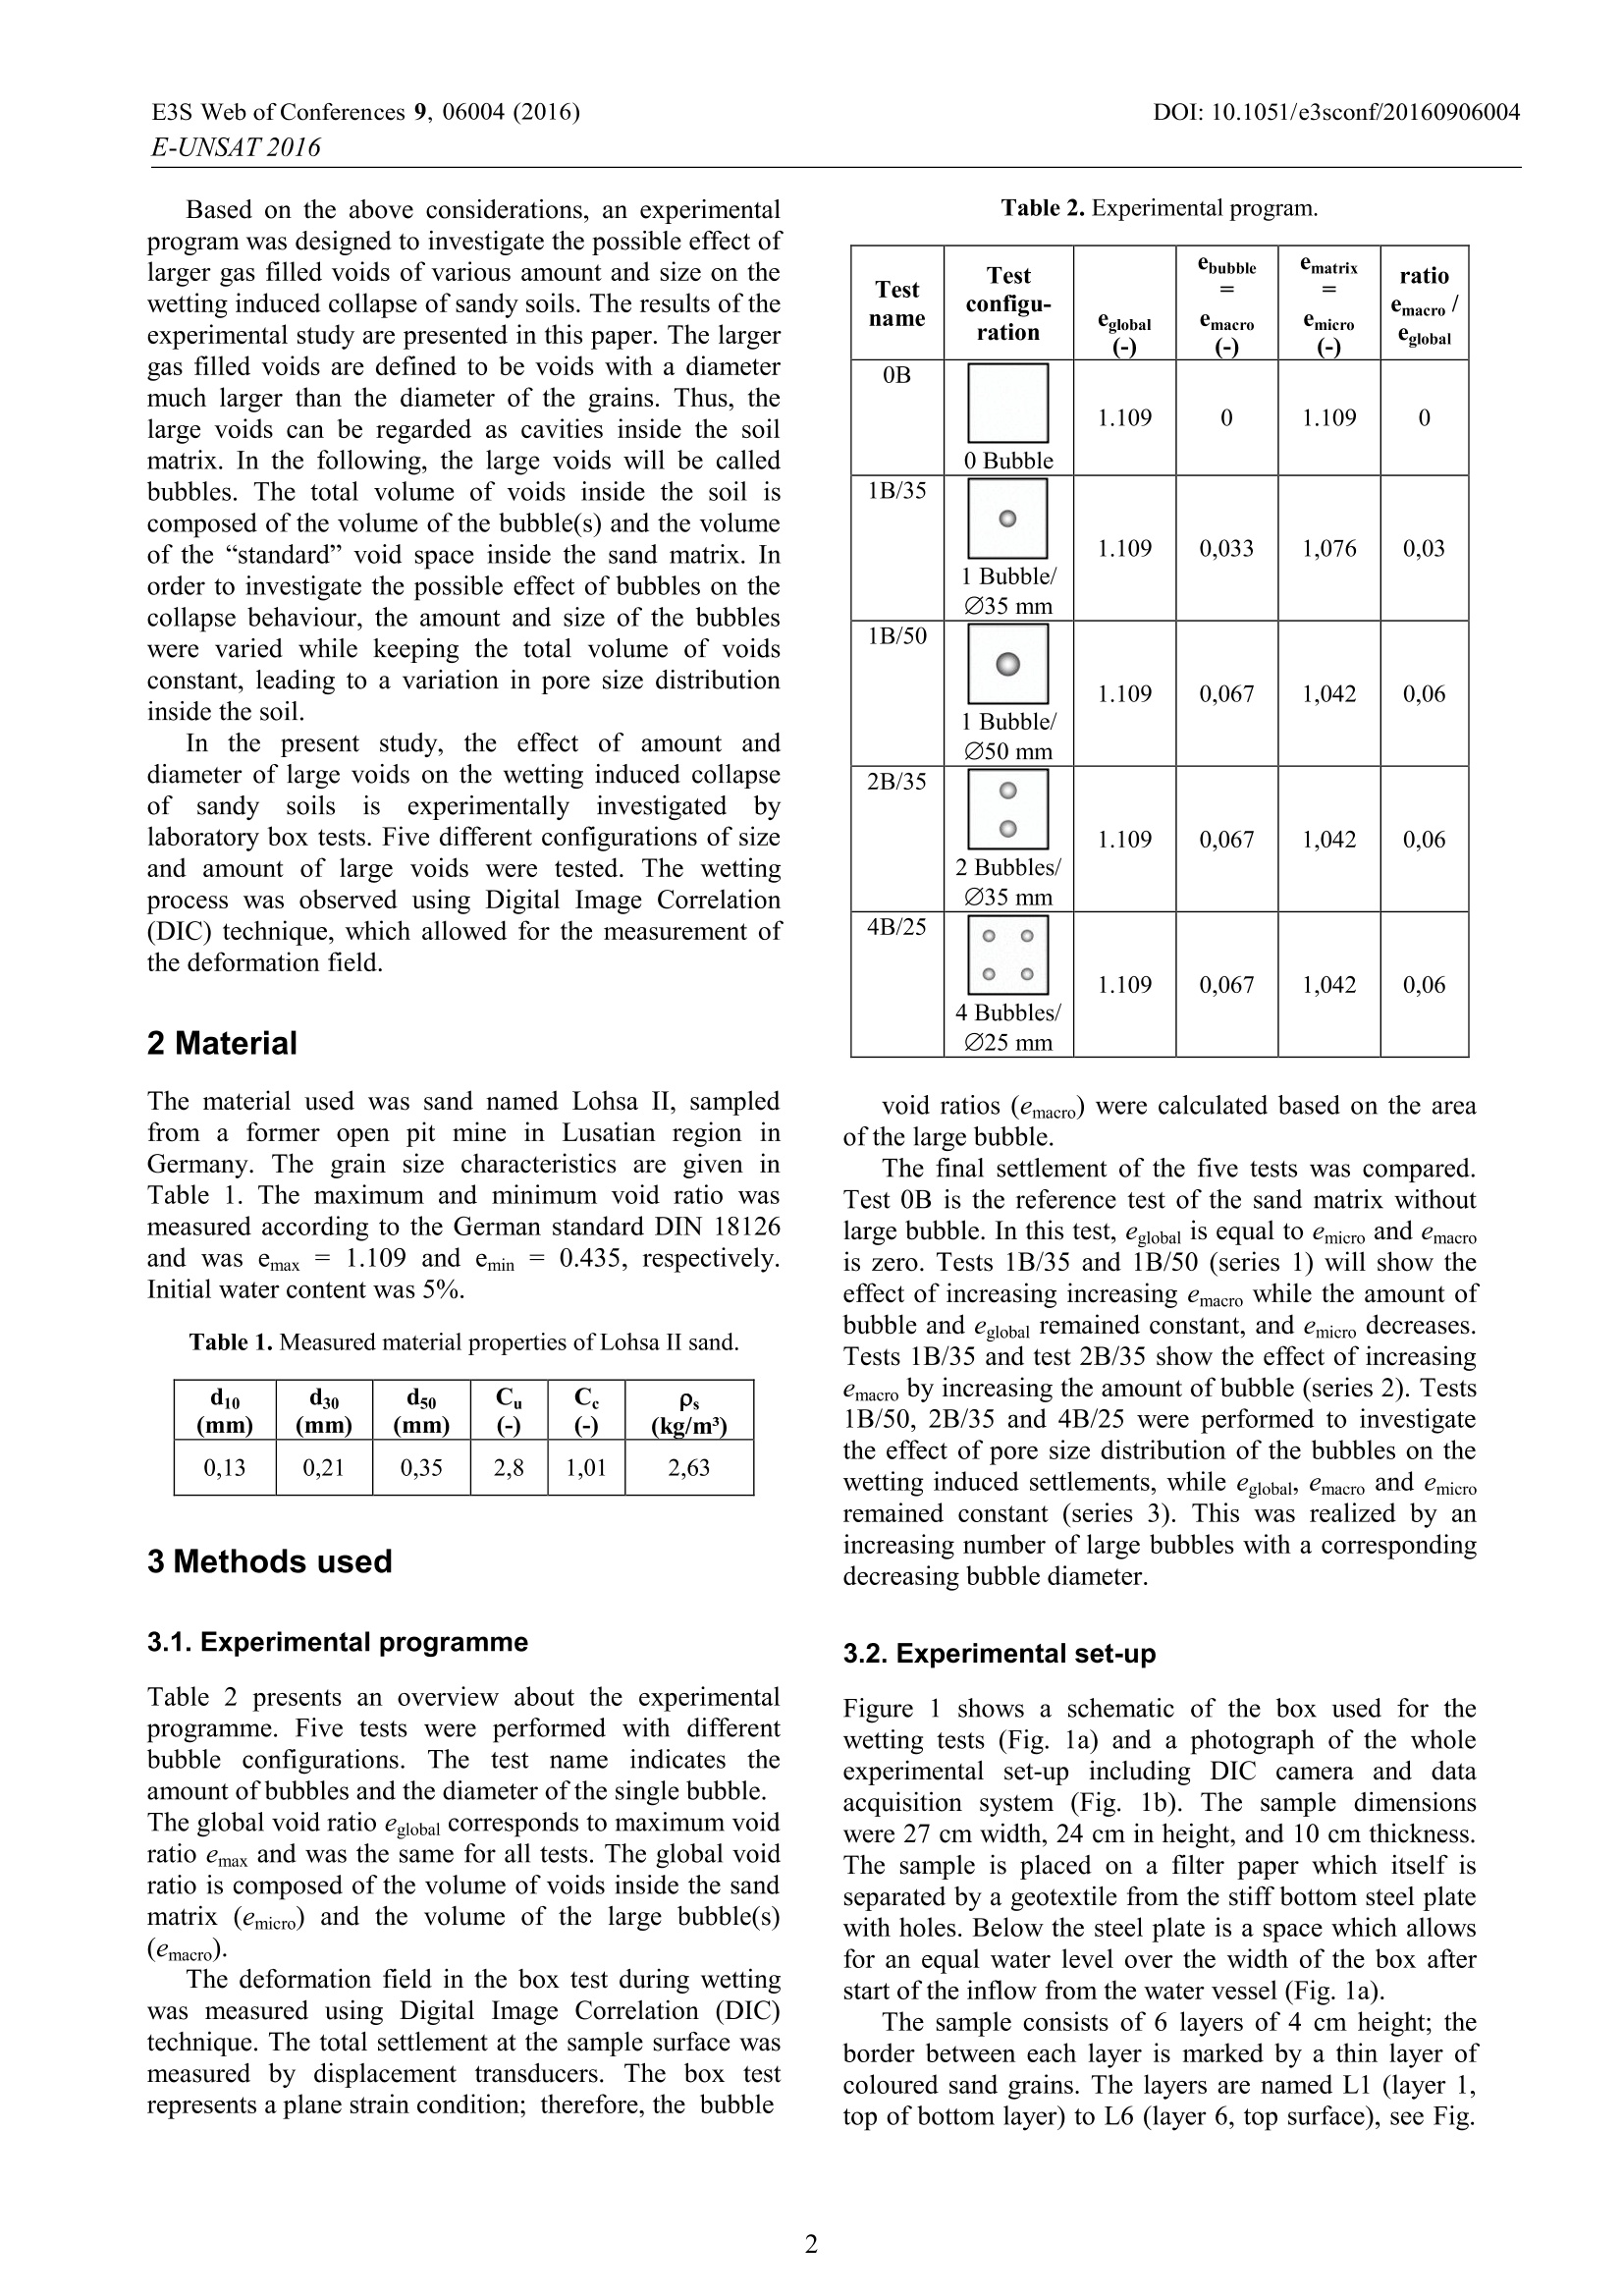
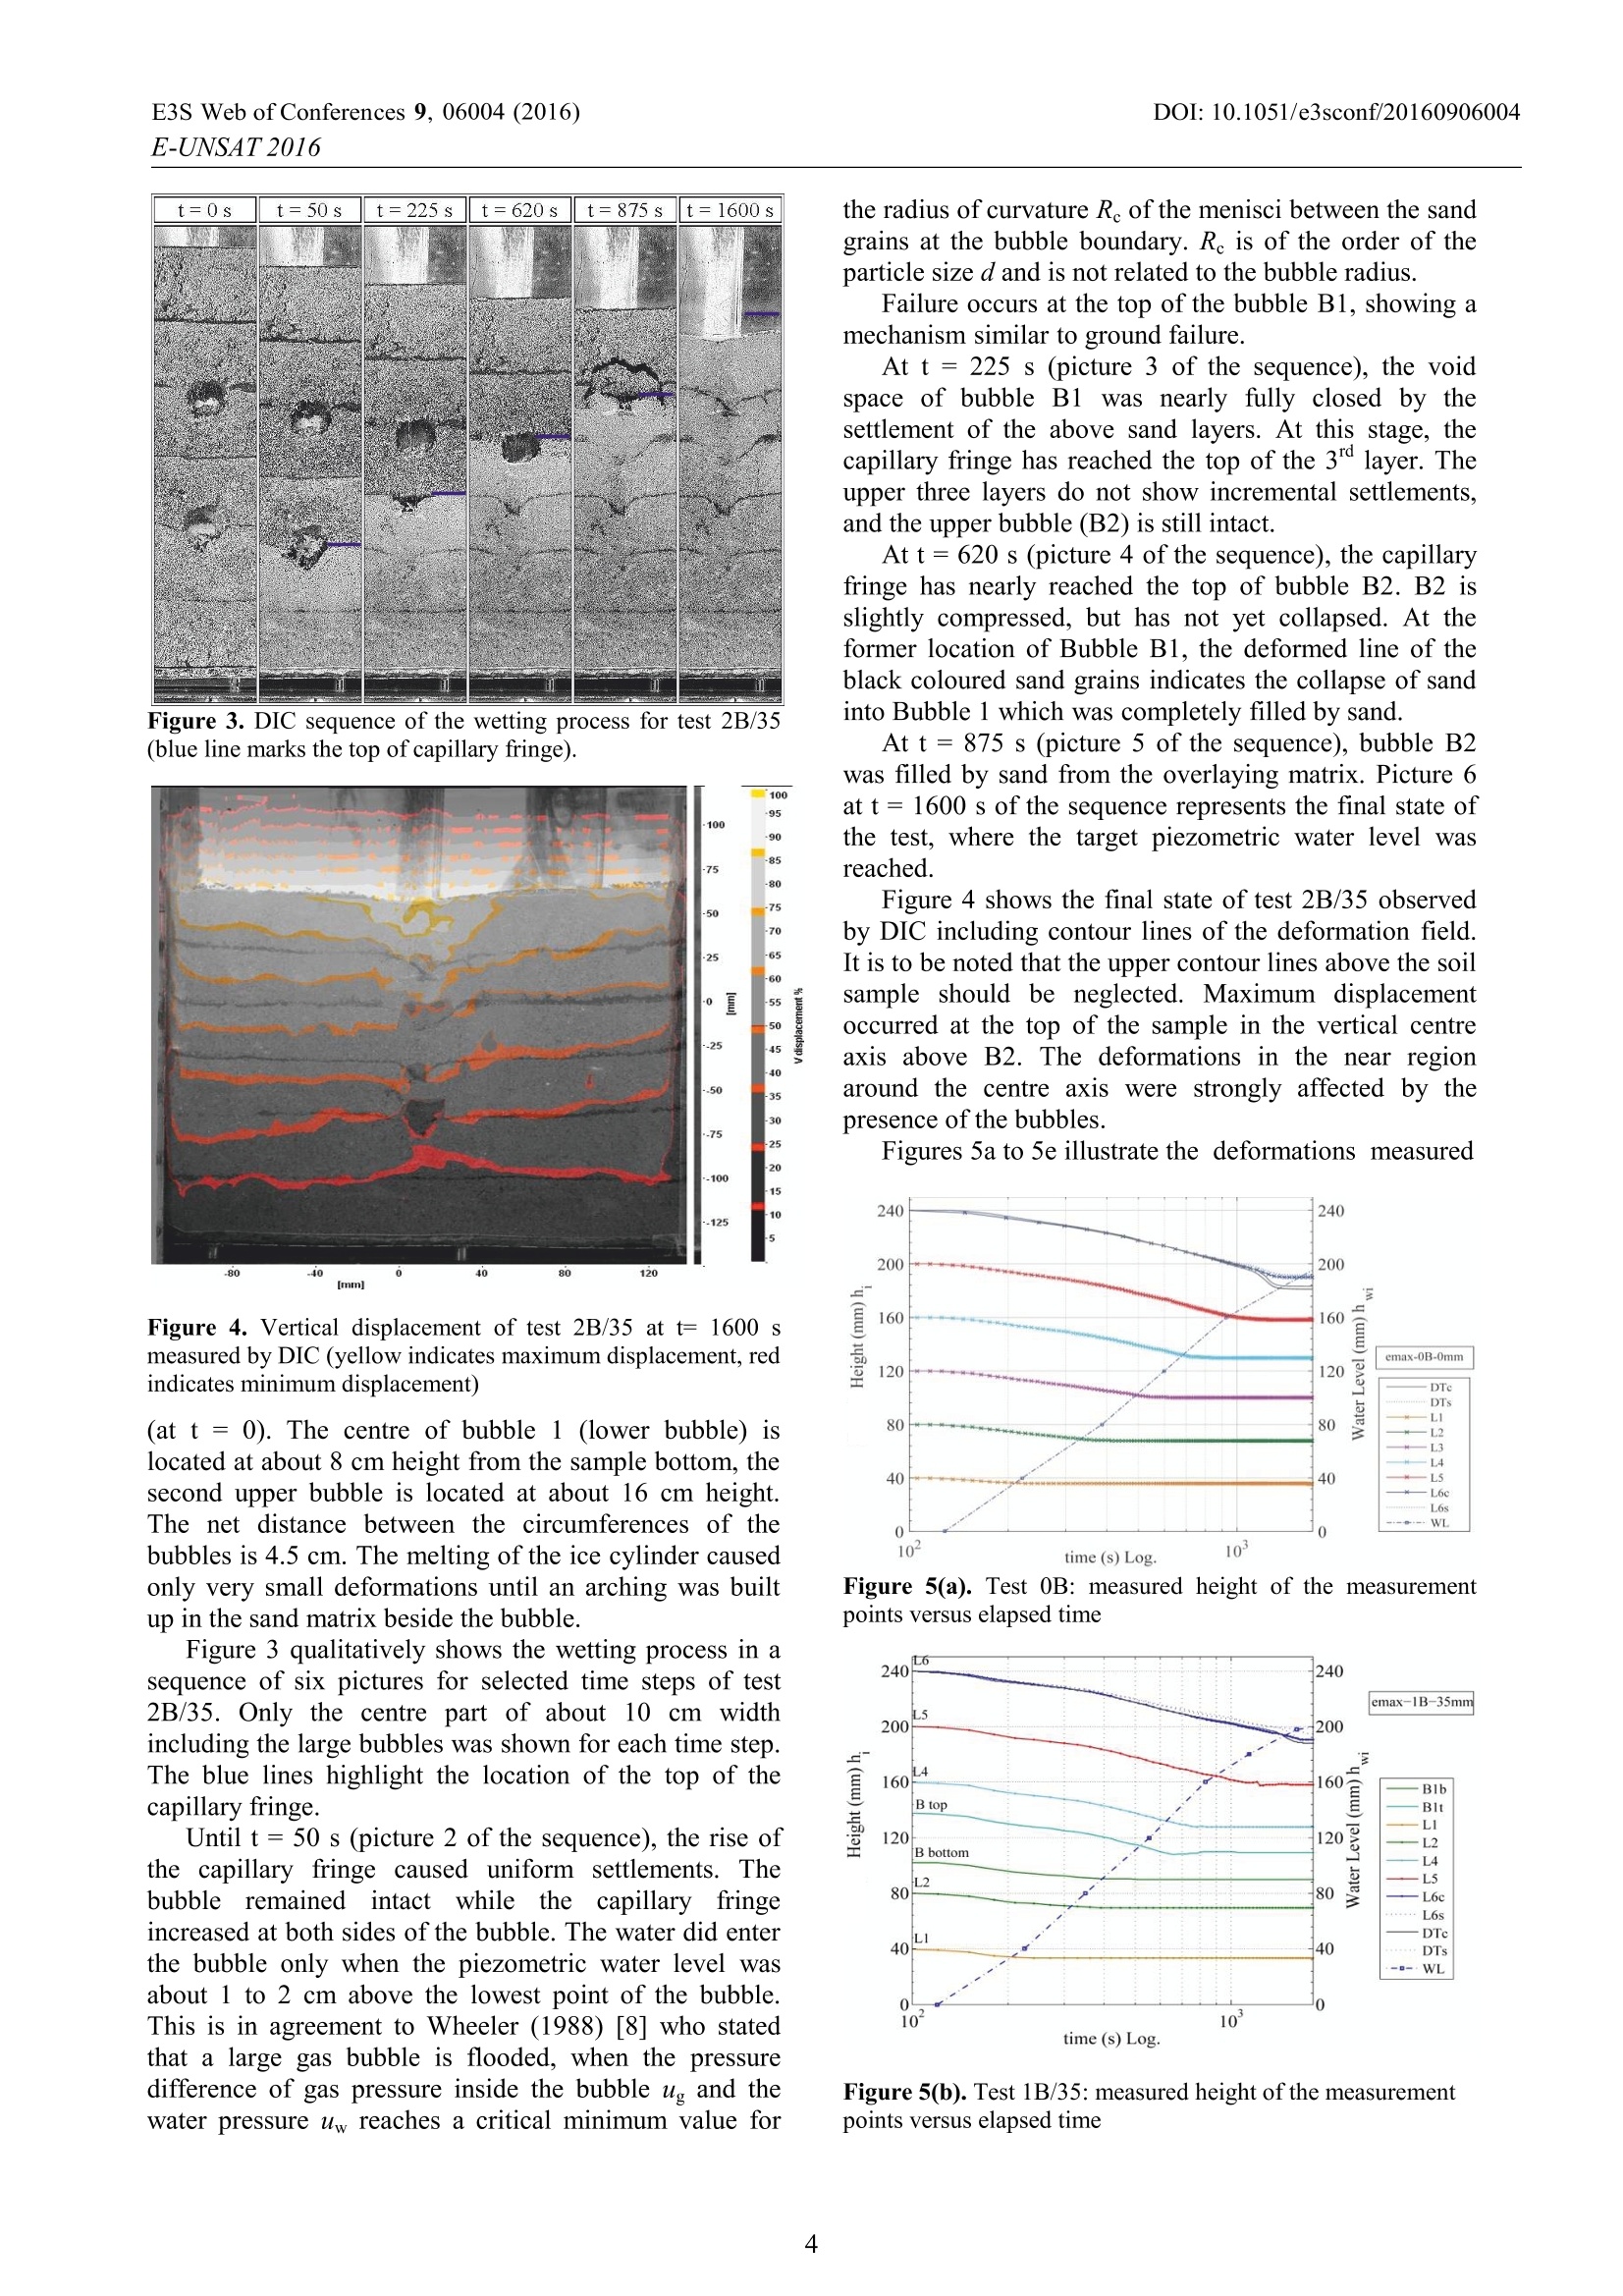
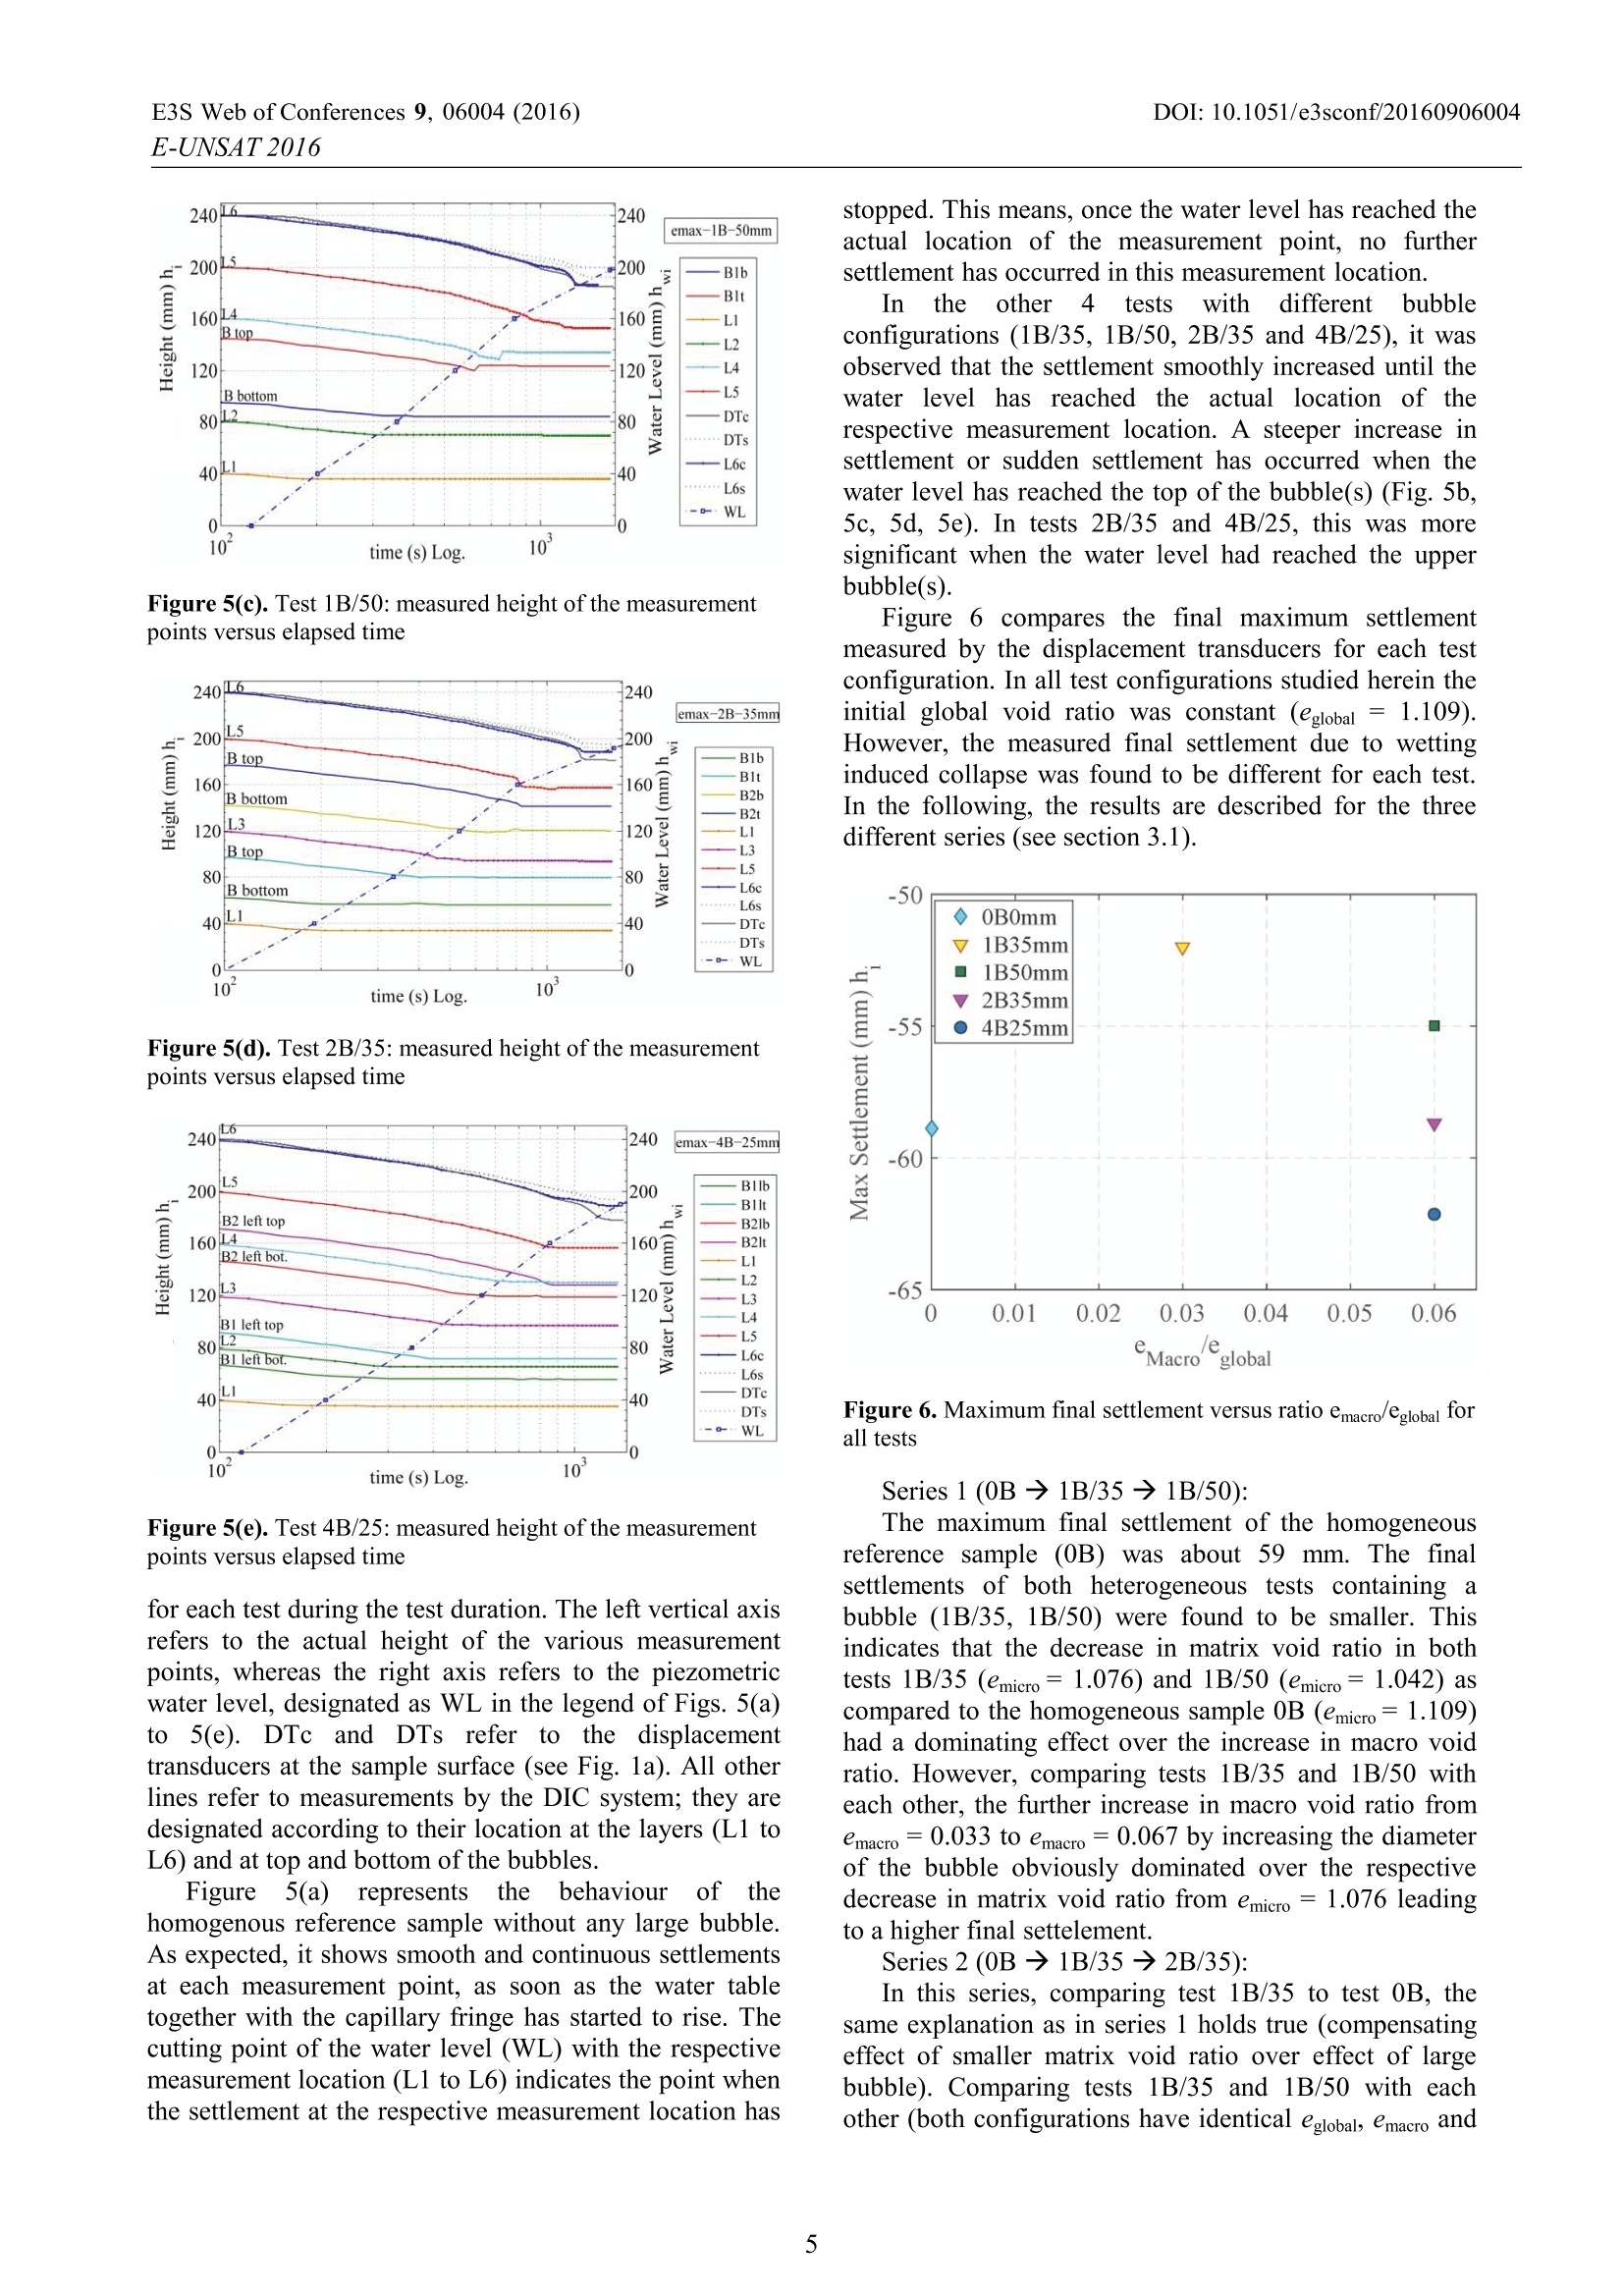
DOI: 10.1051/e3sconf/20160906004E3S Web of Conferences 9, 06004 (2016)E-UNSAT 2016 E3S Web of Conferences 9, 06004 (2016)DOI:10.1051/e3sconf/20160906004E-UNSAT 2016 Effect of pore-size distribution on the collapse behaviour ofanthropogenic sandy soil deposits Wiebke Baille1 Alireza Jebeli and Tom Schanz 'Ruhr-University Bochum, Chair of Foundation Engineering, Soil and Rock Mechanics, 44780 Bochum, Germany Abstract. In the former open-pit mines of the Lusatian region in Germany, several liquefaction events have occurredduring the recent years in the anthropogenic deposits made of very loose sandy soils. These events are related to therising ground water table after the stop of controlled ground water lowering. The very loose state is due to theformation of sand aggregates (pseudo-grains) during the deposition process. The pseudo-grains enclose larger voidsof dimension greater than the single sand grain. Wetting induced collapse of the pseudo-grains is presumed to be oneof the possible mechanisms triggering liquefaction. In the present study, the effect of larger voids on the wettinginduced deformation behaviour of sandy soils is experimentally investigated by laboratory box tests. The deformationfield in the sample during wetting was measured using Digital Image Correlation (DIC) technique. The results showthat the observed deformations are affected by the pore size distribution, thus the amount of voids between thepseudo-grains (macro-void ratio) and the voids inside the pseudo-grains (matrix void ratio). The global void ratio of asandy soil is not sufficient as single state parameter, but the pore size distribution has to be taken into account,experimentally as well as in modelling. 1 Introduction In the former open-pit mines of the Lusatian region inGermany, severalliquefaction events have occurredduring the recent years in the anthropogenic depositsmade of very loose sandy soils. These events haveoccurred spontaneously, i.e. they were not caused by anearthquake or other dynamic loading source. The depositshave an average thickness of about 50 m. Due to thetechnological process of deposition the sandy soils are ofvarying composition and density, leading to unknowndirection and magnitude of the principal stresses insidethe deposit. Mostly, the deposits are in a very loose state,in extreme cases showing a void ratio greater than emax. In general, the liquefaction events are related to therising ground water table in the deposits due to the stopof controlled ground water lowering for about 25 years.Wetting induced collapse of larger voids inside thedeposit is presumed to be one of the possible mechanismstriggering liquefaction. The influence of soil structure on the soil behaviour iswell known to be relevant for properties such as shearstrength, compressibility, hydraulic conductivity, andsoil-water characteristics of a soil. Soil structure changeswith stress state, transfer of water and air, temperature,long-term gravimetric actions, and weathering. Naturaland man-made geomaterials frequently exhibit two scalesof porosity. A substantial amount of research work hasbeen undertaken regarding the coupled hydro-mechanical ( “Corresponding author: wiebke.baille@rub.de ) behaviour of compacted clays. These soils typically aremade-up of aggregates, leading to at least two differentlevels of pores: macro-pores between the aggregates andmicro-pores inside the aggregates [1-7]. Wheeler (1988) [8] has proposed a conceptual modelfor describing the behaviourr of marine sedimentscontaining large discontinuous gas bubbles. Biogenic(degradationoforganic matter),thermogenic orvolcanogenic processes are the origin of gas in deepsediments. The soil matrix (silty, clayey sediment) issaturated, and discrete large gas bubbles having a poreradius much larger than the pores inside the soil matrixexist as long as the gas pressure is greater than the waterpressure from the surrounding saturated soil matrix. However, effects of porosity at different levels areusually not considered for coarse grained soils like sandysoils. The following hhypothesiseswith regard to theformation of larger gas filled voids exist: (1) formation ofsand aggregates (pseudo-grains) during the technologicaldeposition process and (2) biogenic processes inside thedeposit [9]. In the former, the pseudo-grains encloselarger voids of dimension greater than the single sandgrainnforminggadouble-porosity soilsystem. Thebiogenic processes are the microbial transformation oforganic matter (mainly coal) into CO2 and the formationof CO2 due to buffering of existing acid rich regions bycarbonatic constituents. However, size and shape of thegas filled voids in-situ are not known. ( C T he A u thors, published by EDP Sci e nces. This is an open acc e ss art i cle di s tributed u n der t h e t e rms o f t h e C r eative Commons Att r ibutionLicense 4.0 (http://creativecommons.org/licenses/by/4.0/). ) Based on the above considerations, an experimentalprogram was designed to investigate the possible effect oflarger gas filled voids of various amount and size on thewetting induced collapse of sandy soils. The results of theexperimental study are presented in this paper. The largergas filled voids are defined to be voids with a diametermuch larger than the diameter of the grains. Thus, thelarge voids can be regarded as cavities inside the soilmatrix. In the following, the large voids will be calledbubbles. The total volume of voids inside the soil iscomposed of the volume of the bubble(s) and the volumeof the “standard”void space inside the sand matrix. Inorder to investigate the possible effect of bubbles on thecollapse behaviour, the amount and size of the bubbleswere varied while keeping the total volume of voidsconstant, leading to a variation in pore size distributioninside the soil. In the present study, the effect of amount anddiameter of large voids on the wetting induced collapseof sandy soils is experimentally investigated bylaboratory box tests. Five different configurations of sizeand amount of large voids were tested. The wettingprocess was observed using Digital Image Correlation(DIC) technique, which allowed for the measurement ofthe deformation field. 2 Material The material used was sand named Lohsa II, sampledfrom a former open pit mine in Lusatian region inGermany. The grain size characteristics are given inTable 1. The maximum and minimum void ratio wasmeasured according to the German standard DIN 18126and was emax=1.109 and emin = 0.435, respectively.Initial water content was 5%. Table 1. Measured material properties of Lohsa II sand. d10(mm) d30(mm) d50(mm) C (-) Cc(-) Ps (kg/m’) 0,13 0,21 0,35 2,8 1,01 2,63 3 Methods used 3.1. Experimental programme Table 2 presents an overview about the experimentalprogramme. Five tests were performed with differentbubble configurations. The test name indicates theamount of bubbles and the diameter of the single bubble.The global void ratio eglobal corresponds to maximum voidratio emax and was the same for all tests. The global voidratio is composed of the volume of voids inside the sandmatrix (emicro) and the volume of the large bubble(s)(emacro). The deformation field in the box test during wettingwas measured using Digital Image Correlation (DIC)technique. The total settlement at the sample surface wasmeasured by displacement transducers. The box testrepresents a plane strain condition; therefore, the bubble Table 2. Experimental program. Testname Testconfigu-ration eglobal(-) ebubble=emacro( ematrix:emicro(-) ratioemacro/eglobal 0B 0 Bubble 1.109 0 1.109 0 1B/35 1.109 0,033 1,076 0,03 O 1.109 0,067 1,042 0,06 1B/50 2B/35 1.109 0,067 1,042 0,06 4B/25 1.109 0,067 1,042 0,06 void ratios (emacro) were calculated based on the areaof the large bubble. The final settlement of the five tests was compared.Test 0B is the reference test of the sand matrix withoutlarge bubble. In this test, eglobal is equal to emicro and emacrois zero. Tests 1B/35 and 1B/50 (series 1) will show theeffect of increasing increasing emacro while the amount ofbubble and eglobal remained constant, and emicro decreases.Tests 1B/35 and test 2B/35 show the effect of increasingemacro by increasing the amount of bubble (series 2). Tests1B/50, 2B/35 and 4B/25 were performed to investigatethe effect of pore size distribution of the bubbles on thewetting induced settlements, while eglobal emacro and emicroremained constant (series 3). This was realized by anincreasing number of large bubbles with a correspondingdecreasing bubble diameter. 3.2. Experimental set-up Figure 1 shows a schematic of the box used for thewetting tests (Fig. 1a) and a photograph of the wholeexperimental set-up including DIC camera and dataacquisition system (Fig. 1b). The sample dimensionswere 27 cm width, 24 cm in height, and 10 cm thickness.The sample is placed on a filter paper which itself isseparated by a geotextile from the stiff bottom steel platewith holes. Below the steel plate is a space which allowsfor an equal water level over the width of the box afterstart of the inflow from the water vessel (Fig. 1a). The sample consists of 6 layers of 4 cm height; theborder between each layer is marked by a thin layer ofcoloured sand grains. The layers are named L1 (layer 1,top of bottom layer) to L6 (layer 6, top surface), see Fig. la. The results ofthe DIC measurement are presented forselected points. These points are in the vertical centreaxis on top of each layer as well as at the top and thebottom of the large bubble(s). They are marked by a reddot in Fig. 1a. A water vessel (overflow vessel) providing a constantupper pressure head is connected by a tube to the bottomof the box. Target water level was at top of level 5corresponding to 20 cm of initial sample height. At theend of the test, full saturation was reached in the wholespecimen. Two displacement transducers (DT) were placed onthe surface of the specimen (top of layer 6). One of themwas located in the centre of the top surface (DTc) and onebetween DTc and at border of the box (DTs). The latter ismarked by a green dot in Fig. 1a. The measurements ofdisplacement transducer DTc were used to verify the DICmeasurements at top of layer 6 (L6). Two DIC cameras (Fig. 1b) are placed in front of thebox to record the deformation field over sample heightand width during the wetting process. The analysis of themeasured data is performed using software DaVis 7.2 ofthe company LaVision GmbH. Figure 1(a). Schematic of the box and soil sample (example oftest 2B/35) Figure 1(b). Photograph of experimental set-up (example oftest 1B/35) 3.3. Test procedure The testing program as shown in Table 2 was performed.All tests were performed with 4% initial water contentand the respective void ratios (eglobal, emicro, emacro) asshown in Table 2. At first, a geotextile of thickness 4 mm covered by afilter paper were placed at the base of the box. Then, themass of sand needed for each layer of 4 cm height for the desired matrix void ratio emicro was placed manually. Thesand was equally distributed and slightly compacted so asto reach a homogenous sand matrix throughout thesample. At the top of each layer, black sand grains arepoured to mark the boundary between two subsequentlayers in order to better visualize the deformations of therespective layer. At the desired location, prepared hollow ice cylinderswere placed horizontally to serve as shuttering to createthe large voids. Further, sand was placed above the largevoids stabilized by the ice cylinders until the targetsample height of 24 cm. The sample preparation wasfinalised before the cylinder was melt. After end of sample preparation and after the icecylinder was melt, the water vessel is connected to thebox. The data acquisition system for the DIC and thedisplacement transducers was started. The wetting teststarted when the inlet valve was opened The water firstly distributes in the empty space belowthe base plate at the bottom of the specimen, and then thewater level rises equally over the whole sample width.The piezometric water level can be read from the tube atthe left side of the sample box (see Fig. 1a). The waterlevel in the vessel is kept constant while the water levelin the sample did increase. Thus, during the test, thehydraulic gradient was not constant. For each test, it tookapproximately 30 min until the target water level of 20cm was reached and deformation process has reachedequilibrium. 4 Results In this section, the observations during the tests accordingto the testing program shown in Table 2 are presented. Inthe first part, the qualitative observations by DICtechnique are described. In the second part, the measureddeformations over time and the final deformations of thedifferent test configurations are quantitatively compared. Figures 2 to 4 present qualitative observations for test2B/35 (i.e., 2 bubbles of diameter 35 mm embedded inthe homogenous sand matrix). Figure 2 shows the initialstate of the sample just before start of the wetting process Figure 2. Initial state at t=0 s of test 2B/35 (obtained fromDIC). Figure 3. DIC sequence of the wetting process for test 2B/35(blue line marks the top of capillary fringe). 100 95 90 -80 75 70 -60 -45 40 35 -20 15 10 Figure 4. Vertical displacement of test 2B/35 at t=1600 smeasured by DIC (yellow indicates maximum displacement, redindicates minimum displacement) (at t=0). The centre of bubble 1 (lower bubble) islocated at about 8 cm height from the sample bottom, thesecond upper bubble is located at about 16 cm height.The net distance between the circumferences of thebubbles is 4.5 cm. The melting of the ice cylinder causedonly very small deformations until an arching was builtup in the sand matrix beside the bubble. Figure3 qualitatively shows the wetting process in asequence of six pictures for selected time steps of test2B/35. Only the centre part of about 10 cm widthincluding the large bubbles was shown for each time step.The blue lines highlight the location of the top of thecapillary fringe. Until t =50 s (picture 2 of the sequence), the rise ofthe capillary fringe caused uniform settlements. Thebubble remained intact while the capillary fringeincreased at both sides of the bubble. The water did enterthe bubble only when the piezometric water level wasabout 1 to 2 cm above the lowest point of the bubble.This is in agreement to Wheeler (1988) [8] who statedthat a large gas bubble is flooded, when the pressuredifference of gas pressure inside the bubble ug and thewater pressure u reaches a critical minimum value for the radius of curvature R of the menisci between the sandgrains at the bubble boundary. R. is of the order of theparticle size d and is not related to the bubble radius. Failure occurs at the top of the bubble B1, showing amechanism similar to ground failure. At t= 225 s (picture 3 of the sequence), the voidspace of bubble B11 was nearly fully closed by thesettlement of the above sand layers. At this stage, thecapillary fringe has reached the top of the 3d layer. Theupper three layers do not show incremental settlements,and the upper bubble (B2) is still intact. At t = 620 s (picture 4 of the sequence), the capillaryfringe has nearly reached the top of bubble B2. B2 isslightly compressed, but has not yet collapsed. At theformer location of Bubble B1, the deformed line of theblack coloured sand grains indicates the collapse of sandinto Bubble 1 which was completely filled by sand. At t = 875 s (picture 5 of the sequence), bubble B2was filled by sand from the overlaying matrix. Picture 6at t=1600 s of the sequence represents the final state ofthe test, where the target piezometric water level wasreached. Figure 4 shows the final state of test 2B/35 observedby DIC including contour lines of the deformation field.It is to be noted that the upper contour lines above the soilsample should be neglected. Maximum displacementoccurred at the top of the sample in the vertical centreaxis above B2. The deformations in the near regionaround the centre axis were strongly affected by thepresence of the bubbles. Figures 5a to 5e illustrate the deformations measured Figure 5(a). Test 0B: measured height of the measurementpoints versus elapsed time Figure 5(b). Test 1B/35: measured height of the measurementpoints versus elapsed time Figure 5(c). Test 1B/50: measured height of the measurementpoints versus elapsed time Figure 5(d). Test 2B/35: measured height of the measurementpoints versus elapsed time Figure 5(e). Test 4B/25: measured height of the measurementpoints versus elapsed time for each test during the test duration. The left vertical axisrefers to the actual height of the various measurementpoints, whereas the right axis refers to the piezometricwater level, designated as WL in the legend of Figs. 5(a)to5(e). DTc and DTs refer tothe displacementtransducers at the sample surface (see Fig. 1a). All otherlines refer to measurements by the DIC system; they aredesignated according to their location at the layers (L1 toL6) and at top and bottom of the bubbles. Figuree55(a)i)representstIthebehaviourir of thehomogenous reference sample without any large bubble.As expected, it shows smooth and continuous settlementsat each measurement point, as soon as the water tabletogether with the capillary fringe has started to rise. Thecutting point of the water level (WL) with the respectivemeasurement location (L1 to L6) indicates the point whenthe settlement at the respective measurement location has stopped. This means, once the water level has reached theactual location of the measurement point, no furthersettlement has occurred in this measurement location. In theother4 tests with different bubbleconfigurations (1B/35,1B/50, 2B/35 and 4B/25), it wasobserved that the settlement smoothly increased until thewater level has reached the actuallocation of therespective measurement location. A steeper increase insettlement or sudden settlement has occurred when thewater level has reached the top of the bubble(s) (Fig. 5b,5c, 5d, 5e). In tests 2B/35 and 4B/25, this was moresignificant when the water level had reached the upperbubble(s). Figure 6 compares the final maximum settlementmeasured by the displacement transducers for each testconfiguration. In all test configurations studied herein theinitial global void ratio was constant (eglobal=1.109).However, the measured final settlement due to wettinginduced collapse was found to be different for each test.In the following, the results are described for the threedifferent series (see section 3.1). Figure 6. Maximum final settlement versus ratio emacro/eglobal forall tests The maximum final settlement of the homogeneousreference sample (0B) was about 59 mm. The finalsettlements of both heterogeneous tests containing abubble (1B/35, 1B/50) were found to be smaller. Thisindicates that the decrease in matrix void ratio in bothtests 1B/35 (emicro=1.076) and 1B/50 (emicro=1.042) ascompared to the homogeneous sample 0B (emicro=1.109)had a dominating effect over the increase in macro voidratio. However, comparing tests 1B/35 and 1B/50 witheach other, the further increase in macro void ratio fromemacro =0.033 to emacro = 0.067 by increasing the diameterof the bubble obviously dominated over the respectivedecrease in matrix void ratio from emicro =1.076 leadingto a higher final settelement. Series 2 (0B → 1B/35 → 2B/35): In this series, comparing test 1B/35 to test 0B, thesame explanation as in series 1 holds true (compensatingeffect of smaller matrix void ratio over effect of largebubble). Comparing tests 1B/35 and 1B/50 with eachother (both configurations have identical eglobal emacro and emicro), indicates that the increasing amount of bubbleslead to a higher settlement. Series 3 (0B→1B/50 → 2B/35→ 4B/25): Again, in this series, global void ratio is the same forthe homogeneous referencetest and the threeheterogeneous tests. Comparing the heterogeneous testswith each other (eglobal, emacro and emicro are constant)indicates that the increase in amount of bubbles, thus thechange in pore size distribution lead to an increase in thefinal measured wetting induced settlement. Overall, the test results indicate that consideration ofglobal void ratio of sand may not be the relevant stateparameter for describing the soil behaviour. 5 Summary In the present study, the effect of large voids (gasbubbles) and their pore size distribution on the wettinginduced collapse of sand was experimentally investigatedby laboratory box tests. Five different configurations ofsize and amount of large pores were tested. The wettingprocess was observed using Digital Image Correlation(DIC) technique and displacement transducers at thesurface. Overall, the test results indicate that for a sandy soilsystem with constant global void ratio, the incorporationof large gas bubbles of different size and amount affectedthe final measured settlement values to different extent. In general, the higher the amount of bubbles, thegreater were the settlements observed. For a smallernumber of gas bubbles (up to 2 in this study), thedecrease in matrix void ratio compensated the effect ofthe large gasbubble(s) leading to smaller or equalsettlements as compared to the homogeneous referencesample. In general the study indicates that the assumptionofa homogeneous soil system with a global void ratio asa state parameter may not be sufficient to fully describevolumetric soil behaviour. However, this experimental study is a first attempt toinvestigate the effect of larger voids on the wettinginduced collapse behaviour of anthropogenic sandy soildeposits. For better representing in-situ conditions, tests at larger scale and at representative stress level need to beperformed. The test instrumentation should be enlarged toalso measure water content, suction and pore waterpressure. References 1. S. Diamond, Pore size distributions in clays, Claysand Clay Minerals 18, 7-23 (1970) 2. S. Ahmed, C. Lovell, S. Diamond, Pore sizes andstrength of compacted clays, ASCE J. Geotech. Eng.Division 100, 407-425 (1974) 3. A. Gens, E. Alonso, A framework for the bahaviourof unsaturated expansive clays, Can. Geotech. J. 29,1013-1032(1992) 4. P. Delage, M. Audiguier, Y. Cui, M. Howat, Themicrostructure of a compacted silt, Can. Geotech. J.33,150-158(1996) 5. E. Romero, A. Gens, A. Lloret, Water permeability,water retention and microstructure of unsaturatedcompacted boom clay, Engineering Geology 54, 1-2,117-127(1999) 6. P. Delage, D. Marcial, Y. Cui, X. Ruiz, Ageingeffects in a compacted bentonite: a microstructureapproach, Geotechnique 56, 5,291-304 (2006) 7. R. Thom, R. Sivakumar, V. Sivakumar, E. Murray,P. Mackinnon, Pore size distribution of unsaturatedcompacted kaolin: the initial states and final statesfollowing saturation, Geotechnique 57,5, 469-474(2007) 8. S.J.Wheeler.A conceptual model for soilscontaining large gas bubbles, Geotechnique 38, 3,389-397 (1988) 9. N. Hoth, M. Ussath, A. Simon, Fluiddynamisch-hydrogeochemische Arbeitshypothesen zu rezentenBodenverfluissigungen imn Lausitzer Revier.Schriftenreihedes InstitutsfirBergbauuundSpezieltiefbau, TU Bergakademie Freiberg, Hrg. W.Kudla, Heft 5, Beitrage zum2. FKolloquiumBodenverfluissigungbeii上KippenndesLausitzerBraunkohlebergbaus, (2014) In the former open-pit mines of the Lusatian region in Germany, several liquefaction events have occurred during the recent years in the anthropogenic deposits made of very loose sandy soils. These events are related to the rising ground water table after the stop of controlled ground water lowering. The very loose state is due to the formation of sand aggregates (pseudo-grains) during the deposition process. The pseudo-grains enclose larger voids of dimension greater than the single sand grain. Wetting induced collapse of the pseudo-grains is presumed to be one of the possible mechanisms triggering liquefaction. In the present study, the effect of larger voids on the wetting induced deformation behaviour of sandy soils is experimentally investigated by laboratory box tests. The deformation field in the sample during wetting was measured using Digital Image Correlation (DIC) technique. The results show that the observed deformations are affected by the pore size distribution, thus the amount of voids between the pseudo-grains (macro-void ratio) and the voids inside the pseudo-grains (matrix void ratio). The global void ratio of a sandy soil is not sufficient as single state parameter, but the pore size distribution has to be taken into account, experimentally as well as in modelling.
确定

还剩4页未读,是否继续阅读?

产品配置单


北京欧兰科技发展有限公司为您提供《土壤,岩土沉积中形变,应变检测方案(其它无损检测仪器/设备)》,该方案主要用于其他中形变,应变检测,参考标准--,《土壤,岩土沉积中形变,应变检测方案(其它无损检测仪器/设备)》用到的仪器有LaVision StrainMaster材料应变形变成像测量系统、Imager LX PIV相机
相关方案
更多
该厂商其他方案
更多