


方案详情
文
In this paper, a comparative study between numerical and experimental results from
PIV measurements is presented in the case of two-dimensional electrohydrodynamic plumes that
arise when a sharp metallic blade, submerged in non conducting liquids, supports high electric
potential. Experiments and numerical simulations have been conducted in order to confront the
both approaches. A very good agreement has been found through velocity profiles and velocity
fields which testifies the relevance of our numerical model. For high potentials the jet flow issued
forth from the blade becomes unsteady and starts to flap on the vertical wall. Some captions of the
temporal evolution of the isocontours of charge density which is not accessible from experiment are
presented thanks to the numerical simulation.
方案详情

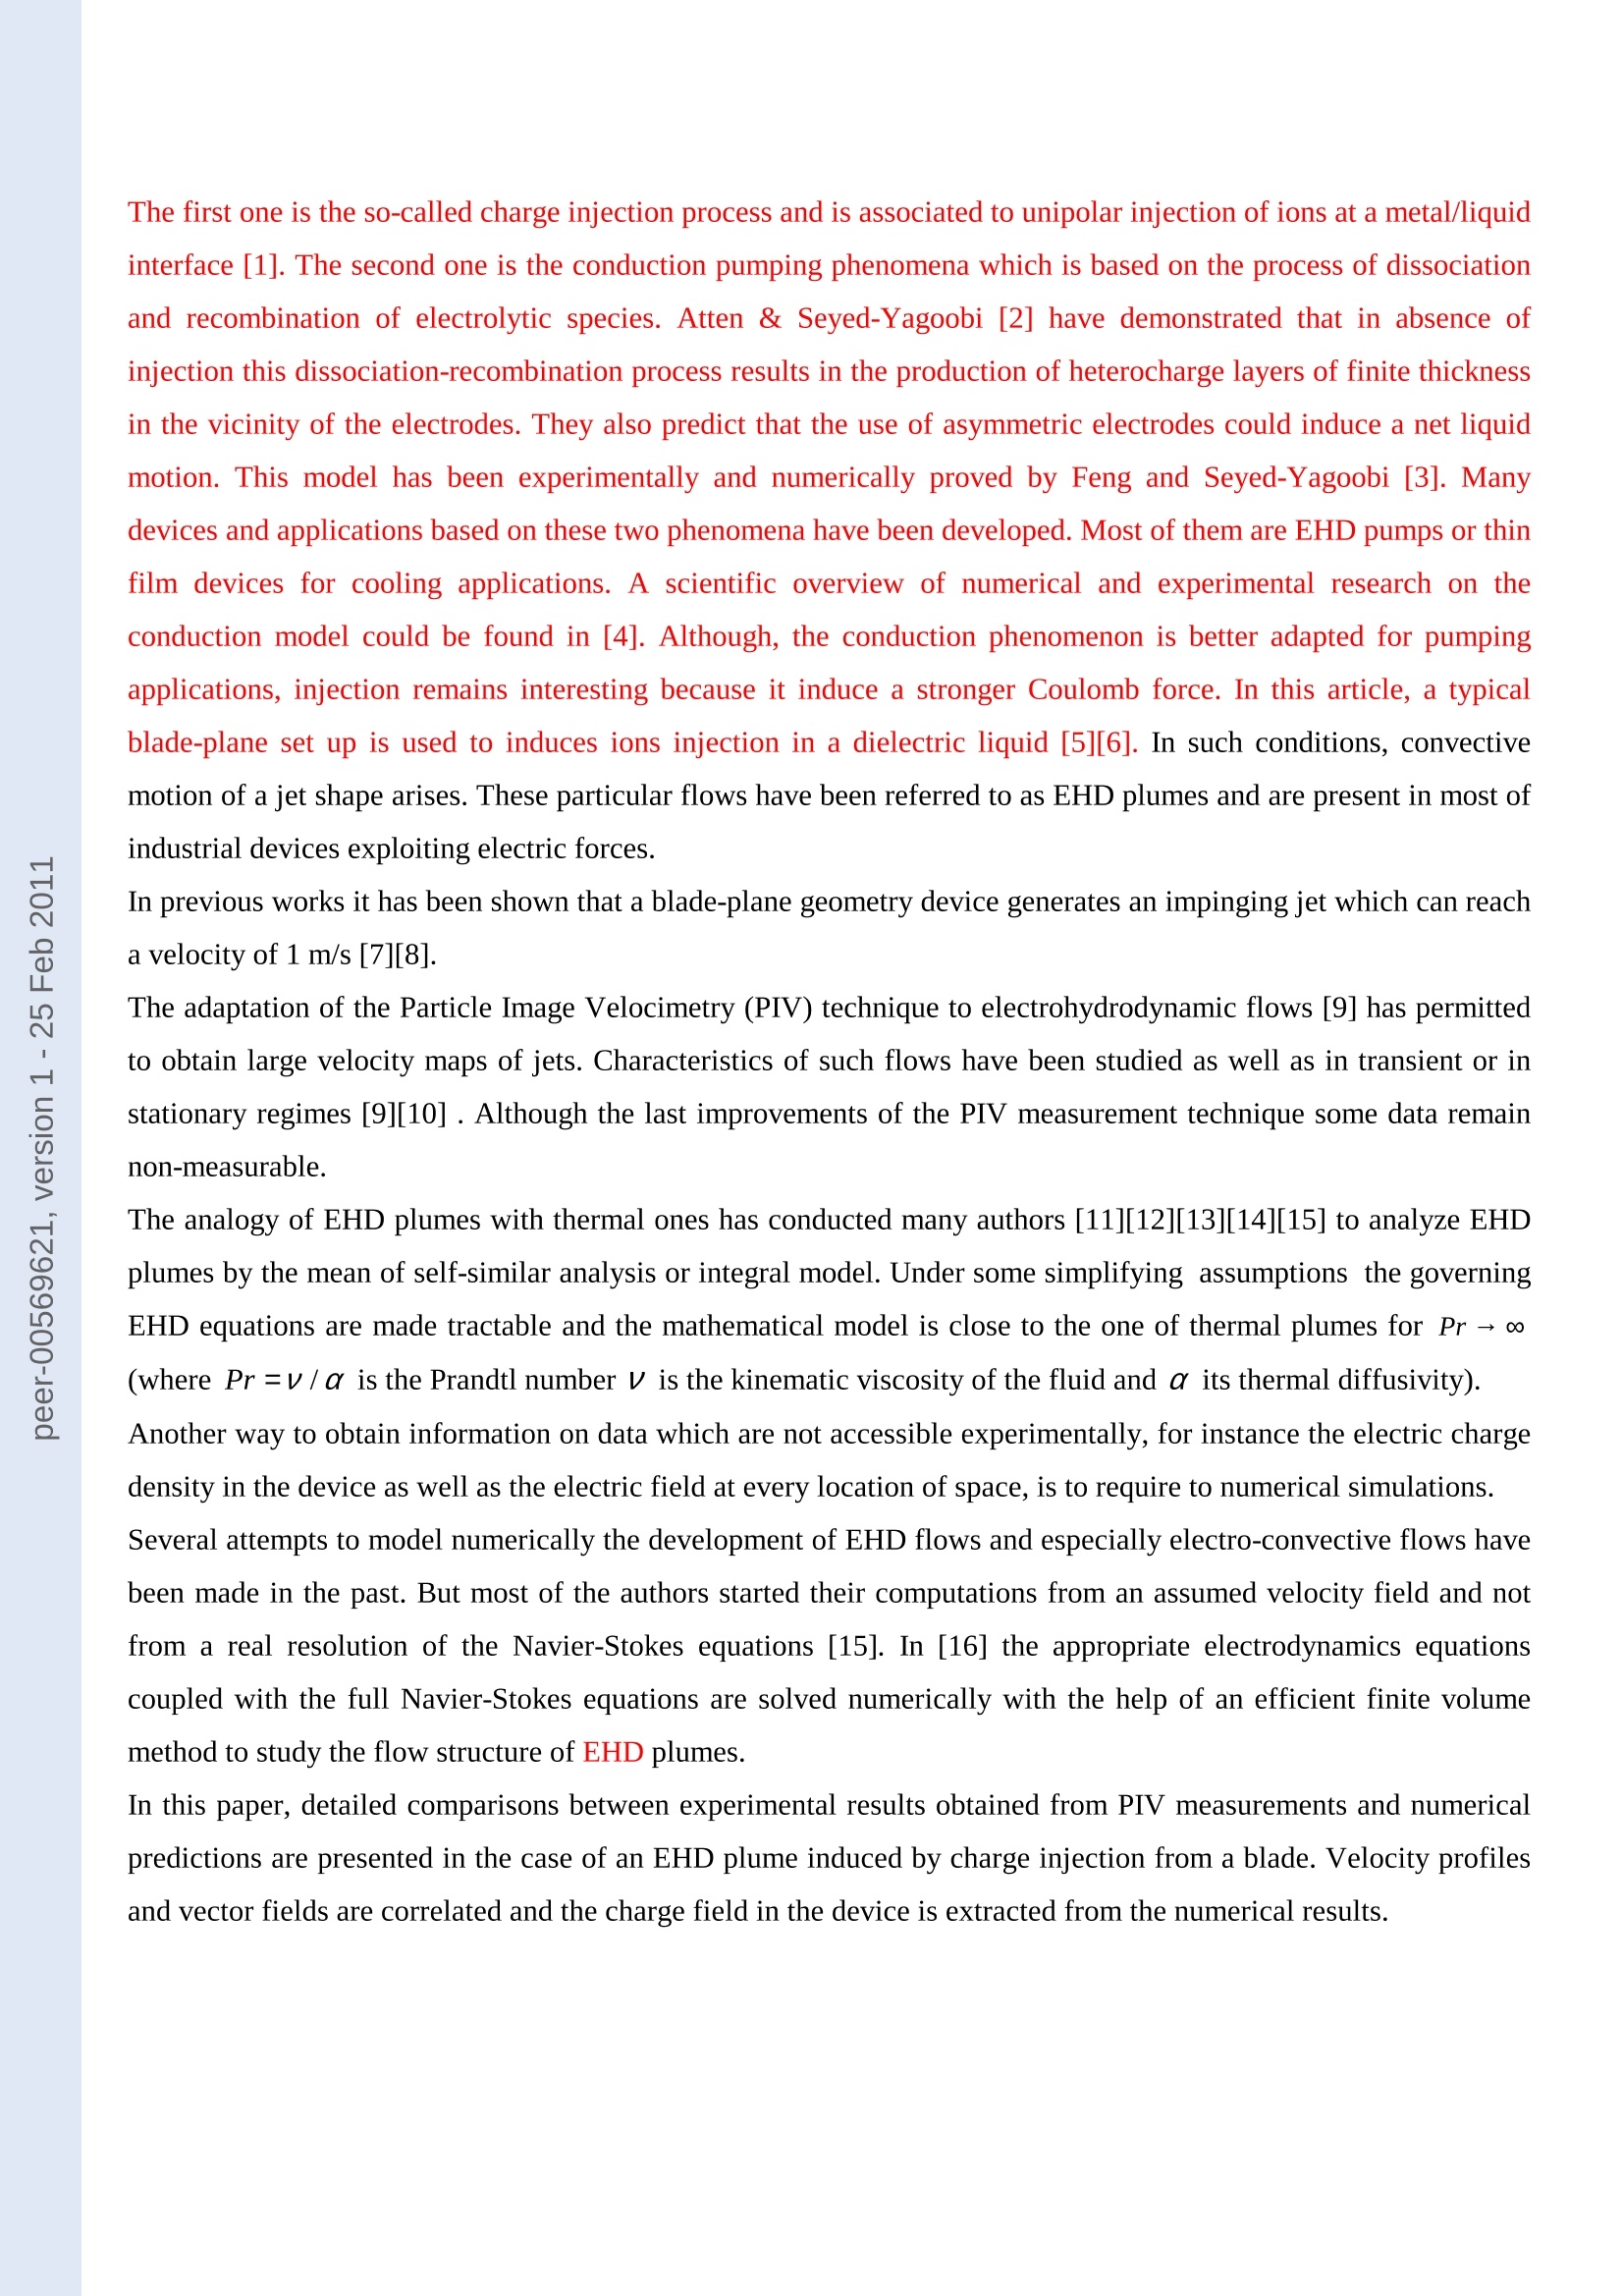
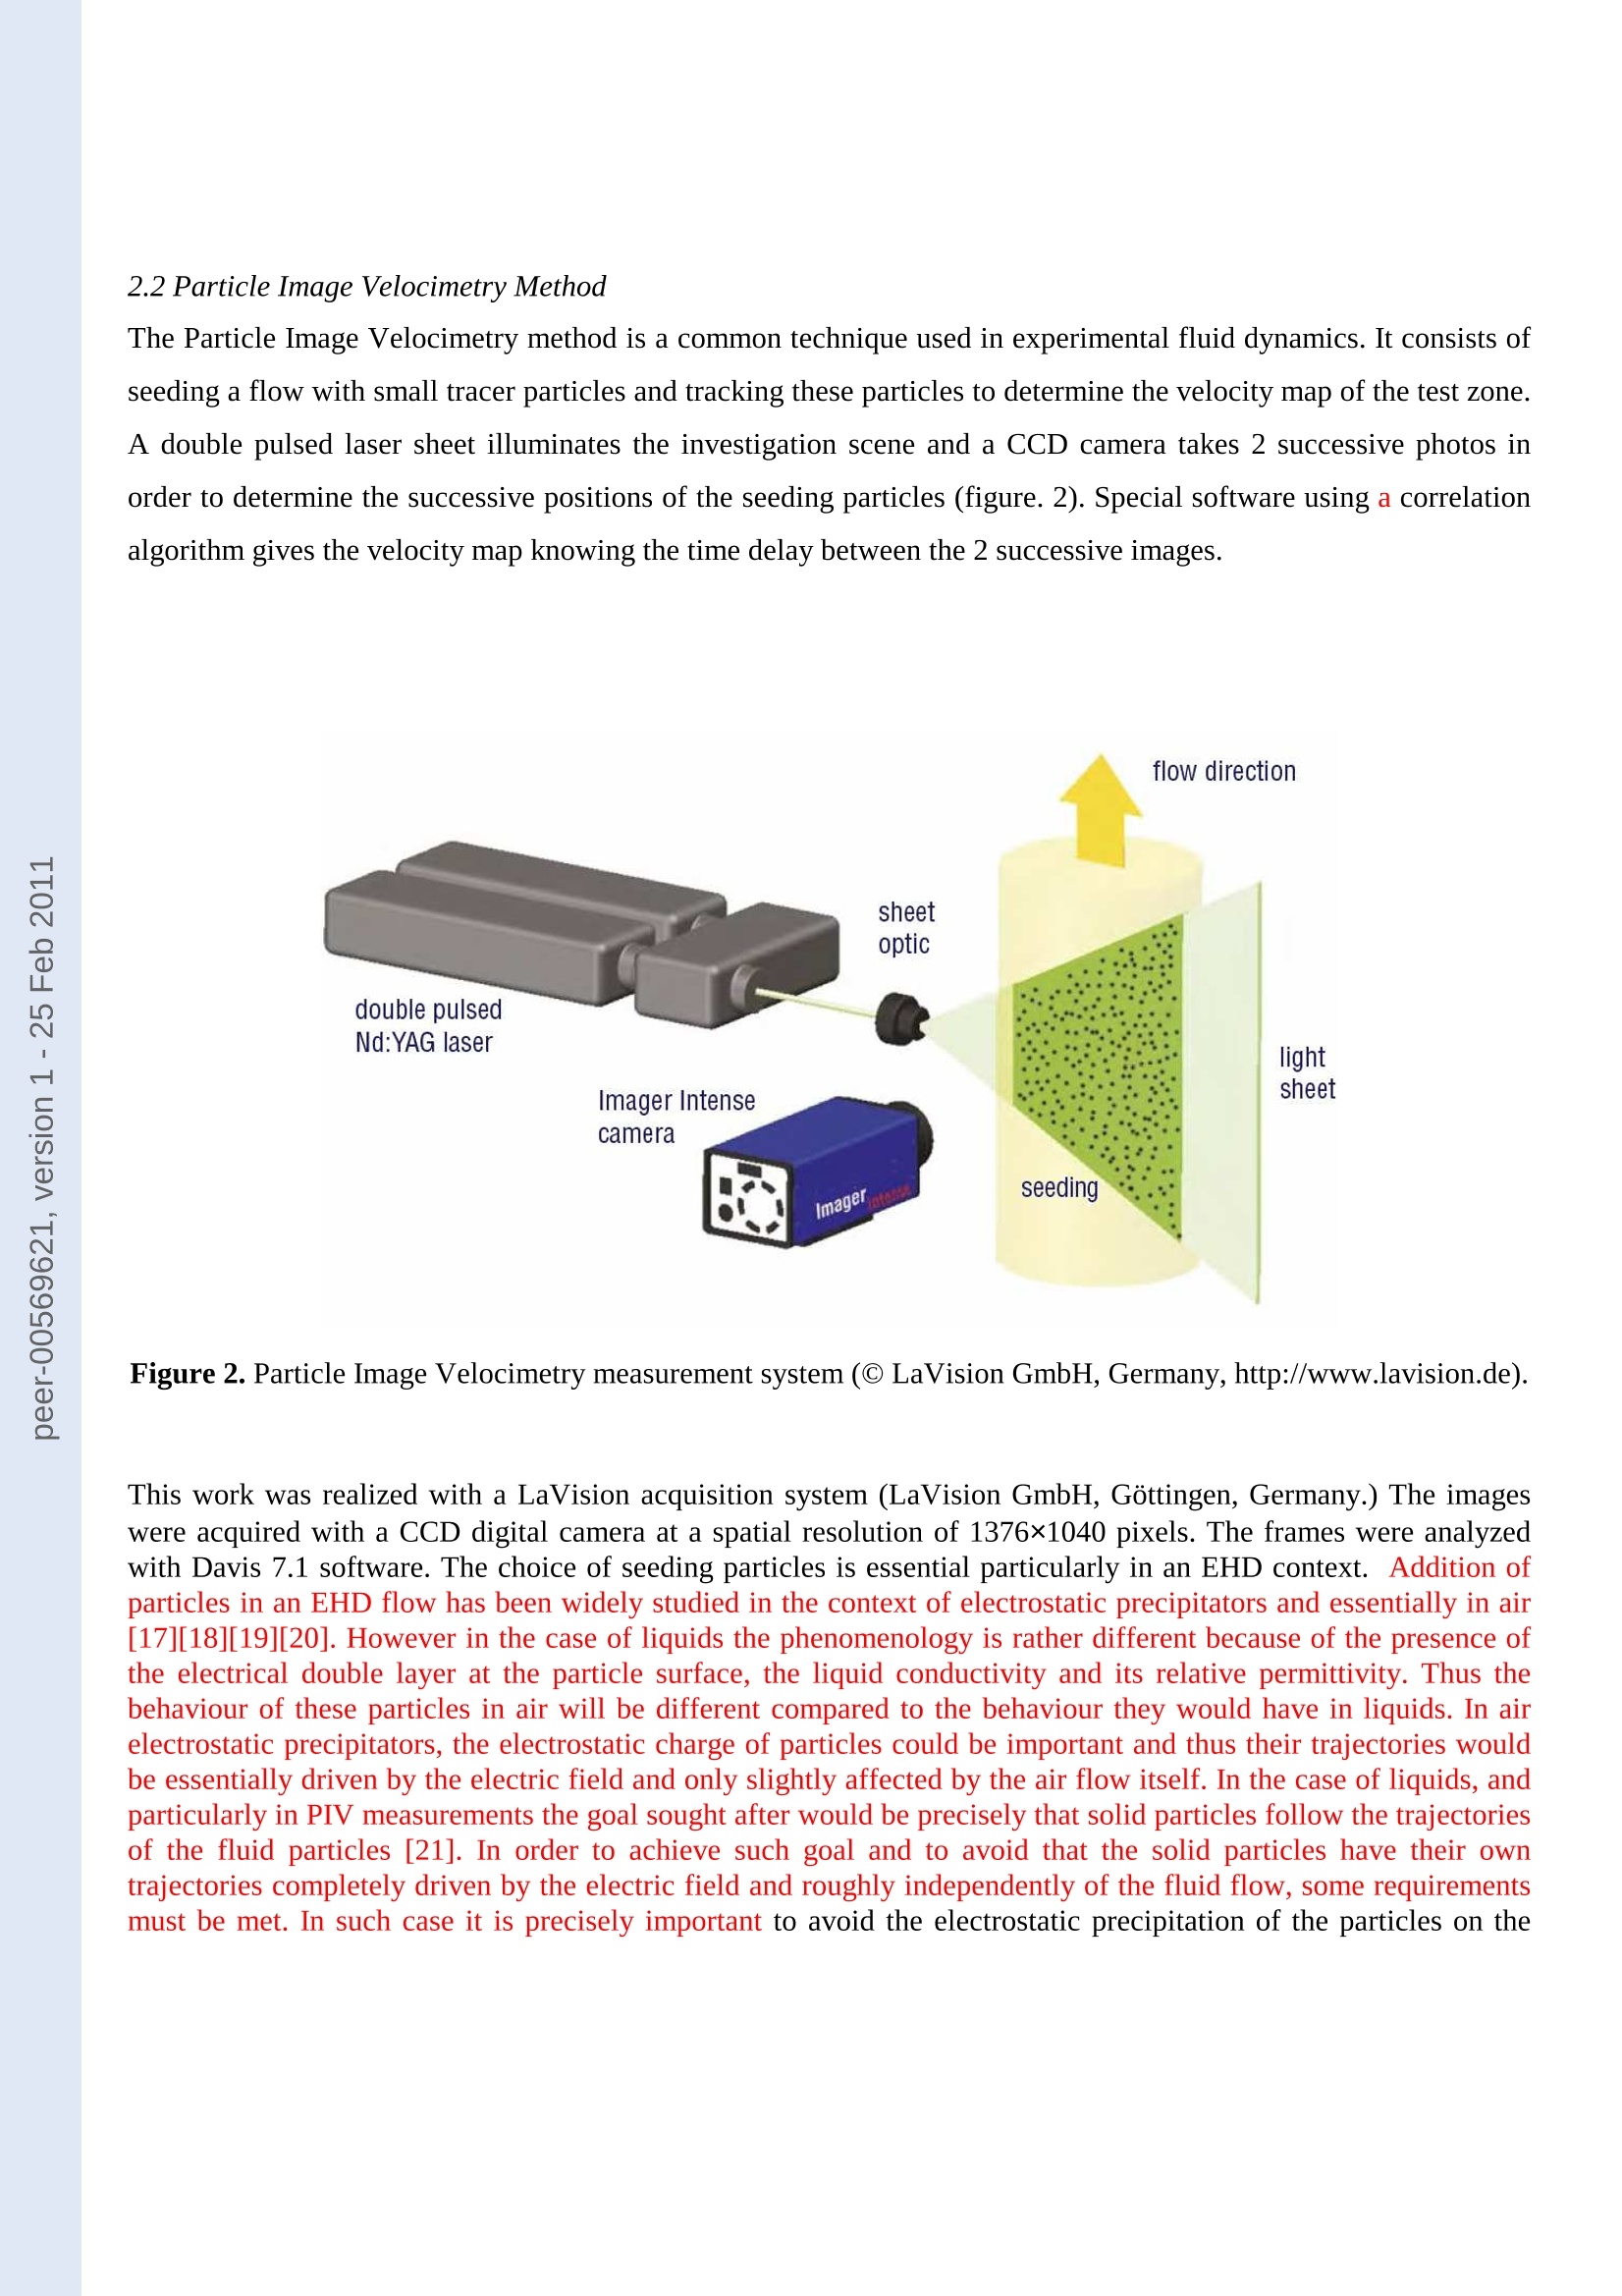
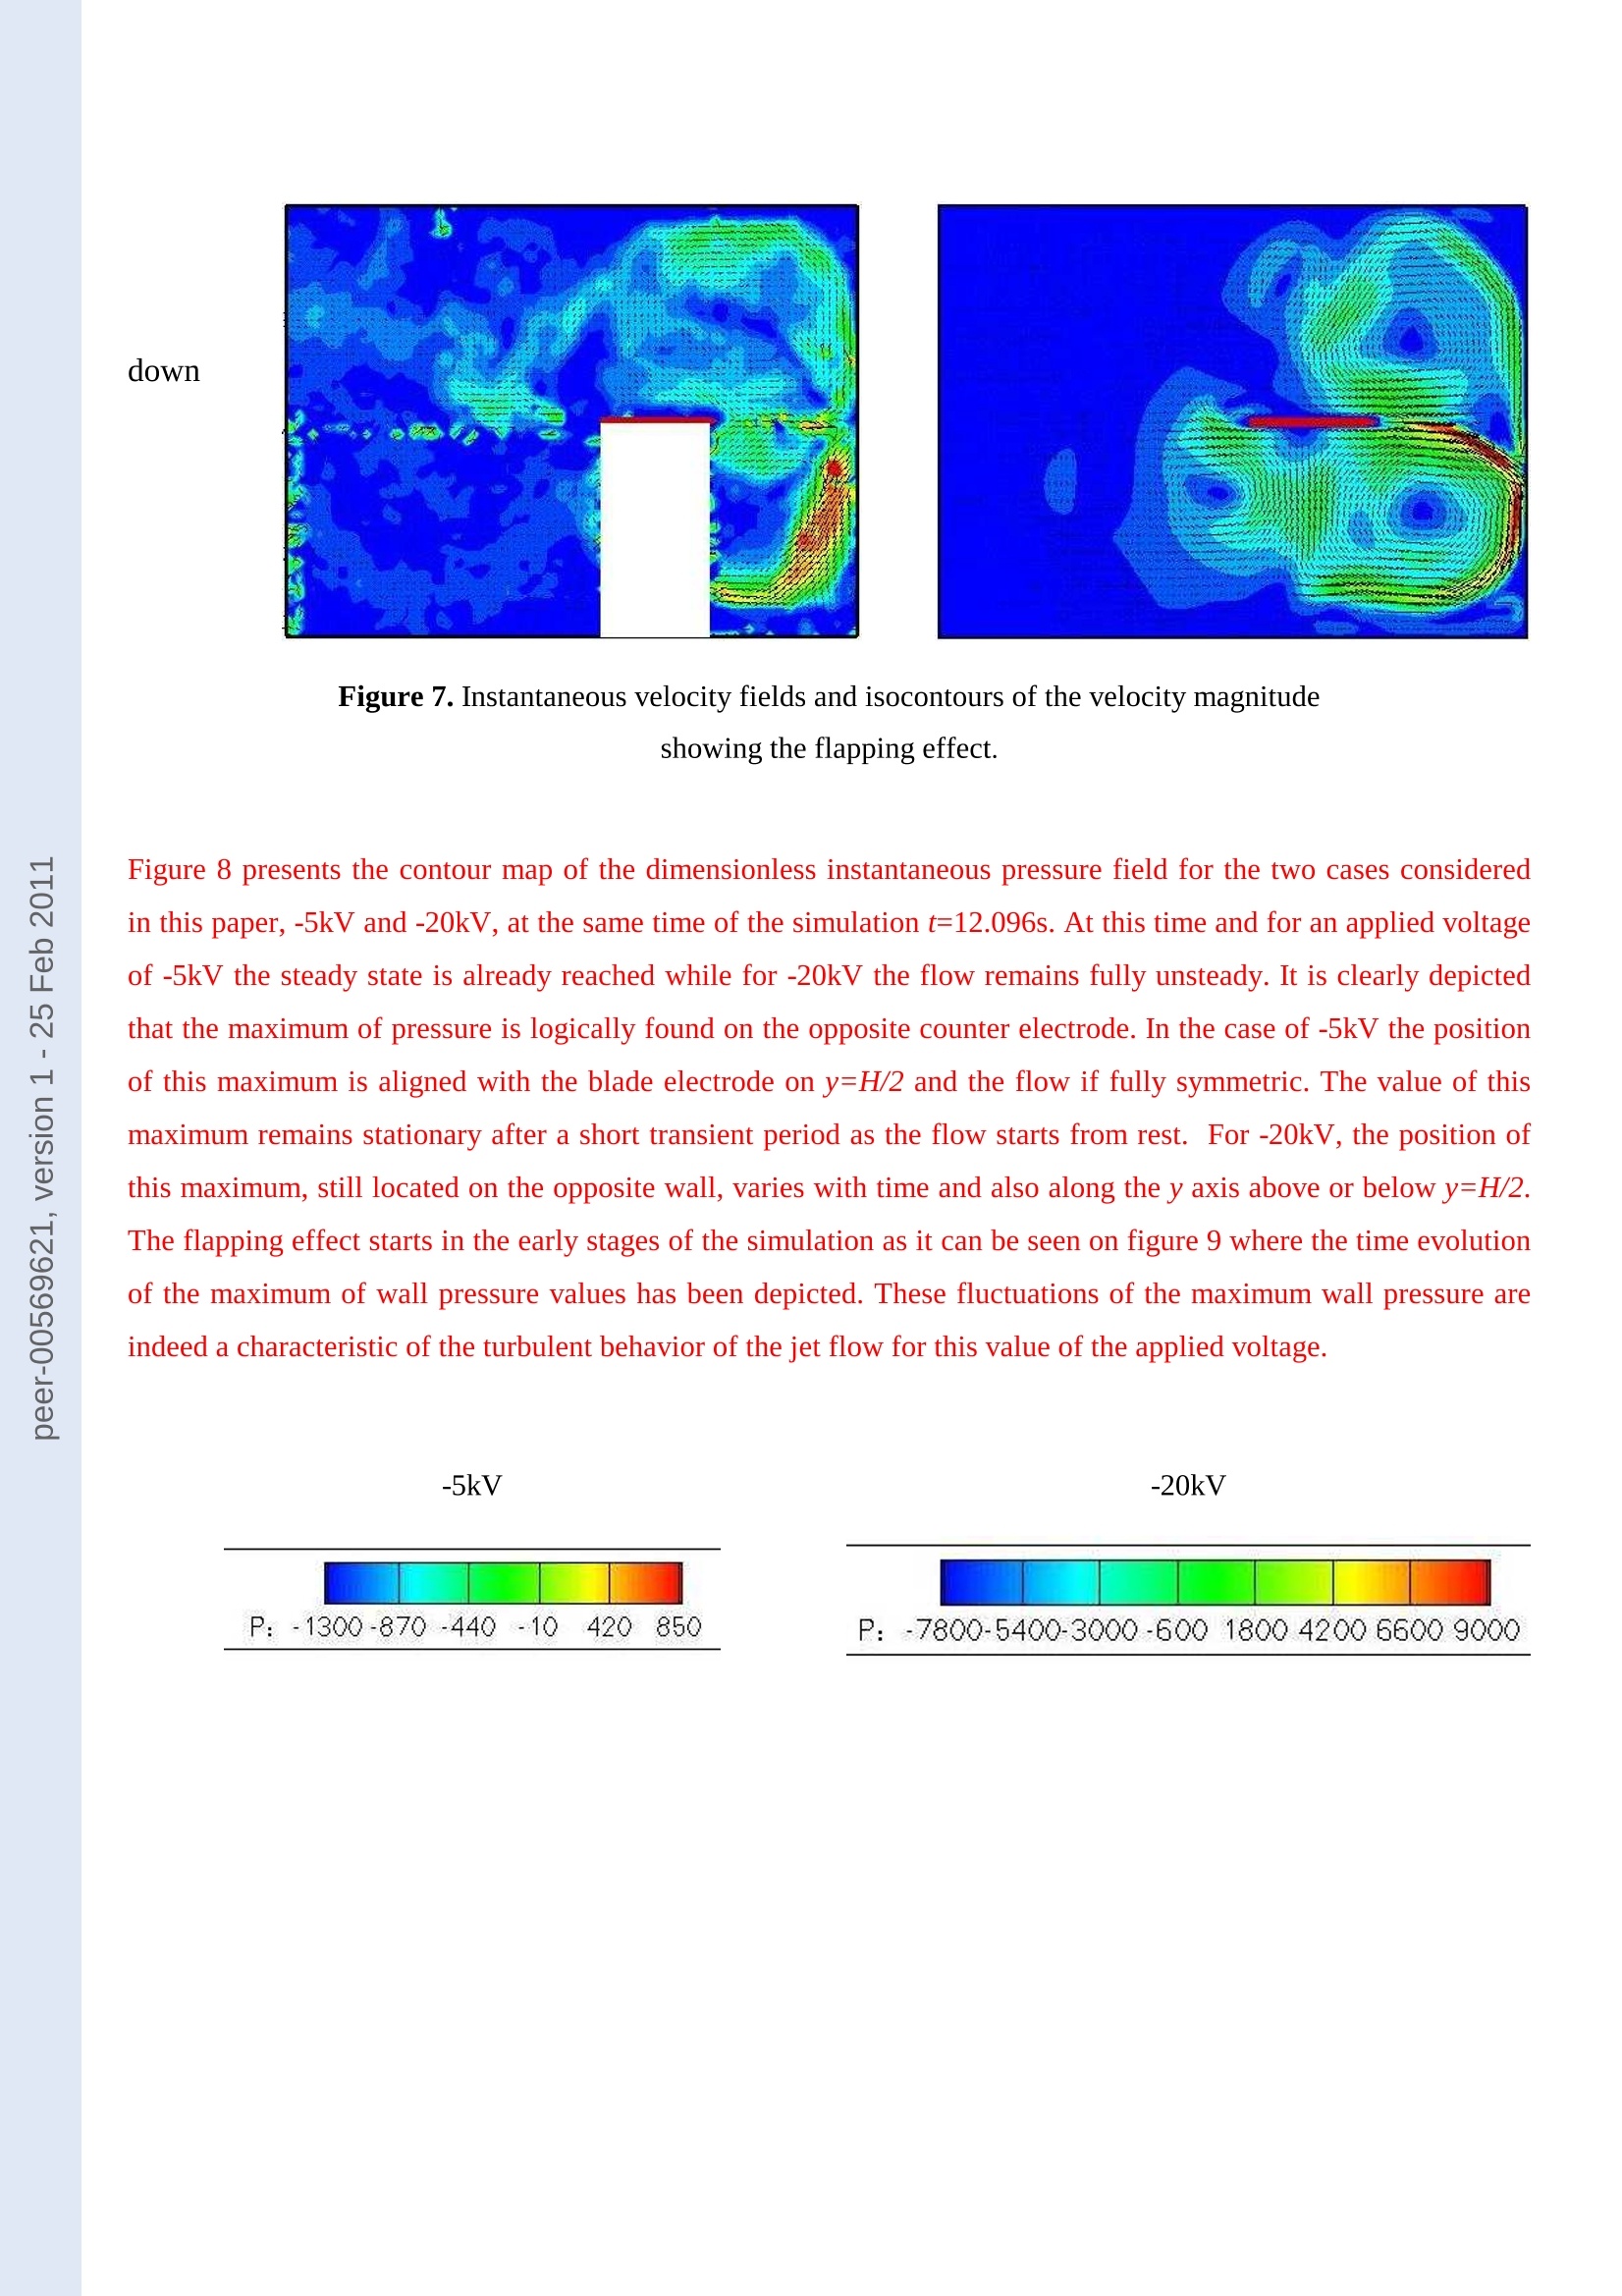
Author manuscript, published in "Journal of Physics D: Applied Physics 43, 22 (2010) 225502"DOI:10.1088/0022-3727/43/22/225502 Numerical simulation and PIV experimental analysis ofelectrohydrodynamic plumes induced by a blade electrode. Ph Traore Laboratoire d'Etudes AerodynamiquesBoulevard Pierre et Marie Curie, BP 30179,86962 Futuroscope-Chasseneuil,France philippe.traore@univ-poitiers.fr M Daaboul Laboratoire d'Etudes AerodynamiquesBoulevard Pierre et Marie Curie, BP 30179,86962 Futuroscope-Chasseneuil, France Ch Louste Laboratoire d'Etudes AerodynamiquesBoulevard Pierre et Marie Curie, BP 30179,86962 Futuroscope-Chasseneuil, France Abstract. In this paper, a comparative study between numerical and experimental results fromPIV measurements is presented in the case of two-dimensional electrohydrodynamic plumes thatarise when a sharp metallic blade, submerged in non conducting liquids, supports high electricpotential. Experiments and numerical simulations have been conducted in order to confront theboth approaches. A very good agreement has been found through velocity profiles and velocityfields which testifies the relevance of our numerical model. For high potentials the jet flow issuedforth from the blade becomes unsteady and starts to flap on the vertical wall. Some captions ofthetemporal evolution of the isocontours of charge density which is not accessible from experiment arepresented thanks to the numerical simulation. 1. Introduction Performance of industrial systems working with liquids could be improved by using well adapted flow controldevices. For instance electrohydrodynamic (EHD) devices could provide an efficient solution to control a givenflow. In fact EHD apparatuses have many advantages such as: low power consumption, short response time, andgood reliability. They are less subjected to failures of any kind than pure mechanical devices also utilized for flowcontrol and they can be completely non-intrusive. In electrohydrodynamics, the Coulomb force is the main efficient force to induce the liquid motion. In absence ofthermal gradient, only two different phenomena can produce a volume charge density and then a Coulomb force. The first one is the so-called charge injection process and is associated to unipolar injection of ions at a metal/liquidinterface [1]. The second one is the conduction pumping phenomena which is based on the process of dissociationand recombination of electrolytic species. Atten & Seyed-Yagoobi [2] have demonstrated that in absence ofinjection this dissociation-recombination process results in the production of heterocharge layers of finite thicknessin the vicinity of the electrodes. They also predict that the use of asymmetric electrodes could induce a net liquidmotion. This model has been experimentally and numerically proved by Feng and Seyed-Yagoobi [3]. Manydevices and applications based on these two phenomena have been developed. Most of them are EHD pumps or thinfilm devices for cooling applications. A scientific overview of numerical and experimental research on theconduction model could be found in [4]. Although, the conduction phenomenon is better adapted for pumpingapplications, injection remains interesting because it induce a stronger Coulomb force. In this article, a typicalblade-plane set up is used to induces ions injection in a dielectric liquid [5][6]. In such conditions, convectivemotion of a jet shape arises. These particular flows have been referred to as EHD plumes and are present in most ofindustrial devices exploiting electric forces. In previous works it has been shown that a blade-plane geometry device generates an impinging jet which can reacha velocity of 1 m/s [7][8]. The adaptation of the Particle Image Velocimetry (PIV) technique to electrohydrodynamic flows [9] has permittedto obtain large velocity maps of jets. Characteristics of such flows have been studied as well as in transient or instationary regimes [9][10]. Although the last improvements of the PIV measurement technique some data remainnon-measurable. The analogy of EHD plumes with thermal ones has conducted many authors [11][12][13][14][15] to analyze EHDplumes by the mean of self-similar analysis or integral model. Under some simplifying assumptions the governingEHD equations are made tractable and the mathematical model is close to the one of thermal plumes for Pr- o(where Pr=v/a is the Prandtl number v is the kinematic viscosity of the fluid and a its thermal diffusivity). Another way to obtain information on data which are not accessible experimentally, for instance the electric charge density in the device as well as the electric field at every location of space, is to require to numerical simulations.Several attempts to model numerically the development of EHD flows and especially electro-convective flows havebeen made in the past. But most of the authors started their computations from an assumed velocity field and notfrom a real resolution of the Navier-Stokes equations [15]. In [16] the appropriate electrodynamics equationscoupled with the full Navier-Stokes equations are solved numerically with the help of an efficient finite volumemethod to study the flow structure of EHD plumes. In this paper, detailed comparisons between experimental results obtained from PIV measurements and numericalpredictions are presented in the case of an EHD plume induced by charge injection from a blade. Velocity profilesand vector fields are correlated and the charge field in the device is extracted from the numerical results. 2. Experimental apparatus and techniques 2.1 Electrical Device A schematic diagram of the system is shown in figure. 1. The test cell is composed of a 30 cm x15 cm ×15 cmglass aquarium filled with the dielectric liquid. The electrical device is totally immerged in the liquid and fixed in aconfined zone of 10 cm ×8 cm×6 cm with flat glass surfaces in order to be able to realize PIV measurementswithout Laser reflections. An 8 cm long and 0.5 mm thick stainless steel blade is placed in front of a duralumin flatplane electrode. The distance d between the blade tip and the counter-electrode is set to 20 mm and the radius ofcurvature of the blade tip is about 7±2 um. Figure 1. Experimental apparatus A variable difference of potential (0-60 kV) is supplied by a Spellman SL1200 DC power supply. A Meterman37XR multimeter (±0.1V-±0.01 mA) was used to measure the voltage across a shunt resistance Rs = 99.3 kQ.The liquid used in the experiments is dielectric oil with slight electrical conductivity. The characteristics of thisdielectric liquid at a temperature of 20 °℃ are presented in Table I. Mass density p(kg/m) 850 Kinematic viscosity v(m /s) 4.3 10° Electrical conductivity o (S/m) 1.1510~ Relative permittivity 8r 2.2 Ionic mobility m/(V.s) 10 2.2 Particle Image Velocimetry Method The Particle Image Velocimetry method is a common technique used in experimental fluid dynamics. It consists ofseeding a flow with small tracer particles and tracking these particles to determine the velocity map of the test zone.A double pulsed laser sheet illuminates the investigation scene and a CCD camera takes 2 successive photos inorder to determine the successive positions of the seeding particles (figure. 2). Special software using a correlationalgorithm gives the velocity map knowing the time delay between the 2 successive images. Figure 2. Particle Image Velocimetry measurement system (C LaVision GmbH, Germany, http://www.lavision.de). This work was realized with a LaVision acquisition system (LaVision GmbH, Gottingen, Germany.) The imageswere acquired with a CCD digital camera at a spatial resolution of 1376×1040 pixels. The frames were analyzedwith Davis 7.1 software. The choice of seeding particles is essential particularly in an EHD context. Addition ofparticles in an EHD flow has been widely studied in the context of electrostatic precipitators and essentially in air[17][18][19][20]. However in the case of liquids the phenomenology is rather different because of the presence ofthe electrical double layer at the particle surface, the liquid conductivity and its relative permittivity. Thus thebehaviour of these particles in air will be different compared to the behaviour they would have in liquids. In airelectrostatic precipitators, the electrostatic charge of particles could be important and thus their trajectories wouldbe essentially driven by the electric field and only slightly affected by the air flow itself. In the case of liquids, andparticularly in PIV measurements the goal sought after would be precisely that solid particles follow the trajectoriesof the fluid particles [21]. In order to achieve such goal and to avoid that the solid particles have their owntrajectories completely driven by the electric field and roughly independently of the fluid flow, some requirementsmust be met. In such case it is precisely important to avoid the electrostatic precipitation of the particles on the electrodes and the charge accumulation which could modify, firstly the hydrodynamic trajectories of these particlesdue to the electric field and secondly the electric field itself. Daaboul [21], have demonstrated that the use of SiOparticles of 0.5 um diameter with a concentration of less than 100 mg/l must be employed to have satisfactoryresults. In fact, with such a concentration, the electric current is not modified. Daaboul has proven that the globalshape of the charged plume as well as the jet velocity profiles are not affected for these low concentrations. Inthis work we have used these particles with a 20mg/l concentration. 3. Numerical method The problem is formulated considering the usual hypotheses of a Newtonian and incompressible fluid of dynamicviscosity u and density p. The Navier-Stokes equations (mass and momentum conservation) are coupled with EHDequations and give rise to the following partial differential equations system. U is the fluid velocity, P the pressure,q the charge density, V the potential and E the electric field. K is the ionicmobility and e is the dielectric constant. In the charge density transport equation (3), diffusion term has not beenincluded since it is negligible compared to the migration term [22]. The injection of unipolar charge of mobility Kfrom the blade is assumed homogeneous and autonomous [23][24]; this mean that the charge density at the blade isposeedto be constant and equal to go at all times since the injector and hence the injection rate are notinfluenced by perturbation in the bulk. We have depicted the computational domain and the boundary conditions infigure 3. qo and are respectively the charge density and potential applied on the blade. Figure 3. Computational domain and boundary conditions The numerical procedure is based on the integration of the whole system of equations by a finite volume methodusing a staggered grid and a semi-implicit second order in time and space accurate schemes [25]. All details of thepresent numerical method can be found in [16]. 4. Results and discussion The applied voltage between the blade and the plate counter electrode induces a very strong electric field at theblade tip. It is well known that in this configuration the measured current can be decomposed into a conductioncurrent part and an injected current one which originates from the unipolar injection of charges at the blade tip. Onfigure 3 we have presented the current-voltage characteristic from experiments. It shows a typical behaviourassociated with a space charge limited condition [26]. Figure 4. Experimental current-voltage characteristic in blade-plate geometry. The structure of the flow is composed of two main vortices on either side of the plumes which are easily identifiedon the figure 5 which represents the velocity field and isocontours of the velocity magnitude. For the case -5kV weobtain a stationary laminar regime while the -20kV one is fully unsteady and turbulent. In that case, the captionsrepresent the temporal mean over all discrete times of the simulation, and over 1000 instantaneous velocity fieldsissued from recorded PIV images for the experiment. The comparison between experimental and numerical resultsshows a very good agreement. Figure 5. Snapshots of velocity field and isocontours of the velocity magnitude for an applied voltageof-5kV and-20kV In figure 6 we have plotted the experimental and numerical longitudinal velocity profiles in x middle plane on thesame graph for the both cases -5kV and -20kV. Here again the curves depicted for these two values of the appliedvoltage match quiet well. The little discrepancy of the profiles is only due to experimental measurements errors aswell as a slight dissymmetry of the experimental apparatus that we noticed at the end of our measurementscampaign. Figure 6. Comparisons of the numerical and experimental longitudinal velocity profiles in the x middle plane fieldfor two values of the applied voltage. When we increase the applied voltage from -5kV to -20kV the flow becomes unsteady and the jet starts to flap. It issometimes oriented up sometimes down. In figure 7 we have shown two instantaneous numerical and experimentalvelocity fields which characterize the flapping behavior of the jet flow for -20kV. This particular effect essentiallydue to the confinement of the cavity has been already observed in the case of slot jets impinging on a concavecurved wall [27] . It is interesting to note that our numerical model is able to reproduce this phenomenon. Experiment Numeric up down Figure 7. Instantaneous velocity fields and isocontours of the velocity magnitudeshowing the flapping effect. Figure 8 presents the contour map of the dimensionless instantaneous pressure field for the two cases consideredin this paper, -5kV and -20kV, at the same time of the simulation t=12.096s. At this time and for an applied voltageof -5kV the steady state is already reached while for -20kV the flow remains fully unsteady. It is clearly depictedthat the maximum of pressure is logically found on the opposite counter electrode. In the case of -5kV the positionof this maximum is aligned with the blade electrode on y=H/2 and the flow if fully symmetric. The value of thismaximum remains stationary after a short transient period as the flow starts from rest. For -20kV, the position ofthis maximum, still located on the opposite wall, varies with time and also along the y axis above or below y=H/2.The flapping effect starts in the early stages of the simulation as it can be seen on figure 9 where the time evolutionof the maximum of wall pressure values has been depicted. These fluctuations of the maximum wall pressure areindeed a characteristic of the turbulent behavior of the jet flow for this value of the applied voltage. -5kV -20kV Figure 8..Instantaneous contour map of the dimensionless pressure field. Figure 9. Dimensionless time evolution of the maximum wall pressure. Isocontours of the charge density Ti m eIsocontours of the charge density Time Charge density. 0.05 0.25 0.45 0.66 0.86 Charge density.0.05 0.25 0.450.66 0.86 0.288s 1.008s 0.432s 1.152s One of the most interesting features of numerical simulation is that it allows computing some quantities which arenote available by measurements. The charge density is a good example of such inaccessible data by measurementmeans. In figure 10 we have depicted the time evolution of the dimensionless charge density in the computationaldomain for an applied voltage of -5kV. It is interesting to notice that the charge density is confined in a thin layerwhich arises from the blade until it reaches the counter electrode. The iso-values of this charge density are quitelow in accordance with the relatively moderate applied voltage. Figure 10. Instantaneous isocontours of the dimensionless charge density at different times of the simulation. 5. Conclusion PIV, experimental measurements and numerical simulations have been conducted to analyze EHD plumes arisingfrom ions injection between a blade and a plane in a dielectric liquid under the influence of an applied voltage. Twocases have been considered: -5kV and -20kV. We have highlighted the existence of a steady and laminar regime forlow applied voltage between the blade and the opposite collector electrode. A turbulent regime with the appearanceof a flapping effect of the jet flow issued forth from the blade has been observed experimentally as well asnumerically for -20kV applied voltage.Comparisons between experimental and numerical longitudinal velocityprofiles in the x middle plane, as well as the velocity field for different values of applied voltage show a perfectagreement which testify the validity, capability and efficiency of our numerical model. The use of PIVmeasurements in the context of EHD flow is a real advance. Nevertheless the real effect of PIV particles in theirinteractions with flow through their charge catching must be more precisely investigated and determined. 6.References 11Chang J.S.“Two phase flow in Electrohydrodynamic”Part V, 1998, Electrohydrodynamics, Internationalcenter for mechanical sciences courses and lectures, N° 380, Castellanos A. (Ed), Springer Wein New-York. [21 Atten P and Seyed-Yagoobi J 2003,“Electrohydrodynamically induced dielectric liquid flow through pureconduction in point/plane geometry”, IEEE Trans. Dielectr. Electr. Insul, Vol. 10, pp. 27-36. Feng JJ12and Seyed-Yagoobi J 2004,“Understanding of electrohydrodynamic conductionpumpingphenomenon”, Phys. Fluids,Vol. 16, pp. 2432-2441. [4] Pearson, M.Seyed-Yagoobi, J. 2009, “Advances in electrohydrodynamic conduction pumping”, IEEETransactions on Dielectrics and Electrical Insulation, Volume: 16, Issue: 2, pp 424-434. 51 Atten P and Castellanos A 1985,“Injection induced electrohydrodynamic flows”,Handbook ofElectrostaticProcesses, Ed. New York: Dekker, pp.121-146. [6] Huigera F J 2000, "Electrohydrodynamic flow of a dielectric liquid around a blade electrode", Phys. Fluids ,Vol 12 (11),pp. 2732-2742 171 Baudel P, Louste C and Romat H 2006,“LDV Measurements of Dielectric Liquid Motion Induced by ChargeInjection inaNeedle to Plane Configuration,” International symposium on ElectrohydrodynamicsISEHD/IEEE,pp.149-152, December, Argentina. [81 Daaboul M, Louste C, and Romat H 2009, “Transient velocity induced by electric injection in blade-planegeometry”,J. Electrostatics, Vol. 67, pp. 359-364. [91 Daaboul M, Louste C, and Romat H 2009, “PIV measurements on charged plumes - Influence of SiO2seeding particles on the electrical behavior”,IEEE Trans. Dielectr. Electr. Insul., Vol. 16, Issue 2, pp. 335-342. [10]Louste C, Daaboul M, and Romat H 2009, “A study of vortex shedding induced by dielectric barrierinjection", J. Electrostatics, Vol. 67, pp. 348-353. [11]Vazquez P A, Perez A T, Castellanos A, and Atten P 2000, "Dynamics of electrohydrodynamic laminarplumes: Scaling analysis and integral model", Phys. Fluid, Vol 12 (11), pp. 2809-2818. Vazquez P A, Perez A T and Castellanos A 1996, "Thermal and electrohydrodynamic plumes. A comparativestudy", Phys. Fluids, Vol8 (8),pp. 2091-2096. ( Vazquez P A, Castellanos A , P erez A T and Chicon R 2000, " N umerical modelling of EHD flows due toinjectors of finite size", Conference on Electrical Insulation and Dielectric Phenomena, pp. 101-104. ) ( V azquez P A, Perez A T a n d Castellanos A 1996, "Steady and Transcient Electrohydrodynamic Plumes ",Conference on Electrical Insulation and Dielectric Phenomena, IEEE Annual Report,pp . 3 7 3-376. ) ( R.Chicon., A. C astellanos, E . Martin 1 9 97, , "Numerical m odelling of C oulomb-driven co n vection ininsulating liquids", J Fluid Mechanics,344, p p 43-66. ) ( [16] P erez A T , Traore Ph, Koulova-Nenova D, and Romat H 2009. "Numerical st u dy o f a n E l ectroHydrodynamic p lume between a blade injector and a flat plate", IEEE Transactions on Diel e ctrics and E lectrical Insulation,Vol.16, pp 448-455. ) ( [17]Atten P, McCluskey F .M.J a nd Lahjomri A.C, 1 9 87,“The electrohydrodynamic o r igin o f turbulence i n electrostatic precipitators”, IEEE T rans IAS, Vol I A -23, pp 705-711. ) [18]Chang J.-S, Watson A.,”Electromagnetic hydrodynamics”,IEEE Transactions on Dielectrics and ElectricalInsulation ,Volume 1, Issue 5, October 1994, Pages 871-895. ( [19] Y amamoto T.,Velkoff, H.R, 198 1 ,”E l ectrohydrodynamics in a n electrostatic precipitator”, J o urnal ofF l uidMechanics, Volume 108 ,pp1-18. ) ( [201 C hun, Y.N. C h ang, J.-S., Berezin, A .A., M izeraczyk, 2007, J.,” N umerical modeling of n e ar c o rona w i reelectrohydrodynamic f l ow i n a w i re-plate electrostatic precipitator”,IEEE Transactions o n D ielectrics andElectrical Insulation ,Volume 14 pp. 1 19-124. ) ( [21] D aaboul M , 2 0 09, " E t ude e t developpements d ' actionneurs electrohydrodynamiques pour l e c ontrole des écoulements". P h D Thesis, Un i versite de Poitiers, France ) [221Perez A T and Castellanos A, 1989 Physical review A, 40, 5844-5855. [231Vazquez P A, Georghiou G. E. and Castellanos A 2006 Characterization of injection instabilities inelectrohydrodynamic by numerical modelling: Comparison of particle in cell and flux corrected transportmethods for elctroconvection between two plates. J.Phys. D: Appl. Phys. 39, pp 2754-2763. [241Vazquez P A, Georghiou G. E. and Castellanos A 2006 Numerical analysis of the satiability ofelectrohydrodynamic (EHDi) electroconvection between two plates. J.Phys. D: Appl.Phys. 41, pp 1-10. [251 Patankar S J 1980, "Numerical Heat Transfer and Fluid Flow", Stockholm, Washington, DC. [261Felici N 1972 Direct Current conduction in liquid dielectrics. Part I: A survey of recent progress(Conduction en courant continu dans les liquides dielectriques). Revue generale d'electricite. 2, n°3,pp. 90-99 [271Brizzi L E, Gilard V and Braud P 2006“Analyse d'un jet plan impactant une paroi concave par PIV classiqueet rapide”, Congres francophone de techniques laser, CFTL 2006, Toulouse 19-22 Septembre, pp 1-8.
确定


还剩12页未读,是否继续阅读?

产品配置单


北京欧兰科技发展有限公司为您提供《叶片电极中诱导电流体力学羽流的数值模拟和PIV实验研究检测方案(粒子图像测速)》,该方案主要用于其他中诱导电流体力学羽流的数值模拟和PIV实验研究检测,参考标准--,《叶片电极中诱导电流体力学羽流的数值模拟和PIV实验研究检测方案(粒子图像测速)》用到的仪器有德国LaVision PIV/PLIF粒子成像测速场仪、Imager LX PIV相机、PLIF平面激光诱导荧光火焰燃烧检测系统
相关方案
更多
该厂商其他方案
更多