


方案详情
文
This Application Note describes a classical method for the analysis of lubricating oils. The spectrometric analysis of lubricating oil is common practice where large amount of lubricating oils are involved or where engine wear is critical.
For example, it is used to control oil from planes,boats, buses, trains, and large automotives.
方案详情

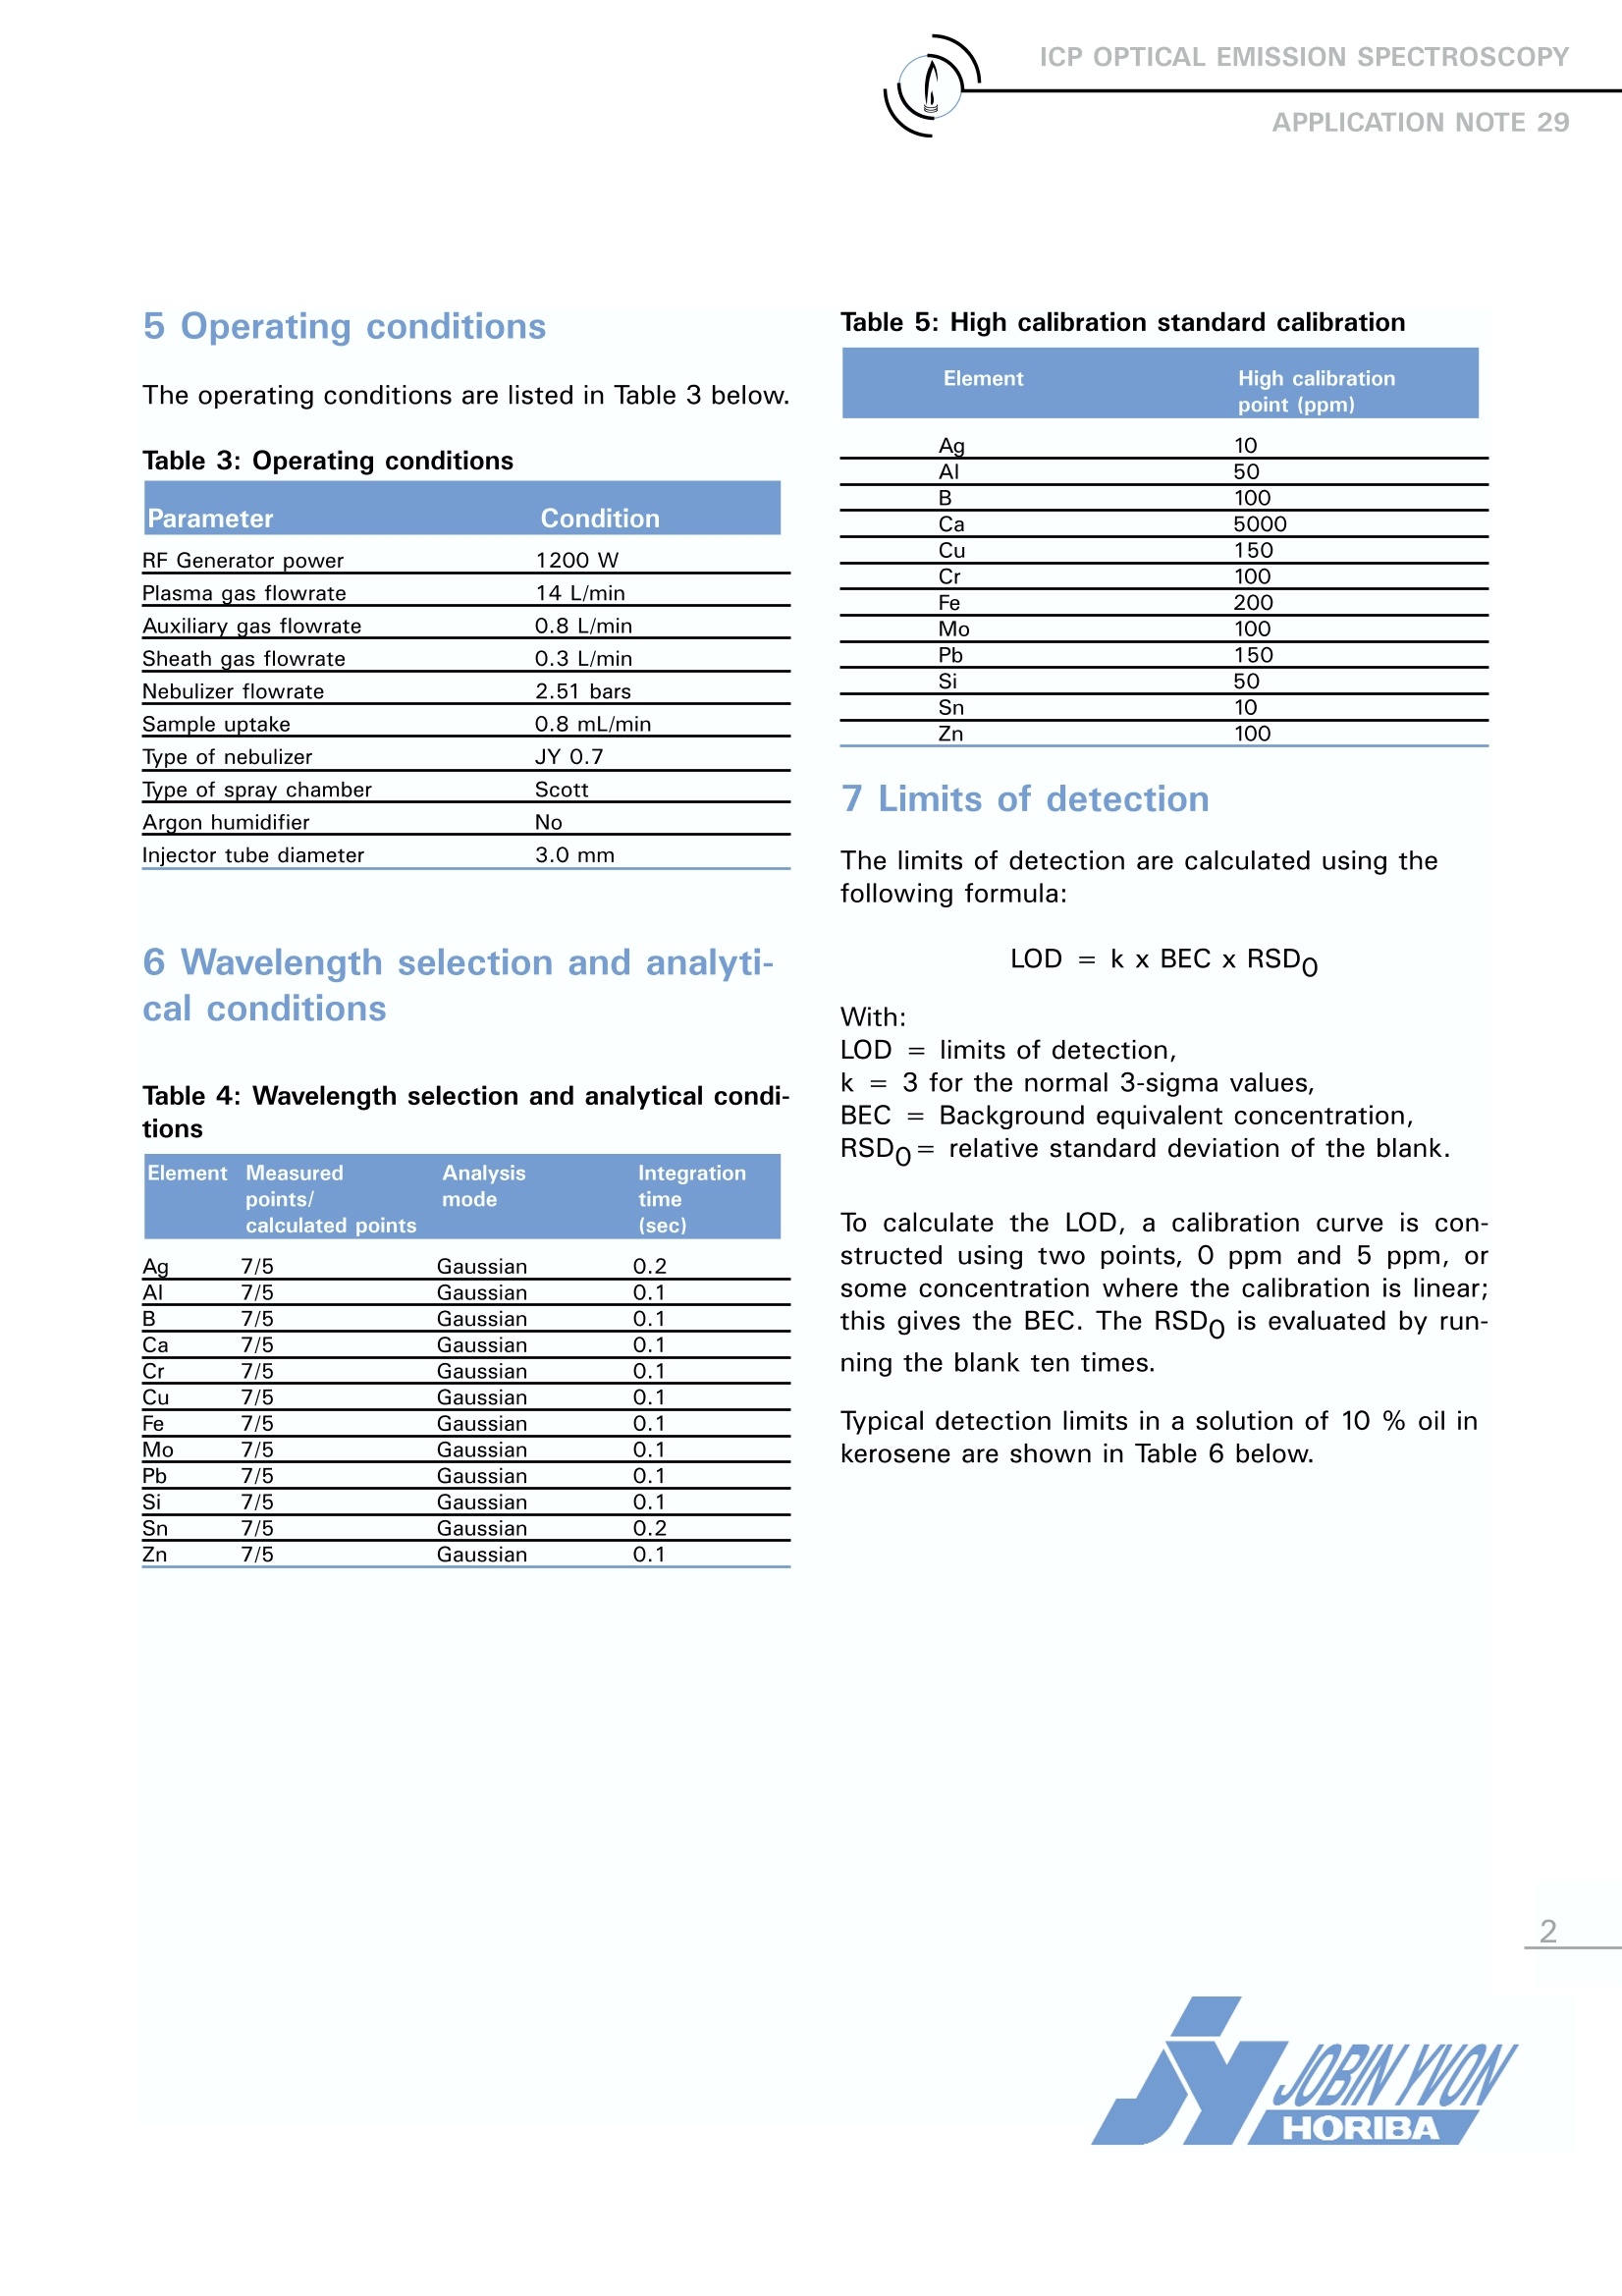
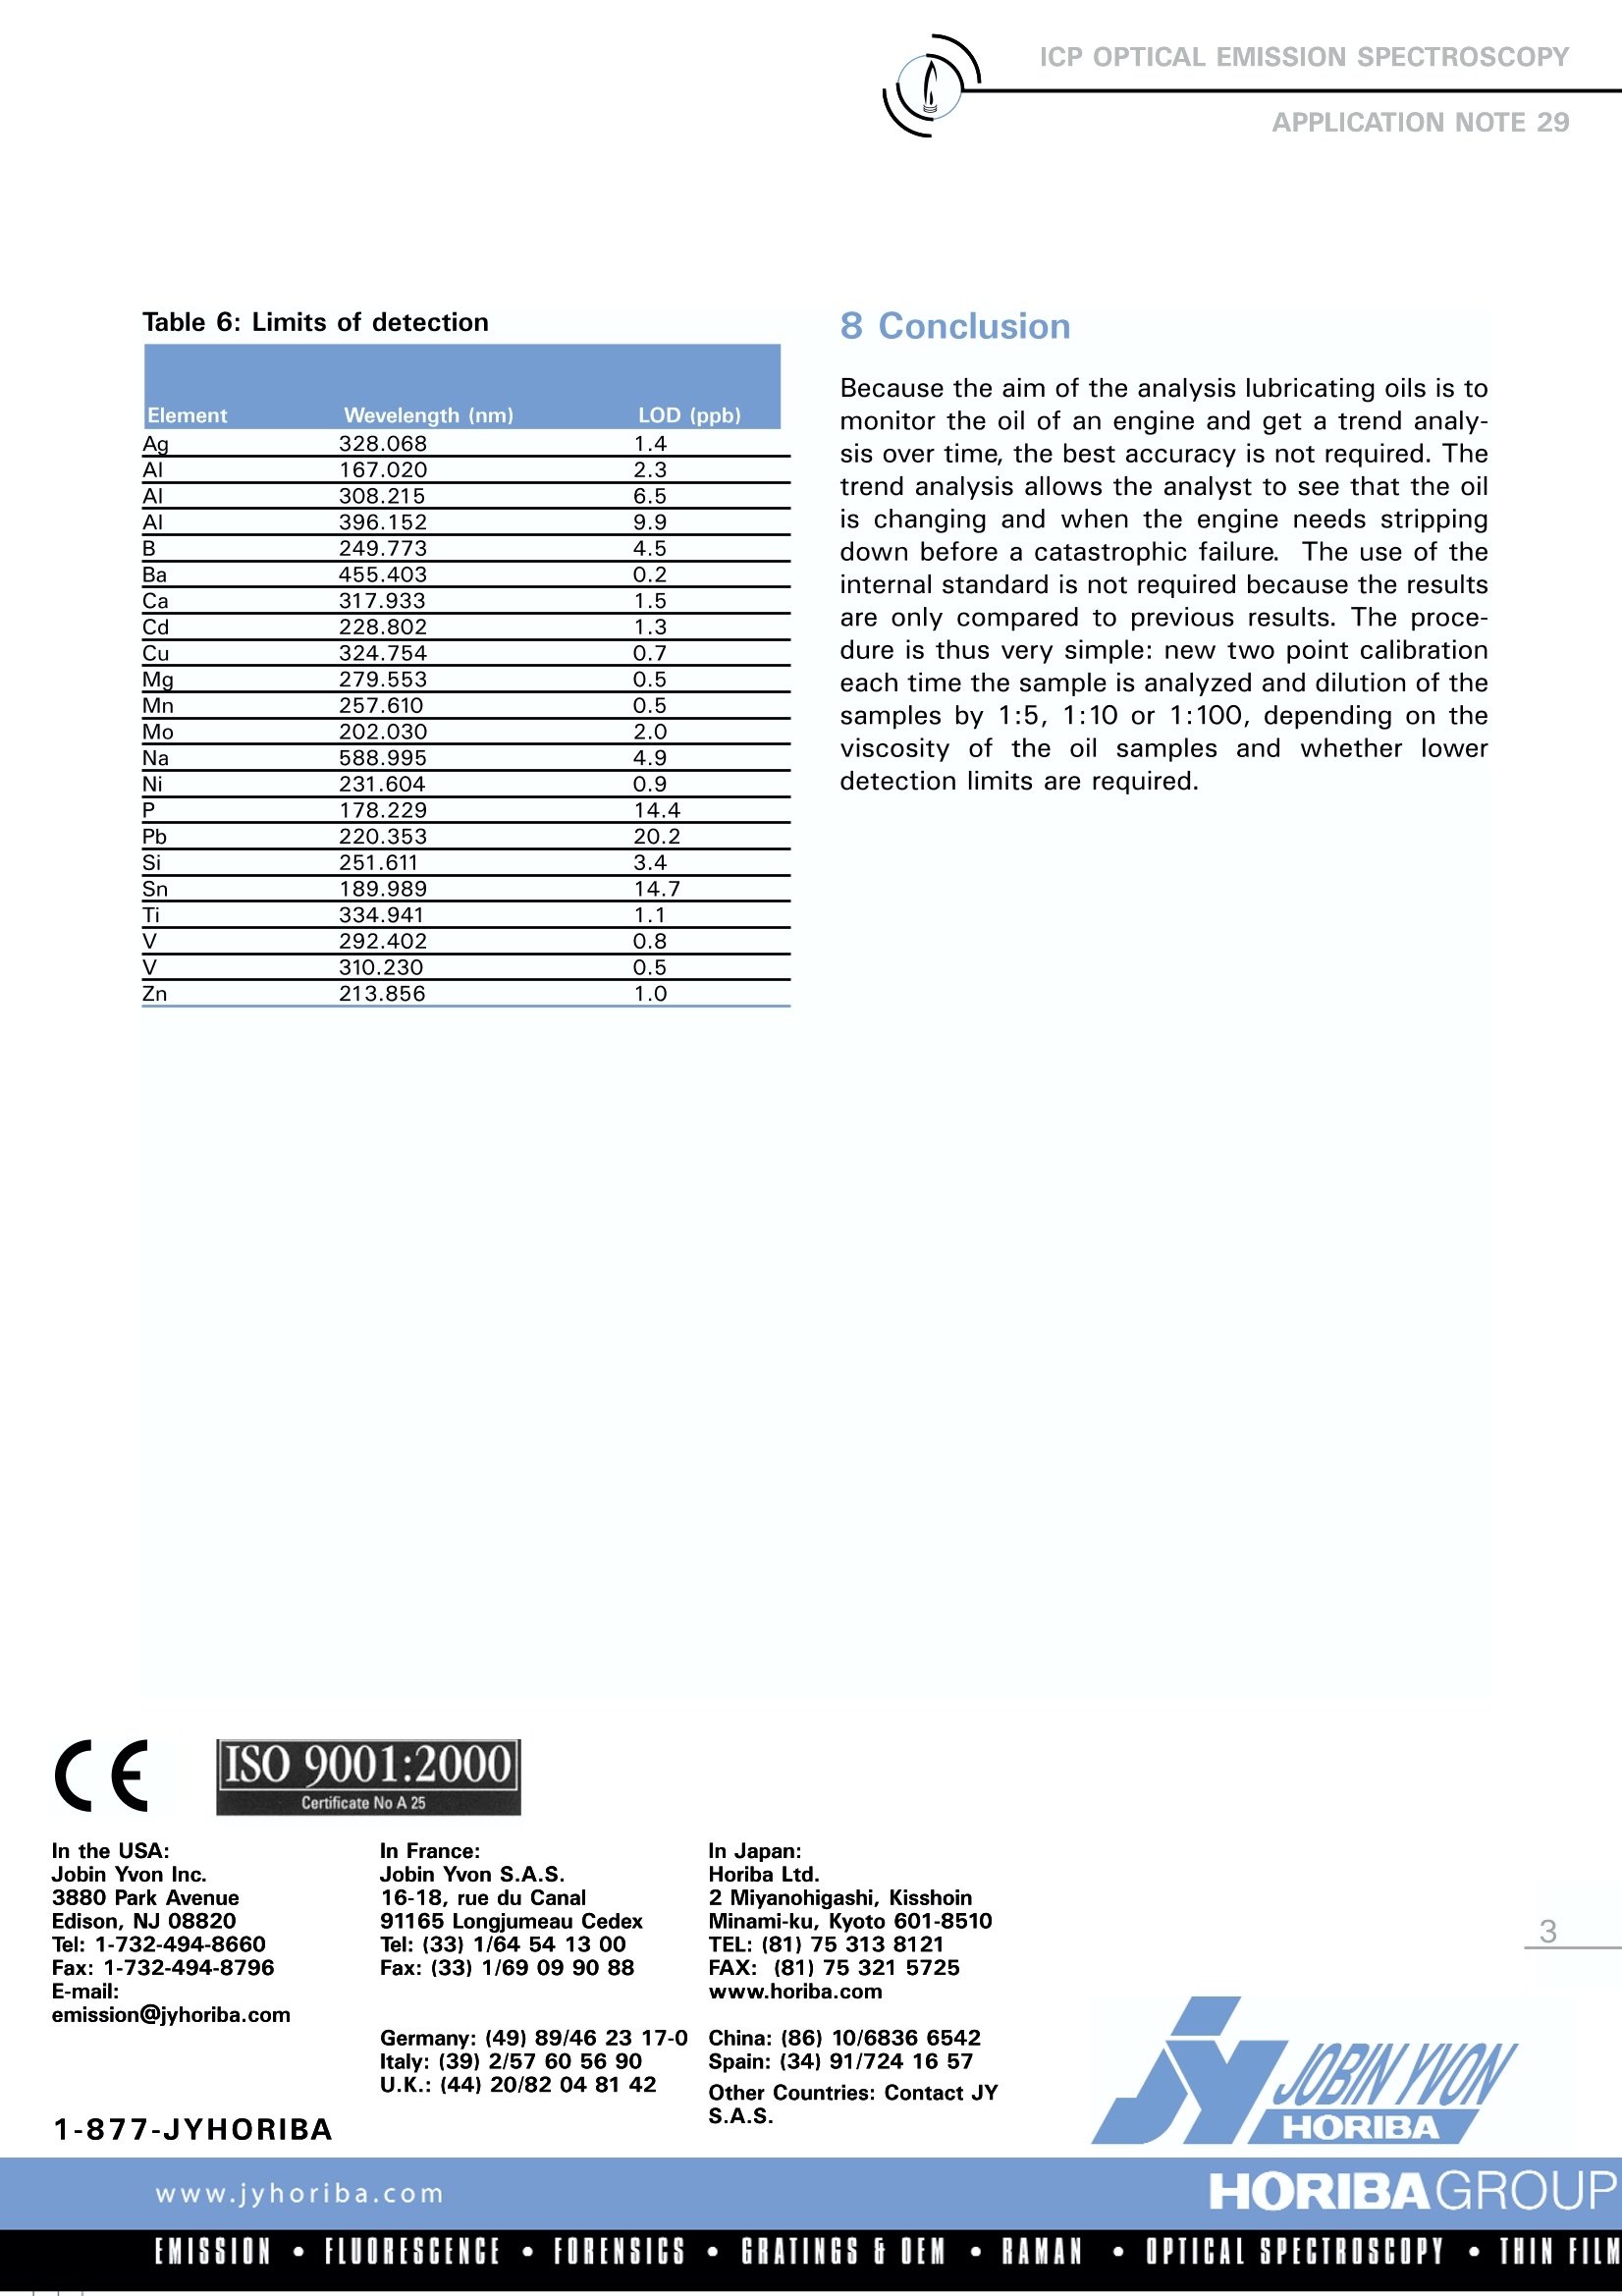
ICP OPTICAL EMISSION SPECTROSCOPY APPLICATION NOTE 29 Oil Analysis Agnes CosnierJobin Yvon S.A.S., Horiba Group Longjumeau, France Keywords: oil, wear metals, trend analysis 1 Introduction This Application Note describes a classicalmethod for the analysis of lubricating oils. Thespectrometric analysis of lubricating oil is com-mon practice where large amount of lubricatingoils are involved or where engine wear is critical.For example, it is used to control oil from planes,boats, buses, trains, and large automotives. Thesame oil is sampled over a period of time andanalyzed, and by monitoring of the concentra-tions of the wear metals enables identificationengine component suffering wear. 2 Principle 2.1 Technique used The elemental analysis of solutions was under-taken by Inductively Coupled Plasma OpticalEmission Spectrometry (ICP-OES). The sample isnebulized then transferred to an argon plasma. Itis decomposed, atomized and ionized wherebythe atoms and ions are excited. We measure theintensity of the light emitted when the atoms orions return to lower levels of energy.y.EEach ele-ment emits light at characteristic wavelengthsand these lines can be used for quantitativeanalysis after a calibration. 2.2 Wavelength choice The choice of the wavelength in a given matrixcan be made using the "profile"function, or byusing Win-IMAGE, which is rapid semi-quantita-tive analysis mode using multiplewavelengths.The principle is the same in either case: recordthe scans of analytes at low concentration, andof the matrix. By superimposing the spectra, wesee possible interferences. 3 Sample Preparation Different oil samples can have a large variation intheir viscosity, ranging from 50 to 1000 cs. Sothe nebulization efficiency of the oil can be verydifferent from one oil sample to the next.. Todecrease the viscosity and to obtain the sameviscosity value for all samples, they were dilutedby 10 in kerosene,white spirit, xylene or keldane.For viscous oils of 1000 cs, a 100 dilution isrequired. 4 Instrument specification The work was done on a JY 2000.The specifica-tions of this instrument are listed below in Tables1 and 2. Table 1:Specification of spectrometer Parameters Specifications Mounting Czerny-Turner Focal length 0.64 m Grating number of grooves 2 400 gr/mm Variable resolution No Nitrogen purge Yes Table 2: Specification of RF Generator Parameters Specifications Observation Radial Frequency 40.68 MHz Control of gas flowrate By computer Control of pump flow By computer Cooling Air 5 Operating conditions The operating conditions are listed in Table 3 below. Table 3: Operating conditions Parameter Condition RF Generator power 1200 W Plasma gas flowrate 14 L/min Auxiliary gas flowrate 0.8 L/min Sheath gas flowrate 0.3 L/min Nebulizer flowrate 2.51 bars Sample uptake 0.8mL/min Type of nebulizer JY 0.7 Type of spray chamber Scott Argon humidifier No Injector tube diameter 3.0 mm 6 Wavelength selection and analyti-cal conditions Table 4: Wavelength selection and analytical condi-tions Element Measured Analysis Integration points/ mode time calculated points (sec) Ag 7/5 Gaussian 0.2 AI 7/5 Gaussian 0.1 B 7/5 Gaussian 0.1 Ca 7/5 Gaussian 0.1 Cr 7/5 Gaussian 0.1 Cu 7/5 Gaussian 0.1 Fe 7/5 Gaussian 0.1 Mo 7/5 Gaussian 0.1 Pb 7/5 Gaussian 0.1 Si 7/5 Gaussian 0.1 Sn 7/5 Gaussian 0.2 Zn 7/5 Gaussian 0.1 Table 5: High calibration standard calibration Element High calibration point (ppm) Ag 10 Al 50 B 100 Ca 5000 Cu 150 Cr 100 Fe 200 Mo 100 Pb 150 Si 50 Sn 10 Zn 100 7 Limits of detection The limits of detection are calculated using thefollowing formula: With: LOD= limits of detection, k = 3 for the normal 3-sigma values, BEC= Background equivalent concentration, RSDo= relative standard deviation of the blank. To calculate the LOD, a calibration curve is con-structed using two points, 0 ppm and 5 ppm, orsome concentration where the calibration is linear;this gives the BEC. The RSDo is evaluated by run-ning the blank ten times. Typical detection limits in a solution of 10 % oil inkerosene are shown in Table 6 below. Element Wevelength (nm) LOD (ppb) Ag 328.068 1.4 AI 167.020 2.3 AI 308.215 6.5 Al 396.152 9.9 B 249.773 4.5 Ba 455.403 0.2 Ca 317.933 1.5 Cd 228.802 1.3 Cu 324.754 0.7 Mg_ 279.553 0.5 Mn 257.610 0.5 Mo 202.030 2.0 Na 588.995 4.9 Ni 231.604 0.9 P 178.229 14.4 Pb 220.353 20.2 Si 251.611 3.4 Sn 189.989 14.7 Ti 334.941 1.1 V 292.402 0.8 V 310.230 0.5 Zn 213.856 1.0 Because the aim of the analysis lubricating oils is tomonitor the oil of an engine and get a trend analy-sis over time, the best accuracy is not required. Thetrend analysis allows the analyst to see that the oilis changing and when the engine needs strippingdown before a catastrophic failure. The use of theinternal standard is not required because the resultsare only compared to previous results. The proce-dure is thus very simple: new two point calibrationeach time the sample is analyzed and dilution of thesamples by 1:5, 1:10 or 1:100, depending on theviscosity of the oil samples and whether lowerdetection limits are required. In the USA:Jobin Yvon Inc.3880 Park AvenueEdison, NJ 08820Tel: 1-732-494-8660Fax:1-732-494-8796E-mail:emission@jyhoriba.com MISSION·FLUORESCENCE·FORENSICS·GRATINGSGOEM·RAMAN·OPTICAL SPECTROSCOPY·THIN FILM
确定
还剩1页未读,是否继续阅读?

产品配置单

HORIBA(中国)为您提供《润滑油中元素分析检测方案 》,该方案主要用于润滑油中元素分析检测,参考标准--,《润滑油中元素分析检测方案 》用到的仪器有HORIBA Ultima Expert高性能ICP光谱仪
相关方案
更多
该厂商其他方案
更多