


方案详情
文
Metal oxides, in contrast to most metals, are well known to be easily distinguished by their characteristic Raman spectra; their presence can be detected on a scale of micrometers with a Raman microprobe. Often, the
various oxides of a particular metallic ion have significantly different Raman spectra, with even the degree of hydration of the ligated cation generating a tell-tale vibrational fingerprint. Thus, the diverse oxide forms
of a variety of metals, including, for example, iron, nickel, lead, titanium, zirconium, molybdenum, copper, and vanadium, can be distinguished by a fast and non-destructive spectroscopic measurement. In practice, this allows the scientist or engineer to delineate the kinetics of oxidation of any of these species, observing where and when successive species are formed during the oxidation of a raw metal. For example, steel rust exhibits
layers of several oxides of iron, including hematite, lepodocrocite, goethite,and magnetite, with the layer thicknesses and ordering dependent upon the composition of the steel, the conditions of the environment, and the
duration of exposure.
方案详情

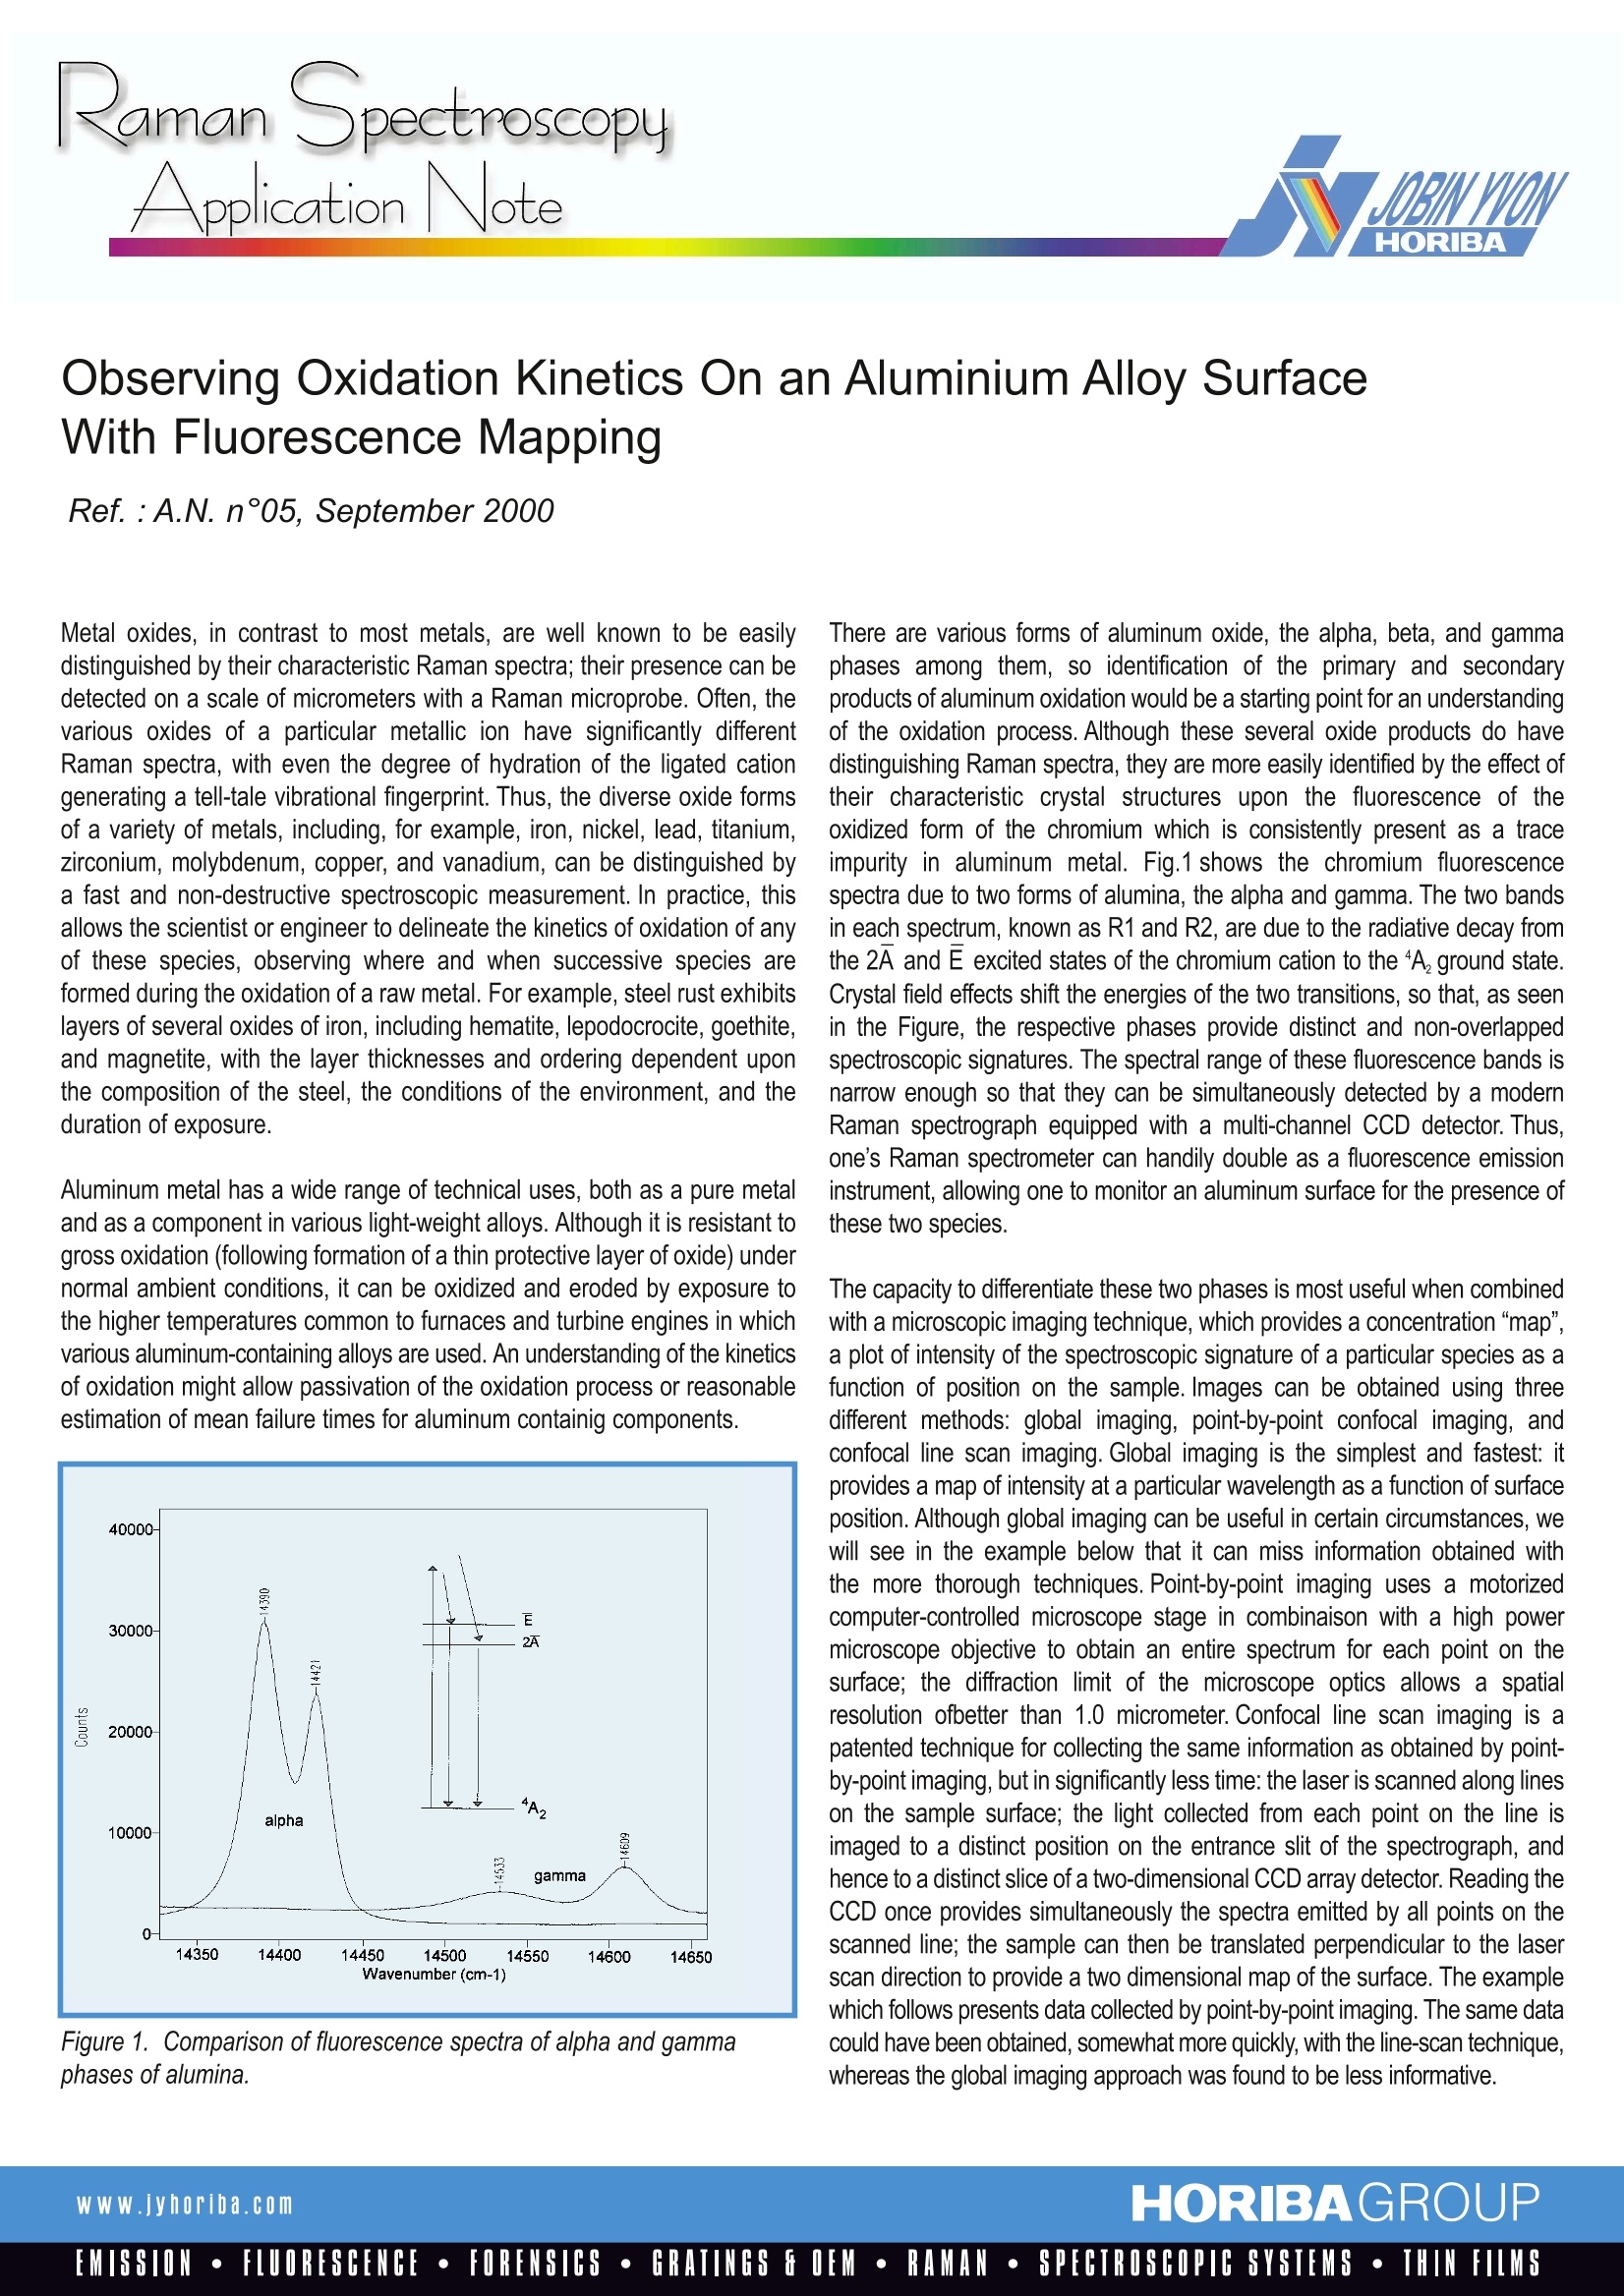
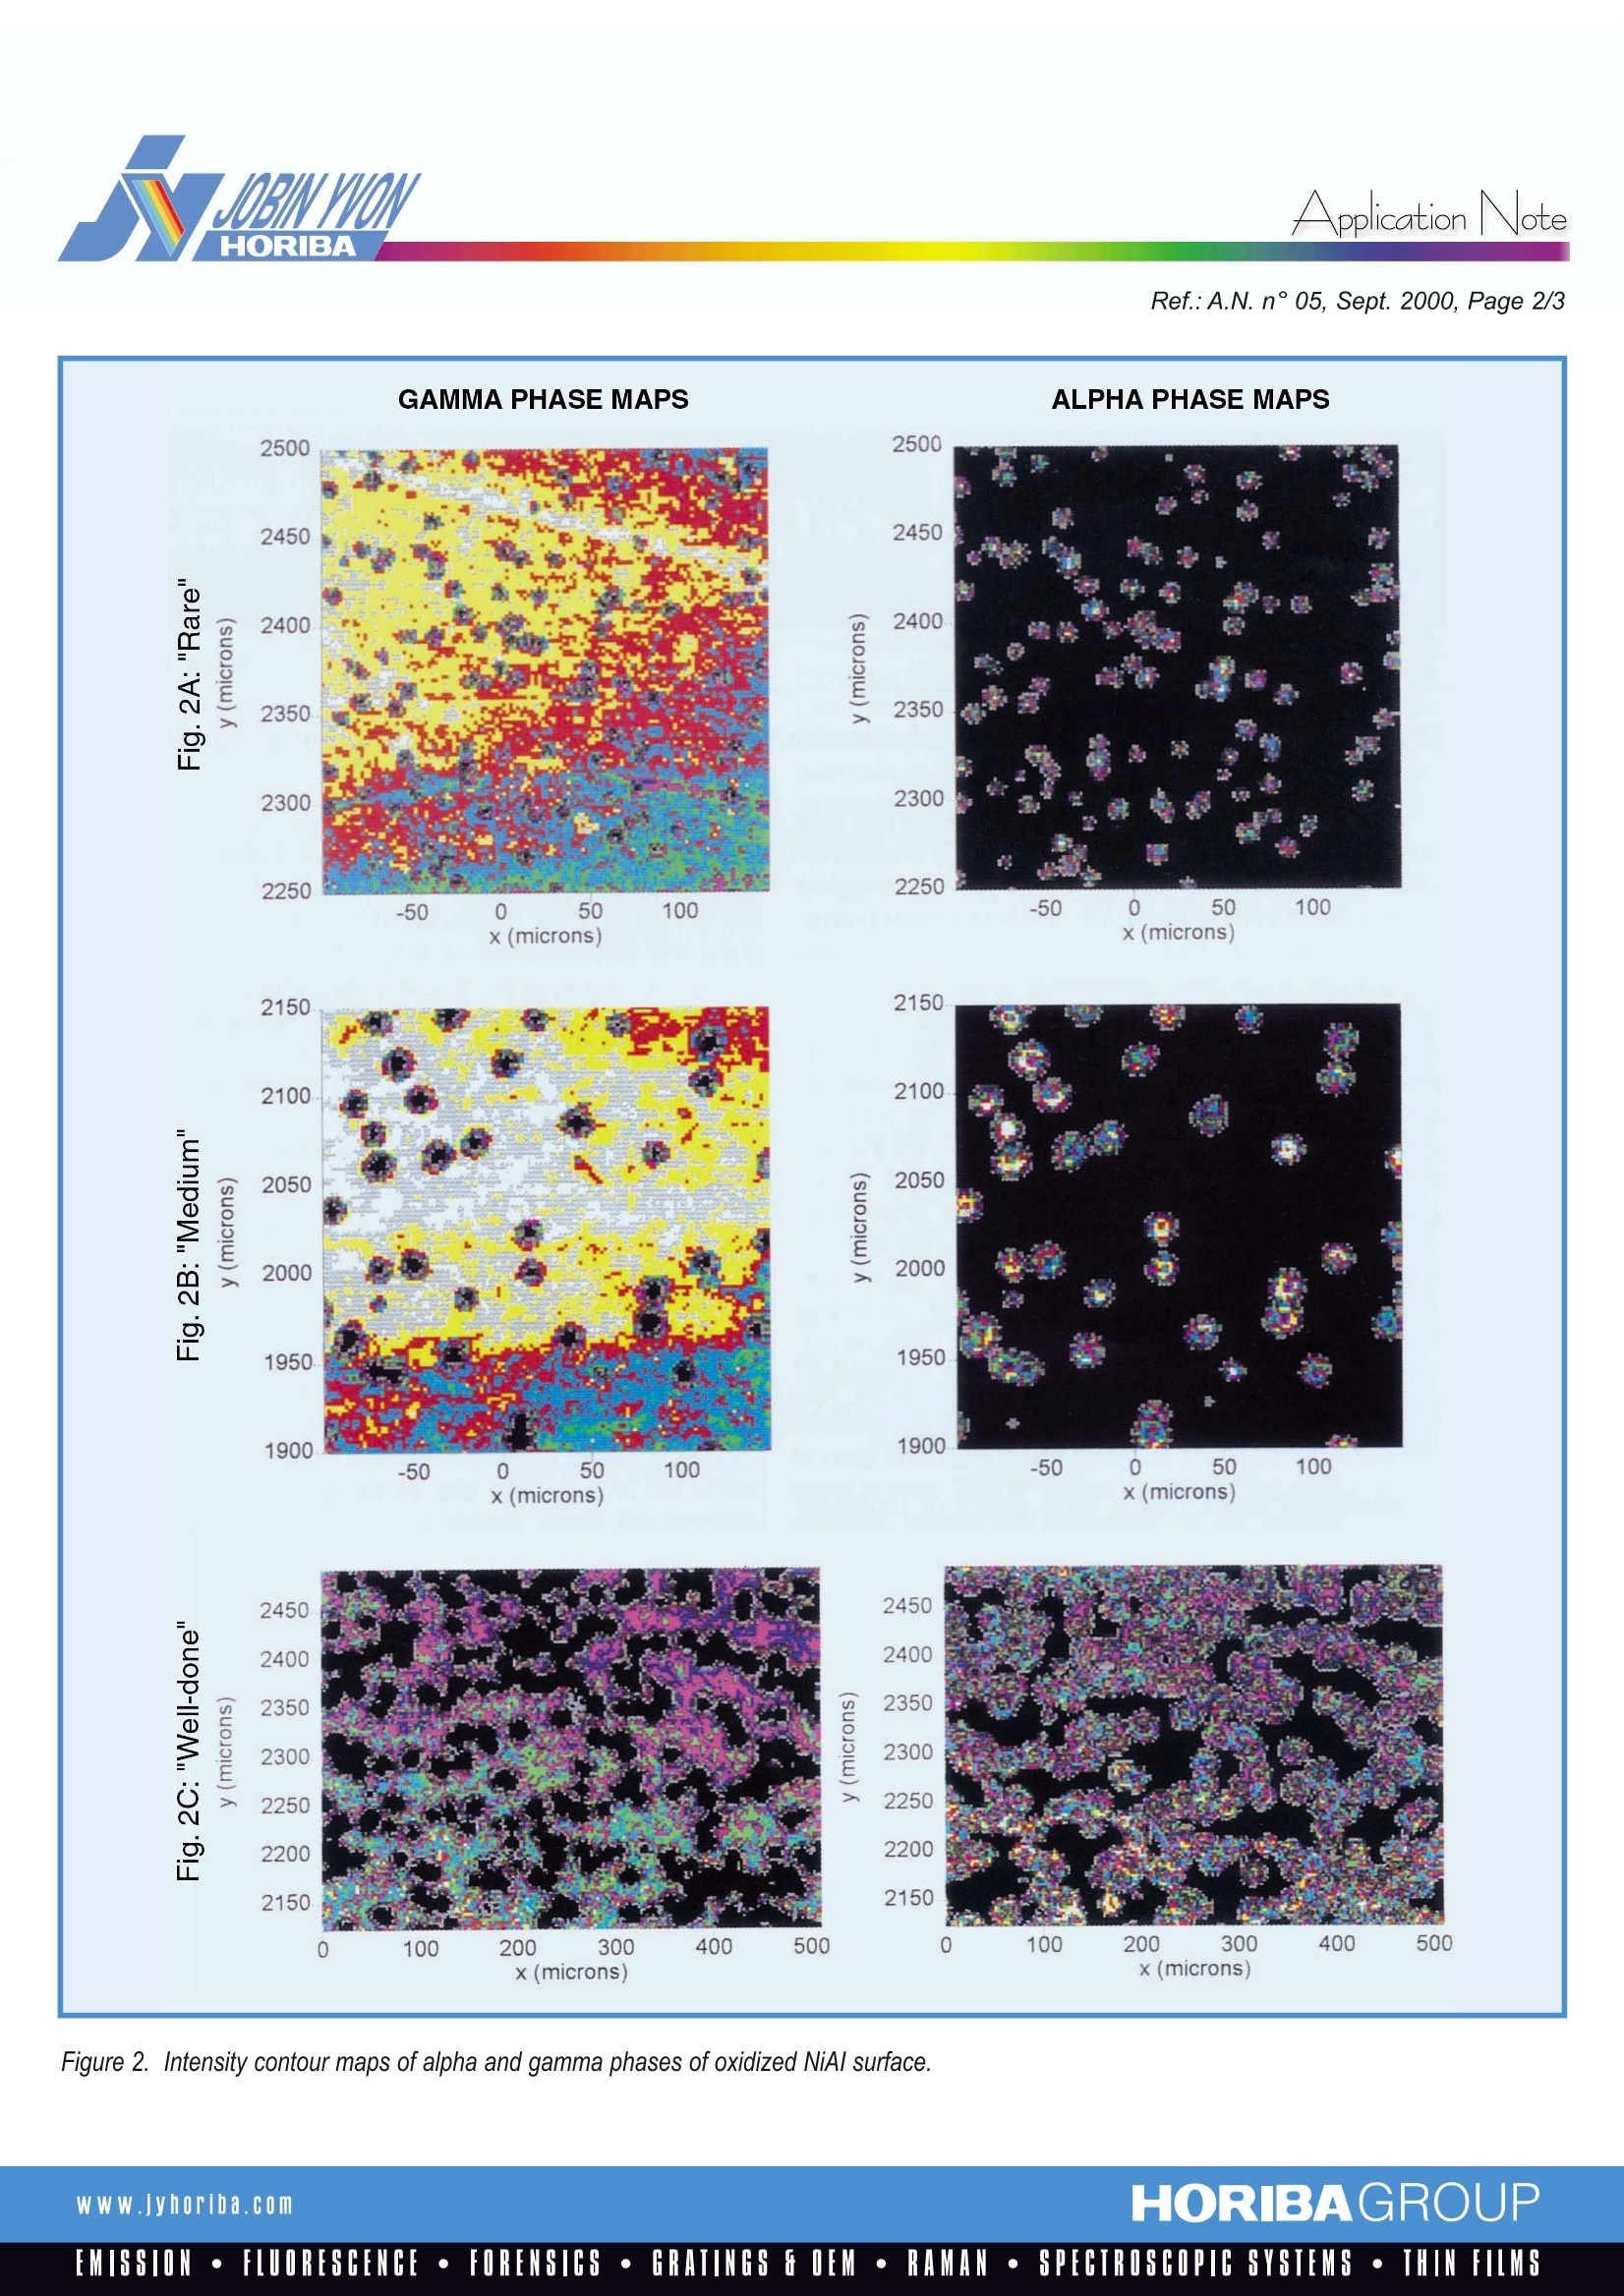
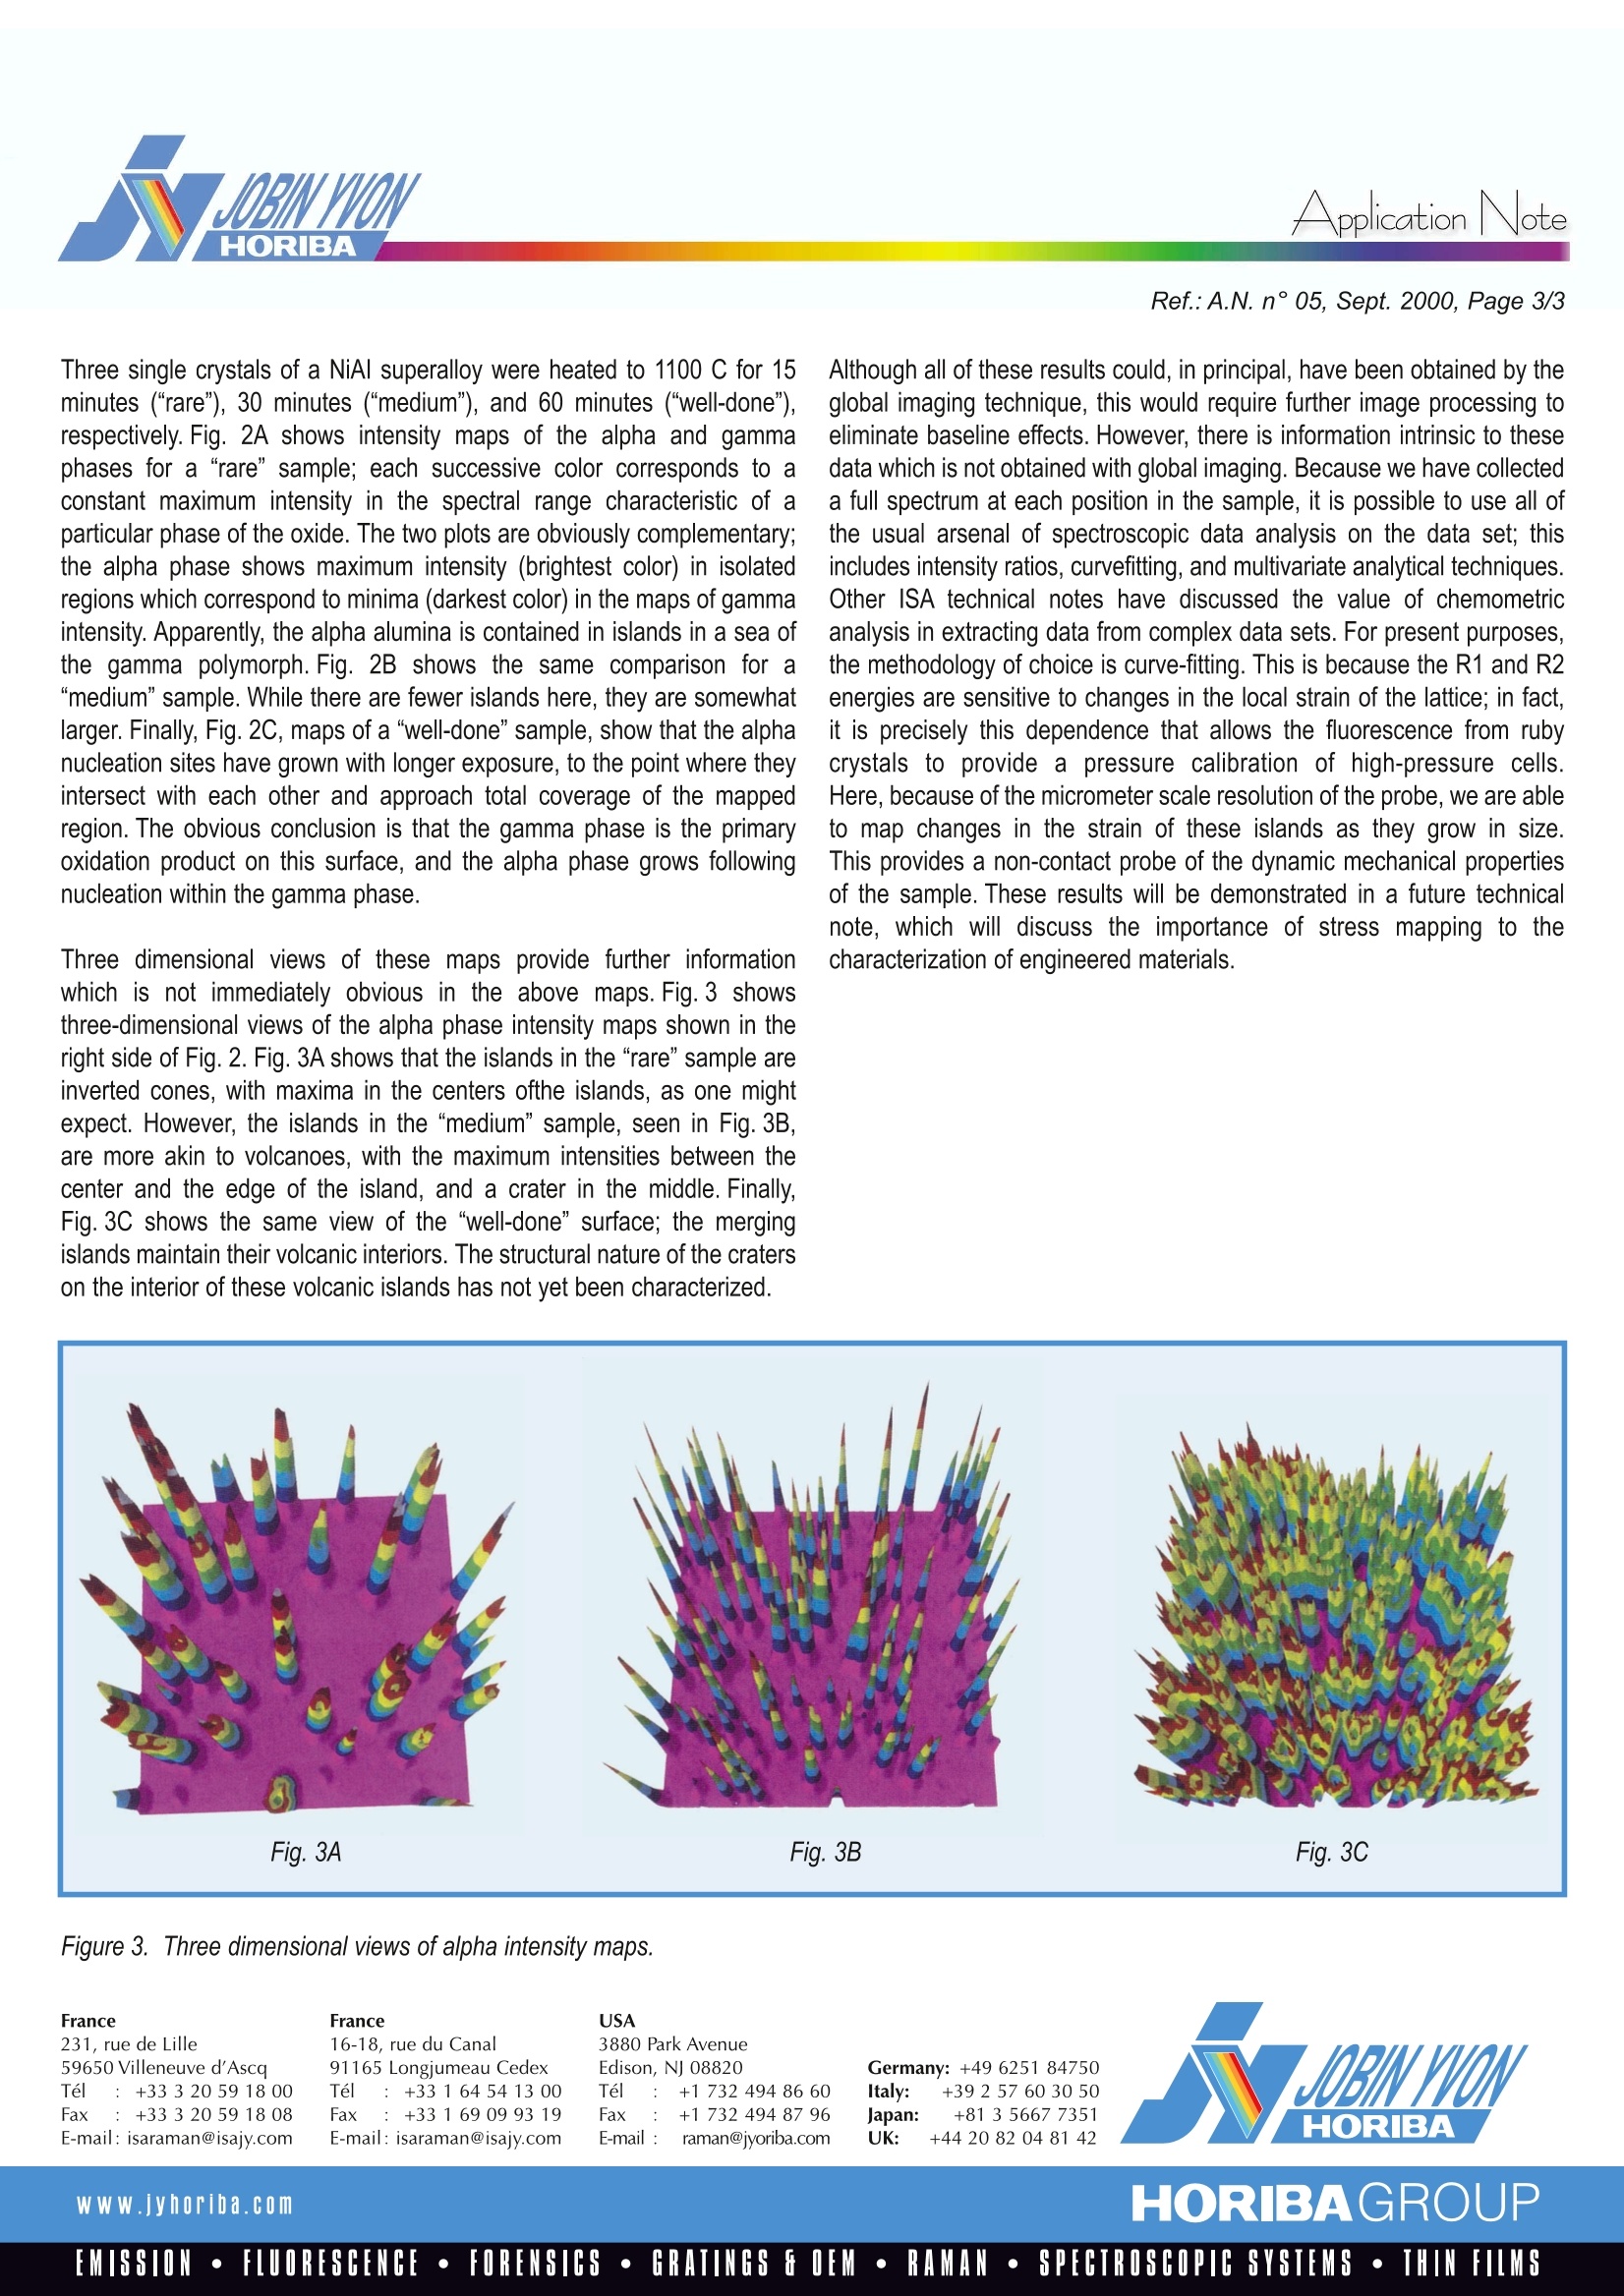
Raman9SpectroscopyApplicationNote Application NoteRef.:A.N. n°05, Sept. 2000, Page 2/3 Observing Oxidation Kinetics On an Aluminium Alloy SurfaceWith Fluorescence Mapping Metal oxides, in contrast to most metals, are well known to be easilydistinguished by their characteristic Raman spectra; their presence can bedetected on a scale of micrometers with a Raman microprobe. Often, thevarious oxides of a particular metallic ion have significantly differentRaman spectra, with even the degree of hydration of the ligated cationgenerating a tell-tale vibrational fingerprint. Thus, the diverse oxide formsof a variety of metals, including, for example, iron, nickel, lead, titanium,zirconium, molybdenum, copper, and vanadium, can be distinguished bya fast and non-destructive spectroscopic measurement. In practice, thisallows the scientist or engineer to delineate the kinetics of oxidation of anyof these species, observing where and when successive species areformed during the oxidation of a raw metal. For example, steel rust exhibitslayers of several oxides of iron, including hematite, lepodocrocite, goethite,and magnetite, with the layer thicknesses and ordering dependent uponthe composition of the steel, the conditions of the environment, and theduration of exposure. Aluminum metal has a wide range of technical uses, both as a pure metaland as a component in various light-weight alloys. Although it is resistant togross oxidation (following formation of a thin protective layer of oxide) undernormal ambient conditions, it can be oxidized and eroded by exposure tothe higher temperatures common to furnaces and turbine engines in whichvarious aluminum-containing alloys are used. An understanding of the kineticsof oxidation might allow passivation of the oxidation process or reasonableestimation of mean failure times for aluminum containig components. Figure 1. Comparison of fluorescence spectra of alpha and gammaphases of alumina. There are various forms of aluminum oxide, the alpha, beta, and gammaphases among them, so identification of the primary and secondaryproducts of aluminum oxidation would be a starting point for an understandingof the oxidation process. Although these several oxide products do havedistinguishing Raman spectra, they are more easily identified by the effect oftheir characteristic crystal structures upon the fluorescence of theoxidized form of the chromium which is consistently present as a traceimpurity in aluminum metal. Fig.1 shows the chromium fluorescencespectra due to two forms of alumina, the alpha and gamma. The two bandsin each spectrum, known as R1 and R2, are due to the radiative decay fromthe 2A and E excited states of the chromium cation to the A, ground state.Crystal field effects shift the energies of the two transitions, so that, as seenin the Figure, the respective phases provide distinct and non-overlappedspectroscopic signatures. The spectral range of these fluorescence bands isnarrow enough so that they can be simultaneously detected by a modernRaman spectrograph equipped with a multi-channel CCD detector. Thus,one’s Raman spectrometer can handily double as a fluorescence emissioninstrument, allowing one to monitor an aluminum surface for the presence ofthese two species. The capacity to differentiate these two phases is most useful when combinedwith a microscopic imaging technique, which provides a concentration“map”,a plot of intensity of the spectroscopic signature of a particular species as afunction of position on the sample. Images can be obtained using threedifferent methods: global imaging, point-by-point confocal imaging, andconfocal line scan imaging.Global imaging is the simplest and fastest: itprovides a map of intensity at a particular wavelength as a function of surfaceposition. Although global imaging can be useful in certain circumstances, wewill see in the example below that it can miss information obtained withthe more thorough techniques. Point-by-point imaging uses a motorizedcomputer-controlled microscope stage in combinaison with a high powermicroscope objective to obtain an entire spectrum for each point on thesurface; the diffraction limit of the microscope optics allows a spatialresolution ofbetter than 1.0 micrometer.Confocal line scan imaging is apatented technique for collecting the same information as obtained by point-by-pointimaging, but in significantly less time: the laser is scanned along lineson the sample surface; the light collected from each point on the line isimaged to a distinct position on the entrance slit of the spectrograph, andhence to a distinct slice of a two-dimensional CCD array detector. Reading theCCD once provides simultaneously the spectra emitted by all points on thescanned line; the sample can then be translated perpendicular to the laserscan direction to provide a two dimensional map of the surface. The examplewhich follows presents data collected by point-by-point imaging. The same datacould have been obtained, somewhat more quickly, with the line-scan technique,whereas the global imaging approach was found to be less informative. Figure 2. Intensity contour maps of alpha and gamma phases of oxidized NiAl surface. Three single crystals of a NiAl superalloy were heated to 1100 C for 15minutes ("rare"), 30 minutes (“medium”), and 60 minutes (“well-done"),respectively. Fig. 2A shows intensity maps of the alpha and gammaphases for a “rare" sample; each successive color corresponds to aconstant maximum intensity in the spectral range characteristic of aparticular phase of the oxide. The two plots are obviously complementary;the alpha phase shows maximum intensity (brightest color) in isolatedregions which correspond to minima (darkest color) in the maps of gammaintensity. Apparently, the alpha alumina is contained in islands in a sea ofthe gamma polymorph. Fig. 2B shows the same comparison for a“medium" sample. While there are fewer islands here, they are somewhatlarger. Finally, Fig. 2C, maps of a "well-done" sample, show that the alphanucleation sites have grown with longer exposure, to the point where theyintersect with each other and approach total coverage of the mappedregion.The obvious conclusion is that the gamma phase is the primaryoxidation product on this surface, and the alpha phase grows followingnucleation within the gamma phase. Three dimensional views of these maps provide further informationwhich is not immediately obvious in the above maps. Fig. 3 showsthree-dimensional views of the alpha phase intensity maps shown in theright side of Fig. 2. Fig. 3A shows that the islands in the “rare" sample areinverted cones, with maxima in the centers ofthe islands, as one mightexpect. However, the islands in the “medium" sample, seen in Fig.3B,are more akin to volcanoes, with the maximum intensities between thecenter and the edge of the island, and a crater in the middle. Finally,Fig. 3C shows the same view of the “well-done” surface; the mergingislands maintain their volcanic interiors. The structural nature of the craterson the interior of these volcanic islands has not yet been characterized. Although all of these results could, in principal, have been obtained by theglobal imaging technique, this would require further image processing toeliminate baseline effects.However, there is information intrinsic to thesedata which is not obtained with global imaging. Because we have collecteda full spectrum at each position in the sample, it is possible to use all ofthe usual arsenal of spectroscopic data analysis on the data set; thisincludes intensity ratios, curvefitting, and multivariate analytical techniques.Other ISA technical notes have discussed the value of chemometricanalysis in extracting data from complex data sets. For present purposes,the methodology of choice is curve-fitting. This is because the R1 and R2energies are sensitive to changes in the local strain of the lattice; in fact,it is precisely this dependence that allows the fluorescence from rubycrystals to provide a pressure calibration of high-pressure cells.Here, because of the micrometer scale resolution of the probe, we are ableto map changes in the strain of these islands as they grow in size.This provides a non-contact probe of the dynamic mechanical propertiesof the sample. These results will be demonstrated in a future technicalnote, which will discuss the importance of stress mapping to thecharacterization of engineered materials. Figure3. Three dimensional views of alpha intensity maps. France231, rue de Lille59650 Villeneuve d'AscaTel :+33320591800Fax: +33320 591808E-mail: isaraman@isajy.com USA France16-18, rue du Canal91165 Longjumeau CedexTel :+33164541300Fax:+33169099319E-mail: isaraman@isajy.com 3880 Park AvenueEdison, NJ 08820Tel :+1 732 494 86 60Fax: +1 7324948796E-mail :raman@jyoriba.com Www.yhoriba.com HORIBAGROUPEMISSION·FLUORESCENCE·FORENSICS·GRATINGS FOEM·RAMAN·SPECTROSCOPIC SYSTEMS· THIN FILMS
确定
还剩1页未读,是否继续阅读?

产品配置单
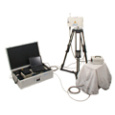
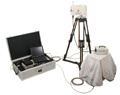
HORIBA(中国)为您提供《Observing Oxidation Kinetics On an Aluminium Alloy Surface》,该方案主要用于其他中--检测,参考标准--,《Observing Oxidation Kinetics On an Aluminium Alloy Surface》用到的仪器有HORIBA HE科研级便携拉曼光谱仪
相关方案
更多
该厂商其他方案
更多