


方案详情
文
The analysis of impurities in Rhodium samples requires an instrument with high resolution to avoid inter-element correction and obtain low
detection limits. For this reason the JY ULTIMA was used. This Application Note reports the wavelengths that were used in this difficult matrix and the detection limits obtained.
方案详情

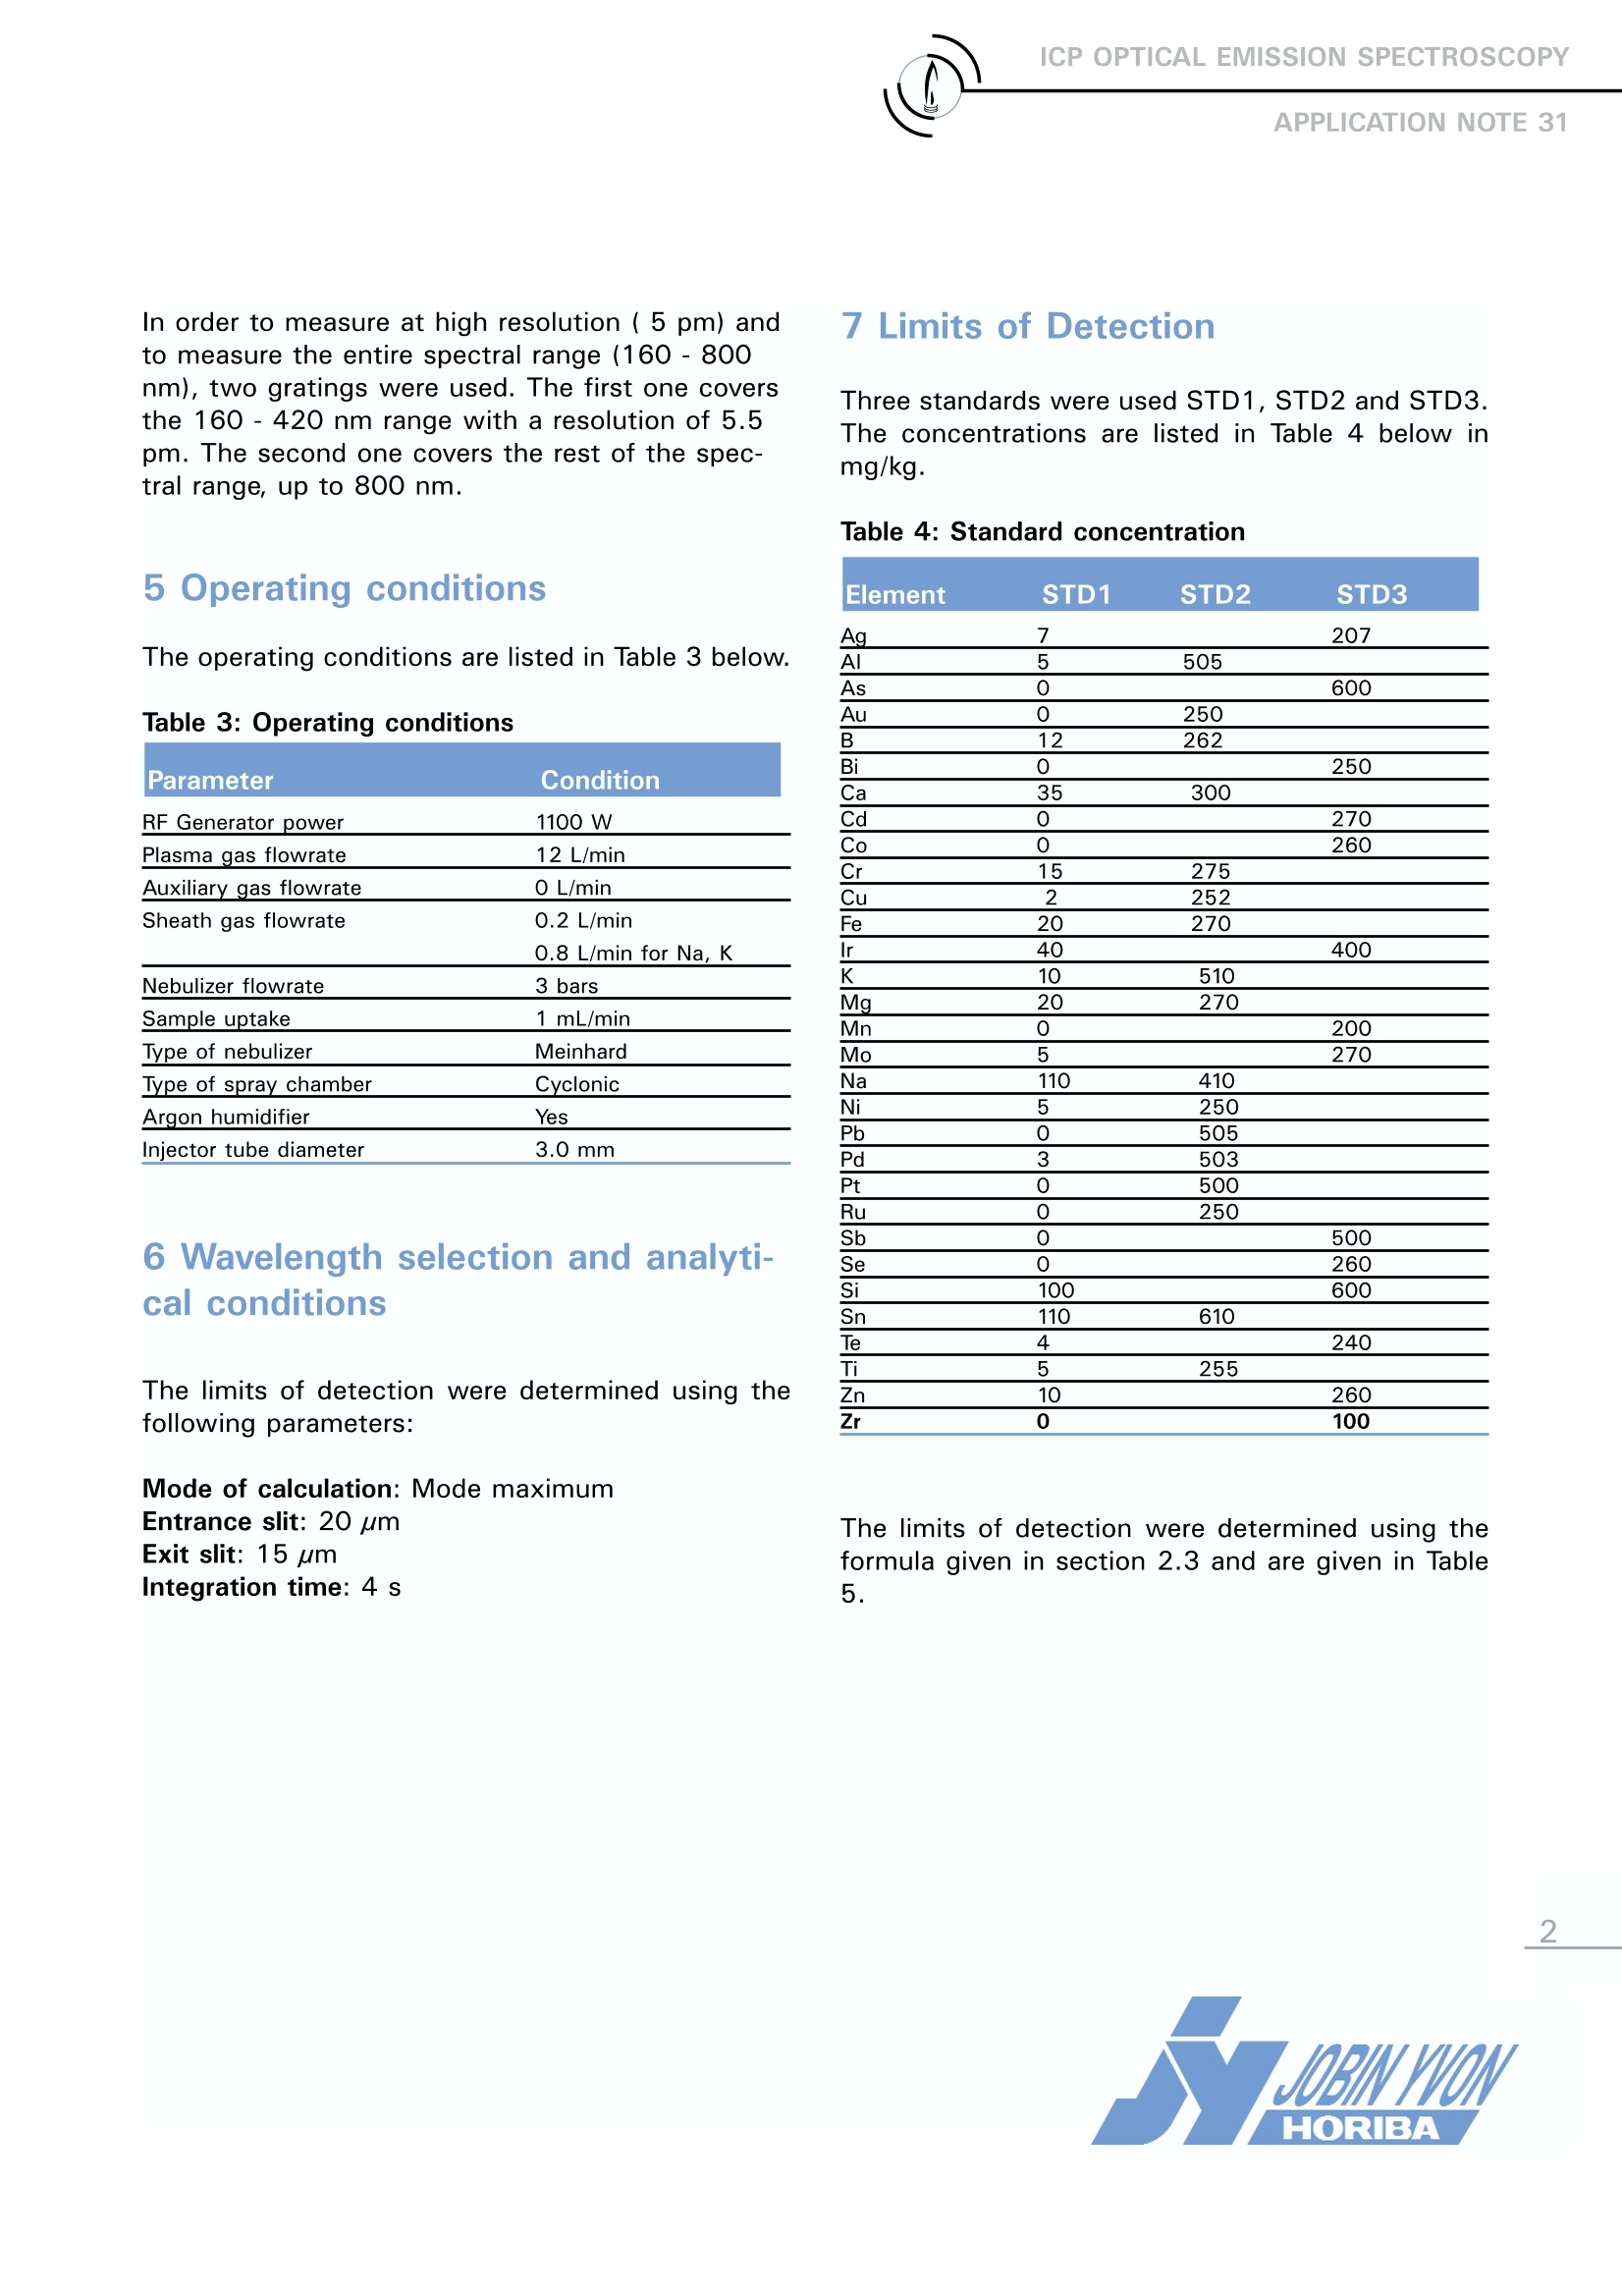
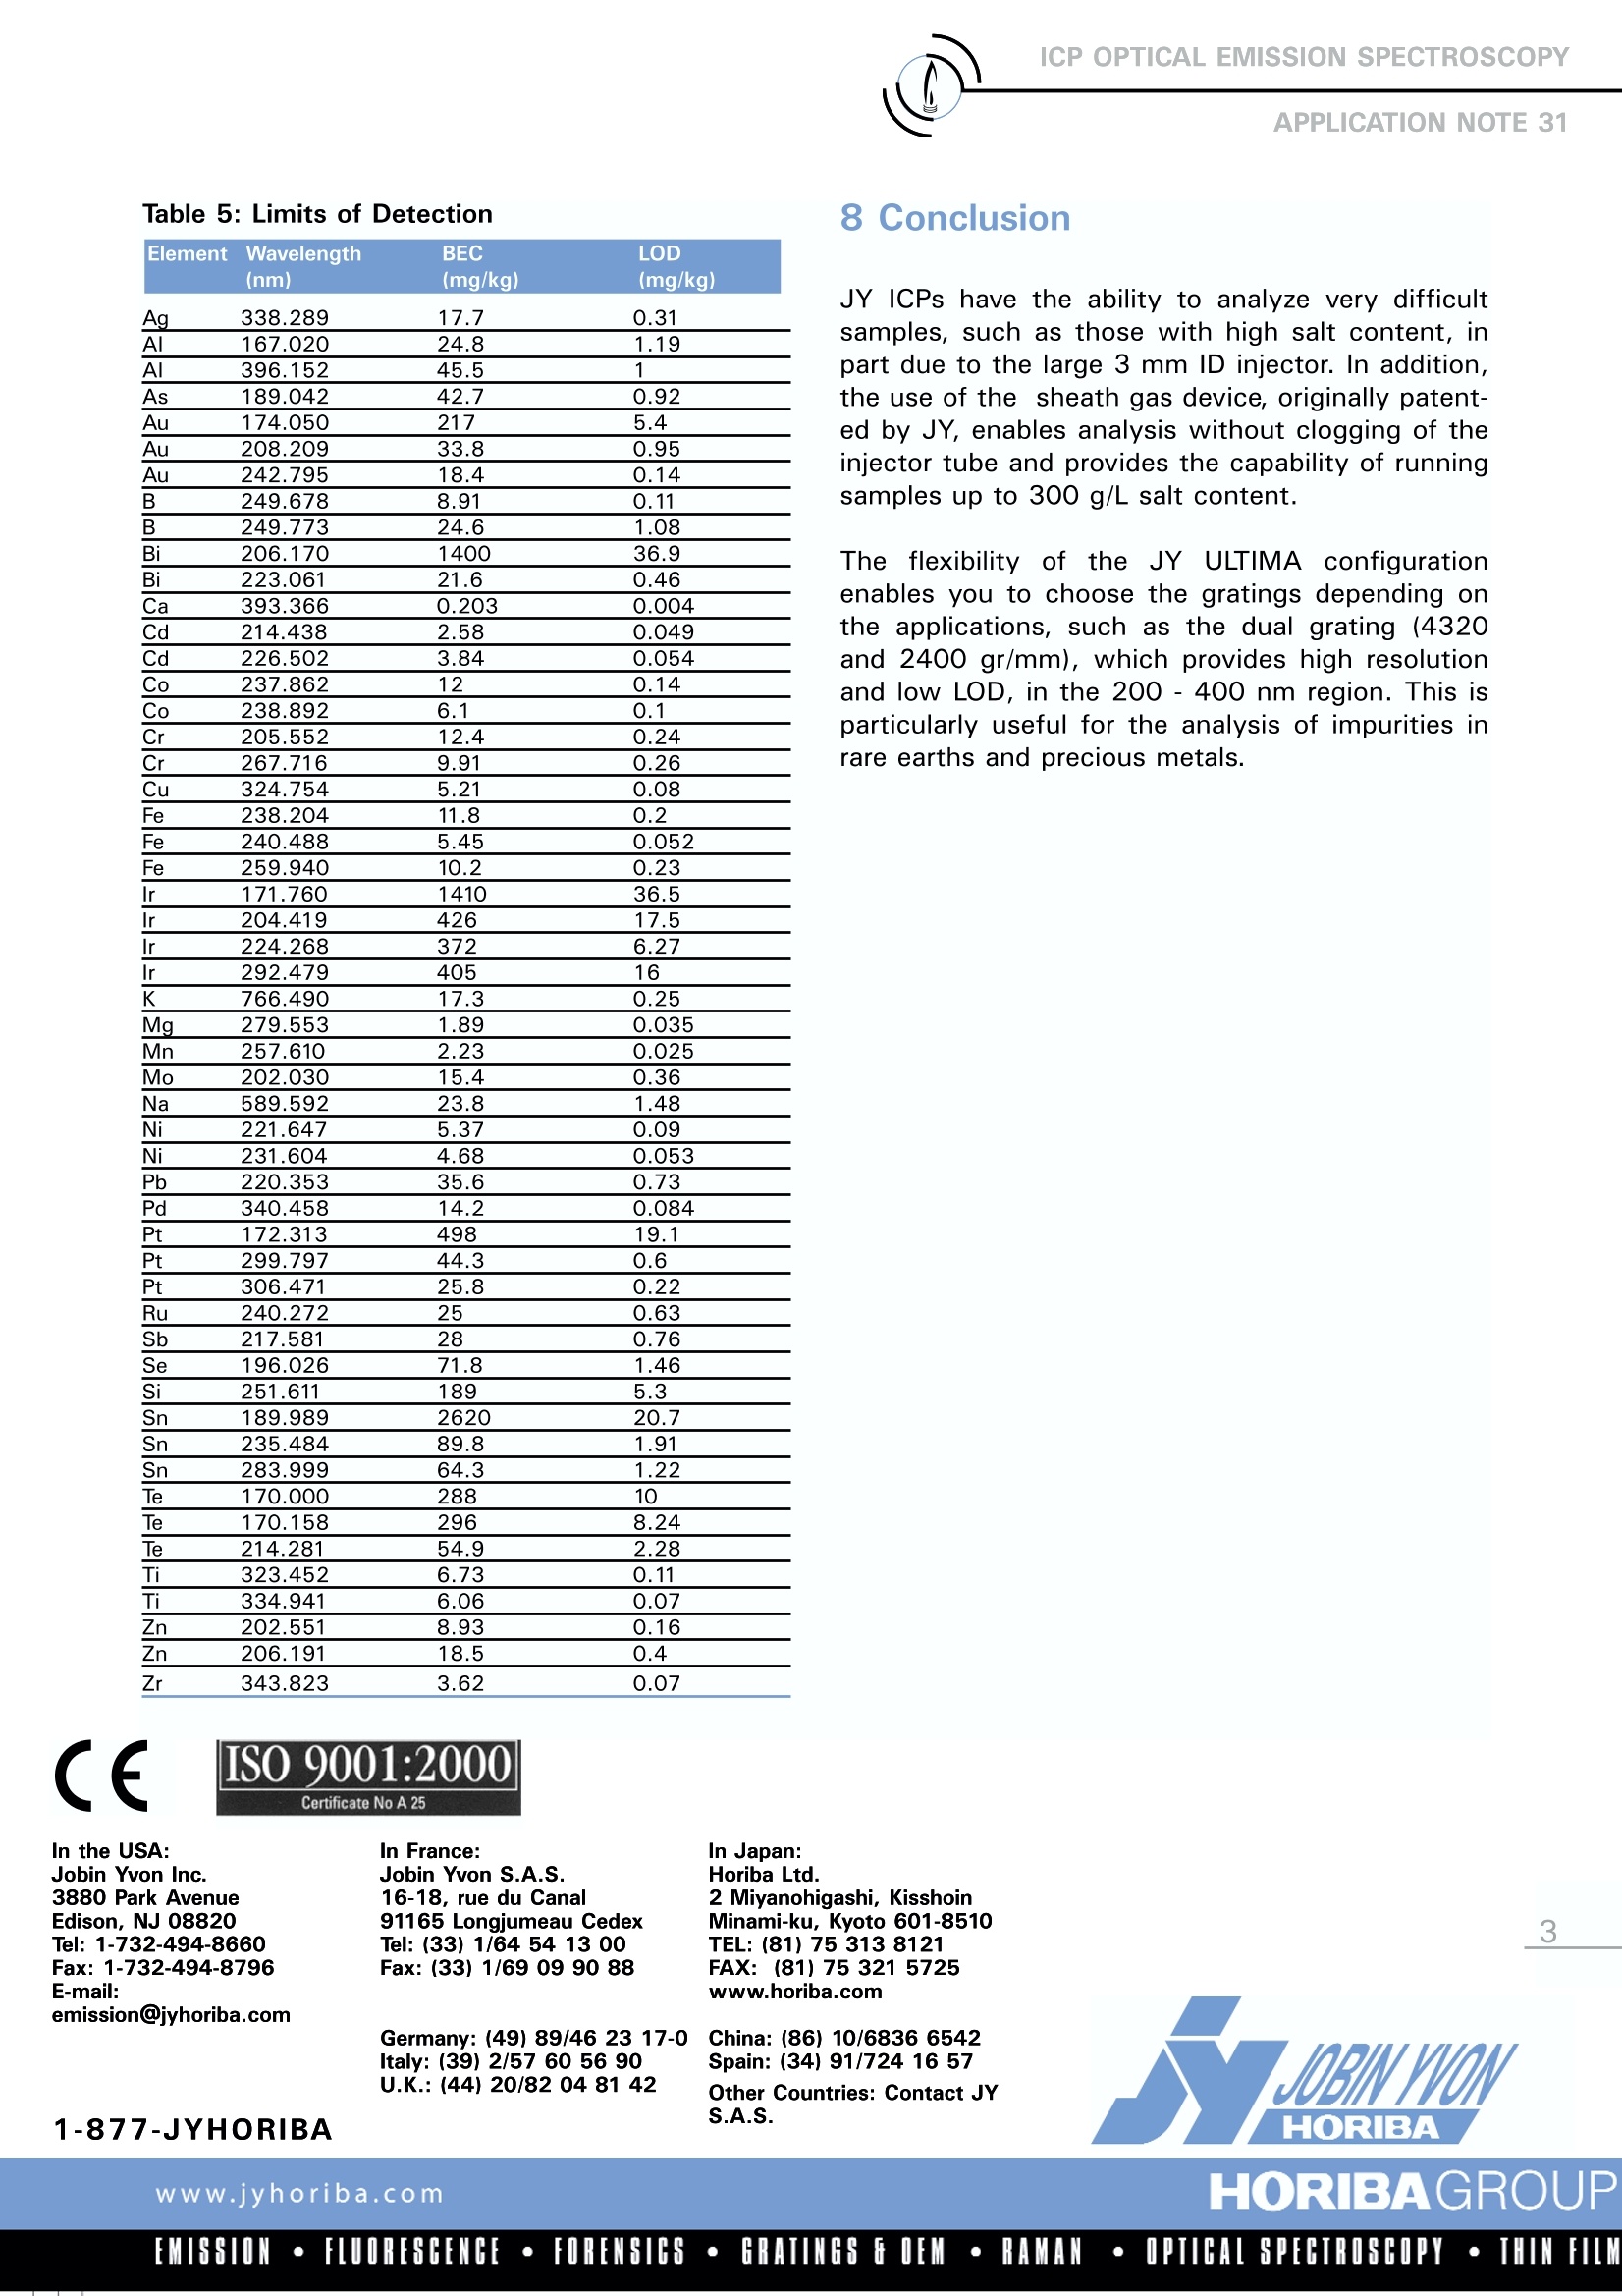
|CP OPTICAL EMISSION SPECTROSCOPYAPPLICATION NOTE 31 Limits of Detection Obtained by ICP-OES in 10 g/L Rhodium Nathalie Le Corre Jobin Yvon S.A.S., Horiba GroupLongjumeau, France 1 Introduction The analysis of impurities in Rhodium samplesrequires an instrument with high resolution toavoid inter-element correction and obtain lowdetection limits. For this reason the JY ULTIMAwas used.A This Application Note reports thewavelengths that were used in this difficultmatrix and the detection limits obtained. 2 Principle 2.1 Technique used The elemental analysis of solutions was under-taken by Inductively Coupled Plasma OpticalEmission Spectrometry (ICP-OES). The sample isnebulized then transferred to an argon plasma. Itis decomposed, atomized and ionized wherebythe atoms and ions are excited. We measure theintensity of the light emitted when the atoms orions return to lower levels of energy.y.Each ele-ment emits light at characteristic wavelengthsand these lines can be used for quantitativeanalysis after a calibration. 2.2 Wavelength choice The choice of the wavelength in a given matrixcan be made using the "profile"function, or byusing Win-IMAGE, which is rapid semi-quantita-tive analysis mode using multiple wavelengths.The principle is the same in either case: recordthe scans of analytes at low concentration, andof the matrix. By superimposing the spectra, wesee possible interferences. 2.3 Limits of detection estimation The limits of detection are calculated using thefollowing formula: With: LOD = limits of detection, k= 3 for the normal 3-sigma values, BEC = Background equivalent concentration, RSDo= relative standard deviation of the blank. To calculate the LOD, a calibration curve is con-structed using two points, 0 ppm and 5 ppm, orsome concentration where the calibration is lin-ear; this gives the BEC. The RSDo is evaluated byrunning the blank ten times. 3 Sample Preparation The samples were prepared in HCI giving aRhCl/HCI matrix. 4 Instrument specification The work was done on a JY ULTIMA.The speci-fications of this instrument are listed below inTables 1 and 2. Table 1: Specification of spectrometer Parameters Specifications Mounting Czerny Turner Focal length 1m Nitrogen purge Yes Variable resolution Yes Grating number of grooves 2400 gr/mm Order 2nd order Table 2: Specification of RF Generator Parameters Specifications Type of generator Solid state Observation Radial Frequency 40.68 MHz Control of gas flowrate by computer Control of pump flow by computer Cooling air In order to measure at high resolution(5 pm) andto measure the entire spectral range (160-800nm), two gratings were used. The first one coversthe 160 -420 nm range with a resolution of 5.5pm. The second one covers the rest of the spec-tral range, up to 800 nm. 5 Operating conditions The operating conditions are listed in Table 3 below. Table 3: Operating conditions Parameter Condition RF Generator power 1100 W Plasma gas flowrate 12 L/min Auxiliary gas flowrate 0 L/min Sheath gas flowrate 0.2 L/min 0.8 L/min for Na, K Nebulizer flowrate 3 bars Sample uptake 1 mL/min Type of nebulizer Meinhard Type of spray chamber Cyclonic Argon humidifier Yes Injector tube diameter 3.0 mm 6 Wavelength selection and analyti-cal conditions The limits of detection were determined using thefollowing parameters: Mode of calculation: Mode maximumEntrance slit: 20 umExit slit: 15 umIntegration time: 4 s 7 Limits of Detection Three standards were used STD1, STD2 and STD3.The concentrations are listed in Table 4 below inmg/kg. Table 4: Standard concentration The limits of detection were determined using theformula given in section 2.3 and are given in Table5. 8 Conclusion JY ICPs have the ability to analyze very difficultsamples, such as those with high salt content, inpart due to the large 3 mm ID injector. In addition,the use of the sheath gas device, originally patent-ed by JY, enables analysis without clogging of theinjector tube and provides the capability of runningsamples up to 300 g/L salt content. The flexibility of the JY ULTIMA configurationenables you to choose the gratings depending onthe applications, such as the dual grating (4320and 2400 gr/mm), which provides high resolutionand low LOD, in the 200 -400 nm region. This isparticularly useful for the analysis of impurities inrare earths and precious metals. Table 5: Limits of Detection Zr 343.823 3.62 0.07 CEISO 9001:2000 MISSION·FLUORESCENCE·FORENSICS·GRATINGSGOEM·RAMAN·OPTICAL SPECTROSCOPY·THINFILM
确定
还剩1页未读,是否继续阅读?

产品配置单

HORIBA(中国)为您提供《ICP-AES分析10g/L铑溶液时获得的各元素检出限》,该方案主要用于其他中--检测,参考标准--,《ICP-AES分析10g/L铑溶液时获得的各元素检出限》用到的仪器有HORIBA Ultima Expert高性能ICP光谱仪
相关方案
更多
该厂商其他方案
更多