方案详情
文
Quartz filters are used to monitor air contamination; they are often placed in work areas where potential specific contamination can occur. The analysis of impurities in quartz filters was undertaken
after digestion with HF and HNO3. The JY ULTIMA was used because of its high sensitivity.
方案详情

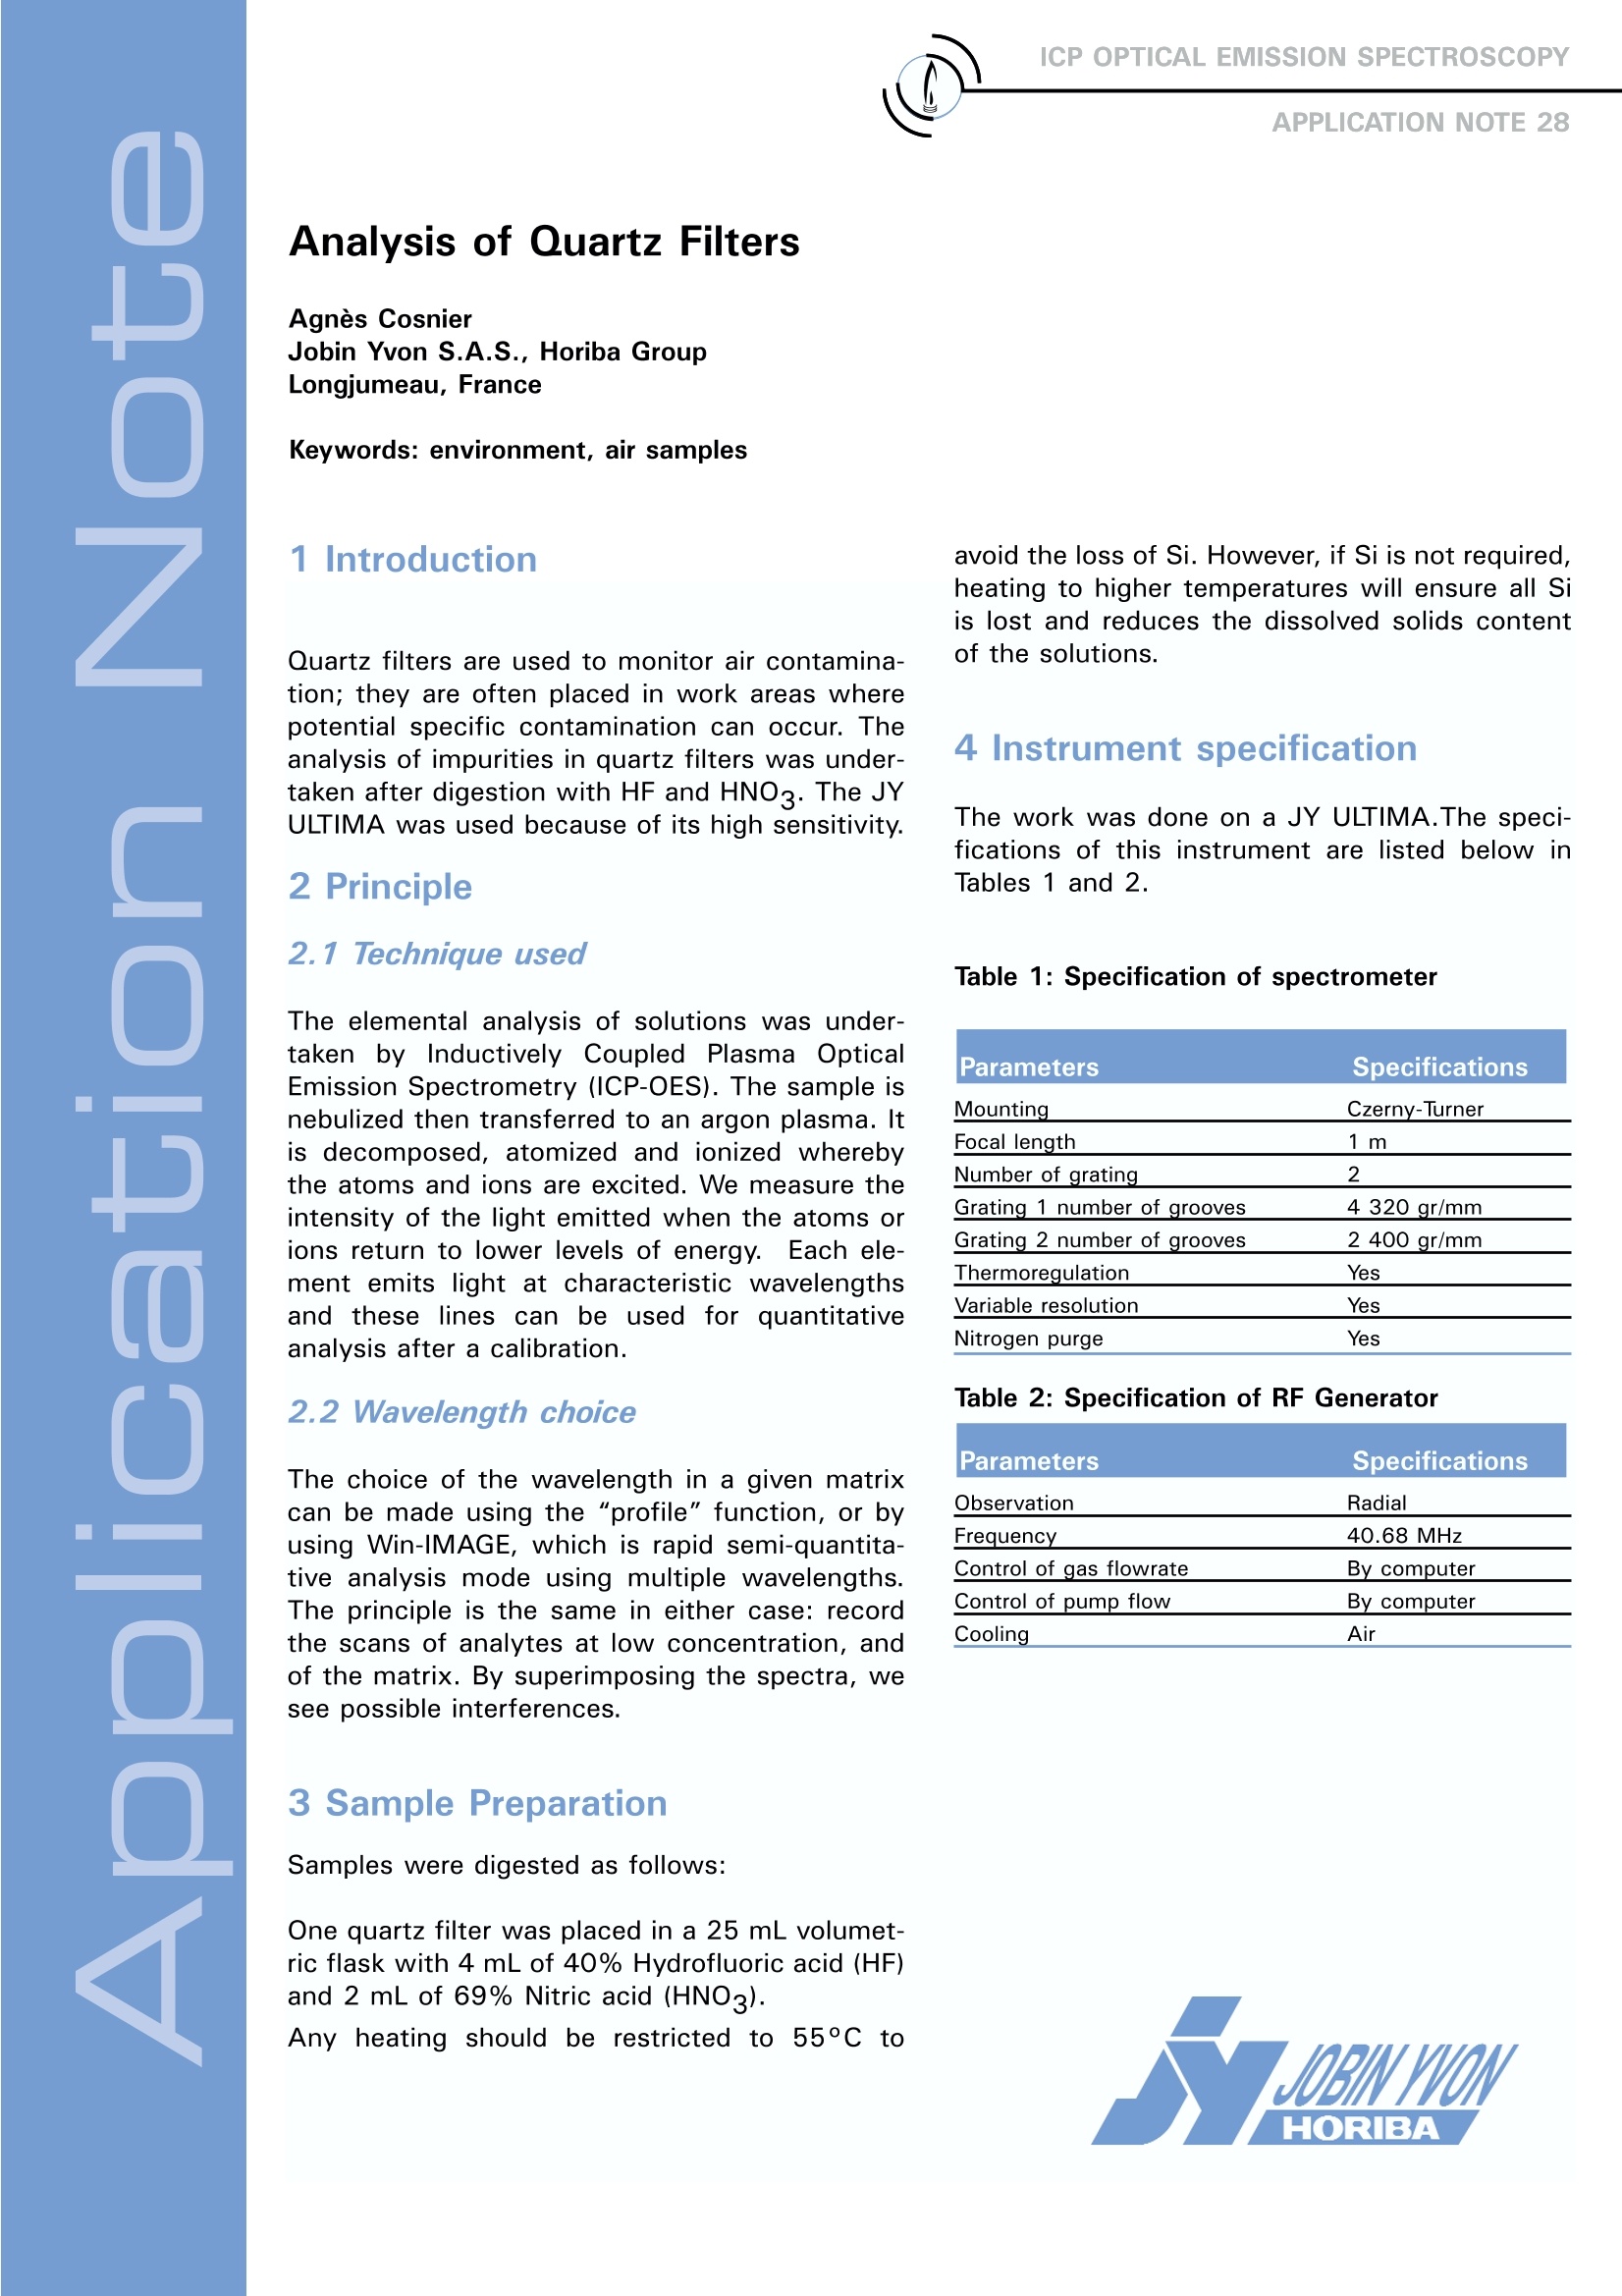
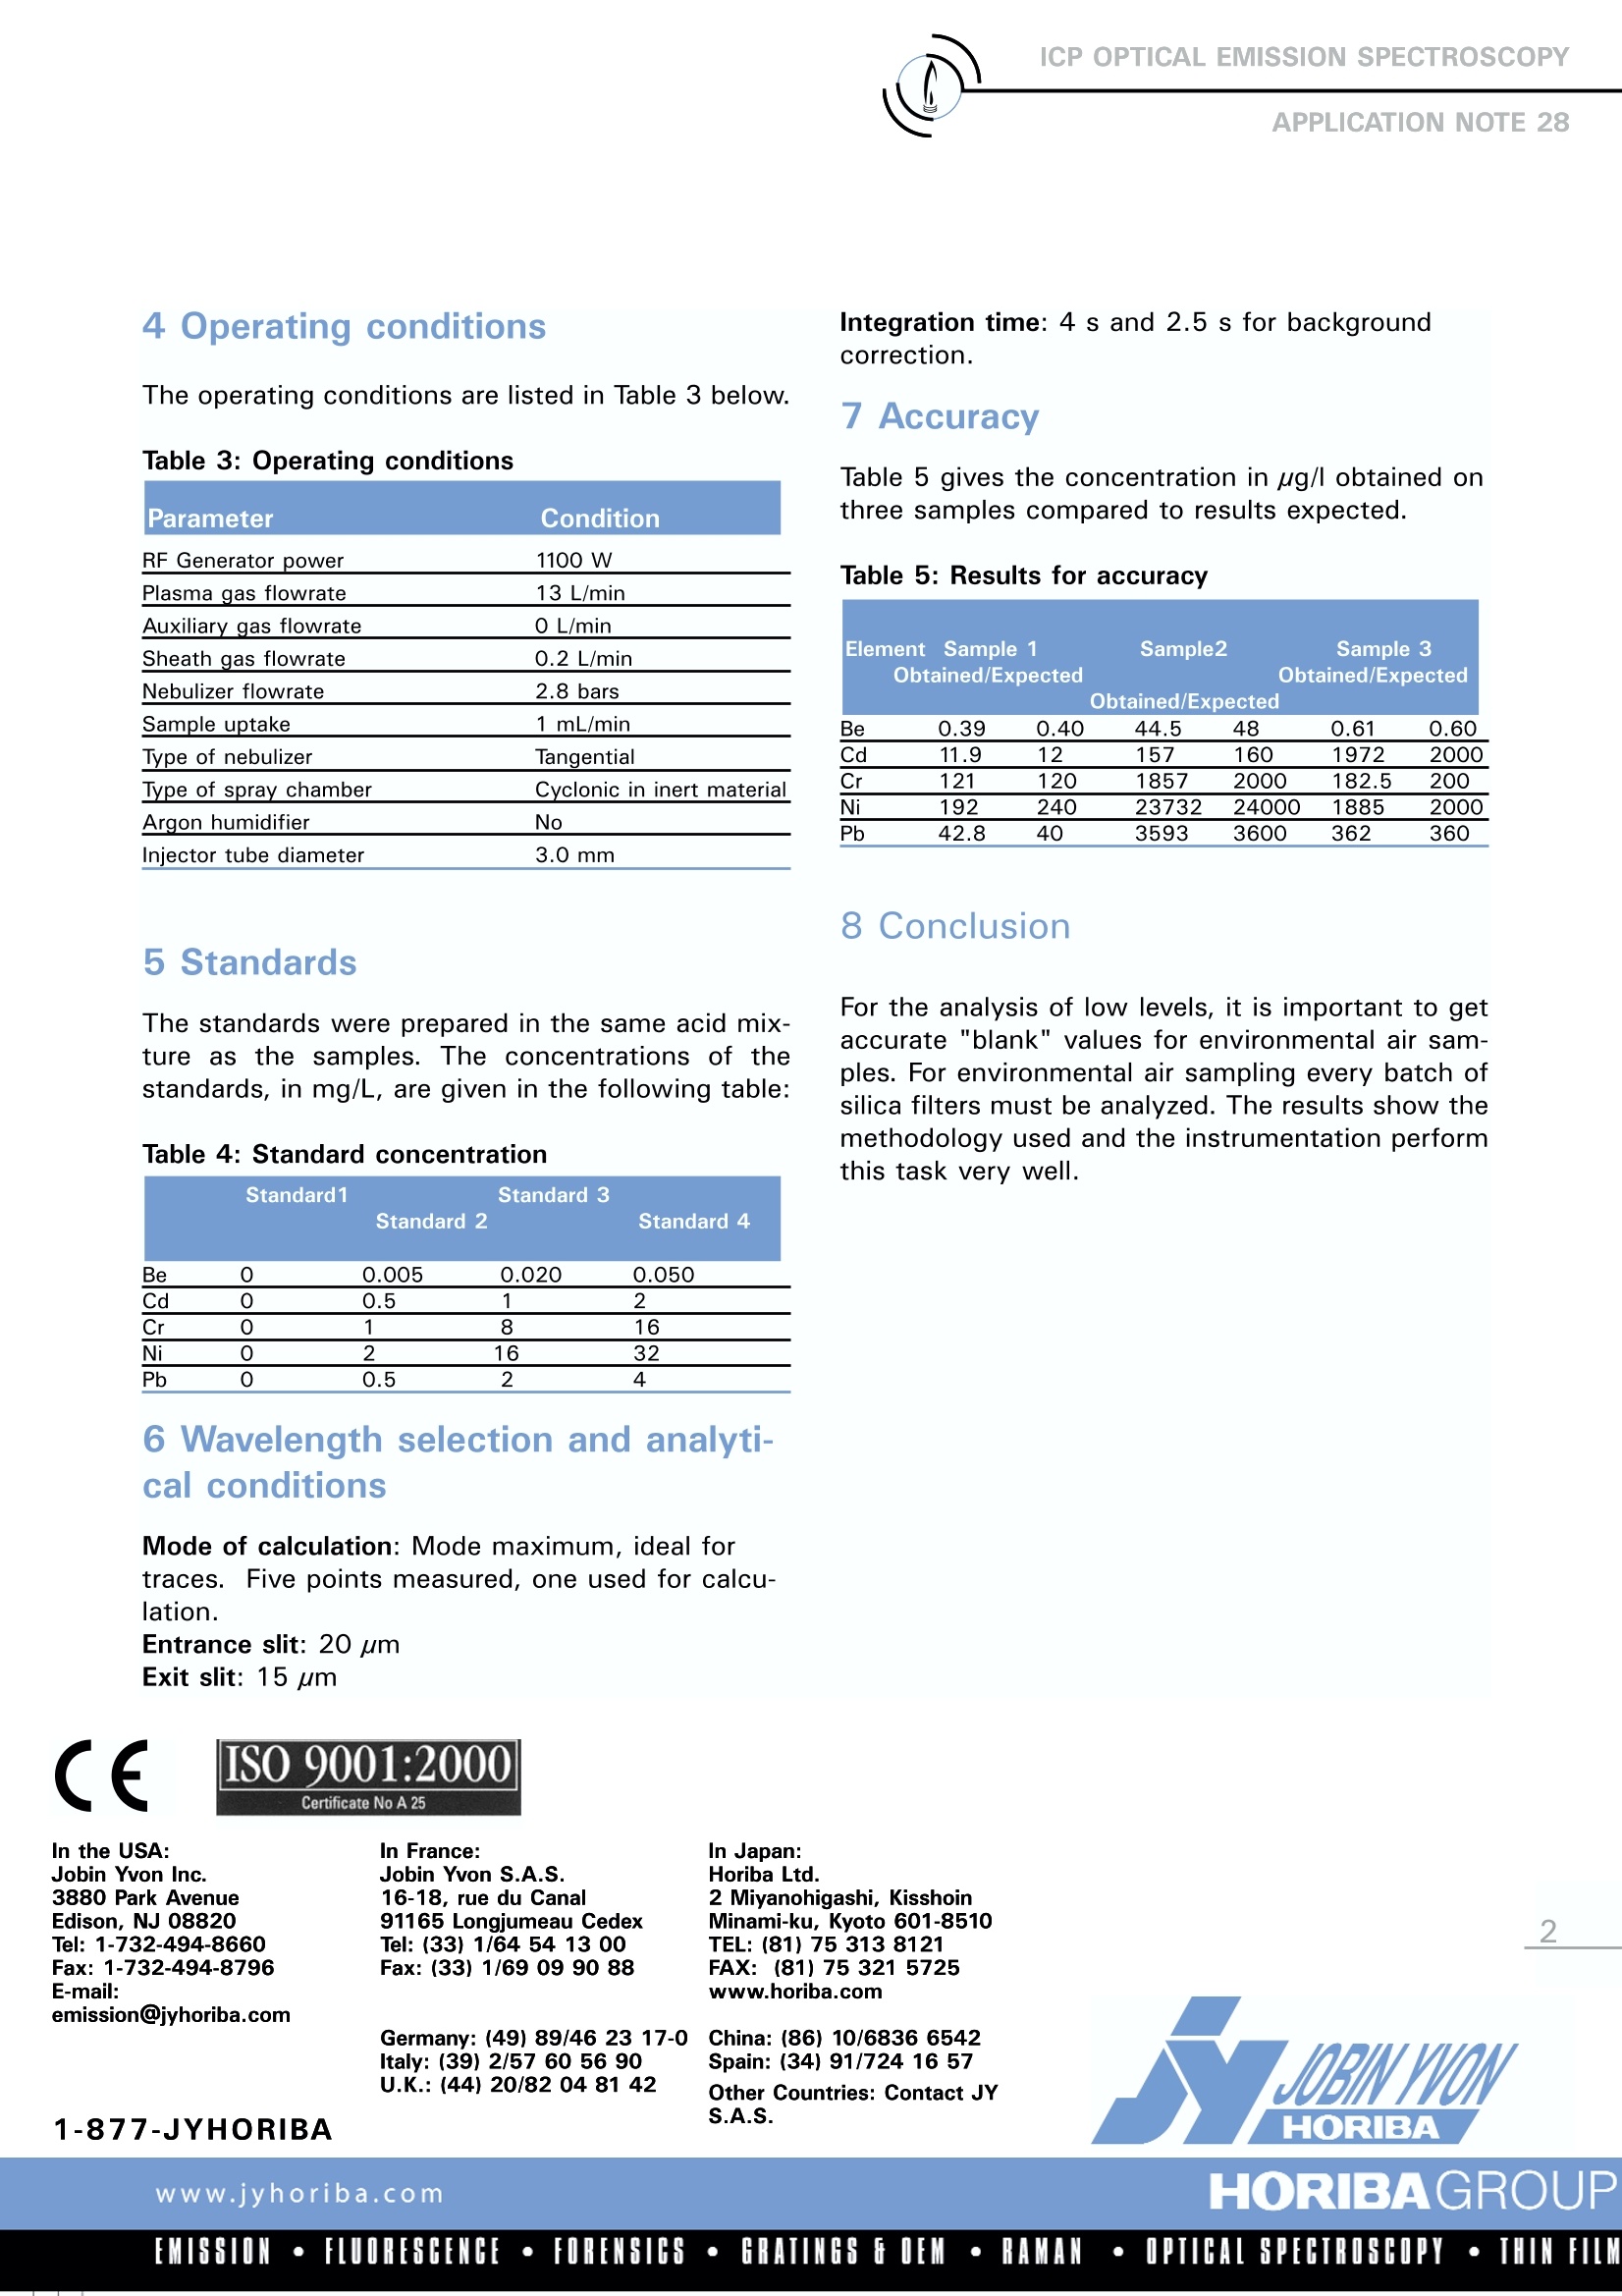
ICP OPTICAL EMISSION SPECTROSCOPY 2EMISSION·FLUORESCENCE·FORENSICS·GRAIINGSGOEM·RAMAN·OPIICAL SPECTROSCOPY·THIN FILM Analysis of Quartz Filters Agnes Cosnier Jobin Yvon S.A.S., Horiba Group Longjumeau, France Keywords: environment, air samples 1 Introduction Quartz filters are used to monitor air contamina-tion; they are often placed in work areas wherepotential specific contamination can occur. Theanalysis of impurities in quartz filters was under-taken after digestion with HF and HNO3. The JYULTIMA was used because of its high sensitivity. 2 Principle 2.1 Technique used The elemental analysis of solutions was under-taken by Inductively Coupled Plasma OpticalEmission Spectrometry (ICP-OES). The sample isnebulized then transferred to an argon plasma. Itis decomposed, atomized and ionized wherebythe atoms and ions are excited. We measure theintensity of the light emitted when the atoms orions return to lower levels of energy.y.Each ele-ment emits light at characteristic wavelengthsand these lines can be used for quantitativeanalysis after a calibration. 2.2 Wavelength choice The choice of the wavelength in a given matrixcan be made using the “profile"function, or byusing Win-IMAGE, which is rapid semi-quantita-tive analysis mode using multiple wavelengths.The principle is the same in either case: recordthe scans of analytes at low concentration, andof the matrix. By superimposing the spectra, wesee possible interferences. 3 Sample Preparation Samples were digested as follows: One quartz filter was placed in a 25 mL volumet-ric flask with 4 mL of 40% Hydrofluoric acid (HF)and 2 mL of 69% Nitric acid (HNO3) Any heating should be restricted to 55°C to avoid the loss of Si. However, if Si is not required,heating to higher temperatures will ensure all Siis lost and reduces the dissolved solids contentof the solutions. .4 Instrument specification The work was done on a JY ULTIMA.The speci-fications of this instrument are listed below inTables 1 and 2. Table 1: Specification of spectrometer Parameters Specifications Mounting Czerny-Turner Focal length 1 m Number of grating 2 Grating1 number of grooves 4 320 gr/mm Grating 2 number of grooves 2 400 gr/mm Thermoregulation Yes Variable resolution Yes Nitrogen purge Yes Table 2: Specification of RF Generator Parameters Specifications Observation Radial Frequency 40.68 MHz Control of gas flowrate By computer Control of pump flow By computer Cooling Air 4 Operating conditions The operating conditions are listed in Table 3 below. Table 3: Operating conditions Parameter Condition RF Generator power 1100 W Plasma gas flowrate 13 L/min Auxiliary gas flowrate O L/min Sheath gas flowrate 0.2 L/min Nebulizer flowrate 2.8 bars Sample uptake 1 mL/min Type of nebulizer Tangential Type of spray chamber Cyclonic in inert material Argon humidifier No Injector tube diameter 3.0mm 5 Standards The standards were prepared in the same acid mix-ture as the samples. The concentrations of thestandards, in mg/L, are given in the following table: Table 4: Standard concentration Be 0 0.005 0.020 0.050 Cd 0.5 1 2 Cr 0 1 8 16 Ni O 2 16 32 Pb 0 0.5 2 4 6 Wavelength selection and analyti-cal conditions Mode of calculation: Mode maximum, ideal fortraces. Five points measured, one used for calcu-lation. Entrance slit: 20 um Exit slit: 15 um CEISO 9001:2000 In the USA: Jobin Yvon Inc. 3880 Park Avenue 2 Miyanohigashi, Kisshoin Edison, NJ 08820 Minami-ku, Kyoto 601-8510 TEL: (81) 75313 8121 Tel: 1-732-494-8660 Fax: 1-732-494-8796 FAX: (81) 75 321 5725 emission@jyhoriba.com China: (86) 10/6836 6542 Italy:(39)2/57 60 56 90U.K.: (44) 20/82 04 8142 Spain: (34) 91/724 16 57 Other Countries: Contact JY S.A.S. Integration time: 4 s and 2.5 s for backgroundcorrection. 7 Accuracv Table 5 gives the concentration in ug/l obtained onthree samples compared to results expected. Table 5: Results for accuracy Element Sample 1 Sample2 Sample 3 Obtained/Expected Obtained/Expected Obtained/Expected Be 0.39 0.40 44.5 48 0.61 0.60 Cd 11.9 12 157 160 1972 2000 Cr 121 120 1857 2000 182.5 200 Ni 192 240 23732 24000 1885 2000 Pb 42.8 40 3593 3600 362 360 8 Conclusion For the analysis of low levels, it is important to getaccurate "blank" values for environmental air sam-ples. For environmental air sampling every batch ofsilica filters must be analyzed. The results show themethodology used and the instrumentation performthis task very well.
确定


还剩1页未读,是否继续阅读?
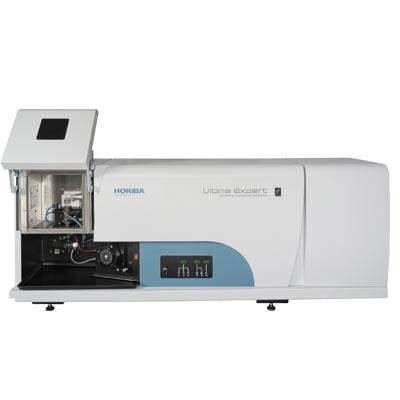
HORIBA(中国)为您提供《采用ICP方法分析石英滤光镜》,该方案主要用于其他中--检测,参考标准--,《采用ICP方法分析石英滤光镜》用到的仪器有HORIBA Ultima Expert高性能ICP光谱仪
相关方案
更多
该厂商其他方案
更多


