


方案详情
文
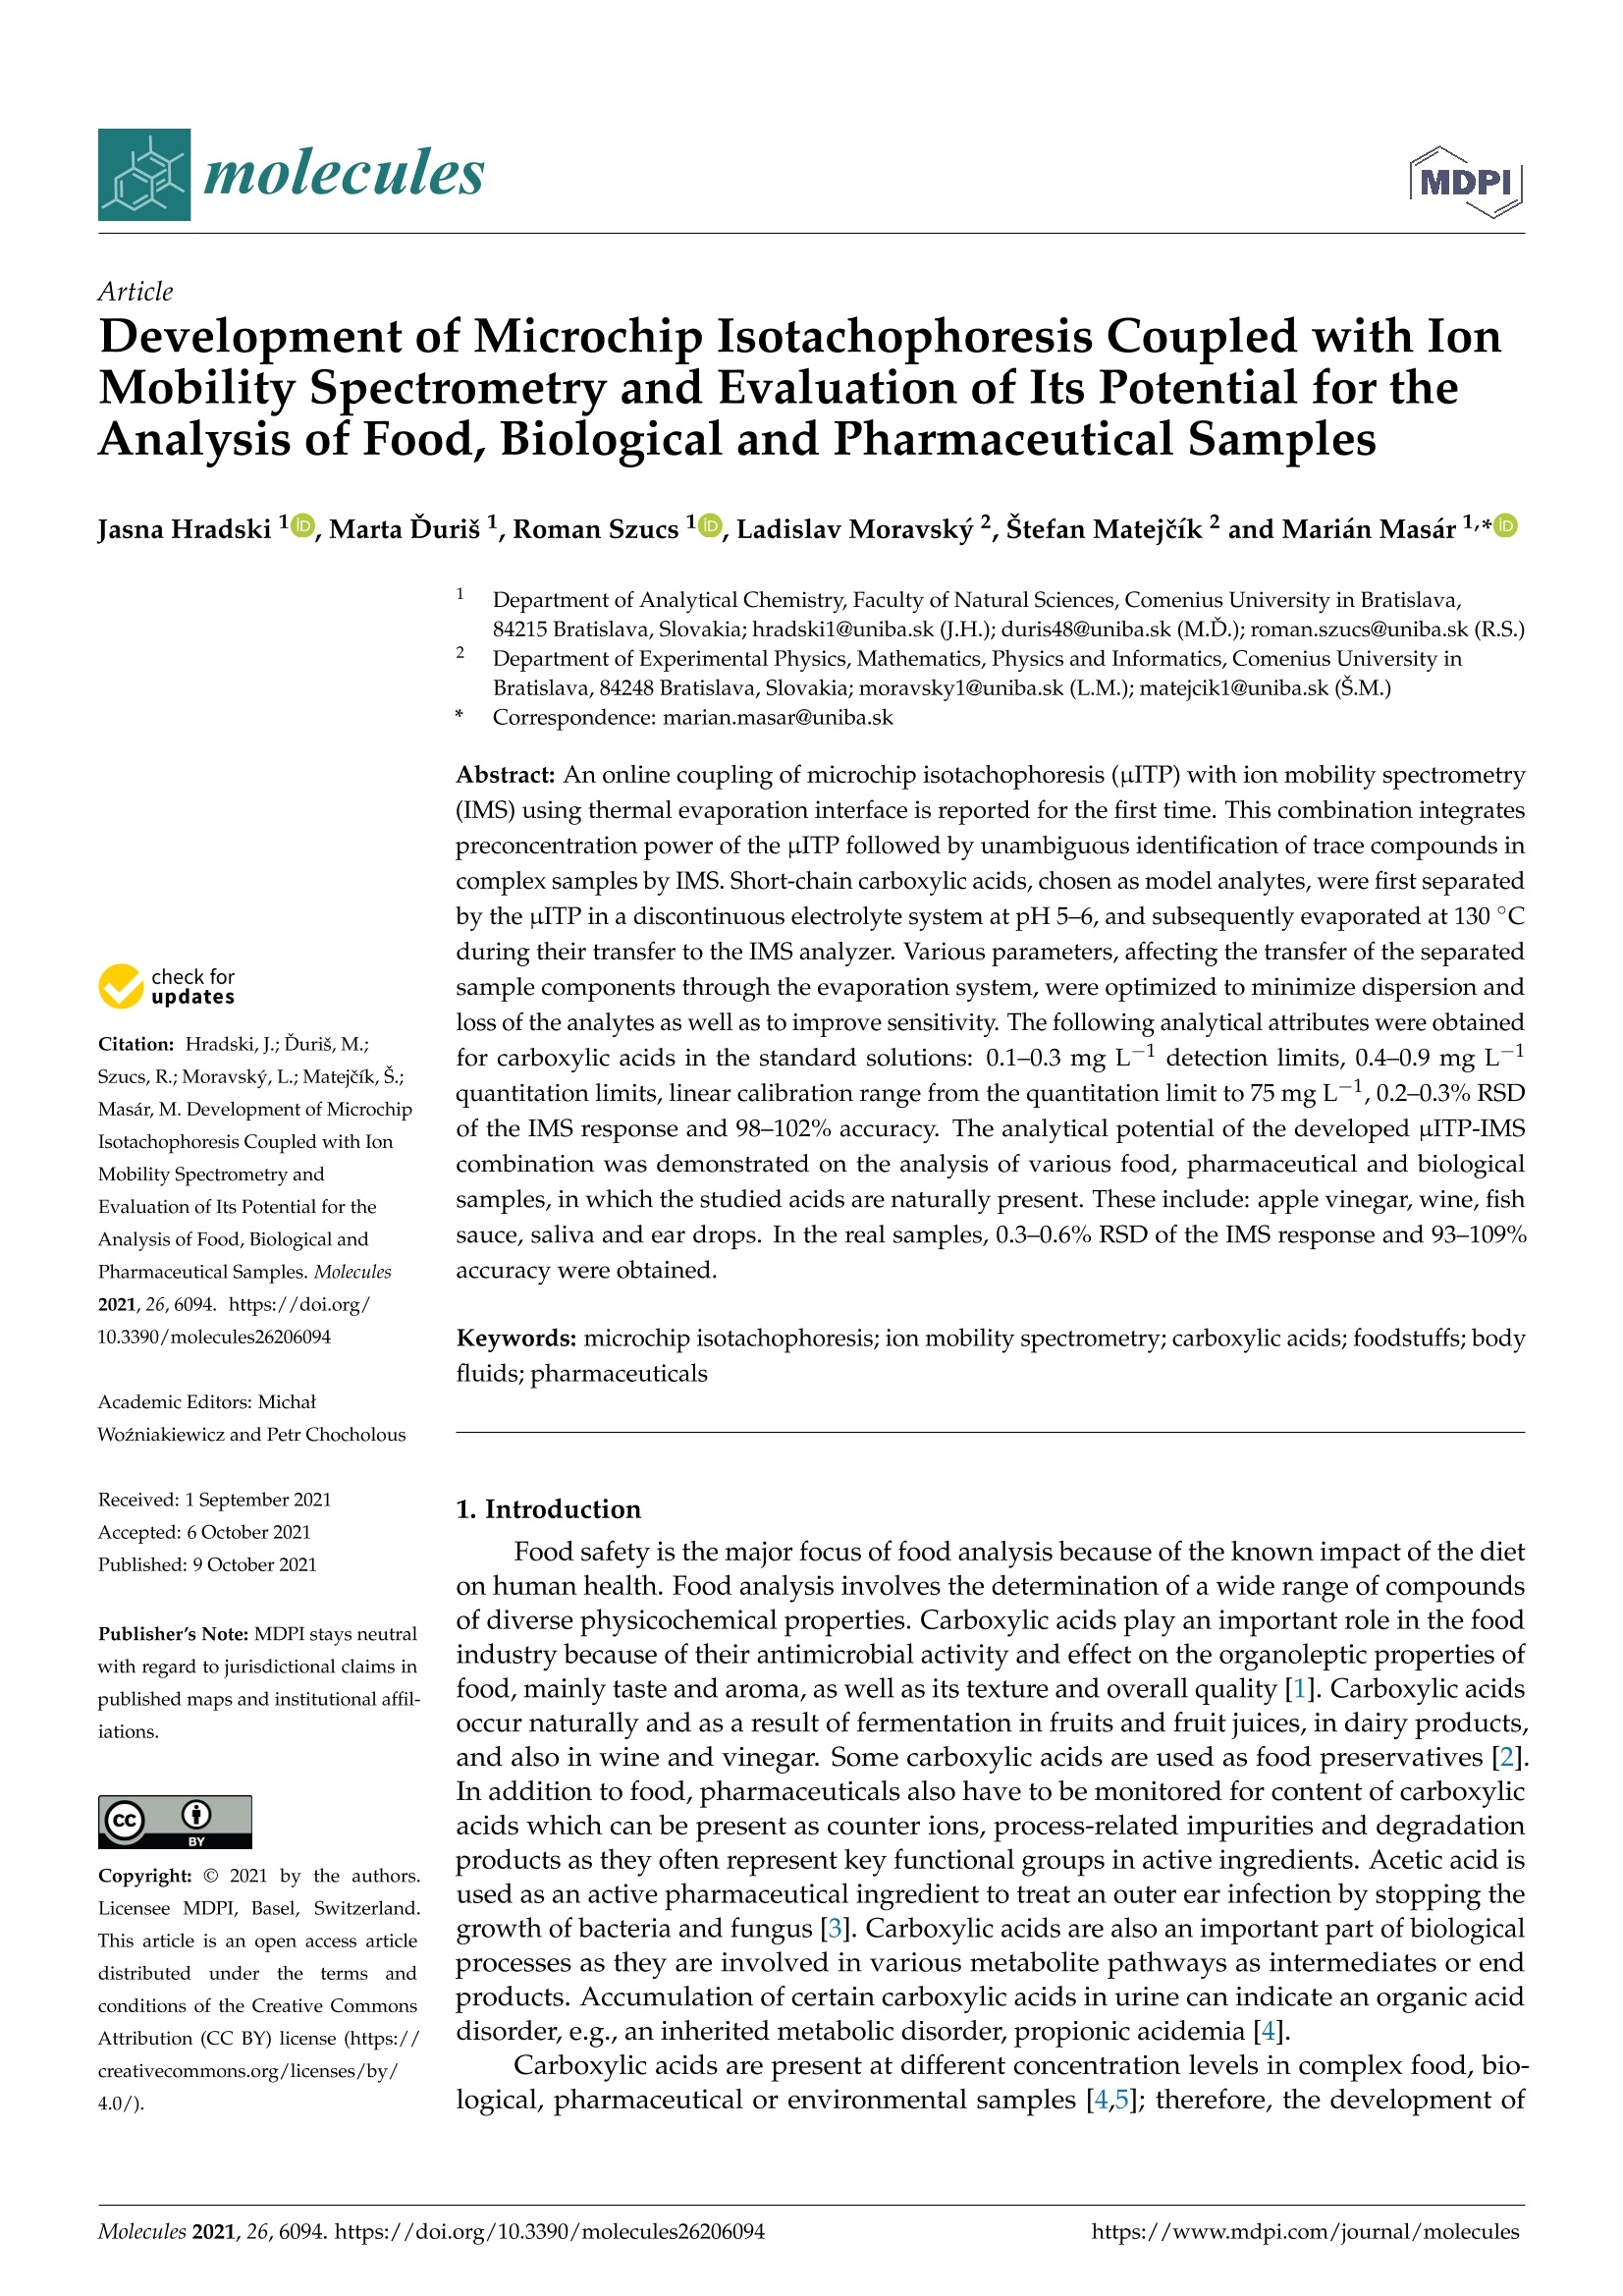
首次报道了使用热蒸发界面的微芯片等速电泳 (μITP) 与离子迁移谱 (IMS) 的在线耦合。这种组合结合了 µITP 的预浓缩能力,然后通过 IMS 对复杂样品中的痕量化合物进行明确鉴定。选择作为模型分析物的短链羧酸首先在 pH 5-6 的不连续电解质系统中通过 µITP 进行分离,然后在将它们转移到 IMS 分析仪期间在 130 °C 下蒸发。对影响分离的样品组分通过蒸发系统的传输的各种参数进行了优化,以最大程度地减少分析物的分散和损失并提高灵敏度。标准溶液中羧酸的以下分析属性: 0.1–0.3 mg L-1检测限,0.4–0.9 mg L -1定量限,从定量限到 75 mg L -1 的线性校准范围,IMS 响应的 0.2–0.3% RSD 和 98–102% 准确度。开发的 µITP-IMS 组合的分析潜力在各种食品、药物和生物样品的分析中得到了证明,其中研究的酸是天然存在的。这些包括:苹果醋、葡萄酒、鱼露、唾液和滴耳液。在实际样品中,IMS 响应的 RSD 为 0.3-0.6%,准确度为 93-109%。
方案详情

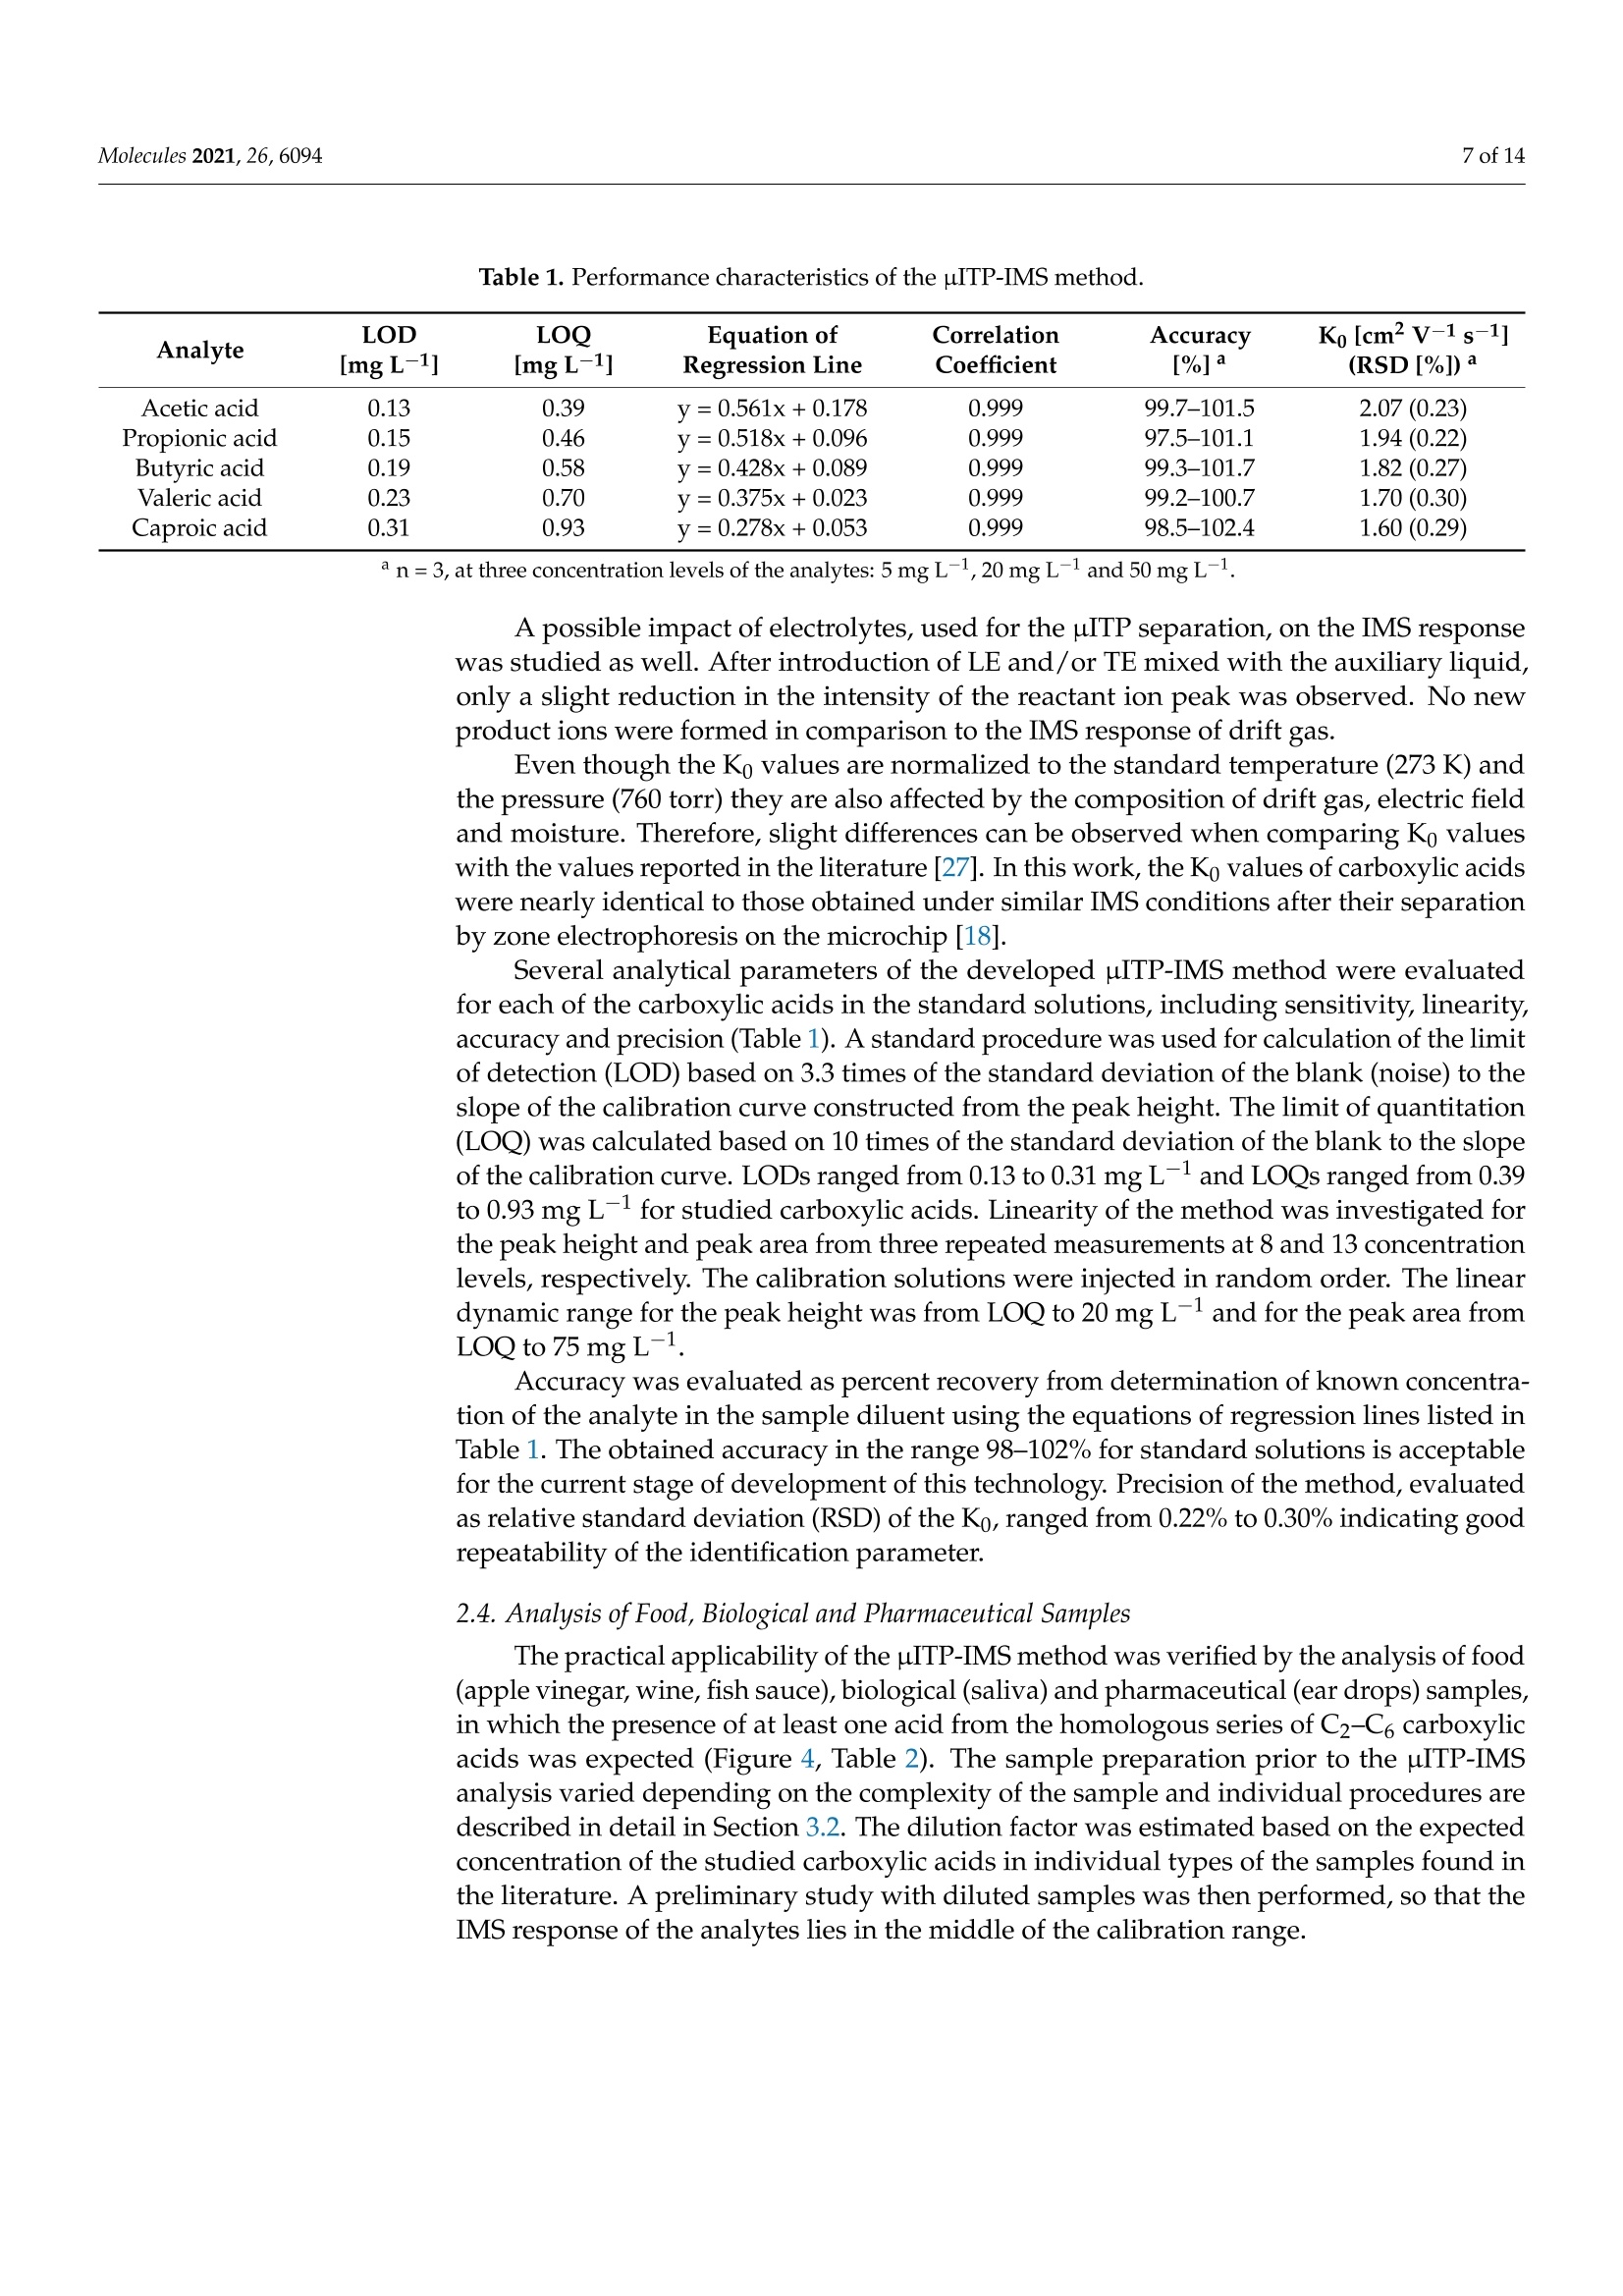
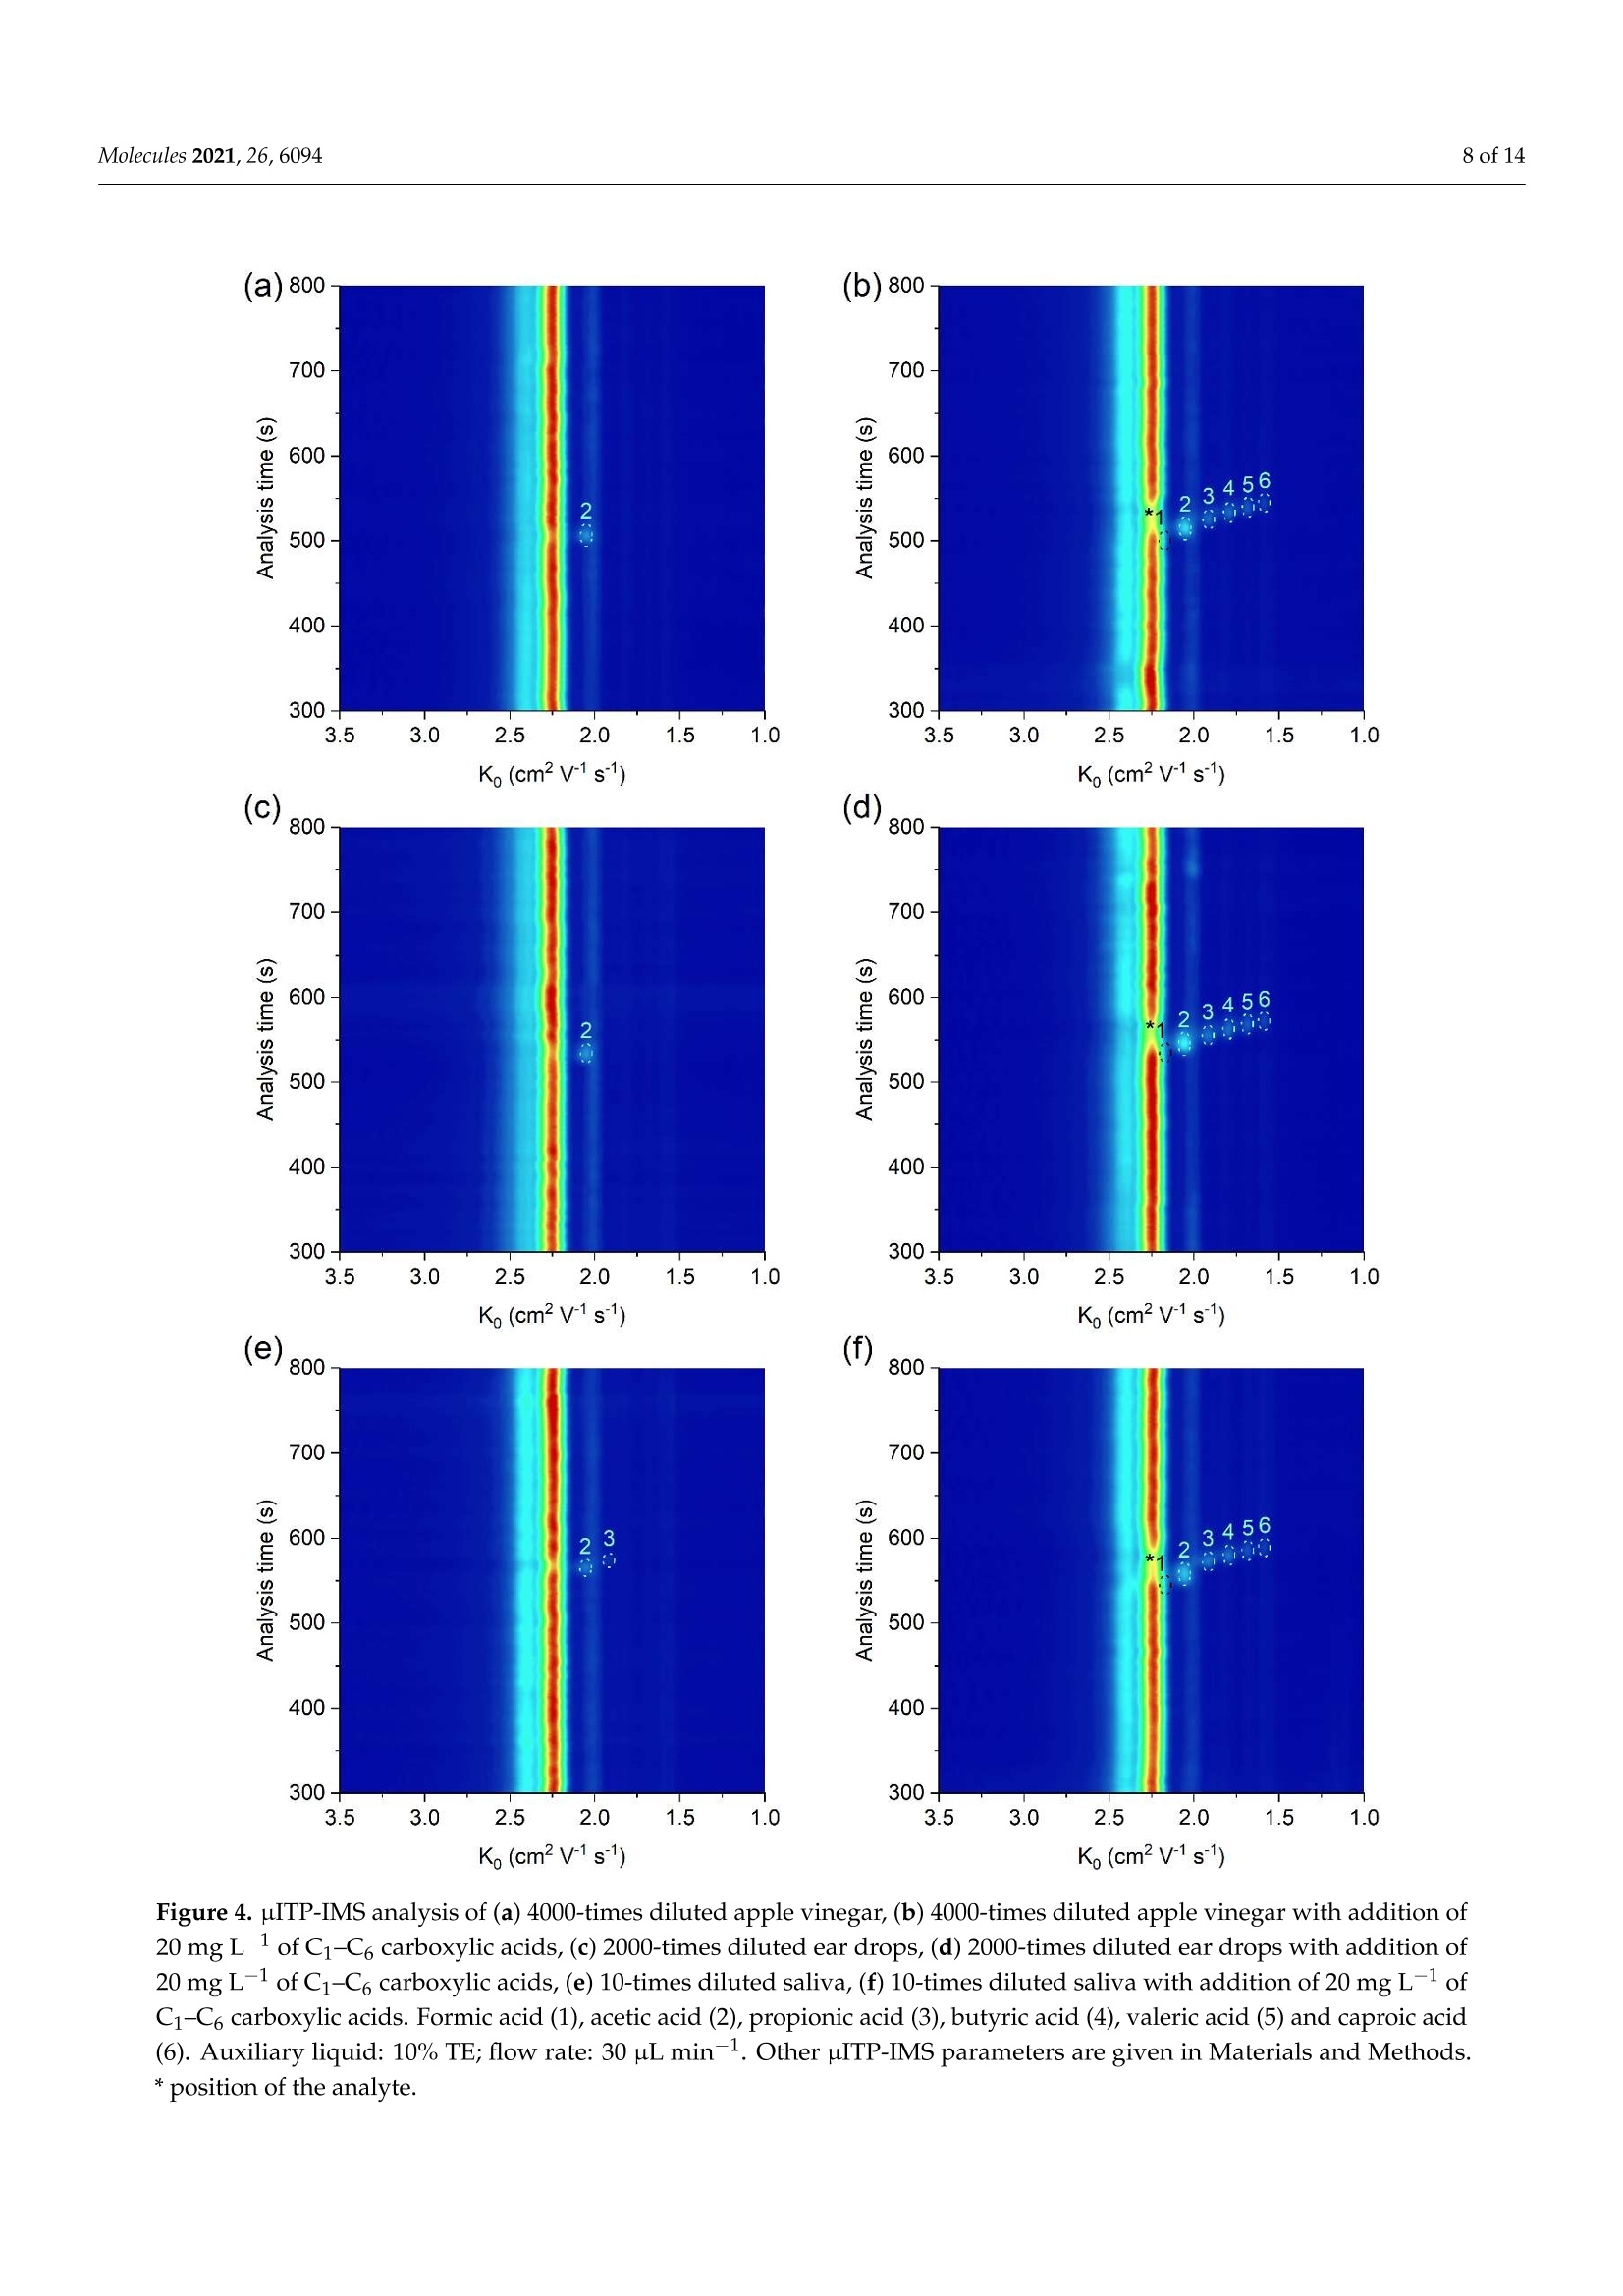
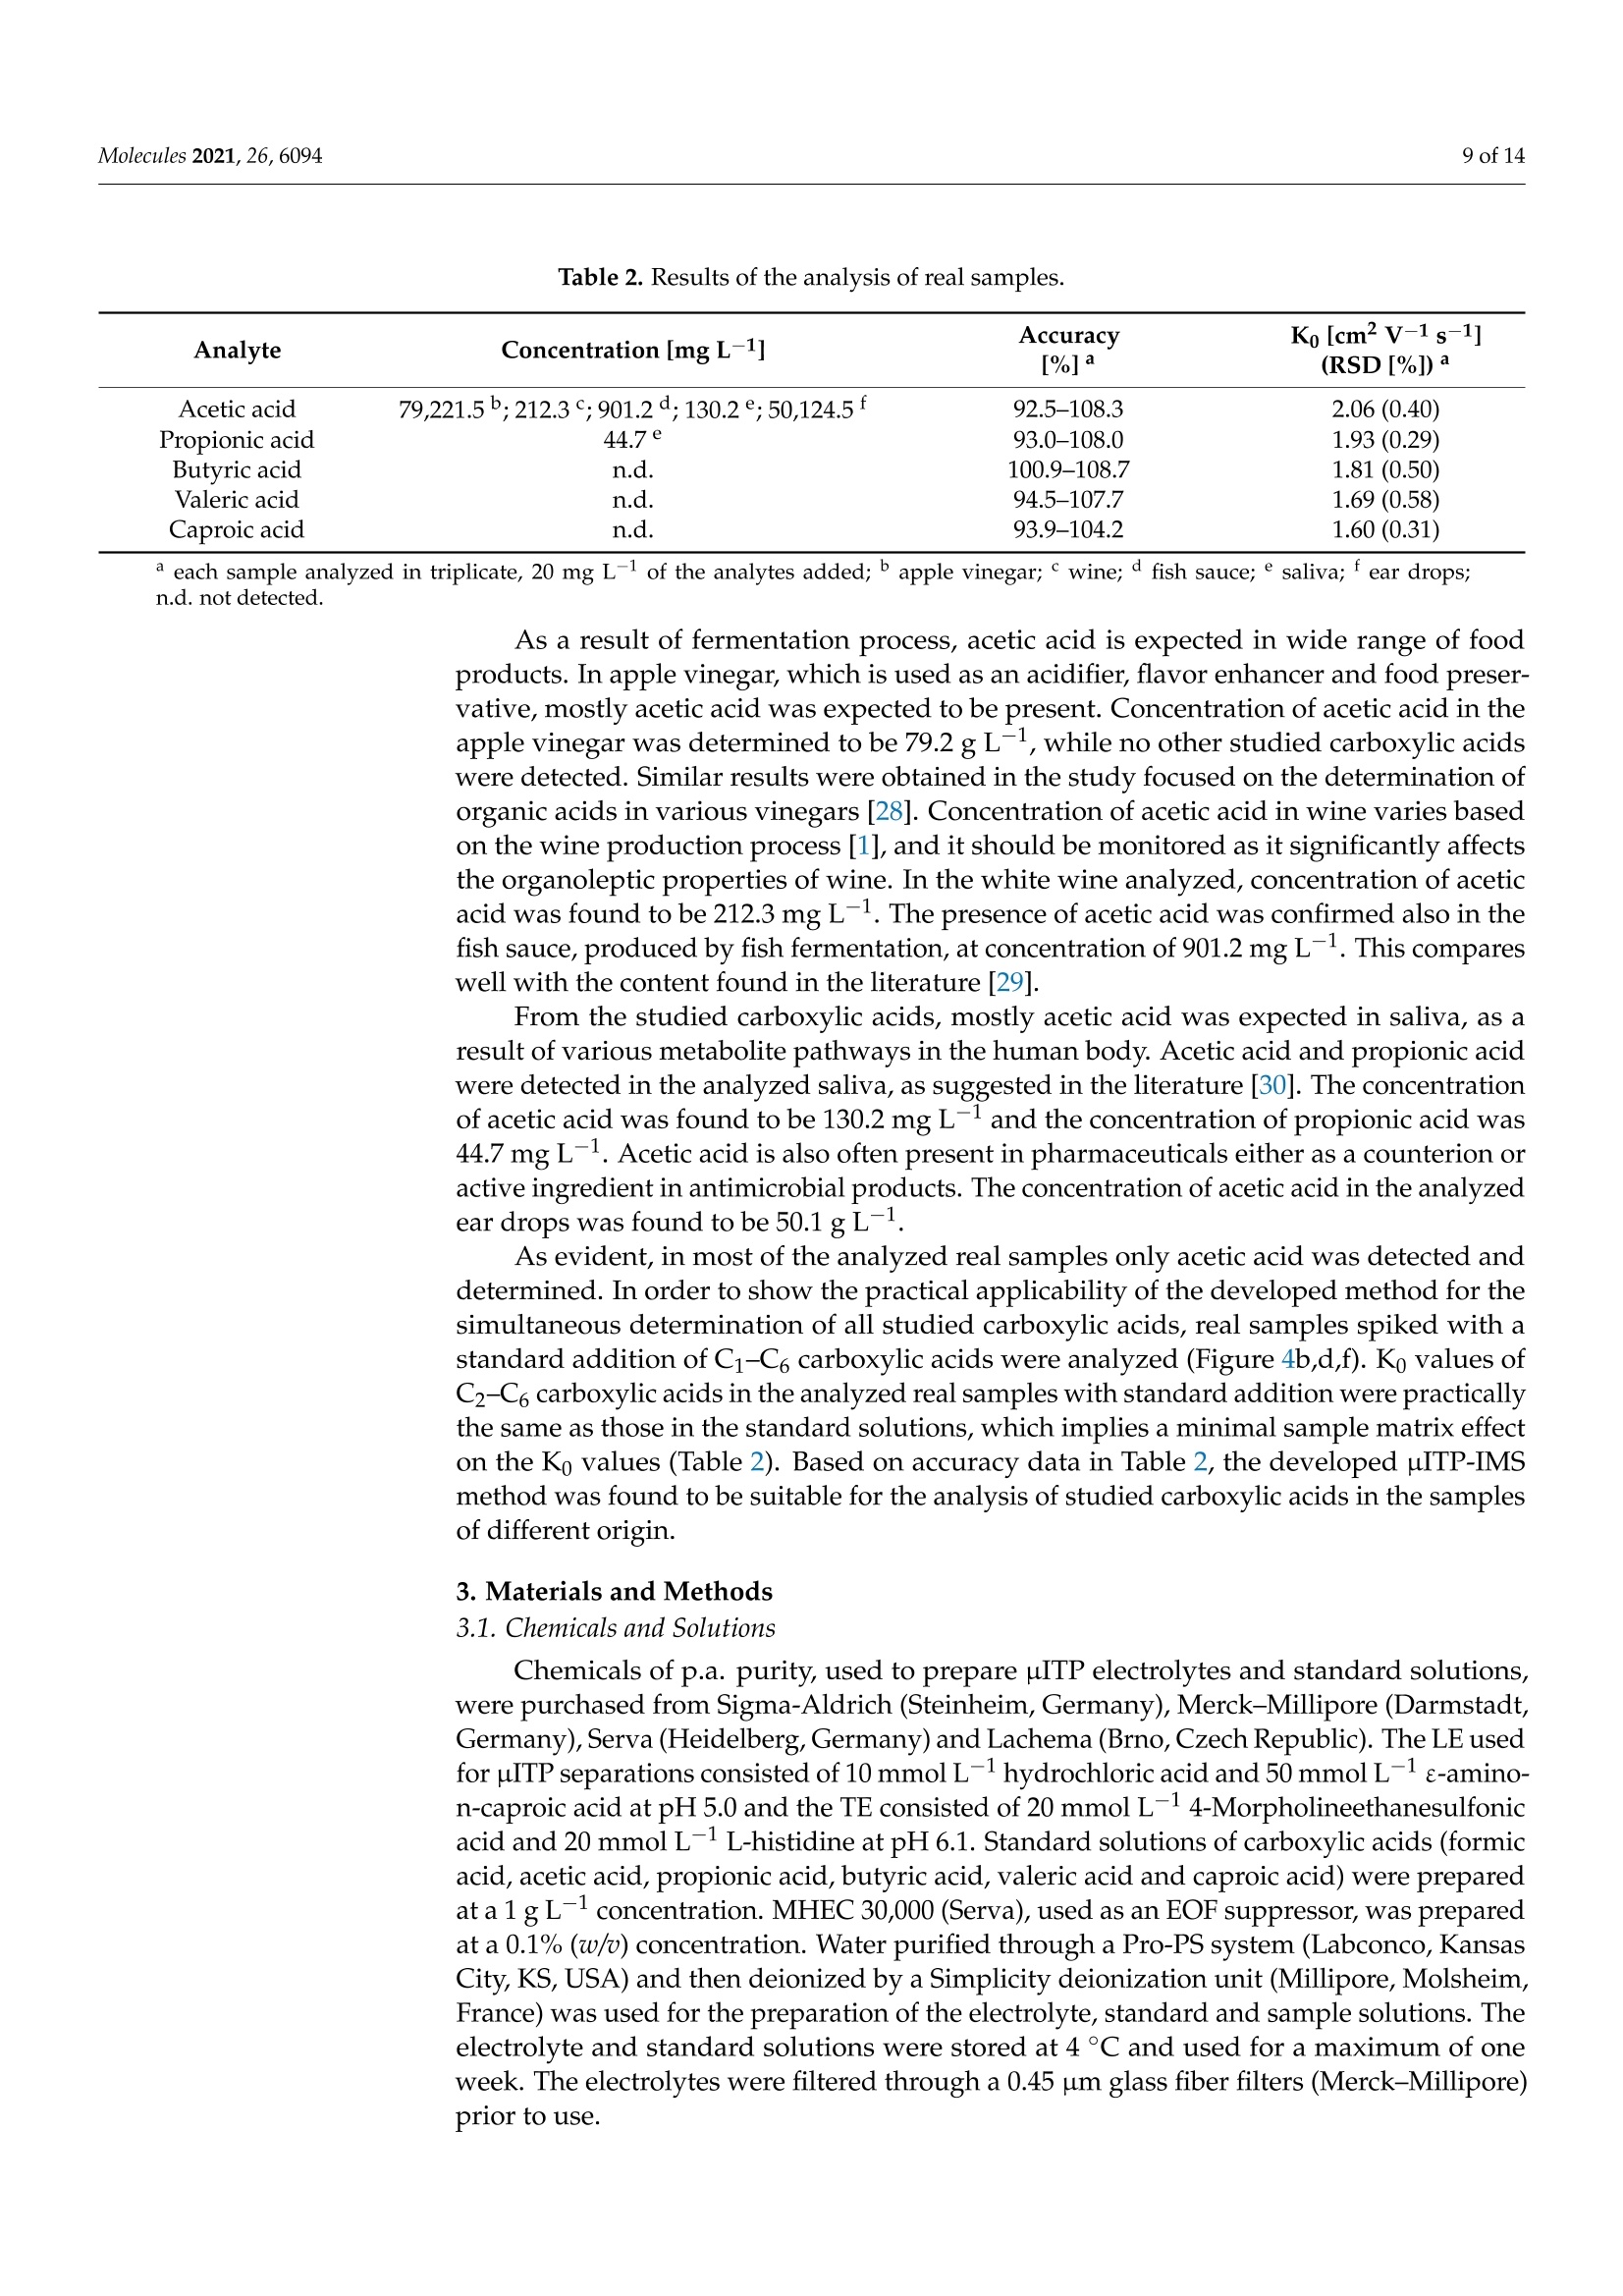
molecules 2 of 14Molecules 2021,26,6094 Molecules 2021, 26, 6094. https://doi.org/10.3390/molecules26206094https://www.mdpi.com/journal/molecules check forupdates Citation: Hradski,J;Duris, M.;Szucs, R.; Moravsky, L.;Matejik,3.;Masar, M. Development of MicrochipIsotachophoresis Coupled with IonMobility Spectrometry andEvaluation of Its Potential for theAnalysis of Food, Biological andPharmaceutical Samples. Molecules2021,26,6094. https://doi.org/10.3390/molecules26206094 Academic Editors: MichalWozniakiewicz and Petr Chocholous Received: 1 September 2021Accepted: 6 October 2021 Published: 9 October 2021 Publisher's Note: MDPI stays neutralwith regard to jurisdictional claims inpublished maps and institutional affil-iations. Copyright: O 2021 by the authors.Licensee MDPI, Basel, Switzerland.This article is an open access articledistributed under the teconditions of the Creative CommonsAttribution (CC BY) license (https://creativecommons.org/licenses/by/4.0/). Jasna Hradski 1D, Marta Duris 1,Roman Szucs 1D, Ladislav Moravsky 2,Stefan Matejtik2 and Marian Masar 1*D Department of Analytical Chemistry, Faculty of Natural Sciences, Comenius University in Bratislava, 84215 Bratislava, Slovakia; hradski1@uniba.sk (J.H.); duris48@uniba.sk (M.D.); roman.szucs@uniba.sk (R.S.) 2 Department of Experimental Physics, Mathematics, Physics and Informatics, Comenius University inBratislava, 84248 Bratislava, Slovakia; moravsky1@uniba.sk (L.M.); matejcik1@uniba.sk (S.M.) * Correspondence: marian.masar@uniba.sk Abstract: An online coupling of microchip isotachophoresis (uITP) with ion mobility spectrometry(IMS) using thermal evaporation interface is reported for the first time. This combination integratespreconcentration power of the uITP followed by unambiguous identification of trace compounds incomplex samples by IMS. Short-chain carboxylic acids, chosen as model analytes, were first separatedby the uITP in a discontinuous electrolyte system at pH5-6, and subsequently evaporated at 130°Cduring their transfer to the IMS analyzer. Various parameters, affecting the transfer of the separatedsample components through the evaporation system, were optimized to minimize dispersion andloss of the analytes as well as to improve sensitivity. The following analytical attributes were obtainedfor carboxylic acids in the standard solutions: 0.1-0.3 mg L-1 detection limits, 0.4-0.9 mg L-1quantitation limits, linear calibration range from the quantitation limit to 75 mg L-1, 0.2-0.3% RSDof the IMS response and 98-102% accuracy. The analytical potential of the developed pITP-IMScombination was demonstrated on the analysis of various food, pharmaceutical and biologicalsamples, in which the studied acids are naturally present. These include: apple vinegar, wine, fishsauce, saliva and ear drops. In the real samples, 0.3-0.6%RSD of the IMS response and 93-109%accuracy were obtained. Keywords: microchip isotachophoresis; ion mobility spectrometry; carboxylic acids; foodstuffs; bodyfluids; pharmaceuticals 1. Introduction Food safety is the major focus of food analysis because of the known impact of the dieton human health. Food analysis involves the determination of a wide range of compoundsof diverse physicochemical properties. Carboxylic acids play an important role in the foodindustry because of their antimicrobial activity and effect on the organoleptic properties offood, mainly taste and aroma, as well as its texture and overall quality [1]. Carboxylic acidsoccur naturally and as a result of fermentation in fruits and fruit juices, in dairy products,and also in wine and vinegar. Some carboxylic acids are used as food preservatives [2].In addition to food, pharmaceuticals also have to be monitored for content of carboxylicacids which can be present as counter ions, process-related impurities and degradationproducts as they often represent key functional groups in active ingredients. Acetic acid isused as an active pharmaceutical ingredient to treat an outer ear infection by stopping thegrowth of bacteria and fungus [3]. Carboxylic acids are also an important part of biologicalprocesses as they are involved in various metabolite pathways as intermediates or endproducts. Accumulation of certain carboxylic acids in urine can indicate an organic aciddisorder, e.g., an inherited metabolic disorder, propionic acidemia [4]. Carboxylic acids are present at different concentration levels in complex food, bio-logical, pharmaceutical or environmental samples [4,5]; therefore, the development of advanced analytical methods and strategies for their determination is needed. Chromato-graphic techniques, i.e., gas chromatography and liquid chromatography combined withmass spectrometry are often used for this purpose [6]. With the advance of green analyticalchemistry, miniaturization, automation and reduction in the use of toxic solvents play akey role in the development of modern analytical instrumentation. With this in mind,separation analytical techniques, enabling multi-component analysis, are preferred oversingle analyte applications [7].Miniaturized analogs of conventional separation techniquescan reduce the financial cost of analysis, speed up the analytical process, reduce the amountof the analyzed sample as well as the amount of waste produced.Various conventionalseparation techniques have already been miniaturized. A miniaturized version of capillaryelectrophoresis (CE), microchip electrophoresis (MCE), was successfully applied to theanalysis of a wide range of compounds, e.g., small inorganic and organic ions, aminoacids, pharmaceuticals and proteins [8,9]. However, shorter separation path and innerdimensions of the separation channels resulting from the miniaturization, lead to limitedseparation capacity and lower detection sensitivity of the MCE. This limits the applicabilityof MCE in the analysis of complex samples. For these reasons, MCE often requires theuse of sample pretreatment prior to the analysis of complex samples and/or selectivedetection and/or identification technique. Ion mobility spectrometry (IMS) is a sensitiveand fast separation and identification technique, which has been applied to the analysisof food, environmental and biological samples [6,10,11]. Even though IMS can be used asa stand-alone analytical technique, it is often used in combination with other separationtechniques, e.g., gas chromatography, liquid chromatography or CE to increase its peakcapacity and identification ability [12]. In coupling with mass spectrometry, it is used as aseparation technique to improve its sensitivity [13]. MCE and IMS are based on a similar separation principle and due to their similar-ities, IMS was also called gaseous electrophoresis [14]. The combination of these twotechniques into a two-dimensional (2D) system is advantageous because it combines theseparation potential of MCE and the identification potential of IMS. In this way, prob-lems associated with the identification of analytes present in complex samples after theirMCE separation can be eliminated. At the same time, a significant increase in resolutionin comparison to stand-alone IMS can be obtained. The biggest obstacle in combiningthese two techniques is the necessity to transfer analytes from liquid to the gaseous phase.Therefore, only a few attempts to combine IMS with CE [13,15-17], MCE [18] or chip-basedelectrochromatography [19] were made. Even though zone electrophoresis, used for the combination of CE and MCE withIMS [13,15-18], is the most widely used electrophoretic technique, isotachophoresis (ITP)also emerges as a suitable electro-kinetic separation technique. Due to its ability to concen-trate the analytes, it can either be used as a stand-alone technique or in combination withsome other electroseparation techniques. ITP is implemented by two different electrolytes-the leading electrolyte (LE) and the terminating electrolyte (TE), and the sample is intro-duced between them. During analysis, sample components having effective mobilitiesin the range defined by the effective mobilities of the leading and terminating ions areseparated and arranged in the order of decreasing effective mobilities. After reaching anITP steady-state, analytes having different effective mobilities will form discrete zoneswith sharp boundaries between them. Based on the Kohlrausch regulating function, theconcentration of the analytes in their own zones is constant and they migrate with the samevelocity [20]. ITP has also been implemented on the microchip (microchip isotachophoresis;uITP), and combined with various detection techniques, e.g., conductivity detection [20]and surface enhanced Raman spectrometry [21]. It has been applied to the analysis of foodand pharmaceutical samples. In this paper, a novel hyphenation of uITP and IMS for the separation and determina-tion of carboxylic acids (acetic acid, propionic acid, butyric acid, valeric acid and caproicacid) in various food, pharmaceutical and biological samples is presented. 2. Results and Discussion 2.1. Optimization ofuITP Separation Conditions As mentioned above, two different electrolytes need to be employed for the uITP sep-aration. The selection of the electrolyte composition is dependent on the physicochemicalproperties of sample components being analyzed, mainly on their pKa values and ionicmobilities [22]. As part of the electrolyte optimization process, the fact that electrolytecomponents will be transferred to the IMS analyzer along with the separated samplecomponents also has to be considered. Effective mobilities of the separated sample components depend on the pH of the LE.In this work, uITP separations of six carboxylic acids, with experimentally confirmed pKavalues in the range of 3.8 to 4.9[23], were performed using the LE with pH 5.0. In addition,only ions having effective mobilities in the mobility interval defined by the leading ion andthe terminating ion will be separated during uITP separation. Chloride was selected as aleading ion because its effective mobility is higher than the effective mobility of formate,the most mobile analyte. To maintain the constant pH of the LE during the separation,e-amino-n-caproate was used as a counterion in the LE. 4-Morpholineethanesulfonate,having lower effective mobility than all the analytes, was used as a terminating ion (formore details about the composition of the LE and TE solutions see Section 3.1). The separations were111 performed under suppressed hydrodynamic flow on the mi-crochip. During the separation, only one inlet to the microchip channels, used to introduceauxiliary liquid into the separation system, was open. Accordingly, only one outlet waskept open during the separation, which was used to transfer the separated sample compo-nents from the microchip to the evaporation unit (see Figure 1 for more details). Due tothe suppressed hydrodynamic flow the electroosmotic flow (EOF) had to be eliminated inorder to avoid dispersion [24]. In this context, the inner walls of the microchip channelswere coated with methylhydroxyethylcellulose (MHEC), which acted as an EOF suppressor(for more details about the coating process see Section 3.4). uITP separations were monitored by a conductivity detector, which was integrateddirectly onto the microchip. The separations were performed under a constant current of20 uA, and before the sample components reached the conductivity detector the currentwas changed to 10 uA. In this way, approximately two times longer zone lengths (based onthe ratio of the currents being applied) were observed for the sample components [20]. 2.2. Optimization ofuITP-IMS Transfer Parameters To perform the uITP-IMS analysis, it was necessary to transfer the separated com-ponents from the first dimension (uITP) to the second dimension (IMS) with minimaldispersion. To achieve this, auxiliary liquid was applied to the microchip in the opposite di-rection to the isotachophoretic migration of the analytes on the microchip (for more detailssee Section 3.4. and Figure 1). Composition of the auxiliary liquid and its physicochemicalproperties, e.g., conductivity and pH, can significantly affect the uITP separation, andzone dispersion during the transfer as well as IMS response sensitivity. Various auxiliaryliquids were tested including both electrolytes used for the uITP separation. A 10% (v/u)TE was found to be an optimal auxiliary liquid because it fulfilled the requirement of lowdispersion transfer of the separated components from the microchip to the IMS analyzer.In addition, the chosen auxiliary liquid did not interfere with the uITP separation nor withthe IMS response of the studied analytes. Figure 1. Schematic diagram of the instrumentation used for uITP-IMS analysis. P1, P2, P3, PS, peristaltic micropumpsfor filling microchip channels with LE (channels C1 and C2), TE (channel C3) and sample (channel CS) solutions; E1, E2,ground electrodes placed at the end of channels C1 and C2, respectively; E3, high voltage electrode placed at the end ofchannel C3; D1, D2, integrated conductivity sensors placed in channels C1 and C2, respectively. Since the separated sample components are transferred together with the auxiliaryliquid, effectively acting as a diluent, the flow rate of the auxiliary liquid is crucial to mini-mize the zone dispersion. The range of auxiliary liquid flow rates tested (5-30 uL min-;Figure 2) was chosen to achieve compatibility with the velocity of the sample componentsduring their separation on the microchip. For optimization of the flow rate of the auxiliaryliquid a two-component mixture of acetic acid and valeric acid at a 50 mg L-1 concentrationwas used. These components were selected because they have different effective mobilitiesand thus create individual zones during the uITP separation. Additionally, acetic acidprovides a very sensitive IMS response, while valeric acid has a lower IMS response, similarto other less volatile carboxylic acids used as the analytes. The investigated flow ratesdid not affect the uITP separation nor caused distortion of the ITP steady state zones, asmonitored by the conductivity detector on the microchip. On the other hand, the flow rateaffected the IMS response time of the sample components. From data presented in Figure 2,it is evident that with increasing flow rate of the auxiliary liquid the overall IMS responsetime for each sample component decreases. In the same way, the transfer time between theuITP separation and the IMS analysis was prolonged by the lower flow rate used. This ledto a significantly higher dispersion of the separated zones of the analytes, as evident fromthe IMS response. In addition, approximately 30% increase in the total uITP-IMS analysistime was observed when 5 uL min-1 was used in comparison to 30 uL min-1. Therefore, a30 uL min-1 flow rate of the auxiliary liquid was chosen for further experiments. Auxiliary liquid flow rate (uL min) Figure 2. Impact of the auxiliary liquid flow rate on the IMS response time during uITP-IMS analysis.Expressed as percentage increase in the IMS response time for different flow rates compared to30 uL min-1 for a two-component mixture of acetic acid (black line) and valeric acid (red line) at a50 mg L-1 concentration. The transfer of the sample components from the uITPto the IMS analyzer also includesthe change of phase in which the separated sample components are present, from liquidto gaseous. An evaporation unit [25] was connected directly to the MCE analyzer andtherefore it could also affect the uIT separation. The temperature of the droplet streamexiting from the evaporation unit was optimized in the range of 110-170°C[18]. The useof a lower temperature of the droplet stream resulted in insufficient evaporation of theseparated sample components, whereas a higher temperature caused problems with thetransfer, which affected pITP separation. The optimal temperature of the droplet stream,leading to a minimal impact on the uITP separation, was found to be 130°C. 2.3. uITP-IMS Method Performance Parameters The potential of the developed uITP-IMS method was shown on the analysis of C1-C6carboxylic acids (Figure 3). ITP with conductivity detection, as an universal type of detec-tion, is used mainly for the determination of the analytes present at higher concentrationlevels in the sample (Figure 3b). In such case, provided that effective mobilities of theanalytes are different, each of them will migrate in its own zone. Then, the zone length, i.e.,the time needed for the analyte to pass through the conductivity detector, can be used as aquantitative parameter [20]. However, if the analytes are present at trace concentrationsin the sample, they are unable to form their own zones, and migrate between a pair offully developed zones [21]. In this case, a selective detection technique has to be usedinstead of universal conductivity detection (as evident from Figure 3a). IMS offers a greateradvantage because, in addition to being used for detection, it can also selectively identifyindividual sample components. Reduced ion mobility (Ko), used as a qualitative parameter,is influenced by the mass, charge and shape of the ion. Figure 3. pITP-IMS analysis of standard solutions of C1-C6 carboxylic acids at (a,c) 10 mg L-1 and (b,d)50 mg L-1.(a,b) Responses from conductivity detector integrated directly on the uITP microchip.(c,d) 2D plots from uITP-IMS analysis.Formic acid (1), acetic acid (2), propionic acid (3), butyric acid (4), valeric acid (5) and caproic acid (6). Auxiliary liquid: 10%TE; flow rate: 30 pL min-1. Other uITP-IMS parameters are given in Materials and Methods. *position of the analyte. In this work, negative corona discharge ionization was used in the IMS. The reactantion (Ko =2.24 cm² V-1 s-1; Figure 3c,d), which ionized the components via electrontransfer reactions, was composed of O2(H2O)n [26]. After introducing the separatedsample components into the IMS, a decrease in the intensity of reactant ions was observedon the 2D plot, while product ions with a Ko value characteristic of the individual carboxylicacids were formed (Figure 3c,d and Table 1). The Ko value of formic acid (2.17 cm²V-1s-1)was close to the Ko of reactant ions under the used IMS working conditions. Therefore, itsunambiguous identification was practically impossible, and this analyte was not evaluatedin standard solutions nor in real samples. Table 1. Performance characteristics of the uITP-IMS method. Analyte LOD LOQ Equation of Correlation Accuracy Ko[cm²V-1 s-1] [mg L-1] [mg L-1] Regression Line Coefficient [%] (RSD[%])a Acetic acid 0.13 0.39 v=0.561x+0.178 0.999 99.7-101.5 2.07(0.23) Propionic acid 0.15 0.46 y=0.518x+0.096 0.999 97.5-101.1 1.94 (0.22) Butyric acid 0.19 0.58 y=0.428x +0.089 0.999 99.3-101.7 1.82(0.27) Valeric acid 0.23 0.70 v=0.375x +0.023 0.999 99.2-100.7 1.70 (0.30) Caproic acid 0.31 0.93 v=0.278x +0.053 0.999 98.5-102.4 1.60 (0.29) a n=3, at three concentration levels of the analytes: 5 mg L-1, 20 mg L-1 and 50 mg L-1. A possible impact of electrolytes, used for the pITP separation, on the IMS responsewas studied as well. After introduction of LE and/or TE mixed with the auxiliary liquid,only a slight reduction in the intensity of the reactant ion peak was observed. No newproduct ions were formed in comparison to the IMS response of drift gas. Even though the Ko values are normalized to the standard temperature (273 K) andthe pressure (760 torr) they are also affected by the composition of drift gas, electric fieldand moisture. Therefore, slight differences can be observed when comparing Ko valueswith the values reported in the literature [27]. In this work, the Ko values of carboxylic acidswere nearly identical to those obtained under similar IMS conditions after their separationby zone electrophoresis on the microchip [18]. Several analytical parameters of the developed uITP-IMS method were evaluatedfor each of the carboxylic acids in the standard solutions, including sensitivity, linearity,accuracy and precision (Table 1). A standard procedure was used for calculation of the limitof detection (LOD) based on 3.3 times of the standard deviation of the blank (noise) to theslope of the calibration curve constructed from the peak height. The limit of quantitation(LOQ) was calculated based on 10 times of the standard deviation of the blank to the slopeof the calibration curve. LODs ranged from 0.13 to 0.31 mg L-1 and LOQs ranged from 0.39to 0.93 mg L-1 for studied carboxylic acids. Linearity of the method was investigated forthe peak height and peak area from three repeated measurements at 8 and 13 concentrationlevels, respectively. The calibration solutions were injected in random order. The lineardynamic range for the peak height was from LOQ to 20 mg L- and for the peak area fromLOQ to 75 mg L-1. Accuracy was evaluated as percent recovery from determination of known concentra-tion of the analyte in the sample diluent using the equations of regression lines listed inTable 1. The obtained accuracy in the range 98-102% for standard solutions is acceptablefor the current stage of development of this technology. Precision of the method,evaluatedas relative standard deviation (RSD) of the Ko, ranged from 0.22% to 0.30% indicating goodrepeatability of the identification parameter. 2.4. Analysis of Food, Biological and Pharmaceutical Samples The practical applicability of the uITP-IMS method was verified by the analysis of food(apple vinegar, wine, fish sauce), biological (saliva) and pharmaceutical (ear drops) samples,in which the presence of at least one acid from the homologous series of C2-C6 carboxylicacids was expected (Figure 4, Table 2). The sample preparation prior to the uITP-IMSanalysis varied depending on the complexity of the sample and individual procedures aredescribed in detail in Section 3.2. The dilution factor was estimated based on the expectedconcentration of the studied carboxylic acids in individual types of the samples found inthe literature. A preliminary study with diluted samples was then performed, so that theIMS response of the analytes lies in the middle of the calibration range. K (cm²V"s) Ko (cm²-1s1) Figure 4. uITP-IMS analysis of (a) 4000-times diluted apple vinegar, (b) 4000-times diluted apple vinegar with addition of20 mg L-1 of C1-C6 carboxylic acids, (c) 2000-times diluted ear drops, (d) 2000-times diluted ear drops with addition of20 mg L-1 of C1-C6 carboxylic acids, (e) 10-times diluted saliva, (f) 10-times diluted saliva with addition of 20 mg L-1 ofC1-C6 carboxylic acids. Formic acid (1), acetic acid (2), propionic acid (3), butyric acid (4), valeric acid (5) and caproic acid(6). Auxiliary liquid: 10% TE; flow rate: 30 pL min-1. Other uITP-IMS parameters are given in Materials and Methods.* position of the analyte. Table 2. Results of the analysis of real samples. Analyte Concentration [mg L-1] Accuracy[%]a Ko[cm²V-1 s-1] (RSD[%])a Acetic acid 79,221.5b;212.3;901.2d;130.2;50,124.5f 92.5-108.3 2.06(0.40) Propionic acid 44.7e 93.0-108.0 1.93(0.29) Butyric acid n.d. 100.9-108.7 1.81 (0.50) Valeric acid n.d. 94.5-107.7 1.69(0.58) Caproic acid n.d. 93.9-104.2 1.60(0.31) a each sample analyzed in triplicate, 20 mg L-1 of the analytes added; bapple vinegar; wine;d fish sauce; saliva; fear drops; n.d. not detected. As a result of fermentation process, acetic acid is expected in wide range of foodproducts. In apple vinegar, which is used as an acidifier, flavor enhancer and food preser-vative, mostly acetic acid was expected to be present. Concentration of acetic acid in theapple vinegar was determined to be 79.2 g L-1, while no other studied carboxylic acidswere detected. Similar results were obtained in the study focused on the determination oforganic acids in various vinegars [28]. Concentration of acetic acid in wine varies basedon the wine production process [1], and it should be monitored as it significantly affectsthe organoleptic properties of wine. In the white wine analyzed, concentration of aceticacid was found to be 212.3 mg L-1. The presence of acetic acid was confirmed also in thefish sauce, produced by fish fermentation, at concentration of 901.2 mg L-1. This compareswell with the content found in the literature [29]. From the studied carboxylic acids, mostly acetic acid was expected in saliva, as aresult of various metabolite pathways in the human body. Acetic acid and propionic acidwere detected in the analyzed saliva, as suggested in the literature [30]. The concentrationof acetic acid was found to be 130.2 mg L-1 and the concentration of propionic acid was44.7 mg L-1. Acetic acid is also often present in pharmaceuticals either as a counterion oractive ingredient in antimicrobial products. The concentration of acetic acid in the analyzedear drops was found to be 50.1 gL-. As evident, in most of the analyzed real samples only acetic acid was detected anddetermined. In order to show the practical applicability of the developed method for thesimultaneous determination of all studied carboxylic acids, real samples spiked with astandard addition of C1-C6 carboxylic acids were analyzed (Figure 4b,d,f). Ko values ofC2-C6 carboxylic acids in the analyzed real samples with standard addition were practicallythe same as those in the standard solutions, which implies a minimal sample matrix effecton the Ko values (Table 2). Based on accuracy data in Table 2, the developed uITP-IMSmethod was found to be suitable for the analysis of studied carboxylic acids in the samplesof different origin. 3. Materials and Methods 3.1. Chemicals and Solutions Chemicals of p.a. purity,used to prepare uITP electrolytes and standard solutions,were purchased from Sigma-Aldrich (Steinheim, Germany), Merck-Millipore (Darmstadt,Germany), Serva (Heidelberg, Germany) and Lachema (Brno, Czech Republic). The LE usedfor uITP separations consisted of 10 mmol L-l hydrochloric acid and 50 mmol L-1e-amino-n-caproic acid at pH 5.0 and the TE consisted of 20 mmol L-14-Morpholineethanesulfonicacid and 20 mmol L-1 L-histidine at pH 6.1. Standard solutions of carboxylic acids (formicacid, acetic acid, propionic acid, butyric acid, valeric acid and caproic acid) were preparedat a 1 g L-1 concentration. MHEC 30,000 (Serva), used as an EOF suppressor, was preparedat a 0.1%(w/u) concentration. Water purified through a Pro-PS system (Labconco, KansasCity, KS, USA) and then deionized by a Simplicity deionization unit (Millipore, Molsheim,France) was used for the preparation of the electrolyte, standard and sample solutions. Theelectrolyte and standard solutions were stored at 4°C and used for a maximum of oneweek. The electrolytes were filtered through a 0.45 um glass fiber filters (Merck-Millipore)prior to use. 3.2. Food, Biological and Pharmaceutical Samples The analyzed food and pharmaceutical samples were purchased at a local store andpharmacy. Low-salt food and pharmaceutical samples (wine, apple vinegar and ear drops)were analyzed after simple pretreatment which included, filtration through a 0.45 um glassfiber filter (Merck-Millipore). Fish sauce, having a high salt content of 230 g L-1, wasfirst pretreated using micro-solid-phase extraction to eliminate excess of chloride. Theextraction procedure was performed according to the literature [31]. Saliva was collected from a healthy adult volunteer, who refrained from eating, drink-ing, or performing any oral hygiene for 4 h prior to unstimulated saliva collection. Thesaliva sample was filtered through a 0.45 um glass fiber filter (Merck-Millipore) aftercollection. Prior to their injection on the microchip, the pretreated sample solutions were ho-mogenized using vortex REAX 2000 (Heidolph Instruments, Schwabach, Germany), andappropriately diluted with deionized water. 3.3. uITP-IMS Instrumentation The MCE analyzer, evaporation unit and IMS analyzer were connected in the wayshown in the schematic diagram in Figure 1 to achieve online uITP-IMS coupling. Theoptimal parameters of the instrumentation used for the uITP-IMS analysis are summarizedin Table 3. Table 3. Parameters of the instrumentation for the uITP-IMS analysis. lnstrument Parameter Setting MCE operating mode ITP-anionic analyzer driving current 20 (10 at detection point) uA effective separation path 59 ×0.2-0.5×0.14-0.2 mm (length x width ×depth) Evaporation unit flow rate 30 uL min temperature of droplet stream 130 °C IMS operating mode negative analyzer sample gas flow rate 100mL min-1 shutter grid pulse width 100 us drift gas flow rate 600 mL min-+ drift field intensity 565 V cm- drift tube temperature 100°C operating pressure 600 mbar acquisition time 130 ms The MCE analyzer used for uITP separations consisted of three parts-a microchip,an electrolyte unit and an electronic unit (Department of Analytical Chemistry, ComeniusUniversity in Bratislava). uITP separations were carried out on a poly(methyl methacrylate)microchip with coupled separation channels (IonChipIM 3.0; Merck, Darmstadt, Germany).The microchip had integrated conductivity sensors, which were used for direct monitoringof the uITP separation. The inlets of the microchip channels were connected to the elec-trolyte unit via polyether ether ketone (PEEK) capillaries of 500 um inner diameter (i.d.)(IDEX Health & Science, Wertheim, Germany). The electrolyte unit consisted of membranedriving electrodes (E1, E2, E3) and peristaltic micropumps (P1, P2, P3, PS), which wereinterconnected via fluorinated ethylene propylene capillaries of 500 um i.d. (IDEX Health &Science). The membrane driving electrodes were used to eliminate interference caused bybubble generation during application of the driving current [24]. Peristaltic micropumpswere used to transport solutions to the individual microchip channels. The rollers of theperistaltic micropumps automatically closed the microchip inlets after filling the microchipchannels and thus ensured the elimination of hydrodynamic flow. Two shut-off valves(IDEX Health & Science) were used to achieve proper filling of the microchip channels and closing of the separation space. The waste valve (1 mm i.d., 10 uLvolume) was placed onthe waste capillary of the MCE analyzer. The outlet valve (0.5 mm i.d., 2.5 uL volume) wasplaced on the microchip outlet capillary (PEEK, 0.178 mm i.d.) and acted as a connection tothe evaporation unit inlet capillary (PEEK, 0.254 mmi.d.). In this way outlet valve servedfor transfer of the analytes from the MCE analyzer to the evaporation unit. Auxiliaryliquid was introduced to the microchip using a syringe pump (Cole-Parmer, Vernon Hills,IL, USA) with a 2.5 mL syringe (Hamilton, Bonaduz, Switzerland). An auxiliary liquidcapillary (PEEK, 0.127 mm i.d.) connected syringe pump with a PEEK mixing tee (IDEXHealth & Science),located between the E1 electrode and the microchip. The electronicunit was used as a source of stabilized electric current. It also included the measuringelectronics of the contact conductivity detector and controlled the peristaltic micropumpsoperation. The evaporation unit (Department of Experimental Physics, Faculty of Mathematics,Physics and Informatics, Comenius University in Bratislava) was used to connect the MCEanalyzer to the IMS analyzer [25]. The evaporation unit consisted of three capillaries: anevaporation inlet capillary for delivering liquid sample to the evaporation unit, a coolingcapillary and a heating capillary. The air flowing from the cooling capillary protected theevaporation unit inlet capillary from overheating, which could cause sample loss duringthe transfer of sample components from the MCE analyzer to the IMS analyzer. The airflowing from the heating capillary was mixed with air from the cooling capillary and liquidsample at the end of the evaporation inlet capillary, which resulted in evaporation of thesample. The outlet from the evaporation unit was placed in front of the IMS inlet capillary,and in this way evaporated sample was introduced into the IMS analyzer. The IMS analyzer (Department of Experimental Physics, Comenius University inBratislava in collaboration with MaSaTECH, Bratislava, Slovakia) operated in reverse gasflow mode; the drift gas inlet was at the end of drift tube and the gas outlet was behindthe corona discharge. Atmospheric air purified by molecular sieve moisture trap (Agilent,Santa Clara, CA, USA) was used as a drift gas. Sample evaporated using the evaporationunit entered the reaction region where it was ionized. The IMS analyzer was equippedwith a corona discharge ionization source. Ionized sample was then introduced into a drifttube, through a Bradbury-Nielsen shutter grid, which regulated the entry of the ions intothe drift tube. Subsequently, the ions were separated in a drift tube and the signal of theions was detected at the end of the drift tube on a Faraday plate and amplified by a currentamplifier. The control unit was used for recording IMS spectra and setting the operatingparameters. The IMS analyzer was calibrated using Ko of 2,6-di-tert-butyl pyridine [32]. 3.4. Microchip Maintenance and Measurement Procedure To suppress the EOF, the microchip channels were filled daily with a 0.1%(w/o) MHECfor 5 min prior to the first analysis. Afterwards, the channels were rinsed with deionizedwater for 10 min and subsequently filled with the electrolyte and sample solutions usingperistaltic micropumps. During the filling procedure outlet valve was closed and the excessof solutions was removed from the microchip through the open waste valve. When thefilling procedure ended, the waste valve was closed, and the outlet valve was opened toensure transfer of all separated sample components from the microchip to the evaporationunit. Upon switching on the driving current, which was applied between the E3 and E1electrodes, the anions were migrating from the sample channel towards the E1 electrode(anode). Simultaneously, the syringe pump was switched on and the auxiliary liquid wasintroduced onto the microchip in the direction opposite to the electrophoretic migrationof the anions on the microchip. The auxiliary liquid along with the separated samplecomponents exited from the microchip through the only open outlet, which was connectedto the evaporation unit. At the outlet from the evaporation unit, the separated samplecomponents were evaporated and subsequently syphoned into the reaction region of theIMS analyzer, where they underwent a reaction with the reactant ions. Further separationof ions continued in the drift tube and the detection took place on a Faraday plate. Between the analyses, the microchip channels were only refilled with the electrolyteand sample solutions for 3 min. After the last analysis of the day, the channels were rinsedwith 2%(v/u) aqueous detergent solution (Extran MA 02, Merck,Kenilworth, NJ,USA) for5 min and deionized water for 10 min. 3.5. Data Processing Conductivity data were recorded using MicroITP software (Merck, Kenilworth,NJ,USA), while IMS data, presented in the form of 2D plots, were recorded by IMS controlsoftware (MaSaTECH, Calgary, AB, Canada) and processed using Octave software (4.4.1).During creation of the 2D plots, spectra were treated using a moving average filter. Eachpoint of the 2D heat map plot was characterized by the overall analysis time (includinguITP separation time, transfer time and IMS drift time), the Ko value and intensity of theIMS response (expressed as ion yield detected by the IMS analyzer). 4. Conclusions In this work,online uITP-IMS combination has been developed, tested and success-fully applied to the analysis of complex biological, food and pharmaceutical samples. Thecoupling combined high preconcentration capabilities of uITP with sensitive IMS iden-tification. The crucial point of such coupling is the transfer of separated analytes fromthe liquid to the gaseous phase. Optimization of transfer parameters, mainly the flowrate of the auxiliary liquid as well as the temperature for evaporation, led to minimalimpact on the separation of the analytes and their quantification. Five carboxylic acidsfrom the homologous series serving as model analytes were successfully separated andidentified by the uITP-IMS coupling. Practical applicability of the developed approachwas demonstrated by the analysis of five real samples of different origin. Acetic acid wasdetermined in apple vinegar, wine, fish sauce, ear drops and saliva, while propionic acidwas determined in saliva. A standard addition method was used to confirm the presence ofcarboxylic acids in the analyzed samples based on their Ko values. The developed approachcan be beneficial for the determination of trace analytes, especially in the situations whereuITP coupled with universal conductivity detection is failing to sufficiently separate anddetect minor components. Author Contributions: Conceptualization, J.H. and M.M.; methodology, J.H. and R.S.; software,M.D., J.H.and L.M.; validation, J.H. and R.S.; formal analysis, J.H. and M.D.; investigation, L.M.and S.M.; resources, 5.M. and M.M.; data curation, M.D., J.H. and R.S.; writing-original draftpreparation, J.H. and M.D.; writing-review and editing, J.H., M.M. and R.S.; visualization, J.H. andM.D.; supervision, M.M., R.S. and J.H.; project administration, M.M. and S.M.; funding acquisition,M.M. and M.D. All authors have read and agreed to the published version of the manuscript. Funding: This research was funded by the Slovak Research and Development Agency (APVV-17-0318and APVV-17-0373) and Comenius University Grant (UK/109/2021). Institutional Review Board Statement: Ethical review and approval were waived for this studysince the saliva sample was collected from one of the authors. Informed Consent Statement: Informed consent was obtained from all subjects involved in thestudy. Data Availability Statement: Not applicable. ( Acknowledgments: This publication is supported by the p r oject (no. 21930006) co-financed by th e Governments of Czechia, Hungary, Poland and Sl o vakia th r ough Visegrad Grants from InternationalVisegrad Fund. T h e mission of the fund is to advance ideas for sustainable regional cooperation in Central Europe. ) ( Conflicts of Interest: The authors declare no conflict of interest.Sample Availability: Samples of the compounds are not available from the authors. ) ( References ) ( 1 Robles, A.; Fabjanowicz, M.; Chmiel, T.; Plotka-Wasylka,J. Determination and identification of organic acids in wine samples.Problems and challenges. T rAC Trends Anal. Chem.2019,120,115630.[Cr o s s Ref] ) ( 2. The European Commission. Commission Regu l ation (EU) No 231/2012 of 9 March 2012 laying down specifications for foodadditives listed in Annexes II and I II to Regulation (EC) No 1333/2008 of the European Parliament and of the Council. Off. J. E ur.Union 2012, L83,1-295. ) ( 3. Van Balen, F.A.M.; Smit, W.M.; Zuithoff, N.P.A.; Verheij, T.J.M. Clinical efficacy of three common treatments in acute otitis externain primary care: Randomised co n trolled tr i al. Br. Med. J. 2003,327,1201-1203.[Cro ssRef] ) ( 4. Baena, B.; Cifuentes, A.; B arbas, C. Analysis of carboxylic acids in biological fluids by capillary electrophoresis. Electrophoresis2005, 26,2622-2636.[ CrossRef ] ) ( 5. Qiu,X.;Zhang, Y.; Zhou, Y.; Li, G.H.;Feng, X.S. Progress in pretreatment and analysis of organic Acids: An update since 2010. Food Chem. 2021,360, 1 29977.[C rossRef| ) ( 6. Hernandez-Mesa, M.; Ropartz,D.;Garcia-Campafia,A.M.; R ogniaux, H.;Dervilly-Pinel, G.; Le Biz e c, B. Io n mobility spectrometryin food analysis: Principles, current applications and future trends. Molecules 2019, 24, 2706. [C r oss R ef] [ Pu b Med] ) ( 7. Galuszka, A.;Migaszewski, Z.;N a miesnik, J. The 12 principles of green analytical chemistry an d the SIGNIFICANCE mnemonicof green analytical practices . TrAC Trends Anal . Chem. 2013,50, 7 8-84. [ C r o ssRef] ) 8ey, L.; Delaunay, N. Food FerAnalysis on Electrophoretic Microchips. Sep. Purif. Rev. 2016, 45,193-226. [CrossRef]9 ( Nuchtavorn, N.; Suntornsuk, W.; Lunte, S.M.; Suntornsuk, L. Recent applications of microchip electrophoresis to biomedicalanalysis. J. Pharm. Biomed. Anal. 2015, 113,72-96.[Cr ossRef] ) ( 10. C Chouinard, C.D.; Wei, M.S.; Beekman, C.R.; Kemperman, R.H.J.; Yost, R.A. Ion mobility in clinical analysis: Current progress andfuture perspectives. Clin. Chem. 2016, 62, 124-133. [CrossRef ] ) ( 11. Marquez-Sillero,I.; Aguilera-Herrador, E.; Cárdenas,S.; Valcarcel, M. Ion-mobility spe c trometry for environmental analysis.TrAC Trends Anal. Chem. 2011, 30, 677-690. [Cro s sR e f ] ) ( 12. Zheng, X.; Wojcik, R.; Zhang, X.;I b rahim, Y.M.; Burnum-Johnson, K.E.; Orton, D.J.; Monroe, M.E.;Moore, R.J.; Smith, R.D.; Baker,E.S.Coupling front-end separations, ion mobility spectrometry, and mass spectrometry fo r enhanced multidimensional biologicaland environmental analyses. Annu. Rev. Anal. Chem. 2017, 10,71-92. [Cross R e f ] [P ub M e d] ) ( 13. Li,J.; Purves, R.W.; Richards, J.C. Coupling capillary electrophoresis and high-field asymmetric waveform ion mobility spectrom-etry mass spectrometry for the analysis of complex lipopolysaccharides. Anal. Chem. 2004 , 76, 4 676-4683. [Cross Ref] ) 14. Revercomb, H.E.;Mason, E.A. Theory of Plasma Chromatography/Gaseous Electrophoresis. A Review. Anal. Chem. 1975,47,970-983.[CrossRef ( 15. Jiang, X.; Svensmark, B.; Deng, L. Coupling capillary electrophoresis and ion mobility spectrometry via e l ectrospray interface: Apreliminary study. Adv. Mater. Res . 2011,160-162,1531-1534.[C rossR e f] ) ( 16. Shumate, C.B.; Hill, H.H., Jr. Coronaspray Nebulization and Ionization of Liquid Samples for Ion Mobility Spectrometry. Anal.Chem.1989,61,601-606.[C rossRef ] ) 17. Hallen, R.W.; Shumate, C.B.; Siems, W.F.; Tsuda, T.; Hill, H.H., Jr. Preliminary investigation of ion mobility spectrometry aftercapillary electrophoretic introduction. J. Chromatogr. A 1989,480,233-245.[CrossRef] ( 18. Masár, M.; Hradski, J.; Novakova, M.; Szucs, R.; Sabo, M.; Matejik, S. O nline coupling of microchip electrophoresis with ionmobility spectrometry f o r direct analysis of complex liquid samples. Sens. A ctuators B C hem. 2020, 302,127183.[C r o ssRef] ) 19. Hartner, N.T.; Raddatz, C.R.; Thoben, C.; Piendl, S.K.; Zimmermann,S.; Belder, D. On-line coupling of chip-electrochromatographyand ion mobility spectrometry. Anal. Chem. 2020, 92, 15129-15136.[CrossRef] [PubMed] 20.).Hradski, J.;Chorvathova, M.D.; Bodor, R.; Sabo, M.; Matejxik, ǒ.; Masár, M. Quantitative aspects of microchip isotachophoresisfor high precision determination of main components in pharmaceuticals. Anal. Bioanal. Chem.2016, 408,8669-8679.[CrossRef] 21. Masar, M.; Troska, P.; Hradski, J.; Talian, I. Microchip isotachophoresis coupled to surface-enhanced Raman spectroscopy forpharmaceutical analysis. Microchim.Acta 2020,187,448.[CrossRef] 22. Maly, M.;Boublik, M.; Pocrnic, M.; Ansorge, M.; Lorinikova, K.; Svobodova, J.; Hruska, V.;Dubsky, P.;Gas, B. Determination ofthermodynamic acidity constants and limiting ionic mobilities of weak electrolytes by capillary electrophoresis using a new freesoftware AnglerFish. Electrophoresis 2020, 41, 493-501. [CrossRef] ( 23. T ao, L.; Han,J.; Tao,F.M. Correlations and predictions of carboxylic acid pKa values using intermolecular structure and propertiesof hydrogen-bonded complexes.J. Phys. C hem. A 2008, 112,775-782. [ CrossRef ] ) 24. Kaniansky, D.; Masár, M.; Bodor, R.; Zuborova, M.; Olvecka, M.; Johnck, M.; Stanislawski, B. Electrophoretic separations on chipswith hydrodynamically closed separation systems. Electrophoresis 2003,24,2208-2227. [CrossRef] 25. Sabo, M.; Malaskova, M.; Harmathova, O.;Hradski, J.; Masar, M.; Radjenovic, B.; Matejik, S. Direct Liquid Sampling for CoronaDischarge Ion Mobility Spectrometry. Anal. Chem. 2015, 87,7389-7394. [CrossRef][PubMed] 26. Sabo, M.; Matuska,J.; Matejěik, S. Specific O2generation in corona discharge for ion mobility spectrometry. Talanta 2011,85,400-405. [CrossRef] ( 27. . Gao, H.;Niu, W.;Hong, Y.; Xu, B.; Shen,C.; Huang, C.; Jiang, H.; Chu,Y. Negative photoionization chloride ion attachment ion mobility spectrometry for the detection of organic acids. RSC Adv. 2014,4,63977-63984.[ CrossRef] ) ( 28. Sengun,I.Y.; Kilic, G.; Ozturk, B. Screening physicochemical, microbiological and bioactive properties of fruit vinegars produced from various raw materials. Food Sci. Biotechnol.2020,29,401-408. [CrossRe f] [Pub M ed] ) ( 29. Park,J.N.; Fukumoto, Y.;Fujita,E.; Tanaka, T.;Washio, T.;Otsuka, S.; Shimizu, T.; Watanabe, K.;Abe, H. Chemical Compositionof Fish Sauces Produced in Southeast and East Asian Countries. J. Food Compos. A n al. 2 0 01, 14,113-125.[Cro ssRef] ) 30. Park, Y.D.;Jang,J.H.; Oh, Y.J.;Kwon, H.J. Analyses of organic acids and inorganic anions and their relationship in human salivabefore and after glucose intake. Arch. Oral Biol. 2014, 59, 1-11. [CrossRef] ( 31. Troska, P.; Chudoba, R.; Danc,L . ; Bodor, R.; H oriciak, M .; T esarova, E.; Masár, M. Determination of nitrite and nitrate incerebrospinal fluid by microchip electrophoresis with microsolid phase e x traction pre-treatment. J. Chromatoor. B Anal. Technol.Biomed. Life Sci. 2013,930, 41-47. [ C rossRef ] [PubM e d] ) ( 32. E iceman, G.A.;N a zarov,E.G.; Stone, J.A. C hemical s t andards i n ion mobility spectrometry. A nal. Chim. Acta 2003, 493,185-194. C rossRe f ) 首次报道了使用热蒸发界面的微芯片等速电泳 (μITP) 与离子迁移谱 (IMS) 的在线耦合。这种组合结合了 µITP 的预浓缩能力,然后通过 IMS 对复杂样品中的痕量化合物进行明确鉴定。选择作为模型分析物的短链羧酸首先在 pH 5-6 的不连续电解质系统中通过 µITP 进行分离,然后在将它们转移到 IMS 迁移谱仪期间在 130 °C 下蒸发。对影响分离的样品组分通过蒸发系统的传输的各种参数进行了优化,以最大程度地减少分析物的分散和损失并提高灵敏度。标准溶液中羧酸的以下分析属性: 0.1–0.3 mg L-1检测限,0.4–0.9 mg L -1定量限,从定量限到 75 mg L -1 的线性校准范围,IMS 响应的 0.2–0.3% RSD 和 98–102% 准确度。开发的 µITP-IMS 组合的分析潜力在各种食品、药物和生物样品的分析中得到了证明,其中研究的酸是天然存在的。这些包括:苹果醋、葡萄酒、鱼露、唾液和滴耳液。在实际样品中,IMS 响应的 RSD 为 0.3-0.6%,准确度为 93-109%。
确定


还剩12页未读,是否继续阅读?

产品配置单


图拉扬科技有限公司为您提供《食品药品中氨基酸等检测方案(空气发生器)》,该方案主要用于液体乳中营养成分检测,参考标准--,《食品药品中氨基酸等检测方案(空气发生器)》用到的仪器有masa零级空气发生器、MCCGC-AIMS PeakMachine气相离子迁移谱、PAIMS离子迁移谱系统
相关方案
更多
该厂商其他方案
更多