


方案详情
文
多重单分子阵列技术平台(数字 ELISA) 是作为一种具有独特优势的新平台,可用于检测样品中的多种单分子。如何提高检测的灵敏度是当前相关研究的方向。在这里,我们报告了一种免疫测定方法,该方法应用电动效应来分离单个编码的珠子并限制在微孔中,以同时提高细胞因子检测的效率。微流体设计提供了非均匀电场以诱导介电泳 (DEP) 力并操纵珠子。两种波长的激发光激发编码的珠子,用于同时检测。光通过全内反射原理被限制在底部幻灯片上。通过从图像中拾取每个珠子,然后对报告分子发出的荧光强度进行积分,获得捕获的细胞因子的浓度。结果表明,编码珠的填充百分比通过 DEP 效应从 10-20% 提高到 60-80%。通过比较颗粒、自身及其表面的荧光颜色,将四种靶细胞因子IL-2、IL-6、IL-10和TNF-α的浓度计算为pg/ml水平。加标和回收实验验证了效率,超过 70% 的目标分子被捕获。我们的方法的可靠性也通过流式细胞术验证。综上所述,我们认为 DEP 的应用可以提高数字 ELISA 对多重快速检测的灵敏度。
方案详情

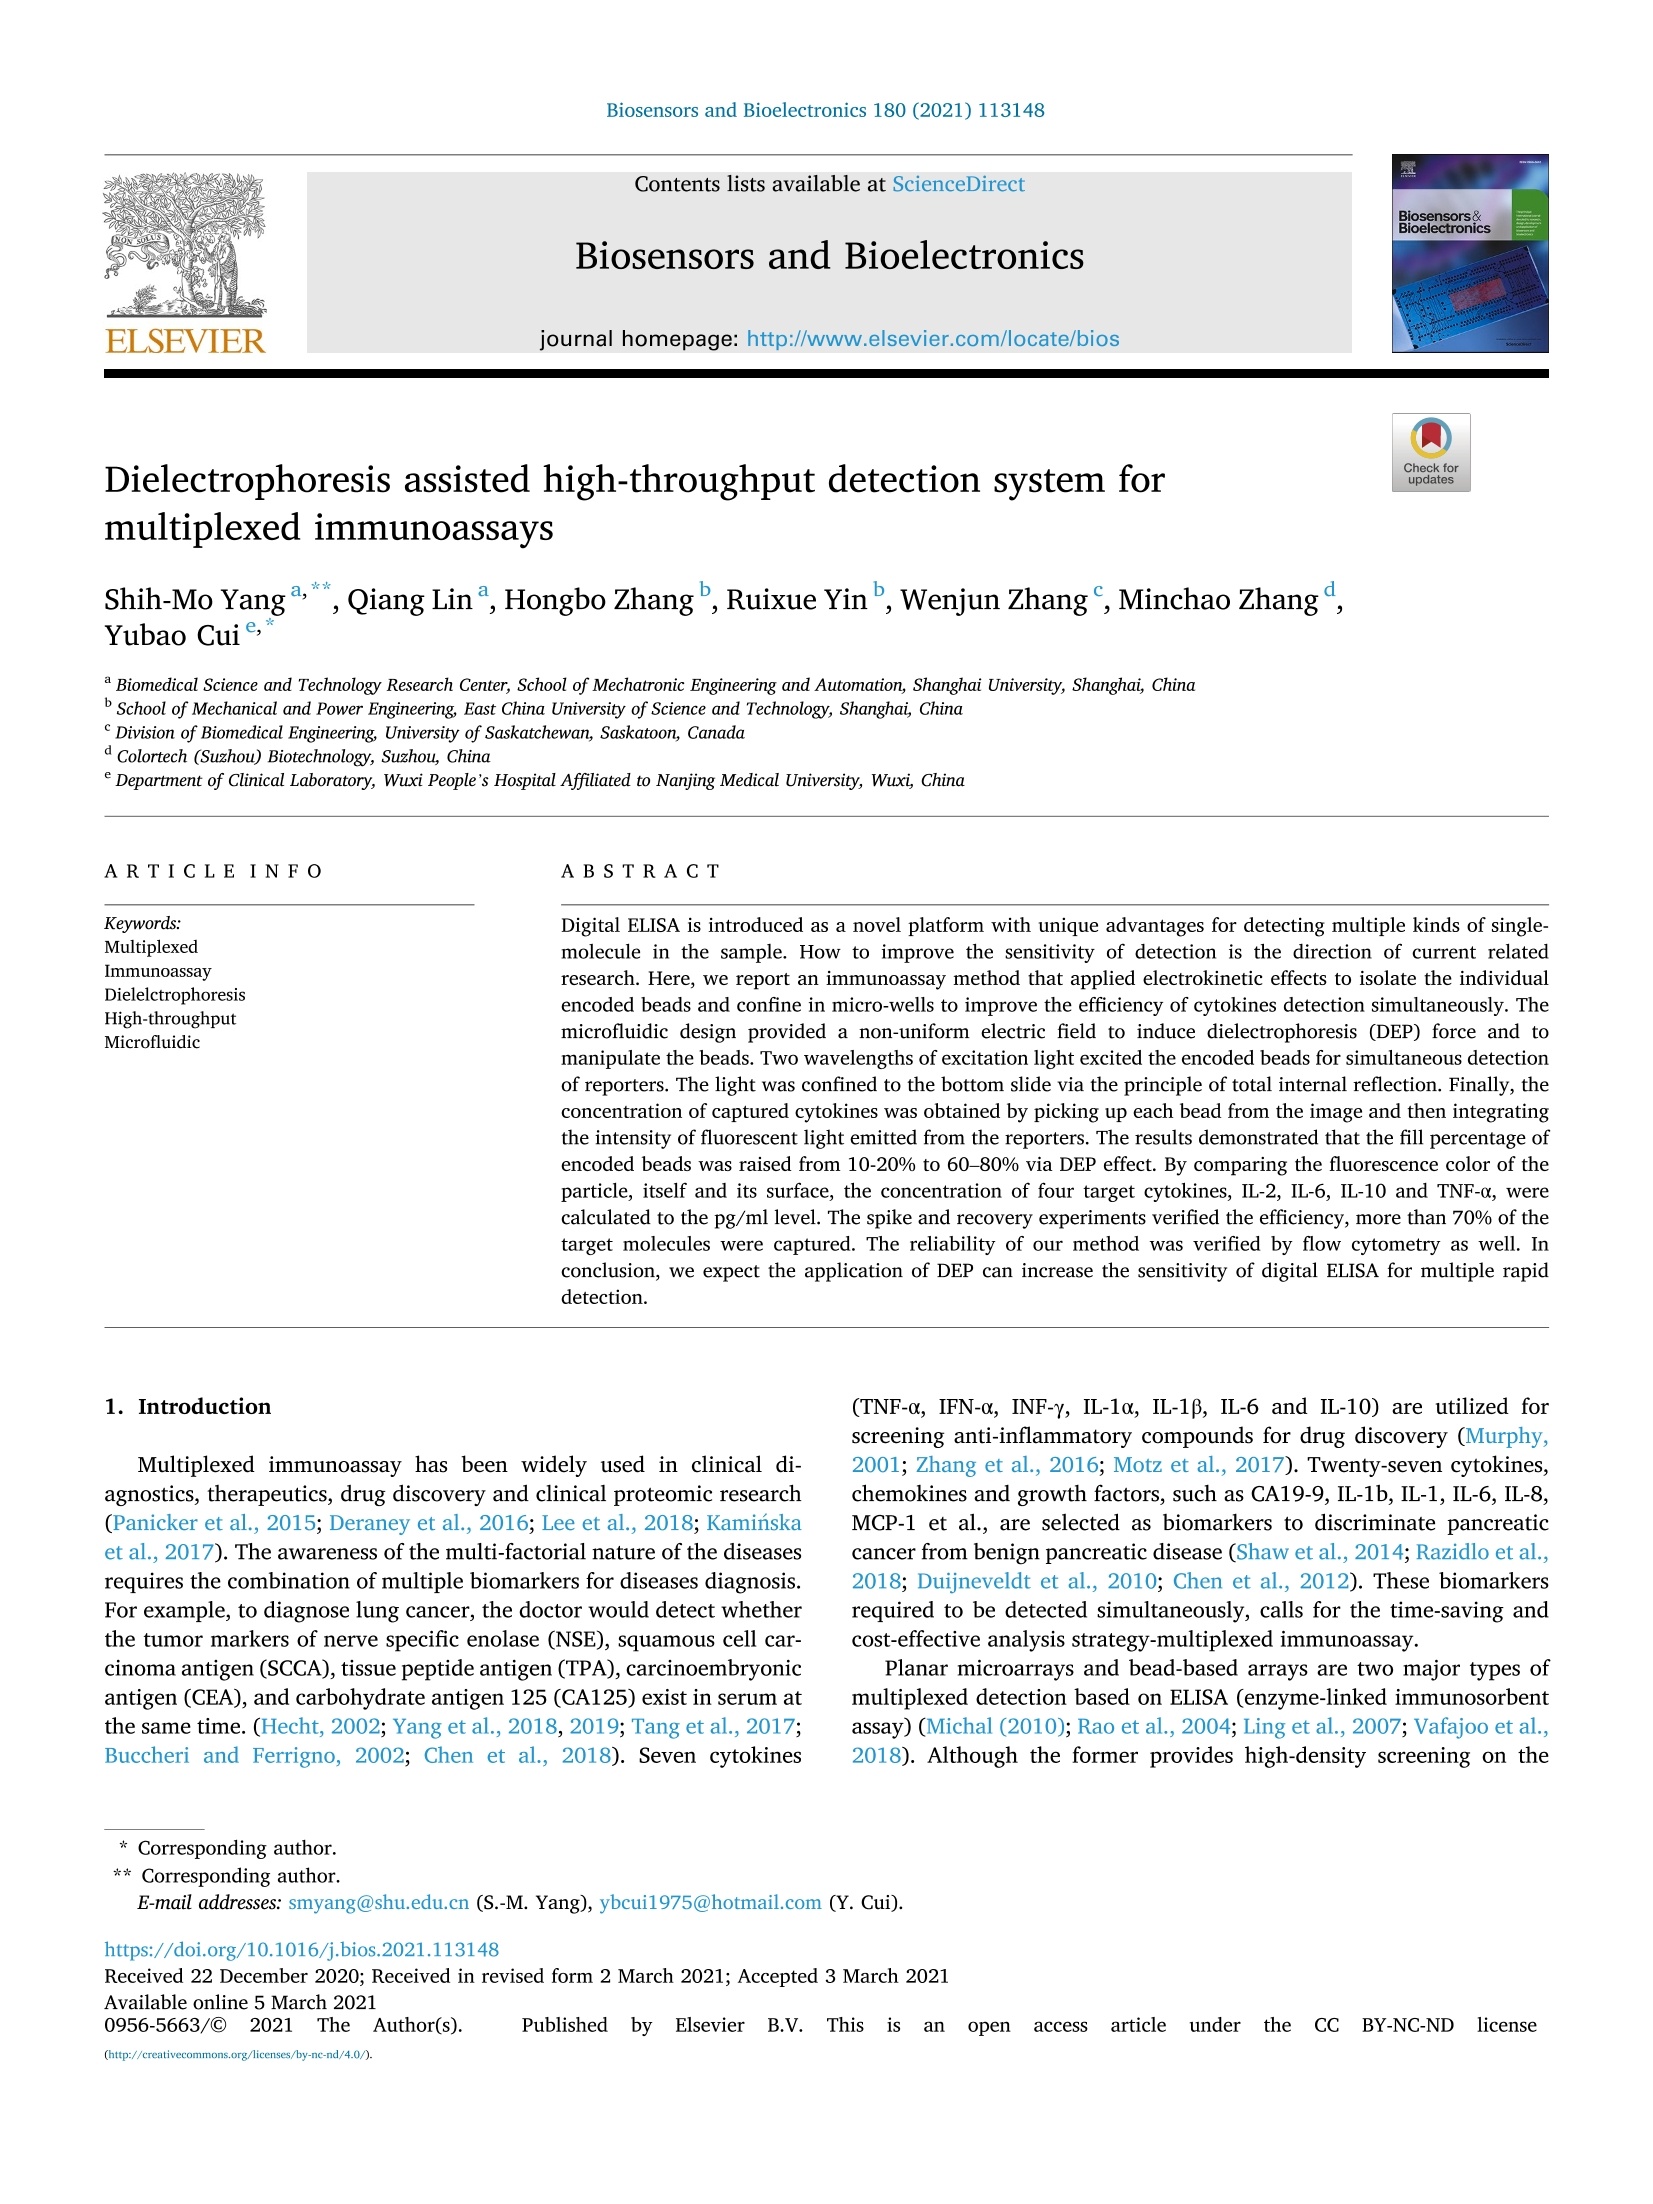
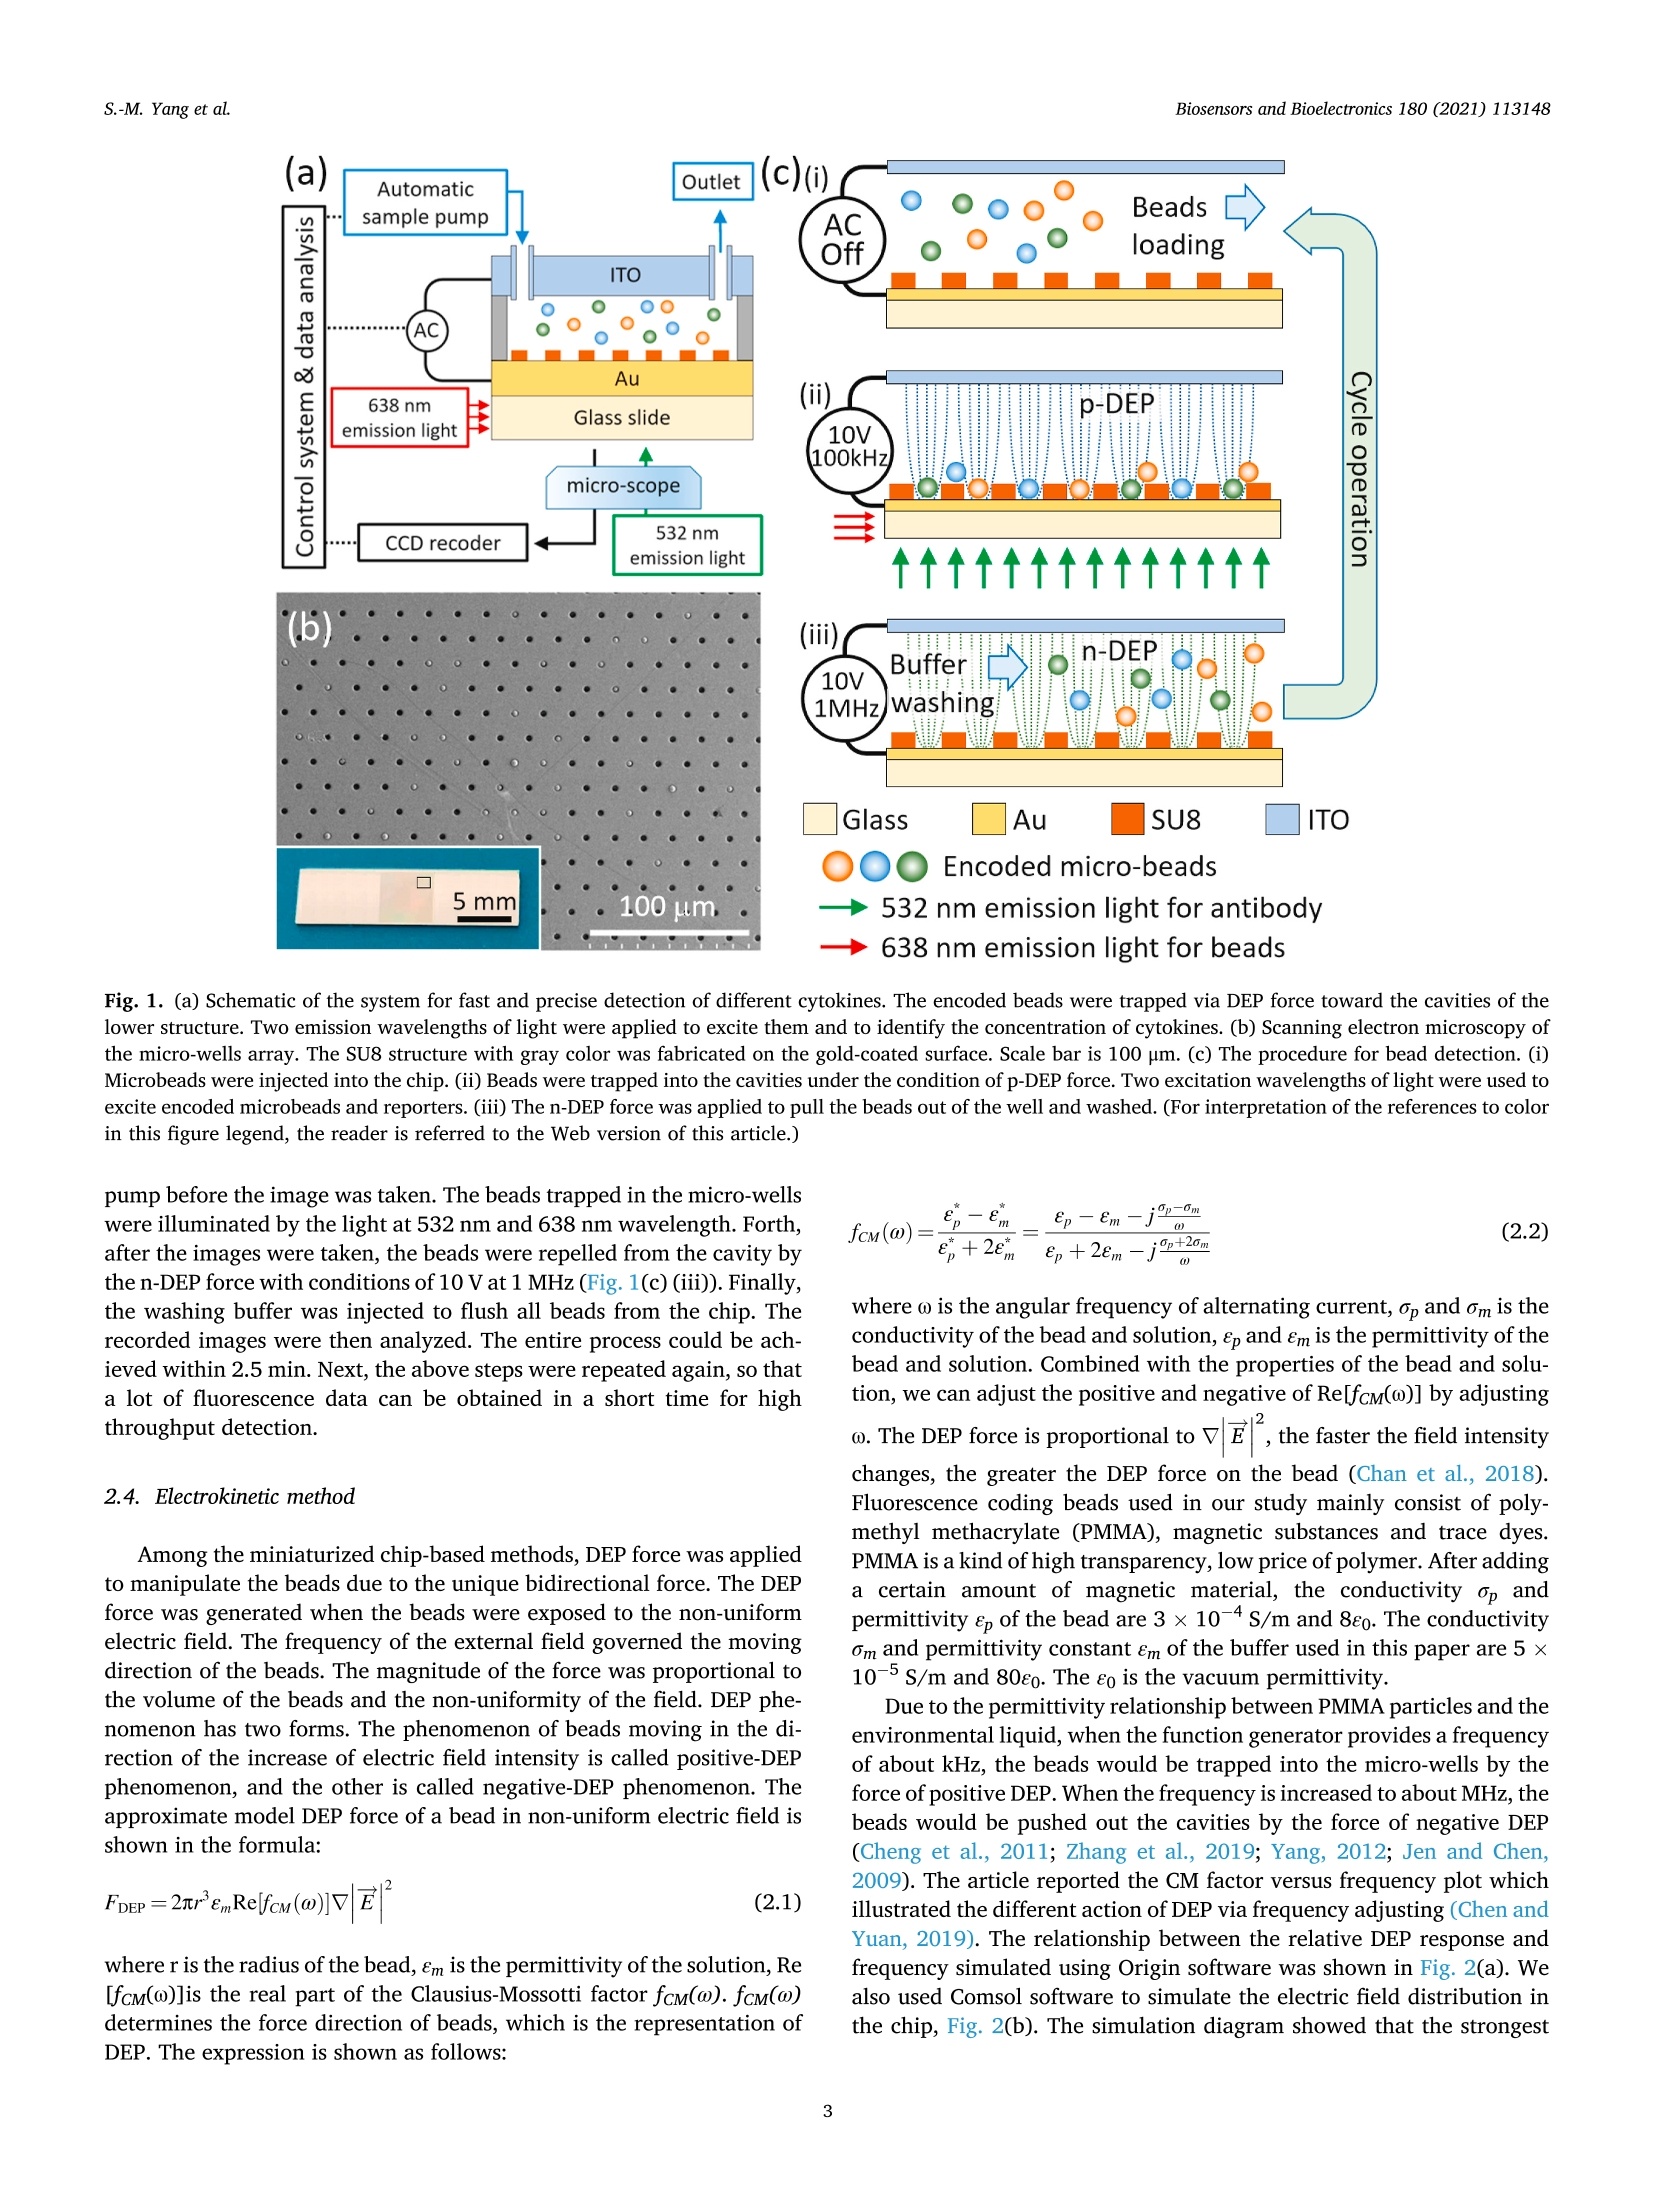
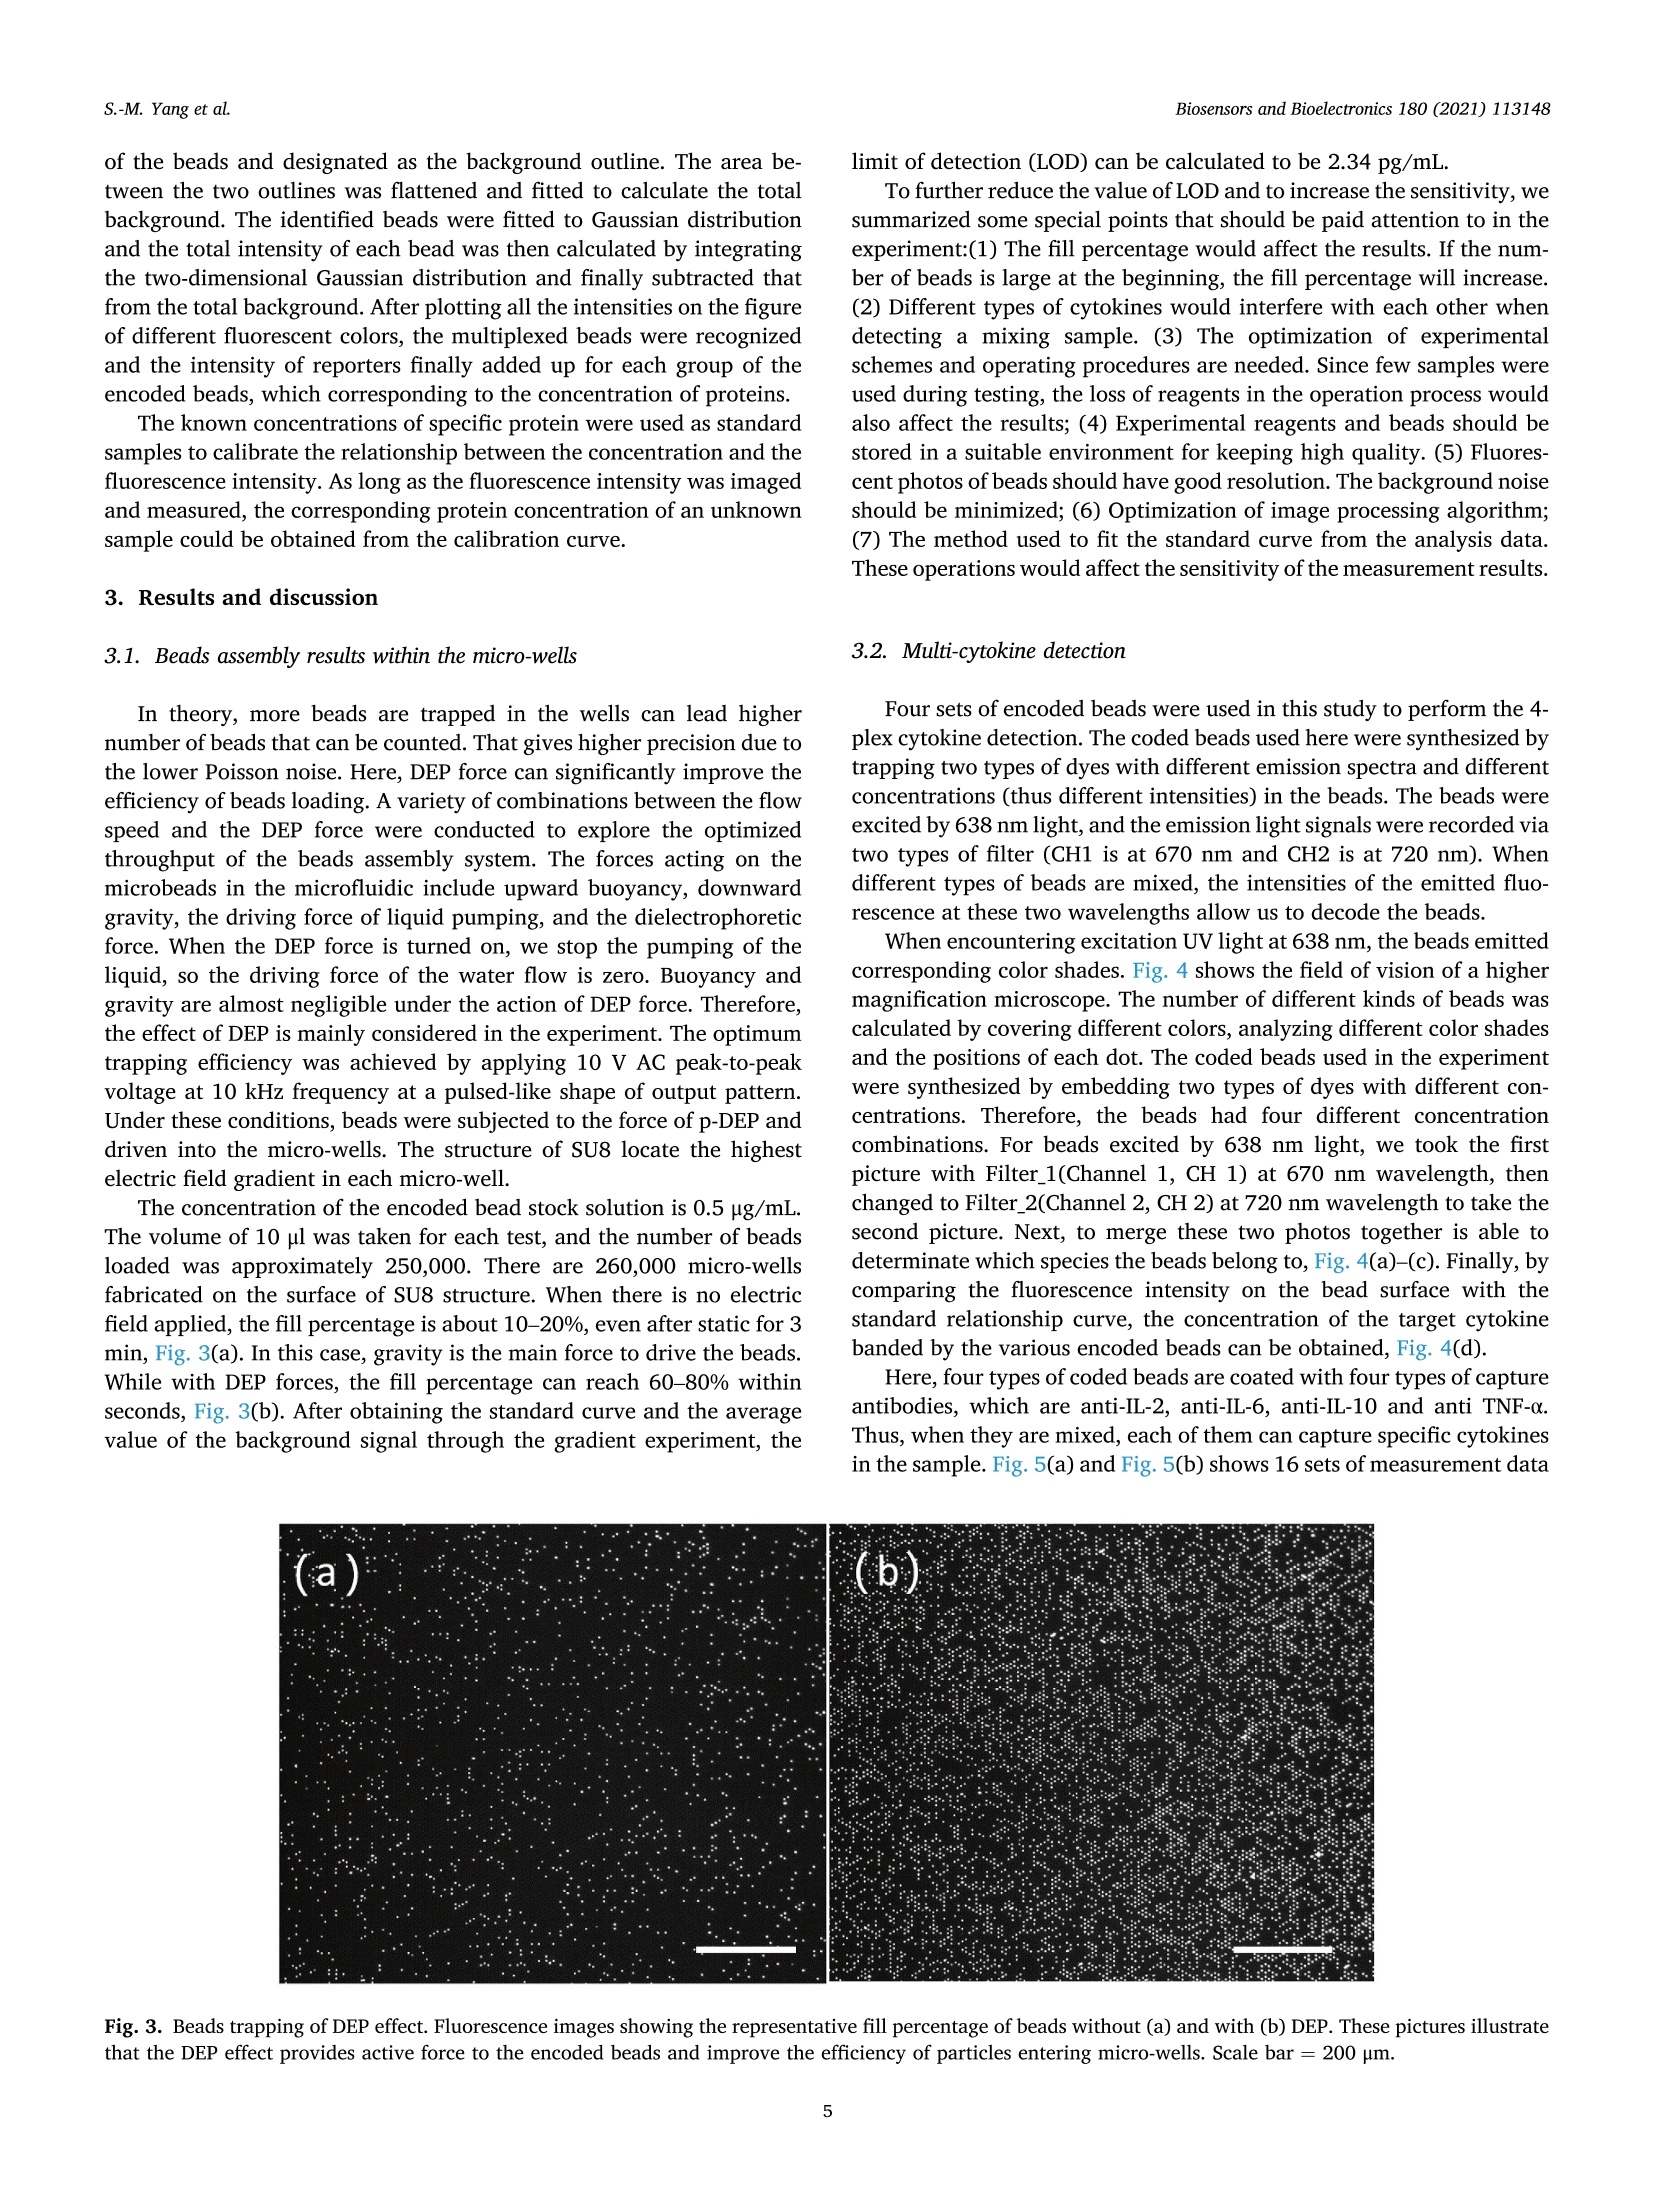
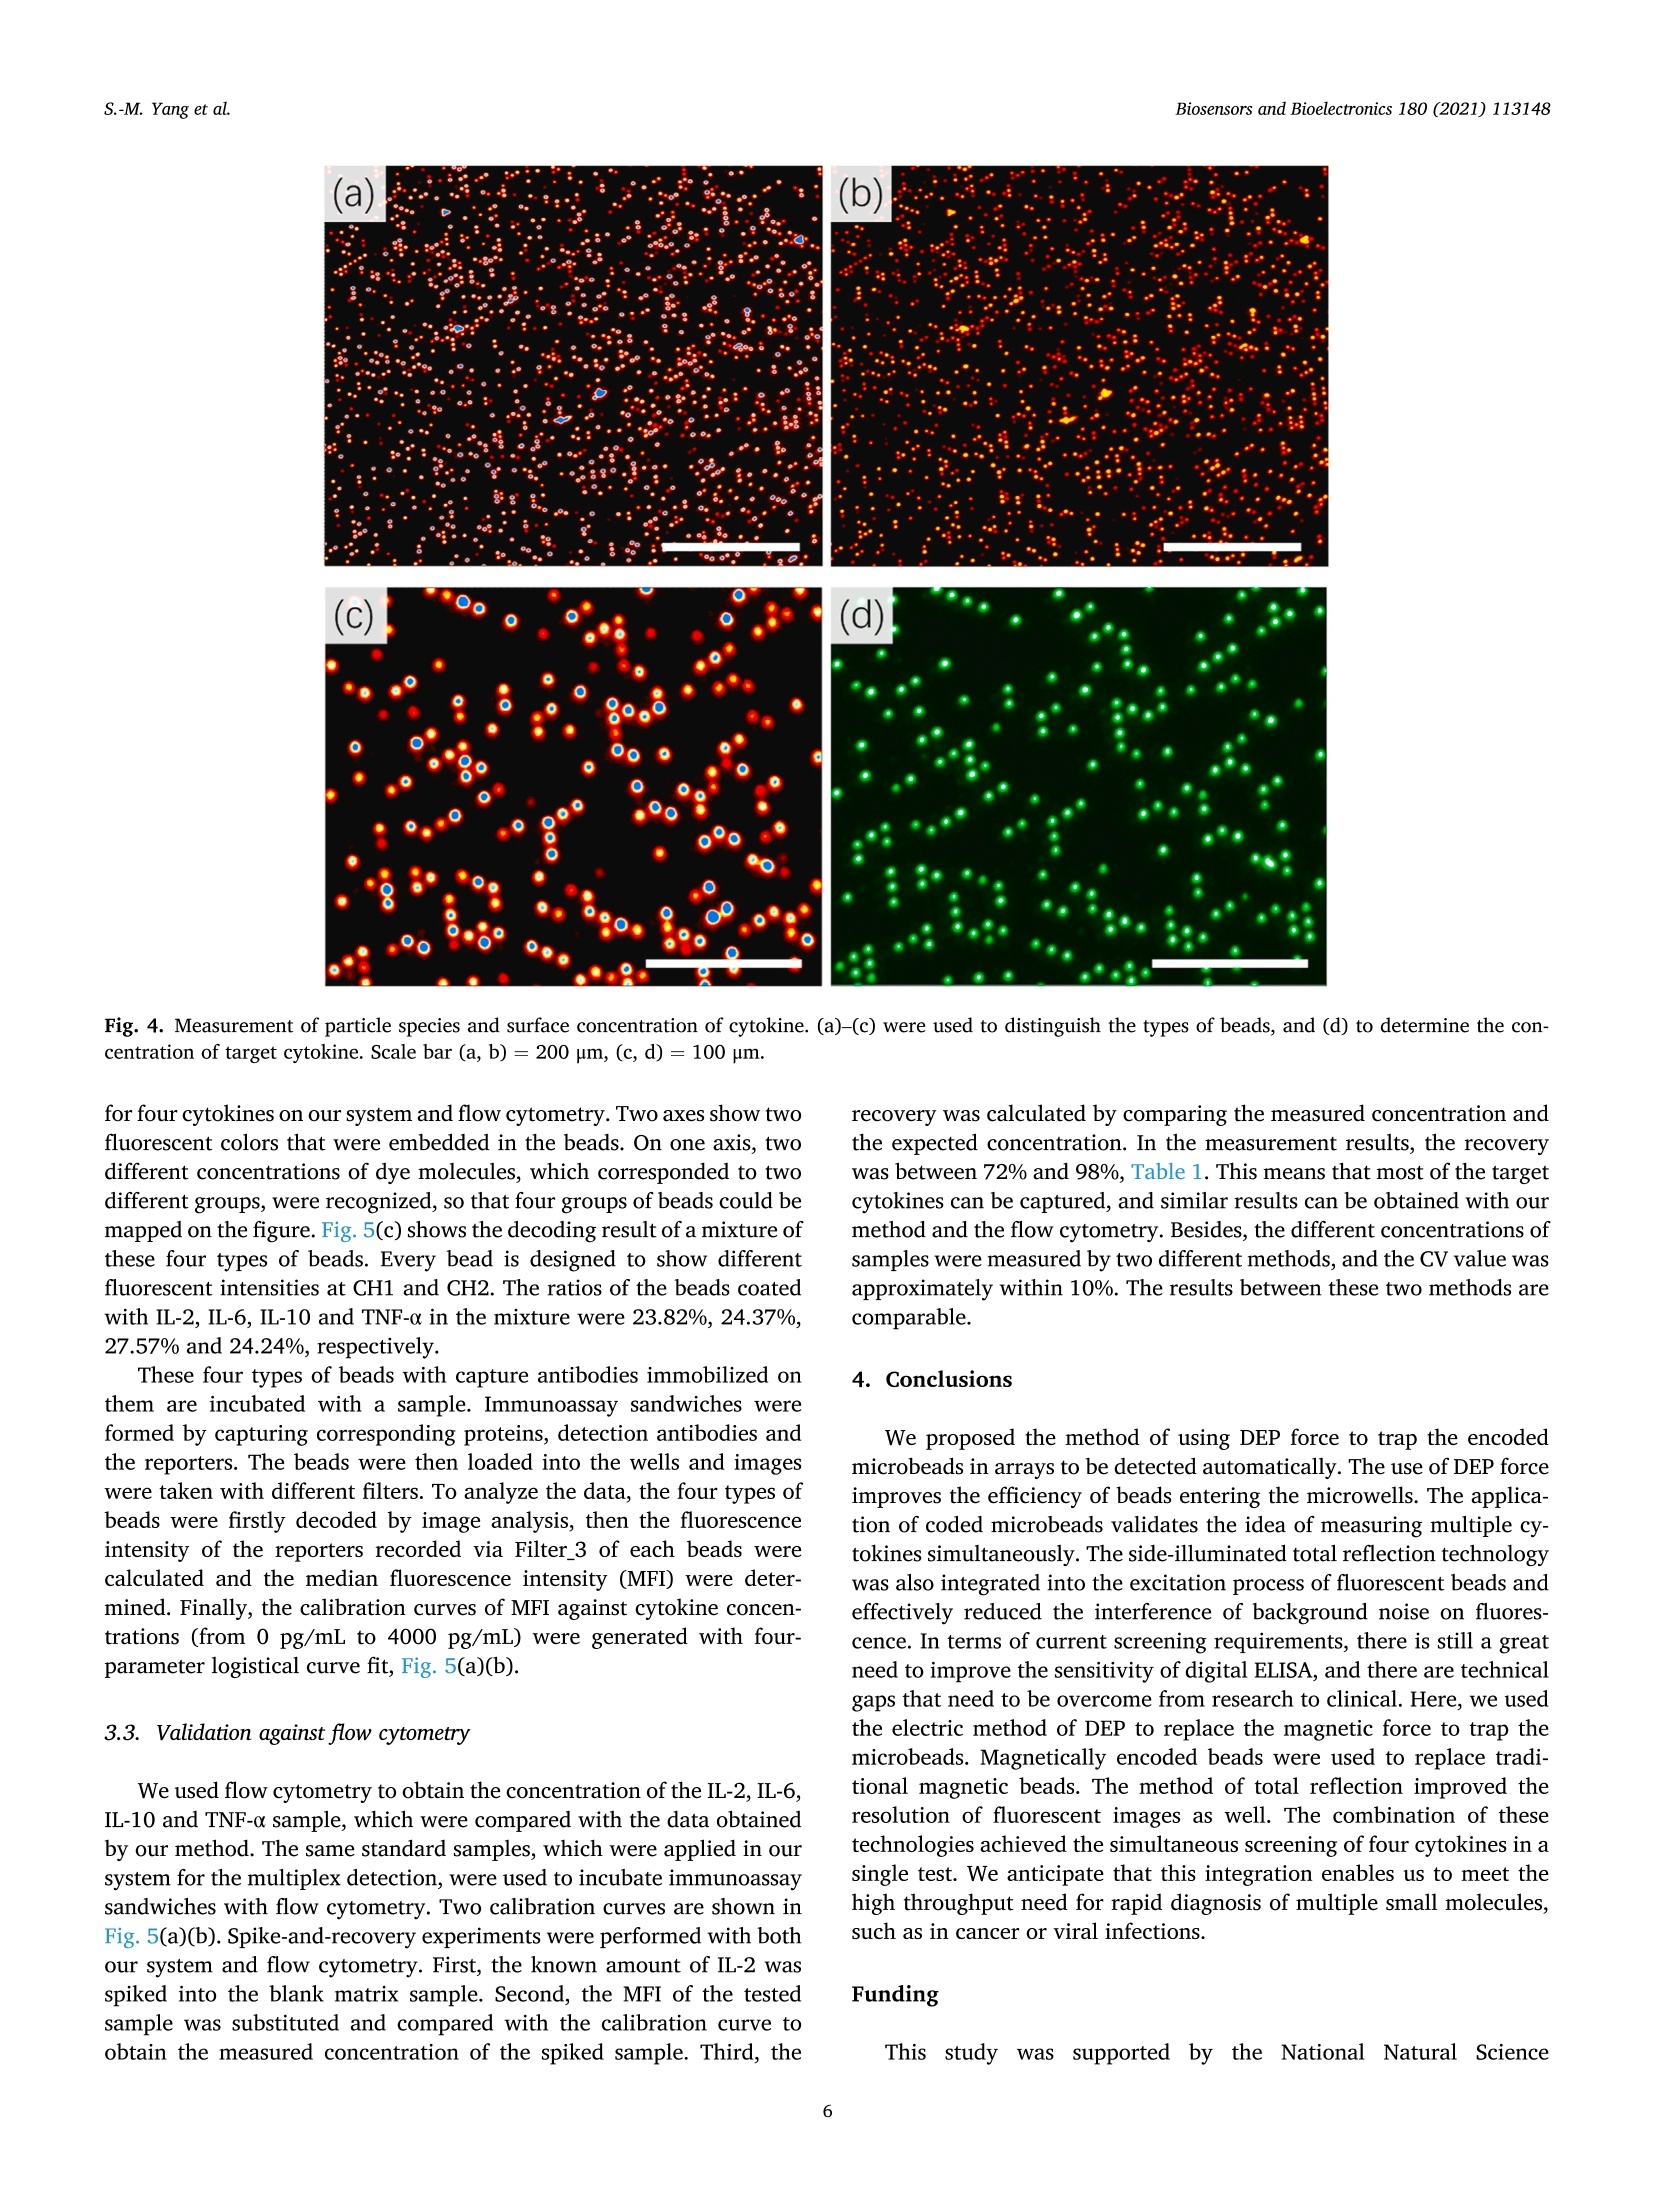
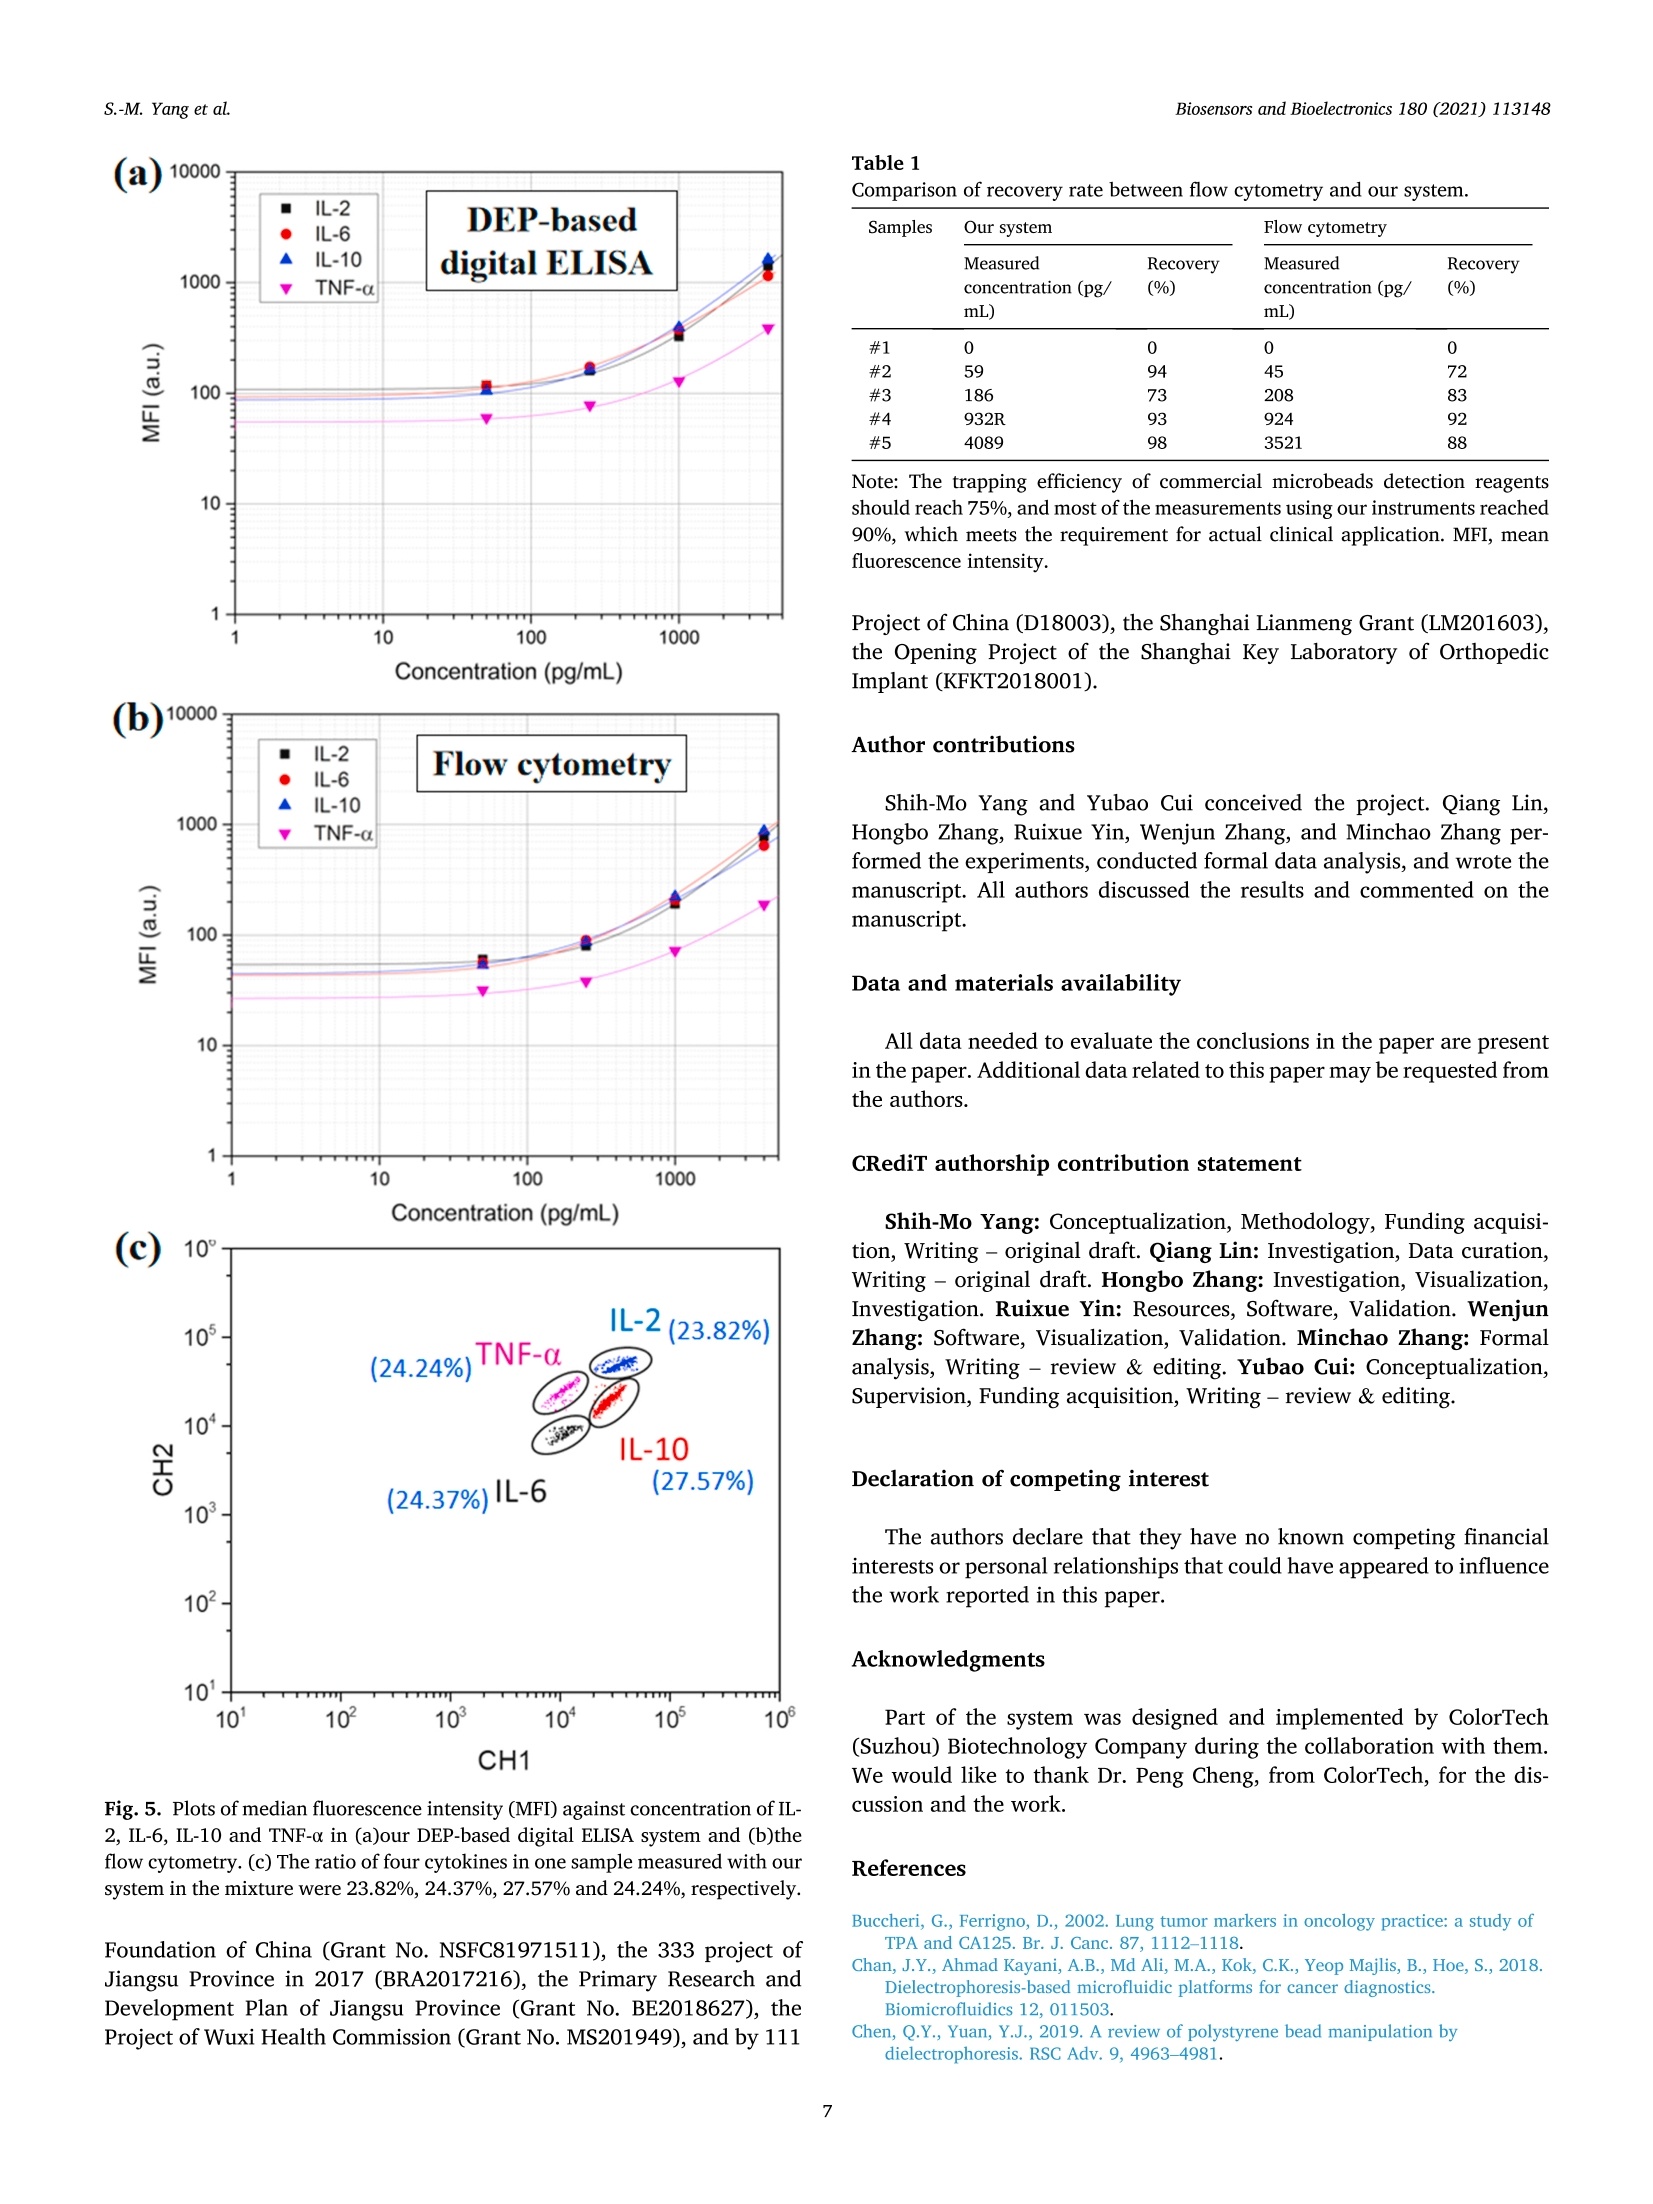
Biosensors and Bioelectronics 180 (2021)113148 Contents lists available at ScienceDirect Biosensors and Bioelectronics journal homepage: http://www.elsevier.com/locate/bios Dielectrophoresis assisted high-throughput detection system formultiplexed immunoassays Shih-Mo Yang a,**, Qiang Lin , Hongbo Zhang , Ruixue Yin, Wenjun Zhang, Minchao Zhang , Yubao Cui Biomedical Science and Technology Research Center, School of Mechatronic Engineering and Automation, Shanghai University, Shanghai, China 'School of Mechanical and Power Engineering, East China University of Science and Technology, Shanghai, China“Division of Biomedical Engineering, University of Saskatchewan, Saskatoon, Canada“Colortech (Suzhou) Biotechnology, Suzhou, China° Department of Clinical Laboratory, Wuxi People’s Hospital Affiliated to Nanjing Medical University, Wuxi, China ARTICLEINFO ABSTRACT Keywords:MultiplexedImmunoassayDielelctrophoresisHigh-throughputMicrofluidic Digital ELISA is introduced as a novel platform with unique advantages for detecting multiple kinds of single-molecule in the sample. How to improve the sensitivity of detection is the direction of current relatedresearch. Here, we report an immunoassay method that applied electrokinetic effects to isolate the individualencoded beads and confine in micro-wells to improve the efficiency of cytokines detection simultaneously. Themicrofluidic design provided a non-uniform electric field to induce dielectrophoresis (DEP) force and tomanipulate the beads. Two wavelengths of excitation light excited the encoded beads for simultaneous detectionof reporters. The light was confined to the bottom slide via the principle of total internal reflection. Finally, theconcentration of captured cytokines was obtained by picking up each bead from the image and then integratingthe intensity of fluorescent light emitted from the reporters. The results demonstrated that the fill percentage ofencoded beads was raised from 10-20% to 60-80% via DEP effect. By comparing the fluorescence color of theparticle, itself and its surface, the concentration of four target cytokines, IL-2, IL-6, IL-10 and TNF-a, werecalculated to the pg/ml level. The spike and recovery experiments verified the efficiency, more than 70% of thetarget molecules were captured. The reliability of our method was verified by flow cytometry as well. Inconclusion, we expect the application of DEP can increase the sensitivity of digital ELISA for multiple rapiddetection. 1. Introduction Multiplexed immunoassay has been widely used in clinical di-agnostics, therapeutics, drug discovery and clinical proteomic research(Panicker et al., 2015; Deraney et al., 2016; Lee et al., 2018; Kaminskaet al., 2017). The awareness of the multi-factorial nature of the diseasesrequires the combination of multiple biomarkers for diseases diagnosis.For example, to diagnose lung cancer, the doctor would detect whetherthe tumor markers of nerve specific enolase (NSE), squamous cell car-cinoma antigen (SCCA), tissue peptide antigen (TPA), carcinoembryonicantigen (CEA), and carbohydrate antigen 125 (CA125) exist in serum atthe same time. (Hecht, 2002; Yang et al., 2018,2019; Tanget al., 2017;Buccheri and Ferrigno, 2002; Chen et al., 2018). Seven cytokines (TNF-0, IFN-0, INF-Y, IL-1o, IL-1B, IL-6 and IL-10) are utilized forscreening anti-inflammatory compounds for drug discovery (Murphy,2001; Zhang et al., 2016; Motz et al., 2017). Twenty-seven cytokines,chemokines and growth factors, such as CA19-9, IL-1b, IL-1, IL-6, IL-8,MCP-1 et al., are selected as biomarkers to discriminate pancreaticcancer from benign pancreatic disease (Shaw et al., 2014; Razidlo et al.,2018; Duijneveldt et al., 2010; Chen et al., 2012). These biomarkersrequired to be detected simultaneously, calls for the time-saving andcost-effective analysis strategy-multiplexed immunoassay. Planar microarrays and bead-based arrays are two major types ofmultiplexed detection based on ELISA (enzyme-linked immunosorbentassay) (Michal (2010); Rao et al., 2004; Ling et al., 2007; Vafajoo et al.,2018). Although the former provides high-density screening on the ( * Corresponding author. ) **Corresponding author. E-mail addresses: smyang@shu.edu.cn (S.-M. Yang),ybcui1975@hotmail.com (Y. Cui). ( https: // doi.org / 10 . 1016/j.bios.202 1 . 1 13148 ) ( Received 22 December 2020; Received in revised form 2 March 20 2 1; Ac c epted 3 March 202 1 ) ( Available online 5 March 2021 ) ( 0956-5663/C 2 021 T he Author(s). Published by Elsevier B.V. T his i s an open access article under the CCBY-NC-ND l icense ( h t t p :/ / c r e a ti vec om mons. o rg /li cens es /b y - n c - nd / 4 . 0 / ) . ) Although digital ELISA can measure more kinds of proteins, it needshigher sensitivity for clinical applications. For example, the quantity ofsome cytokines (e.g. IL-17A) in the blood is quite rare and not 100%detectable, which makes it difficult to monitor and quantify the in-flammatory response (Nesmond et al., 2019; Ocheretina et al., 2013).The concentration of some proteins is too low to detect them in complexsamples such as stool and cerebrospinal fluid (Park and Yossifon, 2019).The dilution steps in sample processing would also have a negativeimpact on the detection (Kan et al., 2020). Therefore, a highly sensitivedigital ELISA is needed. Due to the detection requirements of digital ELISA, maintaining asuitable concentration of microspheres is critical to measurement reli-ability. The number of microspheres that capture the target moleculemust be large enough, and there must be enough positive chamber to bedetected. The volume of the chamber for capturing the microspheresmust be small. If the volume of the chamber is too large, the fluorophoreproduced by such a small amount of enzyme cannot be detected, and thesignal is too weak as well. It’s best to have only one bead in a chamber(Haomin and Yu, 2021). Some studies had reported the use of magnets to trap magnetic mi-crospheres in the chambers to increase the efficiency of sensitivity(Witters et al., 2013; Decrop et al., 2017; Elena et al., 2018; Shafaghet al., 2019; Kan et al., 2020; Kim et al., 2012). These all point out thatthe reliable way is to have only one microsphere in each chamber.Compared to magnetic force, manipulating particles with electric forceis another common method in microfluidics. Dielectrophoresis (DEP) isa phenomenon when the beads are polarized in a non-uniform electricfield, they are driven by the external electric field. The advantage of DEPlies in the manipulation of microparticles and it is easy to be integratedwith other such as optical system, droplet formation, and drug screening(Dalili et al., 2018). To date, our laboratory has integrated DEP andmicrofluidic for a range of applications, such as dynamic manipulationand patterning of cells (Yang et al., 2010, 2013), air bubble (Yang et al.,2011a,b), magnetic beads (Yang et al., 2011a,b), and nanomedicinescreening (Yang et al., 2015). Recently, DEP is also applied for particlemanipulation in bead-based ELISA to increase the sensitivity forNeutrophil Gelatinase-Associated Lipocalin (NGAL), Cystatin C, denguevirus (DENV), and Fluorescein-tagged avidin D detection (Thiriet et al.,2020; Park et al., 2019; Iswardy et al., 2017). However, the state of microbeads in these publications were mobile,rather than fixed in an array pattern. Here, we propose that the DEPmethod is able to assist the encoded microbeads locate in the micro-wells array for multiplexed immunoassays. Compared with the currentmethods, DEP force provides an active method to trap beads into micro-wells arrays and pushed out automatically by the DEP control of positiveand negative conditions. We used this DEP-based system and encodedbeads to perform multiplexed detection of four cytokines. Finally, thereliability was verified by comparing the performance of ELISA kit onflow cytometry. 2.1. System setup Our system was designed to achieve high-throughput, high-sensi-tivity, multiplexed immunoassay on a limited sample volume. Itincluded four parts: beads manipulation system, optical imaging system,microfluidic flow chip, and automatic control of liquid sample injection,Fig.1(a). The high-throughput of this design can be estimated from twoaspects.Firstly, in terms of measuring the number of molecules, encodedmicrobeads can be made by mixing two fluorescent dyes in sevendifferent concentrations. In theory, 7 ×7 indicators can be measured.Here, we measure four cytokines. In other words, the types of mea-surement molecules can be expanded in the future. Secondly, from themeasurement time (not including the incubation time), since the liquidinjection and photographing are all automatically programmed, thedetection time for each sample is only 2.5 min. We adopt negative DEPto automatically push the beads out the micro-wells. Therefore, the chipwas reusable (>10x) and the results are high-throughput. The beads manipulation system operated on the basis of the dielec-trophoretic (DEP) phenomenon. While applying AC voltage and fre-quency, the system trapped the beads into the micro-wells and pushedthem out of the cavities in a rapid fashion. By using micro-wells asdielectric contrast materials, the system generated high electric fieldchanges over the space and thus generated high forces on themicrobeads. Light at 532 nm and 638 nm wavelengths was integrated toexcite the fluorescent-encoded beads and the fluorescent protein tag thatlabeled the immuno-sandwiches (reporter). The microfluidic structureof SU8 as the substrate was also used to provide the positioning of thebeads. The use of automated systems to control the injection anddischarge of liquids reduced sample contamination. The collaborativework of these four models quickly completed high-precision cytokinedetection. 2.2. Chip fabrication and design Instead of using complicated electrode structures, the SU8 structurewas applied to generate the electric field in a large area. The top elec-trode was ITO glass. An array of the micro-well structure was fabricatedon the surface of the bottom gold-based electrode. Fig.1(b) shows theSEM images of micro-wells filled with beads. The electric field wasdistributed around the sharp edge of the micro-wells, leading to a highmagnitude of DEP force that was applied to the beads. The high forceguaranteed the rapid response of the beads after they flowed in the chip. The microfluidic chip was composed of an electrode and micro-wells.The standard Micro-Electro-Mechanical Systems (MEMS) fabricationprocess was applied to fabricate the micro-wells on the gold-coatedsubstrate. A glass slide was cleaned in Piranha solution (3: 2 mixtureof 98% H2SO4: 30% H2O2) for 40 min, rinsed with deionized water, andblown dry with filtered nitrogen. Titanium (4.5 nm) and gold (11 nm)films were deposited using E-beam evaporation and coated on the wafersurface. The gold-coated wafer was then cleaned by air plasma on ahigh-power setting for 1 min. SU-8 3005 resist, was used to constructmicro-wells of desired depth and size on the gold-coated cover glass. Thediameter of microbeads we used here is 3.2 um. 2.3. Cycling assay procedure Theassay consists of five steps: beads loading, beads trapping with p-DEP force, washing and imaging, beads repelling with n-DEP force, andbuffer washing. First, the encoded beads were flushed into the micro-fluidic chip with micro pneumatic pump automatically, Fig. 1(c) (i).Second, the AC conditions of 10 V and 10 kHz were applied between thetop ITO plate and bottom gold-coated slide, Fig. 1(c) (ii). Third, toreduce the interference of background noise,the beads that had not beentrapped by the DEP force would be washed away by the pneumatic Fig. 1. (a) Schematic of the system for fast and precise detection of different cytokines. The encoded beads were trapped via DEP force toward the cavities of thelower structure. Two emission wavelengths of light were applied to excite them and to identify the concentration of cytokines. (b) Scanning electron microscopy ofthe micro-wells array. The SU8 structure with gray color was fabricated on the gold-coated surface. Scale bar is 100 um. (c) The procedure for bead detection. (i)Microbeads were injected into the chip. (ii) Beads were trapped into the cavities under the condition of p-DEP force. Two excitation wavelengths of light were used toexcite encoded microbeads and reporters. (iii) The n-DEP force was applied to pull the beads out of the well and washed. (For interpretation of the references to colorin this figure legend, the reader is referred to the Web version of this article.) pump before the image was taken. The beads trapped in the micro-wellswere illuminated by the light at 532 nm and 638 nm wavelength. Forth,after the images were taken, the beads were repelled from the cavity bythe n-DEP force with conditions of 10 V at 1 MHz (Fig. 1(c) (iii)). Finally,the washing buffer was injected to flush all beads from the chip. Therecorded images were then analyzed. The entire process could be ach-ieved within 2.5 min. Next, the above steps were repeated again, so thata lot of fluorescence data can be obtained in a short time for highthroughput detection. 2.4. Electrokinetic method Among the miniaturized chip-based methods, DEP force was appliedto manipulate the beads due to the unique bidirectional force. The DEPforce was generated when the beads were exposed to the non-uniformelectric field. The frequency of the external field governed the movingdirection of the beads. The magnitude of the force was proportional tothe volume of the beads and the non-uniformity of the field. DEP phe-nomenon has two forms. The phenomenon of beads moving in the di-rection of the increase of electric field intensity is called positive-DEPphenomenon, and the other is called negative-DEP phenomenon. Theapproximate model DEP force of a bead in non-uniform electric field isshown in the formula: where r is the radius of the bead, em is the permittivity of the solution, Re[fcM(ω)]is the real part of the Clausius-Mossotti factor fcM(ω). fcM(ω)determines the force direction of beads, which is the representation ofDEP. The expression is shown as follows: where ω is the angular frequency of alternating current, op and om is theconductivity of the bead and solution, ep and em is the permittivity of thebead and solution. Combined with the properties of the bead and solu-tion, we can adjust the positive and negative of Re[fcM(ω)] by adjusting ω. The DEP force is proportional to VE, the faster the field intensity changes, the greater the DEP force on the bead (Chan et al., 2018).Fluorescence coding beads used in our study mainly consist of poly-methyl methacrylate (PMMA), magnetic substances and trace dyes.PMMA is a kind of high transparency,low price of polymer. After addinga certain amount of magnetic material, the conductivity op andpermittivity e, of the bead are 3×10⁻⁴S/m and 8eo. The conductivityom and permittivity constant Em of the buffer used in this paper are 5 x10⁻⁵ /m and 80o. The so is the vacuum permittivity. Due to the permittivity relationship between PMMA particles and theenvironmental liquid, when the function generator provides a frequencyof about kHz, the beads would be trapped into the micro-wells by theforce of positive DEP. When the frequency is increased to about MHz, thebeads would be pushed out the cavities by the force of negative DEP(Cheng et al., 2011; Zhang et al., 2019; Yang, 2012; Jen and Chen,2009). The article reported the CM factor versus frequency plot whichillustrated the different action of DEP via frequency adjusting (Chen andYuan, 2019). The relationship between the relative DEP response andfrequency simulated using Origin software was shown in Fig. 2(a). Wealso used Comsol software to simulate the electric field distribution inthe chip, Fig. 2(b). The simulation diagram showed that the strongest (c) Exciting Nomal Suspend Attach Glass SU8 Encoded bead 638 nm emission light for beads Fig. 2. (a) A CM factor versus frequency plot. DEP response modeled for amagnetic encoded bead. (b) The electric field distribution inside the chip. Thereare relatively stronger electric field near the edge of SU8 microwell. The arrowin the figure indicated the moving direction of the bead when it was subjectedto positive or negative DEP. (c)Schematic of exciting specific beads with totalreflection effect from the bottom glass slide. Only the beads touching the bot-tom surface were excited and imaged at the 638 nm light. electric field was at the edge of the microwell, and it also caused theparticles to be attracted by the positive-DEP force to the microwells. Under DEP theory, the motion direction was adjusted via the exter-nally applied AC frequency. If we want to locate the particles in themicro-wells, we use positive-DEP condition and the external frequencyis lower than 100 kHz. If we want to replace the measured beads, we usenegative-DEP, which the applied frequency is higher than 1 MHz, topush the particles out of the cavities and flush them out. This processcould be cycled multiple times to enhance the throughput of detection. 2.5. Materials obtained from Abcam (Cambridge, MA, USA). Detection antibodies werebiotinylated using a commercial biotinylation kit, which was purchasedfrom Thermo Fischer (CA, USA). SU8-3005 was purchased fromMicrochem (Westborough, MA, USA). ITO Glass was evaporated atSuzhou Institute of Nano-Tech and Nano-Bionics, Chinese Academy ofSciences. The fluorescently encoded magnetic beads and the detectionsystem were purchased from ColorTech Biotechology (Suzhou, China). 2.6. Forward scattering optical system Light emissions at 532 nm and 638 nm wavelengths were combinedto excite encoded beads and reporters simultaneously. Different mixingratios of organic fluorescent dye molecules were included inside thebeads so that one could read the code of the beads. Light emitted at 638nm wavelength propagating inside the glass slide was used to make thefluorescent-encoded beads generate a two-color barcode. The secondexcitation laser at 532 nm wavelength illuminates the reporters. Theemission light from the beads was finally collected using a large imagingarea optical system. The combination of a low magnification objectiveand a standard Charge Coupled Devices, CCD, camera completed thetask. In order to excite the encoded microbeads selectively and reduce thenoise from background, the application of total internal reflection wasintegrated into our optical system, Fig. 2(c) (Yokokawa et al., 2012). Thelight with a wavelength of 638 nm illuminated the bottom glass slidefrom the side. The light reflected in the upper and lower planes andstored in the glass slide was based on the total reflection principle. Onlywhen the beads were attracted into the cavity and contacted the bottom,light was able to refract from glass substrate to the beads through thecontact point and to excite the beads to produce fluorescence. This keymethod reduced measurement interference and improved the accuracyof data analysis. 2.7. Formation of immunocomplexes Firstly the fluorescently encoded beads were washed three timeswith 50 mM MES (2-(Nmorpholino)ethanesulfonic acid; pH 5.6 buffer).Then the beads were activated for 30 min with freshly prepared 1-ethyl-3-(3-dimethylaminopropyl)carbodiimide (EDC) and N-hydrox-ysulfosuccinimide (sulfo-NHS) solution at room temperature. Afteractivation and a wash with cold MES, the activated beads were conju-gated with 0.3 mg/mL of antibody for 2 h at room temperature. Then thebeads were washed with PBS plus 1% Tween 20 once. After that, thebeads were blocked with PBS plus 1% BSA for 30 min. Finally, the beadswere washed with 50 mM Tris once and stored in 50 mM Tris, pH 8.0 at4°C. Serially diluted proteins were firstly added to a tube containingantibody-coatedbeads,biotinylateddetection antibodies:sandStreptavidin-PE. After incubated for 30 min at room temperature, thebeads were washed with PBS plus 1% Tween 20 for three times. Finally,the beads were dispersed in 20 uL PBS. 2.8. Data analysis A bead-based immunoassay typically involves three steps. First, theantibody-coated beads specifically capture the paired proteins from thesample. Then the labeled detection antibodies bind to the capturedproteins resulting in immunocomplexes. Finally, one measures the sig-nals outputting from the reporters. Fluorescence macromolecules wereused as reporters to label the detection antibodies. Our system directlymeasured the fluorescence intensity of the labeled antibodies on eachbead to quantify the concentration of the immunocomplexes. Data were analyzed using an in-house software associated with oursystem. In principle, an image went through a thresholding process togenerate a binary image so that every single bead could be identified.The outline of every single bead was dilated for three pixels on each side of the beads and designated as the background outline. The area be-tween the two outlines was flattened and fitted to calculate the totalbackground. The identified beads were fitted to Gaussian distributionand the total intensity of each bead was then calculated by integratingthe two-dimensional Gaussian distribution and finally subtracted thatfrom the total background. After plotting all the intensities on the figureof different fluorescent colors, the multiplexed beads were recognizedand the intensity of reporters finally added up for each group of theencoded beads, which corresponding to the concentration of proteins. The known concentrations of specific protein were used as standardsamples to calibrate the relationship between the concentration and thefluorescence intensity. As long as the fluorescence intensity was imagedand measured, the corresponding protein concentration of an unknownsample could be obtained from the calibration curve. 3. Results and discussion 3.1. Beads assembly results within the micro-wells In theory, more beads are trapped in the wells can lead highernumber of beads that can be counted. That gives higher precision due tothe lower Poisson noise. Here, DEP force can significantly improve theefficiency of beads loading. A variety of combinations between the flowspeed and the DEP force were conducted to explore the optimizedthroughput of the beads assembly system. The forces acting on themicrobeads in the microfluidic include upward buoyancy, downwardgravity, the driving force of liquid pumping, and the dielectrophoreticforce. When the DEP force is turned on, we stop the pumping of theliquid, so the driving force of the water flow is zero. Buoyancy andgravity are almost negligible under the action of DEP force. Therefore,the effect of DEP is mainly considered in the experiment. The optimumtrapping efficiency was achieved by applying 10 V AC peak-to-peakvoltage at 10 kHz frequency at a pulsed-like shape of output pattern.Under these conditions, beads were subjected to the force of p-DEP anddriven into the micro-wells. The structure of SU8 locate the highestelectric field gradient in each micro-well. The concentration of the encoded bead stock solution is 0.5 pg/mL.The volume of 10 ul was taken for each test, and the number of beadsloaded was approximately 250,000. There are 260,000 micro-wellsfabricated on the surface of SU8 structure. When there is no electricfield applied, the fill percentage is about 10-20%, even after static for 3min, Fig. 3(a). In this case, gravity is the main force to drive the beads.While with DEP forces, the fill percentage can reach 60-80% withinseconds, Fig. 3(b). After obtaining the standard curve and the averagevalue of the background signal through the gradient experiment, the limit of detection (LOD) can be calculated to be 2.34 pg/mL. To further reduce the value of LOD and to increase the sensitivity, wesummarized some special points that should be paid attention to in theexperiment:(1) The fill percentage would affect the results. If the num-ber of beads is large at the beginning, the fill percentage will increase.(2) Different types of cytokines would interfere with each other whendetecting a mixing sample. (3) The optimization of experimentalschemes and operating procedures are needed. Since few samples wereused during testing, the loss of reagents in the operation process wouldalso affect the results; (4) Experimental reagents and beads should bestored in a suitable environment for keeping high quality. (5) Fluores-cent photos of beads should have good resolution. The background noiseshould be minimized;(6) Optimization of image processing algorithm;(7) The method used to fit the standard curve from the analysis data.These operations would affect the sensitivity of the measurement results. 3.2. Multi-cytokine detection Four sets of encoded beads were used in this study to perform the 4-plex cytokine detection. The coded beads used here were synthesized bytrapping two types of dyes with different emission spectra and differentconcentrations (thus different intensities) in the beads. The beads wereexcited by 638 nm light, and the emission light signals were recorded viatwo types of filter (CH1 is at 670 nm and CH2 is at 720 nm). Whendifferent types of beads are mixed, the intensities of the emitted fluo-rescence at these two wavelengths allow us to decode the beads. When encountering excitation UV light at 638 nm, the beads emittedcorrespondingcolor shades. Fig. 4 shows the field of vision of a highermagnification microscope. The number of different kinds of beads wascalculated by covering different colors, analyzing different color shadesand the positions of each dot. The coded beads used in the experimentwere synthesized by embedding two types of dyes with different con-centrations. Therefore, the beads had four different concentrationcombinations. For beads excited by 638 nm light, we took the firstpicture with Filter_1(Channel 1, CH 1) at 670 nm wavelength, thenchanged to Filter_2(Channel 2, CH 2) at 720 nm wavelength to take thesecond picture. Next, to merge these two photos together is able todeterminate which species the beads belong to, Fig. 4(a)-(c). Finally, bycomparing the fluorescence intensity on the bead surface with thestandard relationship curve, the concentration of the target cytokinebanded by the various encoded beads can be obtained, Fig. 4(d). Here, four types of coded beads are coated with four types of captureantibodies, which are anti-IL-2, anti-IL-6, anti-IL-10 and anti TNF-o.Thus, when they are mixed, each of them can capture specific cytokinesin the sample. Fig.5(a) and Fig.5(b) shows 16 sets of measurement data Fig. 3. Beads trapping of DEP effect.Fluorescence images showing the representative fill percentage of beads without (a) and with (b) DEP. These pictures illustratethat the DEP effect provides active force to the encoded beads and improve the efficiency of particles entering micro-wells. Scale bar = 200 um. for four cytokines on our system and flow cytometry. Two axes show twofluorescent colors that were embedded in the beads. On one axis, twodifferent concentrations of dye molecules, which corresponded to twodifferent groups, were recognized, so that four groups of beads could bemapped on the figure. Fig. 5(c) shows the decoding result of a mixture ofthese four types of beads. Every bead is designed to show differentfluorescent intensities at CH1 and CH2. The ratios of the beads coatedwith IL-2, IL-6, IL-10 and TNF-o in the mixture were 23.82%, 24.37%,27.57% and 24.24%, respectively. These four types of beads with capture antibodies immobilized onthem are incubated with a sample. Immunoassay sandwiches wereformed by capturing corresponding proteins, detection antibodies andthe reporters. The beads were then loaded into the wells and imageswere taken with different filters. To analyze the data, the four types ofbeads were firstly decoded by image analysis, then the fluorescenceintensity of the reporters recorded via Filter 3 of each beads werecalculated and the median fluorescence intensity(MFI) were deter-mined. Finally, the calibration curves of MFI against cytokine concen-trations (from 0 pg/mL to 4000 pg/mL) were generated with four-parameter logistical curve fit, Fig.5(a)(b). 3.3. Validation against flow cytometry We used flow cytometry to obtain the concentration of the IL-2, IL-6,IL-10 and TNF-o sample, which were compared with the data obtainedby our method. The same standard samples, which were applied in oursystem for the multiplex detection, were used to incubate immunoassaysandwiches with flow cytometry. Two calibration curves are shown inFig.5(a)(b). Spike-and-recovery experiments were performed with bothour system and flow cytometry. First, the known amount of IL-2 wasspiked into the blank matrix sample. Second, the MFI of the testedsample was substituted and compared with the calibration curve toobtain the measured concentration of the spiked sample. Third, the recovery was calculated by comparing the measured concentration andthe expected concentration. In the measurement results, the recoverywas between 72% and 98%, Table 1. This means that most of the targetcytokines can be captured, and similar results can be obtained with ourmethod and the flow cytometry. Besides, the different concentrations ofsamples were measured by two different methods, and the CV value wasapproximately within 10%. The results between these two methods arecomparable. 4. Conclusions We proposed the method of using DEP force to trap the encodedmicrobeads in arrays to be detected automatically. The use of DEP forceimproves the efficiency of beads entering the microwells. The applica-tion of coded microbeads validates the idea of measuring multiple cy-tokines simultaneously. The side-illuminated total reflection technologywas also integrated into the excitation process of fluorescent beads andeffectively reduced the interference of background noise on fluores-cence. In terms of current screening requirements, there is still a greatneed to improve the sensitivity of digital ELISA, and there are technicalgaps that need to be overcome from research to clinical. Here, we usedthe electric method of DEP to replace the magnetic force to trap themicrobeads. Magnetically encoded beads were used to replace tradi-tional magnetic beads. The method of total reflection improved theresolution of fluorescent images as well. The combination of thesetechnologies achieved the simultaneous screening of four cytokines in asingle test. We anticipate that this integration enables us to meet thehigh throughput need for rapid diagnosis of multiple small molecules,such as in cancer or viral infections. Funding This study)Vwassupported by the National Natural Science CH1 Fig.5. Plots of median fluorescence intensity (MFI) against concentration of IL-2, IL-6, IL-10 and TNF-a in (a)our DEP-based digital ELISA system and (b)theflow cytometry.(c) The ratio of four cytokines in one sample measured with oursystem in the mixture were 23.82%, 24.37%,27.57% and 24.24%, respectively. Foundation of China (Grant No. NSFC81971511), the 333 project ofJiangsu Province in 2017 (BRA2017216), the Primary Research andDevelopment Plan of Jiangsu Province (Grant No. BE2018627), theProject of Wuxi Health Commission (Grant No. MS201949), and by 111 Table 1Comparison of recovery rate between flow cytometry and our system. Samples Our system Flow cytometry Measured Recovery Measured Recovery concentration (pg/ (%) concentration (pg/ (%) mL) mL) 0 0 59 186 208 932R 924 4089 3521 Note: The trapping efficiency of commercial microbeads detection reagentsshould reach 75%, and most of the measurements using our instruments reached90%, which meets the requirement for actual clinical application. MFI, meanfluorescence intensity. Project of China (D18003), the Shanghai Lianmeng Grant (LM201603),the Opening Project of the Shanghai Key Laboratory of OrthopedicImplant (KFKT2018001). Author contributions Shih-Mo Yang and Yubao Cui conceived the project. Qiang Lin,Hongbo Zhang, Ruixue Yin, Wenjun Zhang, and Minchao Zhang per-formed the experiments, conducted formal data analysis, and wrote themanuscript. All authors discussed the results and commented on themanuscript. Data and materials availability All data needed to evaluate the conclusions in the paper are presentin the paper. Additional data related to this paper may be requested fromthe authors. CRediT authorship contribution statement Shih-Mo Yang: Conceptualization, Methodology, Funding acquisi-tion, Writing-original draft. Qiang Lin: Investigation, Data curation,Writing- original draft. Hongbo Zhang: Investigation, Visualization,Investigation. Ruixue Yin: Resources, Software, Validation. WenjunZhang: Software, Visualization, Validation. Minchao Zhang: Formalanalysis, Writing - review & editing. Yubao Cui: Conceptualization,Supervision, Funding acquisition, Writing-review & editing. Declaration of competing interest The authors declare that they have no known competing financialinterests or personal relationships that could have appeared to influencethe work reported in this paper. Acknowledgments Part of the system was designed and implemented by ColorTech(Suzhou) Biotechnology Company during the collaboration with them.We would like to thank Dr. Peng Cheng, from ColorTech, for the dis-cussion and the work. References Cheng, P., Barrett, M.J., Oliver, P.M., Cetin, D., Vezenov, D., 2011. Dielectrophoretictweezers as a platform for molecular force spectroscopy in a highly parallel format.Lab Chip 11, 4248-4259. Chen, Y., Shi,M., Yu, G.Z., Qin, X.R., Jin,G., Chen, P., 2012. Interleukin-8,a promisingpredictor for prognosis of pancreatic cancer. World J. Gastroenterol. 18, 1123-1129. Chen, Z.Q., Huang, L.S., Zhu, B., 2018. Assessment of seven clinical tumor markers indiagnosis of non-small-cell lung cancer. Dis. Markers 1-7. Dalili, A.,Samiei, E., Hoorfar, M., 2018. A review of sorting, separation and isolation ofcells and microbeads for biomedical applications: microfluidic approaches. Analyst144,87-113. Decrop,D., Pardon, G., Brancato,L., 2017. Single-step imprinting of femtoliter microwellarrays allows digital bioassays with attomolar limit of detection. ACS Appl. Mater.Interfaces 9, 10418-10426. Duijneveldt, G.V., Griffin, M.D.W., Putoczki, T.L., 2010. Emerging roles for the IL-6family of cytokines in pancreatic cancer. Clin. Sci. (Lond.) 134,2091-2115. Deraney, R.N., Mace, C.R., Rolland, J.P., Schonhorn, J.E., 2016. Multiplexed, patterned- paper immunoassay for detection of malaria and dengue fever. Anal. Chem. 88,6161-6165. Elena, P.R., Decrop, D., Ven, K.,Tripodi, T., 2018. Digital ELISA for the quantification ofattomolar concentrations of Alzheimer’s disease biomarker protein Tau in biologicalsamples. Anal. Chim. Acta 1015, 74-81. Haomin, L., Yu, L., 2021. A critical review: recent advances in “digital"biomoleculedetection with single copy sensitivity. Biosens. Bioelectron. 177, 112901. Hecht, S.S., 2002. Cigarette smoking and lung cancer: chemical mechanisms and approaches to prevention. Lancet Oncol. 3, 461-469. Iswardy, E., Tsai, T.C., Cheng, I.F., 2017. A bead-based immunofluorescence-assay on amicrofluidic dielectrophoresis platform for rapid dengue virus detection. Biosens.Bioelectron.95, 174-180. Jen, C.P., Chen, T.W., 2009. Trapping of cells by insulator-based dielectrophoresis usingopen-top microstructures. Microsyst. Technol. 15,1141-1148. Kaminska, A., Winkler, K., Kowalska, A., Witkowska, E.,Szymborski, T., Janeczek, A.,2017. SERS-based immunoassay in a microfluidic system for the multiplexedrecognition of interleukins from blood plasma: towards picogram detection. Sci. Rep.7,10656. ( K a n , C. W ., T o bos, C . I . , Ri s sin , D .M. , Wie n er , A .D . , D u f fy , D.C ., 2020. D ig i tal enzyme- l ink e d i mmunosor be n t a s s ays wi t h s ub -at t omo lar d e te c t io n l i m its b a se d o n l o w n umb e rs o f capture bea d s combined w i th high effic i en c y bea d analysis . Lab Chip 20 , 2 122 -2 1 3 5 . ) ( K im, S.H., Iw ai, S . , A raki, S. , 201 2 . L arge- s c a l e f e m tol i ter d roplet a rr ay fo r d igita l ) counting of single biomolecules. Lab Chip 12, 4986-4991. Ling,M.M., Ricks, C., Lea, P., 2007. Multiplexing molecular diagnostics andimmunoassays using emerging microarray technologies. Expert Rev. Mol. Diagn 7,87-98. ( L e e , H . J . , Roh , Y . H . , K i m , H . U . , K i m , S.M ., Bong , K.W . , 20 1 8 . M u l tiple x ed immuno a ssay u si n g p o s t- s y n thesi s func t iona l i ze d h y drogel m icropar t icl e s . L a b C h ip 1 9 , 1 1 1- 11 9 . ) ( M u r p h y , K . P . , 2001. A rray-ba s ed E L I SAs f o r hig h - throug h put anal y s i s o f huma n cy tokines. B i o techniq u es 3 1 , 1 86. ) Michal, V., 2010.Multiplex immunoassays: chips and beads. Ejifcc 20, 162-165. ( M o tz, K . , Samad, . , Y in, L .X . , Mur p hy , M .K., D u vv u ri, M ., D ing, D . C . , 2 017. I nterferon -yt reatmen t o f h u man l a r yngo t rach e al s tenosi s -deriv ed fibroblasts . J A MA Ot o lary n g o l. He ad N e ck S ur g. 1 4 3, 1134 - 1 14 0 . ) ( N e smond , S., M u llerv, C. , N ao u r , R.L . , V i g uier , M . , J an , S. L . , 2 0 1 9 . C h a r acter is t i c p a tte r n o f IL - 1 7RA, I L - 1 7R B , an d I L -17R C in monocyte s / macroph a g e s and mast cells fr o m p a t ie nt s with bullous p emp h igo i d. F r o nt. I m munol. 1 0 , 2 1 07. ) ( O ch e re t i n a, O. , Me r vei l le , Y . M . , M ab o u, M . M ., Escu y er , V. E . , D u n bar, S . A . , J o hn s o n, W. D ., 2013 . U s e o f l u m ine x Ma g P l e x m a g n et ic mi c r o sp h ere s f or h i g h -t h r ou g hput s p ol ig o typing o f M ycobacte r i u m tuberculosis i s o l a t e s i n p o rt-a u - pr in c e , H a iti. J . C l i n . Microbiol . 5 1 , 2 2 32 - 22 3 7. ) Park, S., Yossifon, G., 2019. Combining dielectrophoresis and concentration polarization-based preconcentration to enhance bead-based immunoassay sensitivity. Nanoscale11,9436-9443. ( P anicker, G . , R a j b ha n d a r i , I. , G ur b axani, B . M . , Q uerec, T . D. , U n g e r,E . R . , 2 015. D ev e l o pment and ev a lua t i on of multip l e xe d i m m un o a s say f o r d et e c t i on o f a n t i b od ie s t o HPV v acc i ne ty pes . J . Immuno l . Methods 4 1 7 , 1 0 7 - 1 1 4. ) Rao, R.S., Visuri, S.R., McBride, M.T., Albala, J.S., Matthews, D.L., Coleman, M.A., 2004.Comparison of multiplexed techniques for detection of bacterial and viral proteins.J. Proteome Res.3, 736-742. Rissin, D.M., Kan, C.W., Campbell, T.G., 2010. Single-molecule enzyme-linked immunosorbent assay detects serum proteins at subfemtomolar concentrations. NatBiotechnol. 28, 595-599. Rissin, D.M., Kan, C.W., Song, L., Rivnak, A.J., Fishburn,M.W., Shao, Q., Fournier, D.R.,2013. Multiplexed single molecule immunoassays. Lab Chip 15, 2902-2911. Rissin, D.M., Fournier, D.R., Piech, T., Kan, C.W., Campbell, T.G., 2011. Simultaneousdetection of single molecules and singulated ensembles of molecules enablesimmunoassays with broad dynamic range. Anal. Chem. 83, 2279-2285. Razidlo, G.L., Burton, K.M., McNiven, M.A., 2018. Interleukin-6 promotes pancreaticcancer cell migration by rapidly activating the small GTPase CDC42.J. Biol. Chem.293,11143-11153. Shafagh, R.Z., Decrop, D., Ven, K., Vanderbeke, A., 2019. SI for reaction injection molding of hydrophilic in hydrophobic femtolitre well Arrays. Microsyst. Nanoeng.5,25. Shaw, V.E., Lanenull, B., Jenkinsonnull, C., Coxnull,T., Greenhalfnull, W., Halloran, C.M....., 2014. Serum cytokine biomarker panels for discriminating pancreatic cancerfrom benign pancreatic disease. Mol. Canc. 13, 114. Tang, Z.M., Ling, Z.G., Wang, C.M., Wu, Y.B., Kong, J.L., 2017. Serum tumor-associatedautoantibodies as diagnostic biomarkers for lung cancer: a systematic review andmeta-analysis. PloS One 12, 0182117. Thiriet, P.E., Medagoda, D., Porro, G., 2020. Rapid multianalyte microfluidic homogeneous immunoassay on electrokinetically driven beads. Biosensors 10, 212. Vafajoo, A., Vafajoo, A., Rostami, A., Salarian, R., Rabiee, M., Rabieeet, N., 2018. Earlydiagnosis of disease using microbead array technology: a review. Anal. Chim. Acta1032,1-17. Wilson, R., Cossins, A.R., Spiller, D.G., 2006. Encoded Microcarriers For High- Throughput Multiplexed Detection. Angew Chem Intl Ed Engl. 45, 6104 6117. Witters, D., Knez, K., Ceyssens, F., 2013. Digital microfluidics-enabled single-moleculedetection by printing and sealing single magnetic beads in femtoliter droplets. LabChip 13,2047-2054. Yang, L., 2012. A review of multifunctions of dielectrophoresis in biosensors andbiochips for bacteria detection. Anal. Lett. 45, 187-201. Yang, Q., Zhang, P., Wu, R., Lu, K., Zhou, H.,2018. Identifying the best markercombination in CEA, CA125, CY211, NSE, and SCC for lung cancer screening bycombining ROC curve and logistic regression analyses: is it feasible? Dis. Markers2018,2082840. Yang, G., Xiao, Z., Tang, C., Deng, Y., He, Z., 2019. Recent advances in biosensor fordetection of lung cancer biomarkers. Biosens. Bioelectron. 141, 111416. Yang, S.M., Yu, T.M., Huang, H.P.,2010. Dynamic manipulation and patterning of microparticles and cells by using TiOPc-based optoelectronic dielectrophoresis.Optic Lett. 35,1959-1960. Yang, S.M., Tseng, S.Y., Chen, H.P., 2013. Cell patterning via diffraction-inducedoptoelectronic dielectrophoresis force on an organic photoconductive chip. Lab Chip13,3893-3902. Yang, S.M., Yu, T.M., Huang, H.P., 2011a. Light-driven manipulation of picobubbles on atitanium oxide phthalocyanine-based optoelectronic chip. Appl. Phys. Lett. 98,1153. Yang, S.M., Harishchandra, P.T., Yu, T.M., 2011b. Concentration of magnetic beadsutilizing light-induced electro-osmosis flow. IEEE Trans. Magn. 47, 2418-2421. Yang, S.M., Yao, H., Zhang, D., Li, W.J., Kung, H.F., 2015. Droplet-baseddielectrophoresis device for on-chip nanomedicine fabrication and improved genedelivery efficiency, 19, 235-243. Yokokawa, R., Kitazawa, Y., Terao, K., 2012. A perfusable microfluidic device with on-chip total internal reflection fluorescence microscopy (TIRFM) for in situ and real-time monitoring of live cells. Biomed. Microdevices 14, 791-797. ( Z h a ng, F ., D uan , S . Z . , T s a i l, Y . , K en g , P . C ., C h e n , Y . B . , L e e, S .O . , 2 0 16 . C i s p l at in t re a tment i ncreases s te m ness t h rough u p r e gu l ation o f h y po x ia-inducible f a c to r s b y in te r le uk i n- 6 i n n on-small c e l l lung ca n c e r. C a nc. S c i . 1 0 7, 7 4 6-754. ) ( Z h a n g, H ., C h a n g , H . , N e uzi l , P. , 2 019 . D E P - on - a - C h i p : d i e l ect r o phor e sis a p p l ie d t o microflu i dic platfor m s . Micromachi n es 1 0 , 4 23. ) 多重单分子阵列技术平台(数字 ELISA) 是作为一种具有独特优势的新平台,可用于检测样品中的多种单分子。如何提高检测的灵敏度是当前相关研究的方向。在这里,我们报告了一种免疫测定方法,该方法应用电动效应来分离单个编码的珠子并限制在微孔中,以同时提高细胞因子检测的效率。微流体设计提供了非均匀电场以诱导介电泳 (DEP) 力并操纵珠子。两种波长的激发光激发编码的珠子,用于同时检测。光通过全内反射原理被限制在底部幻灯片上。通过从图像中拾取每个珠子,然后对报告分子发出的荧光强度进行积分,获得捕获的细胞因子的浓度。结果表明,编码珠的填充百分比通过 DEP 效应从 10-20% 提高到 60-80%。通过比较颗粒、自身及其表面的荧光颜色,将四种靶细胞因子IL-2、IL-6、IL-10和TNF-α的浓度计算为pg/ml水平。加标和回收实验验证了效率,超过 70% 的目标分子被捕获。我们的方法的可靠性也通过流式细胞术验证。综上所述,我们认为 DEP 的应用可以提高数字 ELISA 对多重快速检测的灵敏度。
确定
还剩6页未读,是否继续阅读?

彩科(苏州)生物科技有限公司为您提供《血液中IL-2、IL-6、IL-10和TNF检测方案(单分子免疫阵列)》,该方案主要用于全血/血清/血浆中遗传检测,参考标准--,《血液中IL-2、IL-6、IL-10和TNF检测方案(单分子免疫阵列)》用到的仪器有
相关方案
更多