


方案详情
文
在这里,我们向您介绍一种简单的无需溶剂的类似AEDA的分析方法,用以评估样品中的香气活性化合物。Aroma Dilution Analysis (ADA)香气稀释分析法只需调节气相色谱进样口的分流比,来达到稀释香气化合物的目的,而不需要对样品本身进行稀释。 使用的是SBSE搅拌棒吸附萃取。
方案详情

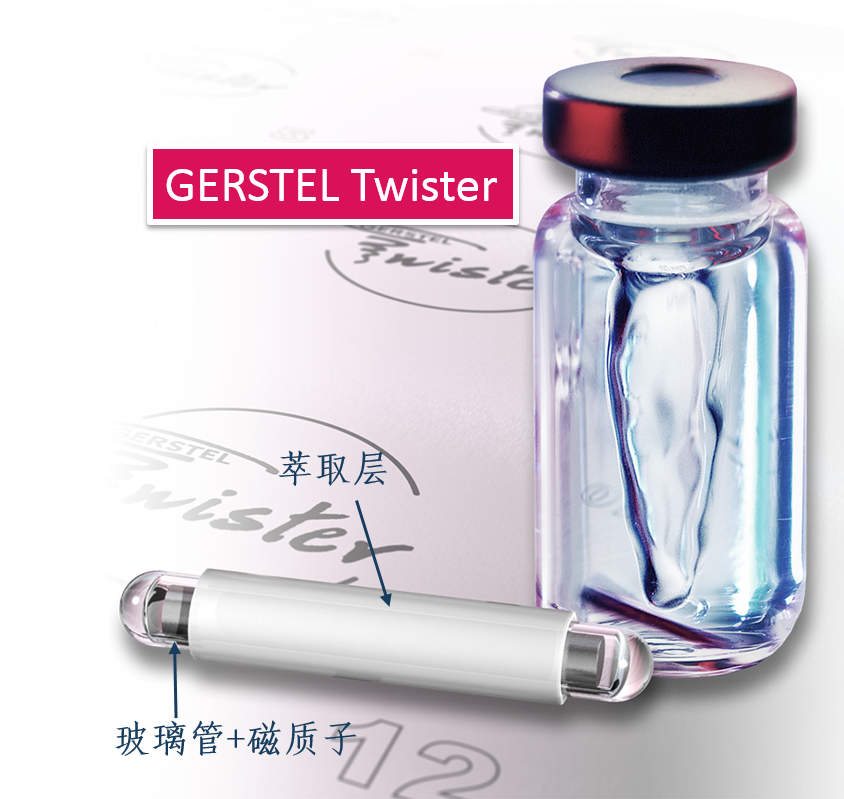
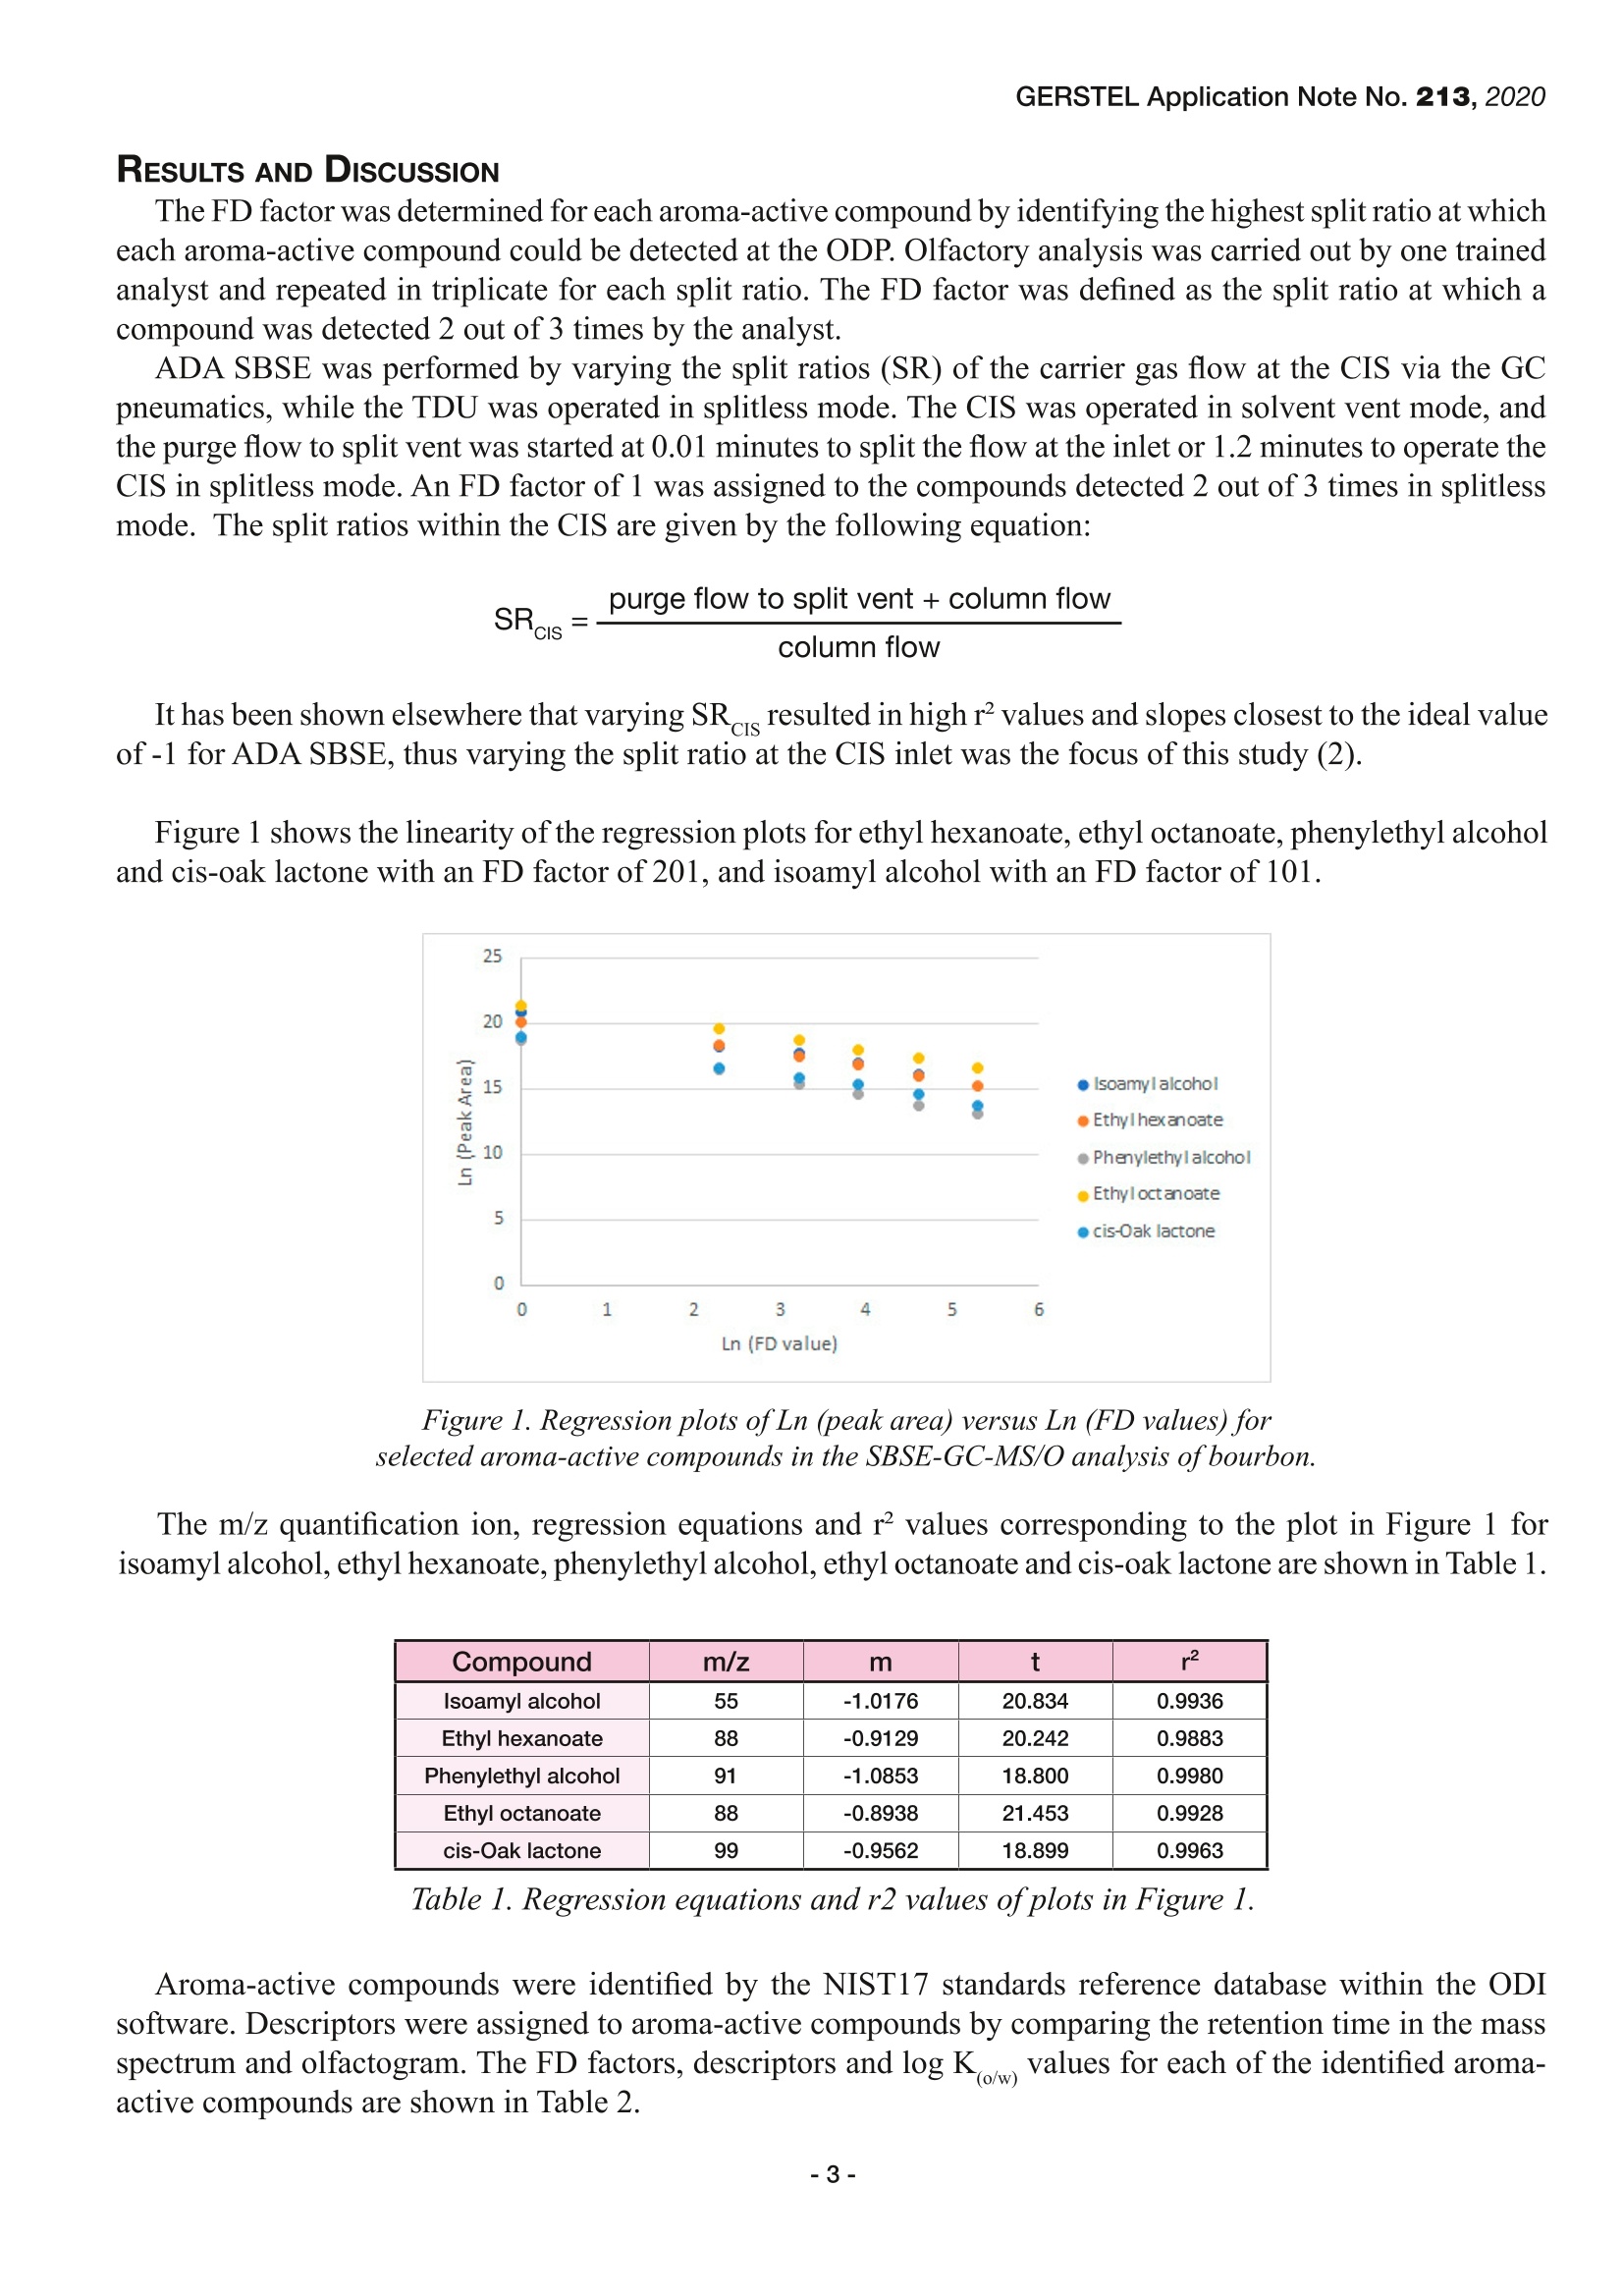
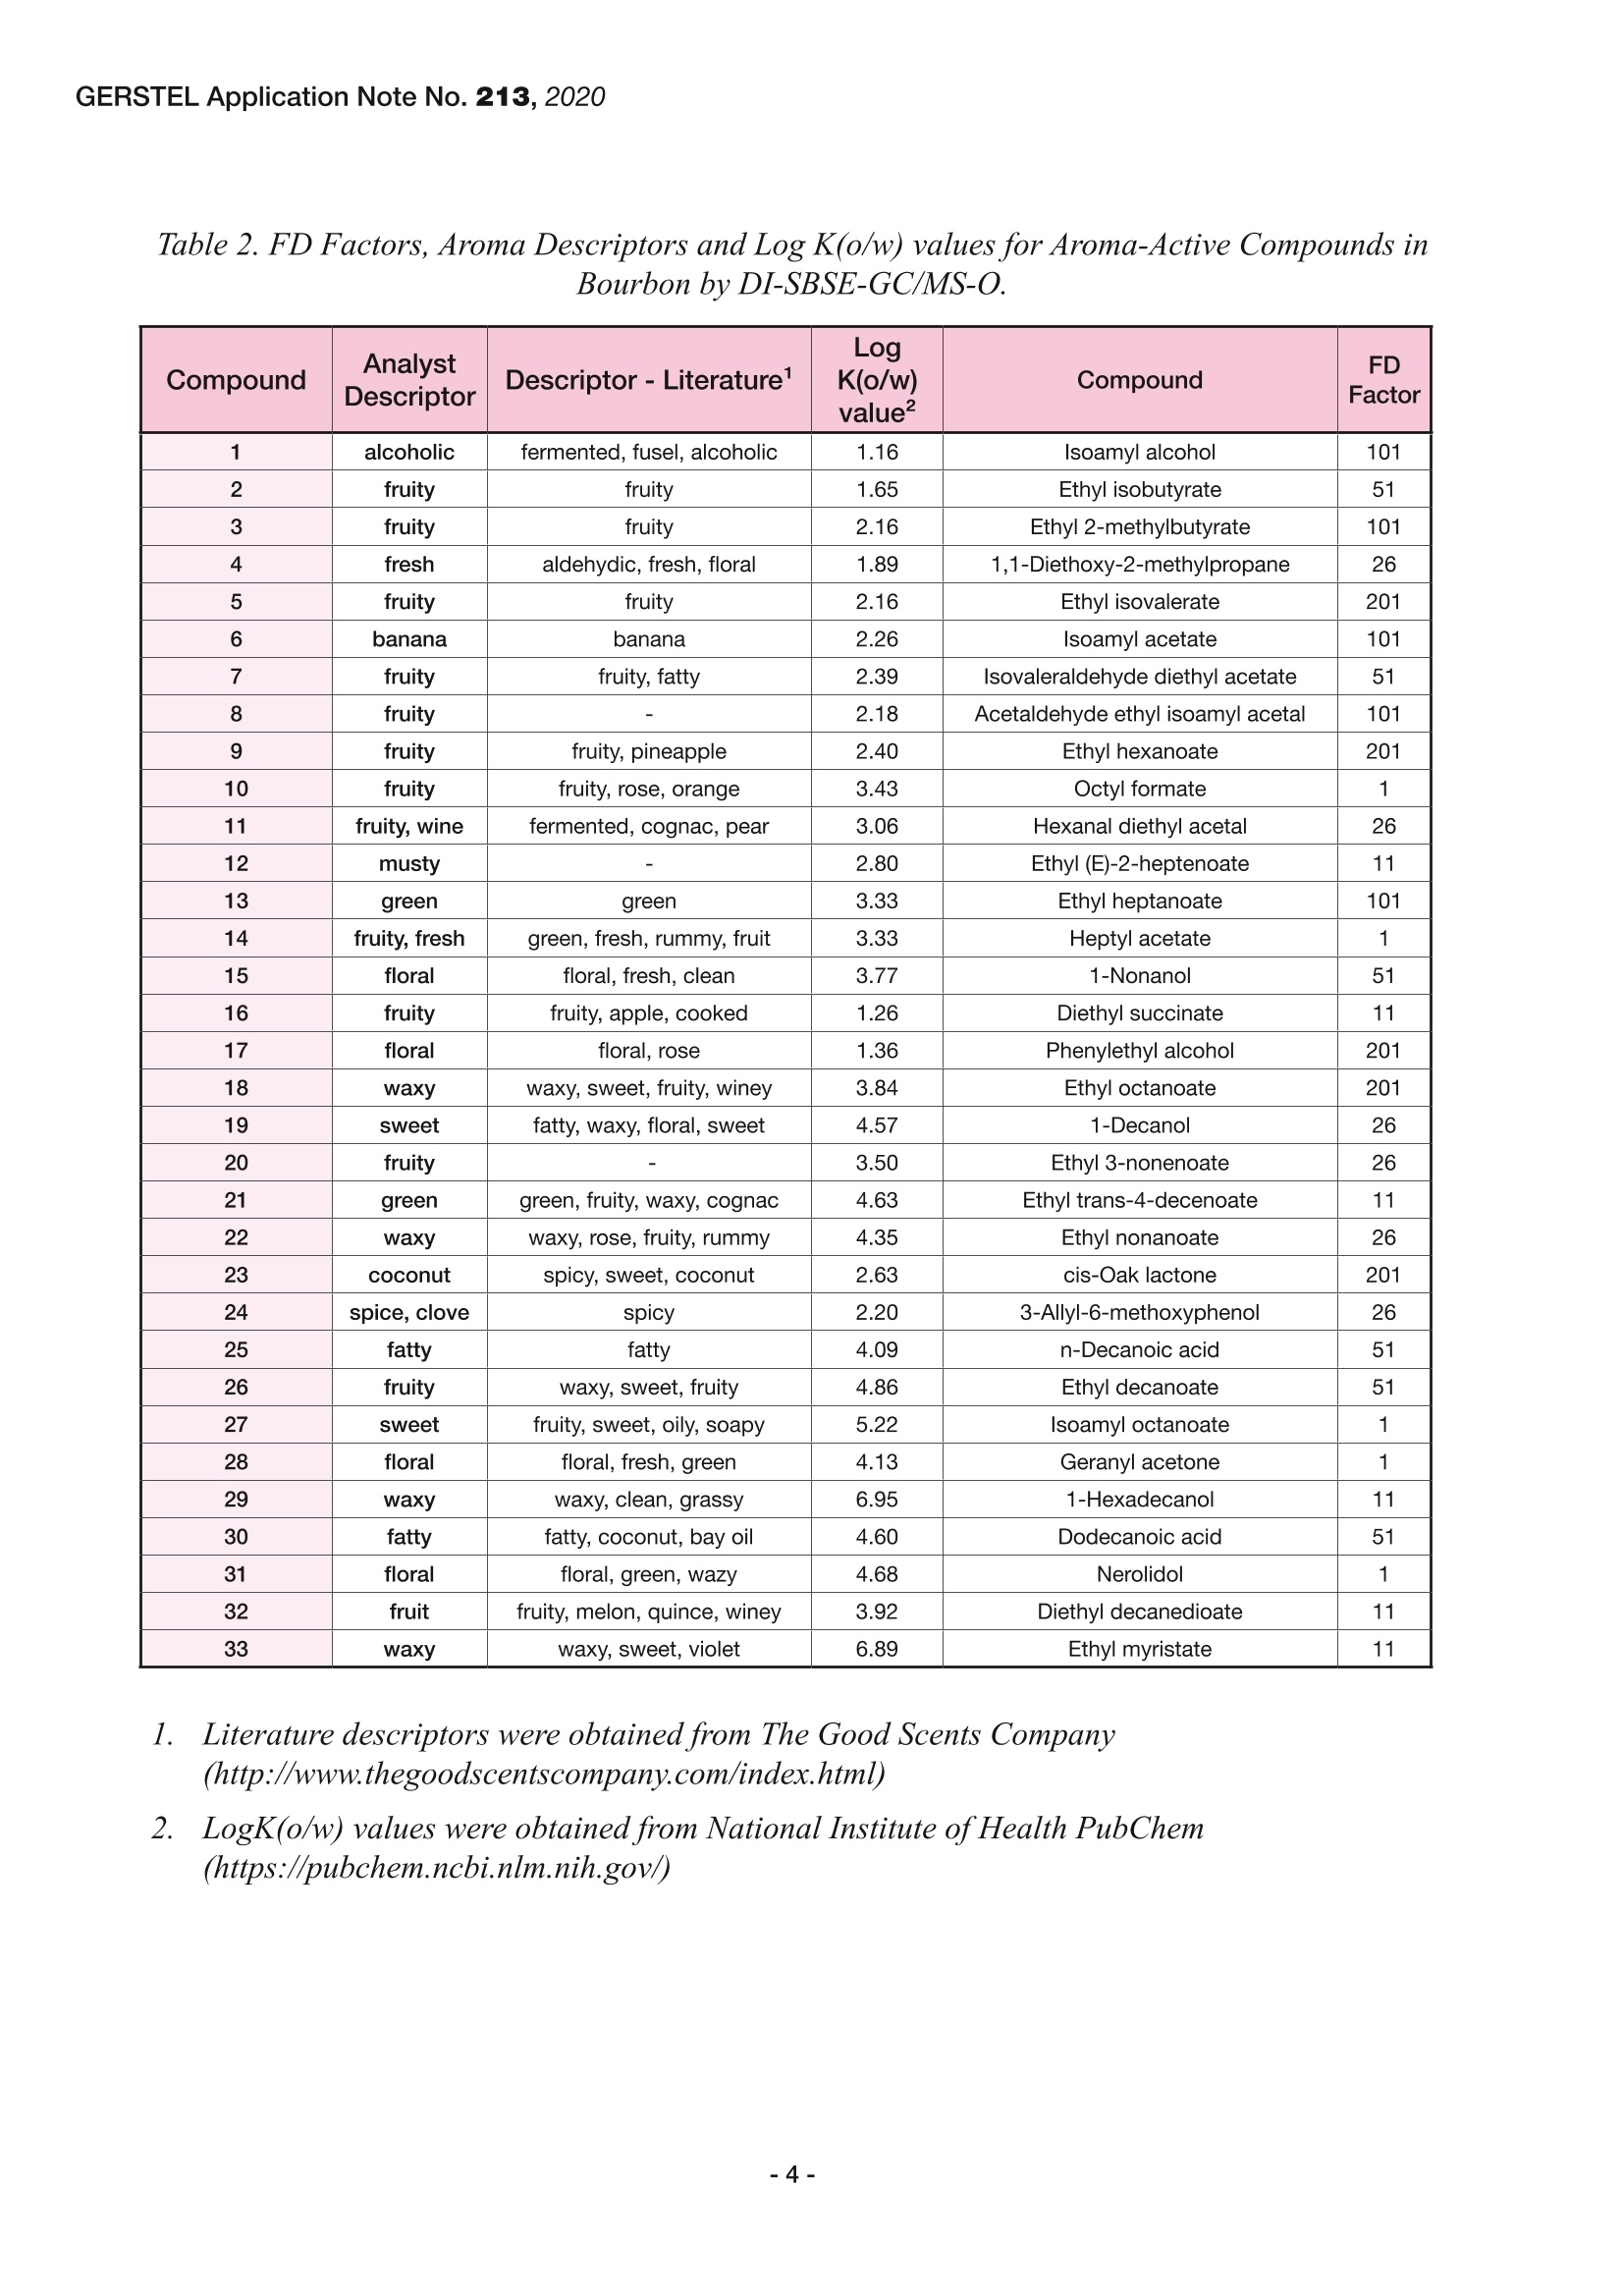
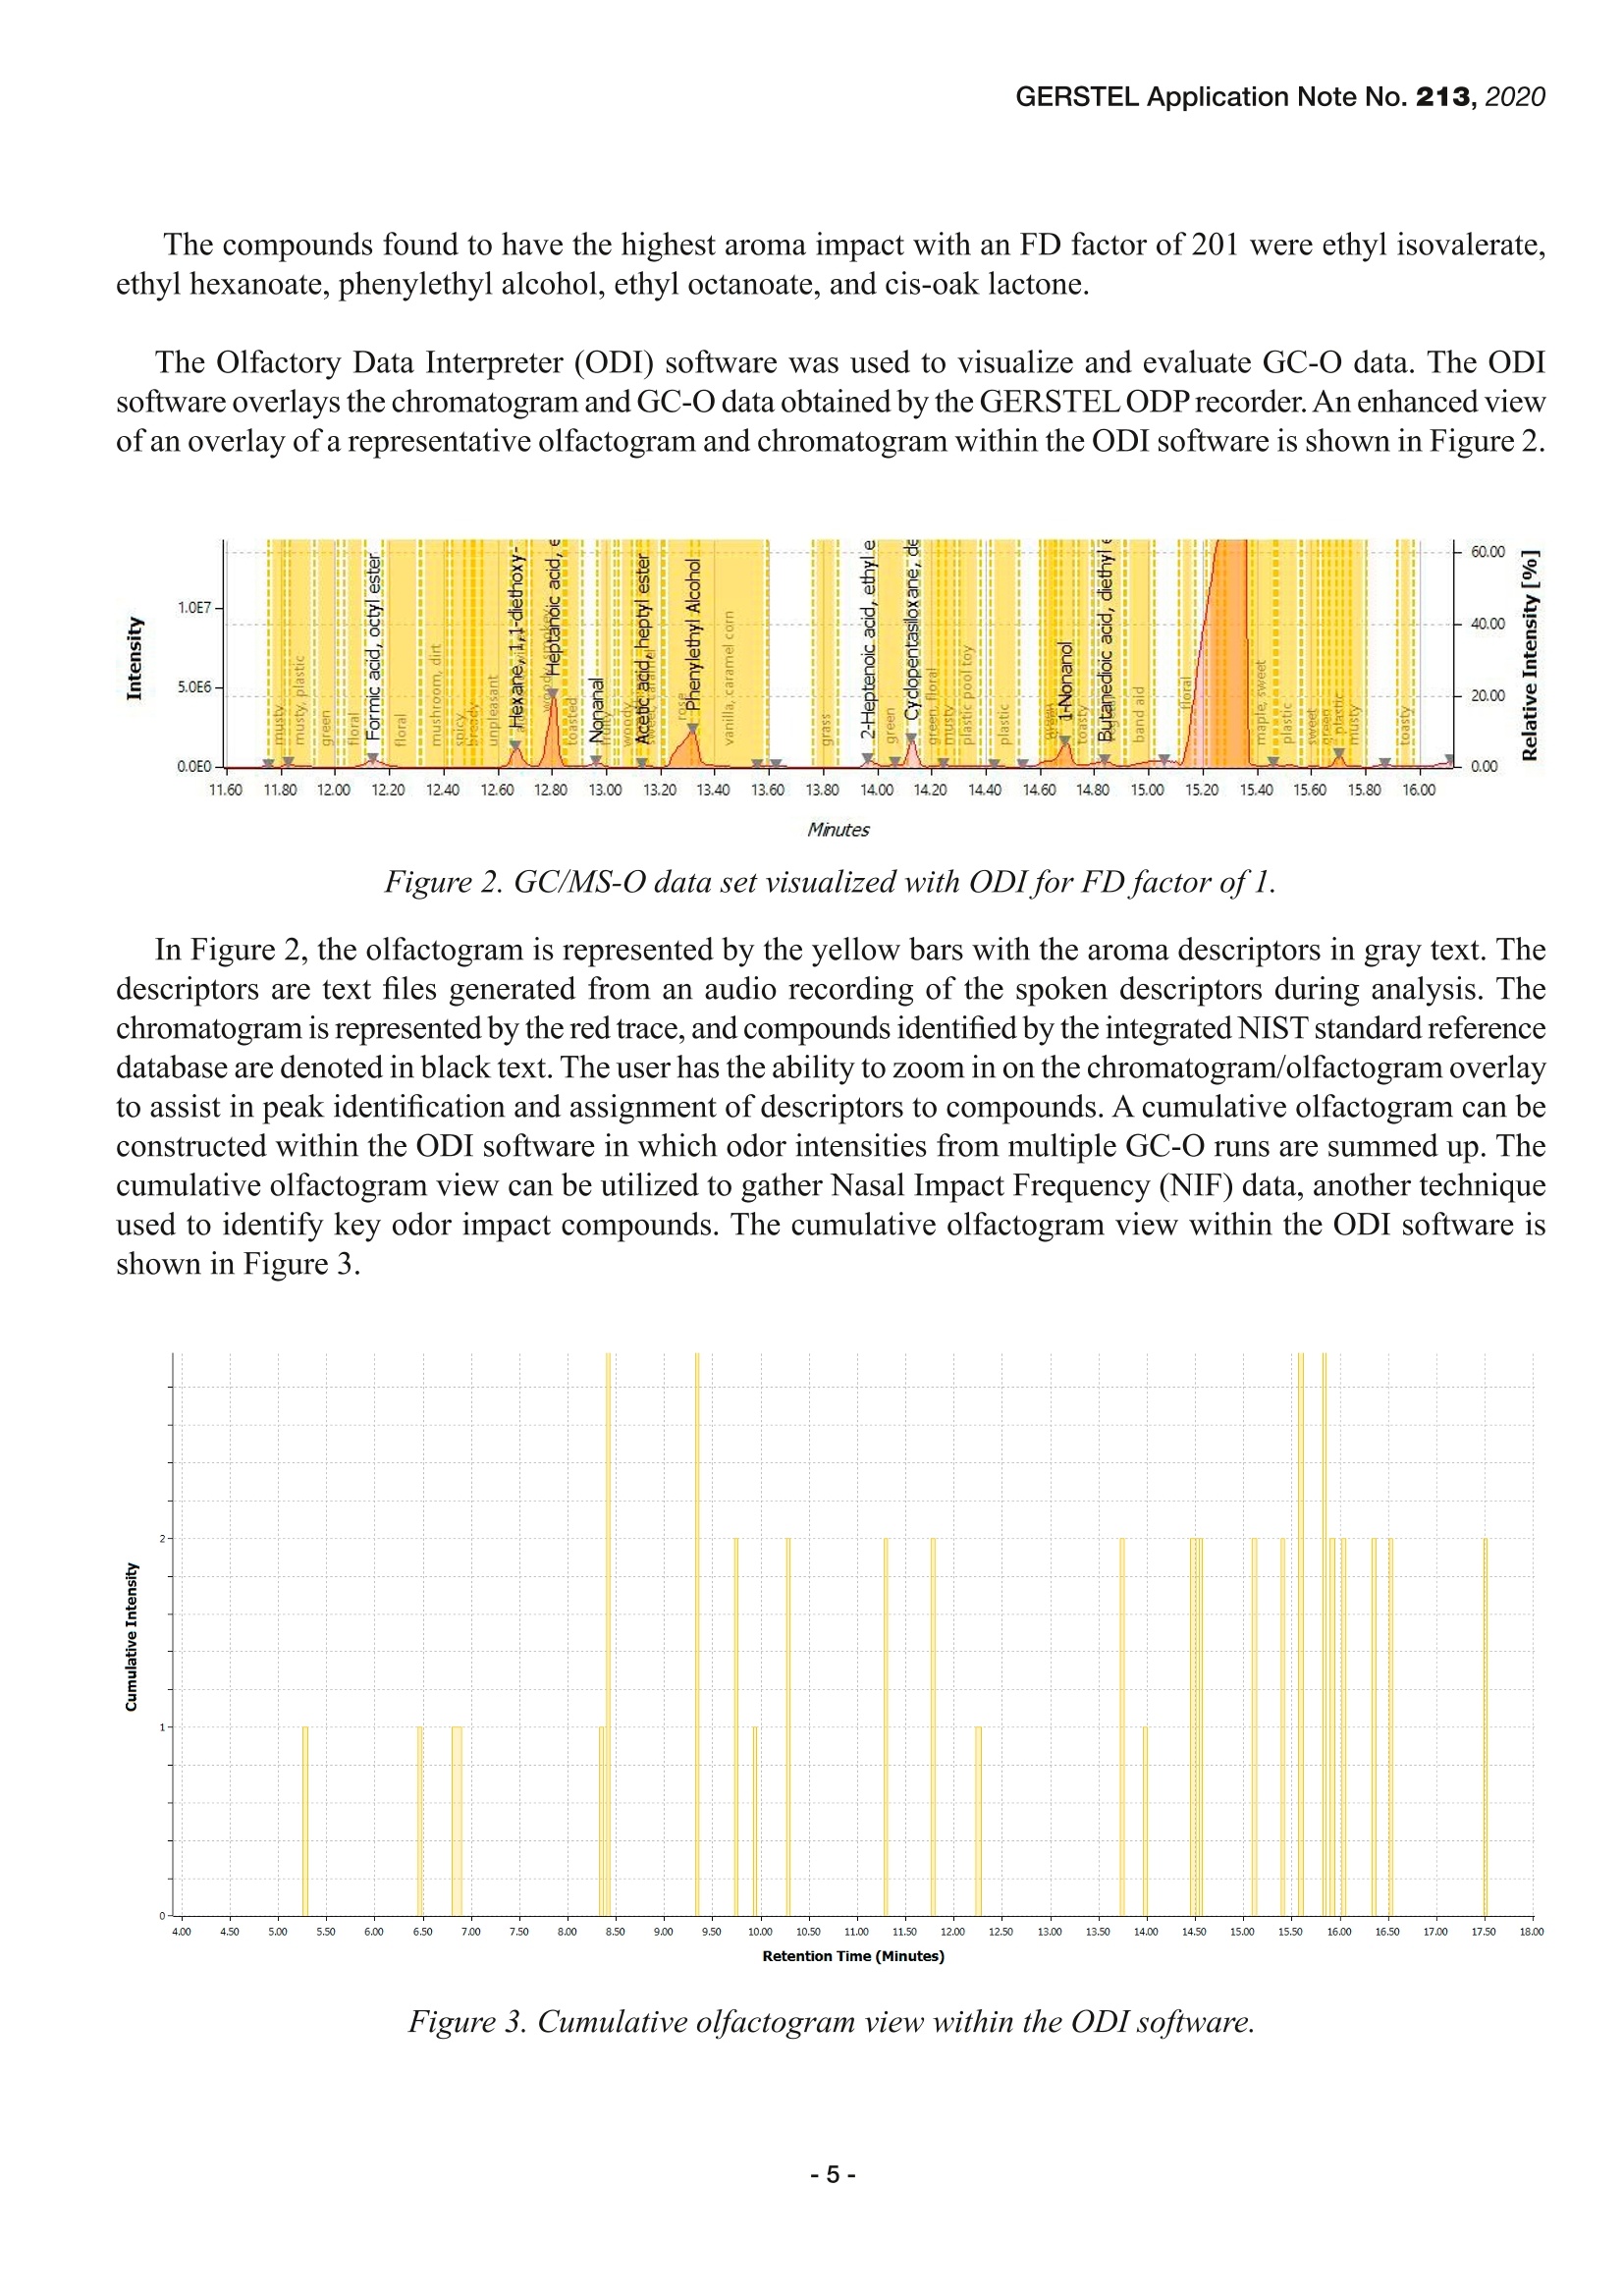
GERSTEL Application Note No. 213,2020 Identifying key odor compounds in bourbon usingsolvent-free aroma dilution analysis and a novel softwarefor interpreting GC-O data Laurel Vernarelli, John Stuff, Jaqueline Whitecavage,and Fred Foster GERSTEL, Inc., 701 Digital Drive, Suite J, Linthicum, MD 21090, USA KEYWORDS Stir Bar Sorptive Extraction, Gas Chromatography-Mass Spectrometry-Olfactometry (GC-MS/O),AromaDilution Analysis, Aroma Extract Dilution Analysis,Olfactometry ABSTRACT Stir Bar Sorptive Extraction (SBSE) coupled withgas chromatography-mass spectrometry and olfactorydetection (GC-MS/O) allows for separation andidentification of aroma compounds in complex samplematrices with minimal sample preparation time. AromaDilution Analysis (ADA) is a solvent-free approachof Aroma Extract Dilution Analysis (AEDA) whichemploys a GC inlet system to split the carrier gas flowand thereby the injected sample to a desired ratio. Theapproach ofADA has been applied to direct immersionSBSE of bourbon samples for determination of flavordilution (FD) factors and identification of key aroma-active compounds. The gas chromatography systemwith a Thermal Desorption Unit (TDU 2) and CooledInjection System (CIS 4) allowed two independentsplit ratios to be set. The product of the split ratiosdetermines the overall dilution factor. The developedmethod allowed the determination of FD factors ina range from 1-201. Data generated by ADA wasevaluated using a novel software that allows for thehandling of GC-O intensity data along with the GC/MS data for identification of key odorants in bourbon. INTRODUCTION Gas Chromatography-Mass Spectrometry-Olfactometry (GC-MS/O) is a robust technique thatallows for the screening of aroma-active componentsof a complex sample matrix and provides instrumentaland sensory analysis simultaneously. It is commonlyapplied to food, beverage and consumer productsto focus on the identification of key aroma impactodorants. Many analytical techniques have beendeveloped for the determination of relative odorpotency ofaroma-active compounds in a product. Oneof these methods is Aroma Extract Dilution Analysis(AEDA) which involves stepwise dilutions of anextract, with the diluted extracts being evaluated byGC-O to provide the flavor dilution (FD) factor. FDfactors are defined as the maximum dilution of anextract at which the compound can be detected (1).AEDA is commonly applied to liquid-liquid extraction(LLE), solvent-assisted flavor evaporation (SAFE)and simultaneous distillation/extraction (SDE). Thesolvent-free approach of Aroma Dilution Analysis(ADA) involves the serial dilution of the sample byadjusting the GC inlet split ratio following the thermaldesorption process. The dilution factor of the samplecorresponds to the overall split ratio of the system,determined as the product of the two independentsplit ratios of the Thermal Desorption Unit (TDU2) and Cooled Injection System (CIS 4). It has beenestablished elsewhere that a good linear relationshipbetween the resulting peak area (concentration) of the extracted compound and the dilution factor is requiredODP:to ensure reliability of the GC-O dilution analysis (1,2). For stir bar sorptive extraction (SBSE), apolydimethylsiloxane (PDMS)-coated stir bar isapplied to a sample by direct immersion (DI) orheadspace (HS) to extract the analytes from thesample. SBSE is highly effective for the extractionof semi-volatile compounds and has a considerablylarger sorbent volume in comparison to other commonmicroextraction techniques, such as solid phasemicroextraction (SPME). However, due to the natureof microextraction techniques, SBSE is typically non-exhaustive and thus dependent on the partitioningcoefficients of the analytes between the phases. Thetraditional AEDA approach cannot reliably be appliedto SBSE, as the dilution of the sample would alterthe sample matrix and corresponding partitioningcoefficients. The technique of ADA has previouslybeen applied to various microextraction techniques,including SBSE (2). The aim of this study is todemonstrate the use of aroma dilution analysis ofdirectimmersion SBSE to identify key odor compounds ofa bourbon sample. EXPERIMENTAL Instrumentation: GERSTEL Thermal Desorption Unit TDU 2GERSTEL MPS robotic with ATEX OptionGERSTEL Cooled Inlet System (CIS 4)with LN2 optionGERSTEL Olfactory Detection Port (ODP 4)Agilent 7890 GC/5977 MSD Analysis conditionsTDU Splitless: 40 ℃ (0 min),720 °C/min,280°℃ (3 min) CIS: Glass Bead Liner:Solvent Venting 50 mL/minSplitless; 20 mL/min at 1.2 minSplit 10:1,25:1,50:1, 100:1 or 200:1-120 °℃ (0 min); 12 °C/min;280 °C (3 min) Column: 30 m Rxi-5ms (Restek) di=0.25 mm, df=0.25 um Pneumatics: He, constant flow 1 mL/min Oven: 40°C (1 min);10 °C/min; 280 °C (3 min) Transfer Line 280°C: Mixing Chamber 150 °C 2:1 Split,ODP:MSD MSD: Scan, 30-350 amu SAMPLE Bourbon was purchased at a local store. A 1 mLaliquot of bourbon was diluted with 9 mL of bottledwater in a 10 mL screw-capped vial. A conditionedTwister stir bar was placed into the 10 mL vial. Thevials were screw capped, and the samples stirred at1000 RPM at room temperature for 90 minutes. Twisterstir bars were rinsed with water, blotted dry and placedinto conditioned TDU tubes for analysis. e sSAMPLE INTRODUCTION Samples were desorbed in splitless mode undera 50 mL/min helium flow at 280 °C for 3 minutes.Analytes were cold trapped in the CIS 4 inlet at-120°℃on a glass bead liner. When desorption was complete,analytes were transferred to the column in splitless orsplit (10:1,25:1, 50:1, 100:1 or 200:1) mode by heatingthe inlet rapidly to 280 °℃. OLFACTOMETRY GC-O analysis was performed on a GC/MSequipped with an Olfactory Detection Port (ODP 4).The column effluent was split 2:1 between the ODP 4and mass spectrometer respectively. The ODP transferline was heated to 280℃. The mixing chamber washeated at 150 °C and purged with humidified nitrogento prevent olfactory fatigue by dehydration of the nasalmucous membranes. RESULTS AND DISCUSSION The FD factor was determined for each aroma-active compound by identifying the highest split ratio at whicheach aroma-active compound could be detected at the ODP. Olfactory analysis was carried out by one trainedanalyst and repeated in triplicate for each split ratio. The FD factor was defined as the split ratio at which acompound was detected 2 out of 3 times by the analyst. ADA SBSE was performed by varying the split ratios (SR) of the carrier gas flow at the CIS via the GCpneumatics, while the TDU was operated in splitless mode. The CIS was operated in solvent vent mode, andthe purge flow to split vent was started at 0.01 minutes to split the flow at the inlet or 1.2 minutes to operate theCIS in splitless mode. An FD factor of 1 was assigned to the compounds detected 2 out of 3 times in splitlessmode. The split ratios within the CIS are given by the following equation: It has been shown elsewhere that varying SRresulted in high rvalues and slopes closest to the ideal valueof -1 for ADA SBSE, thus varying the split ratio at the CIS inlet was the focus of this study (2). Figure 1 shows the linearity of the regression plots for ethyl hexanoate, ethyl octanoate,phenylethyl alcoholand cis-oak lactone with an FD factor of 201, and isoamyl alcohol with an FD factor of 101. Figure 1. Regression plots ofLn (peak area) versus Ln (FD values) forselected aroma-active compounds in the SBSE-GC-MS/O analysis of bourbon. The m/z quantification ion, regression equations and r’ values corresponding to the plot in Figure 1 forisoamyl alcohol, ethyl hexanoate,phenylethyl alcohol, ethyl octanoate and cis-oak lactone are shown in Table 1. Compound m/z m t r² Isoamyl alcohol 55 -1.0176 20.834 0.9936 Ethyl hexanoate 88 -0.9129 20.242 0.9883 Phenylethyl alcohol 91 -1.0853 18.800 0.9980 Ethyl octanoate 88 -0.8938 21.453 0.9928 cis-Oak lactone 99 -0.9562 18.899 0.9963 Table 1. Regression equations and r2 values ofplots in Figure 1. Aroma-active compounds were identified by the NIST17 standards reference database within the ODIsoftware. Descriptors were assigned to aroma-active compounds by comparing the retention time in the massspectrum and olfactogram. The FD factors, descriptors and log Kvalues for each of the identified aroma-active compounds are shown in Table 2. Table 2. FD Factors, Aroma Descriptors and Log K(o/w) values for Aroma-Active Compounds inBourbon by DI-SBSE-GC/MS-O. 1.Literature descriptors were obtained from The Good Scents Company(http://www.thegoodscentscompany.com/index.html) 2.LogK(o/w) values were obtained from National Institute ofHealth PubChem(https://pubchem.ncbi.nlm.nih.gov/) The compounds found to have the highest aroma impact with an FD factor of 201 were ethyl isovalerate,ethyl hexanoate, phenylethyl alcohol, ethyl octanoate, and cis-oak lactone. The Olfactory Data Interpreter (ODI) software was used to visualize and evaluate GC-O data. The ODIsoftware overlays the chromatogram and GC-O data obtained by the GERSTEL ODP recorder. An enhanced viewof an overlay of a representative olfactogram and chromatogram within the ODI software is shown in Figure 2. Figure 2. GC/MS-O data set visualized with ODI for FD factor of1. In Figure 2, the olfactogram is represented by the yellow bars with the aroma descriptors in gray text. Thedescriptors are text files generated from an audio recording of the spoken descriptors during analysis. Thechromatogram is represented by the red trace, and compounds identified by the integrated NIST standard referencedatabase are denoted in black text. The user has the ability to zoom in on the chromatogram/olfactogram overlayto assist in peak identification and assignment of descriptors to compounds. A cumulative olfactogram can beconstructed within the ODI software in which odor intensities from multiple GC-O runs are summed up. Thecumulative olfactogram view can be utilized to gather Nasal Impact Frequency (NIF) data, another techniqueused to identify key odor impact compounds. The cumulative olfactogram view within the ODI software isshown in Figure 3. Figure 3. Cumulative olfactogram view within the ODI software. AEDA-like calculations can be performed directly in the software if the user applies retention time calibration,time recognition windows and performs dilutions in a log2 series. A representative ODI software layout toperform AEDA-like calculations is shown in Figure 4. Figure 4. ODI software view of chromatogram/olfactogram overlay, odor descriptor table andAEDA report from demo data set. ADA results are available in a dedicated report with a maximum FD factor for each of the GC-O signals. CONCLUSIONS ADA SBSE was applied to a Kentucky bourbon to identify the key aroma impact compounds of ethylisovalerate, ethyl hexanoate, phenylethyl alcohol, ethyl octanoate, and cis-oak lactone with an FD factor of201. The novel data analysis ODI software simplified the processing of combined GC-MS/O data.AEDA-likereports can be generated directly within the ODI software without further external data processing. REFERENCES (1) Feng et al.,Food Chem 187 (2015): 44-52 ( (2) F Fraatz et al., Eur Food Res Technol 244 (2018): 949-957 ) GERSTEL GmbH& Co. KG Eberhard-Gerstel-Platz 1 45473 Mulheim an der Ruhr Germany +49 (0)208-76503-0 +49 (0) 208-765 03 33 gerstel@gerstel.com www.gerstel.com GERSTEL Worldwide Information, descriptions and specifications in this Publication are subject to change without notice. GERSTEL, GRAPHPACK and TWISTER are registered trademarks of GERSTEL GmbH & Co. KG. -- -- GC-O-MS技术气相色谱-嗅闻-质谱联用(GC-O-MS)是一种强大的风味分析技术,可以鉴别复杂样品基质中的气味活性化合物,并同时提供仪器和感官分析。它通常应用于食品、饮料和消费品,以鉴别影响样品整体风味的关键风味化合物。目前已经开发了许多分析技术来确定气味活性化合物的相对气味强,常用的方法有香气提取物稀释分析(AEDA)。GC-O-MS图示,气味化合物通过GC被分离后,一部分进入MS,另一部分同时进入嗅闻检测口。AEDA 分析香气提取物稀释分析(AEDA),是GC-O检测技术中较常用的分析方法。是通过对所提取浓缩液的逐步稀释,然后通过GC-O对各稀释梯度样品进行评估并描述气味,直到不能闻到气味为止。 计算每种化合物的香气稀释因子 FD的值(即可以闻到气味的最大稀释比例),根据FD值的大小来确定关键香气活性化合物。香气的稀释因子FD根据样品稀释比例而得最后的FD值是可以闻到气味的样品最大稀释倍数通常使用液液萃取(LLE)、溶剂辅助风味蒸发(SAFE)和同时蒸馏/萃取(SDE)来萃取风味化合物。 标准的AEDA分析非常耗时,需要对样品进行多次稀释,然后注射到GC-O进行嗅闻评估,一般一天一个样品。 无溶剂AEDA分析:ADA在这里,我们向您介绍一种简单的无需溶剂的类似AEDA的分析方法,用以评估样品中的香气活性化合物。Aroma Dilution Analysis (ADA)香气稀释分析法只需调节气相色谱进样口的分流比,来达到稀释香气化合物的目的,而不需要对样品本身进行稀释。 使用的是SBSE搅拌棒吸附萃取。 如下图所示,在SBSE萃取步骤后, 通过热脱附不分流,而只需将GC进样口冷阱的分流比设置不同的比例,从低到高, 如10:1、25:1、 50:1、100:1、200:1 等,然后通过GC-O进行嗅闻分析,直到不能闻到气味为止,即是这里的FD值。同样根据FD值的大小来确定关键的香气活性化合物。 通过SBSE对样品进行萃取通过设置不同的GC进样口分流比,来达到稀释样品的效果使用搅拌棒吸附萃取(SBSE)通过直接浸入(DI)或顶空(HS)来萃取风味化合物的优势在于,SBSE的萃取效果非常有好,与其他常见的微萃取技术(如固相微萃取SPME)相比,SBSE的吸附剂体积要大得多,并且萃取结果重复性高,磁力搅拌棒Twister也更牢固耐用。 应用案例:波本威士忌搅拌棒吸附萃取(SBSE)与气相色谱-质谱-嗅闻技术(GC-MS /O) 相结合,可以在最短的样品制备时间内分离和鉴定复杂样品基质中的香气化合物。这里我们使用波本威士忌作为样品。SBSE-GC-O-MS方法在不同的载气分流比下所得到的峰面积(浓度)和载气分流比的自然倍数之间有良好线性关系R2 大于0.99,证明了ADA法的稳定性。波本威士忌使用SBSE萃取后得到的气相色谱和嗅闻图的叠加视图,使用的是GERSTEL的嗅闻数据处理软件ODI。 在嗅闻分析运行后,只需在ODI数据处理软件中输入相对应的分流比稀释数值,软件便会在一系列稀释闻嗅结束后,自动计算FD值,并给出相应的数据报告。下表为通过SBSE-GC-O-MS法,并且通过分流比稀释法,得到的波本威士忌样品种中的气味化合物的气味特征描述、文献参考、LogKow值、以及通过ODI软件计算出的FD 值。最后通过SBSE萃取和类似AEDA的分流比样品稀释分析法ADA, 得到了波本威士忌中的5种关键香气化合物,分别为:异戊酸乙酯、己酸乙酯、苯乙醇、辛酸乙酯、顺式橡木内酯,其分流比稀释的FD值最高为201。
确定


还剩6页未读,是否继续阅读?

产品配置单


GERSTEL(哲斯泰)为您提供《威士忌中风味化合物检测方案(其它萃取设备)》,该方案主要用于其他酒中理化分析检测,参考标准--,《威士忌中风味化合物检测方案(其它萃取设备)》用到的仪器有GERSTEL 搅拌棒Twister (萃取、固相微萃取)、嗅觉检测口ODP4 (闻香仪,嗅闻仪,嗅辨器)
相关方案
更多
该厂商其他方案
更多