


方案详情
文
本研究以排骨和丝香鸡为原料,分别采用煮、蒸、四步炖制汤。这些汤的化学成分和感官品质明显受到烹饪技术的影响。
方案详情

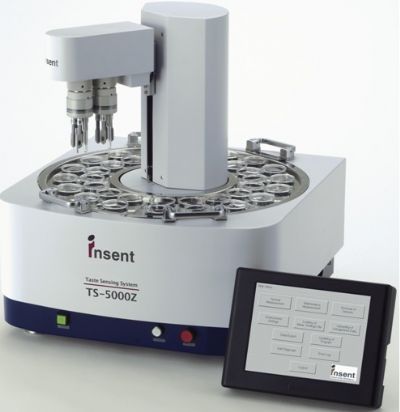
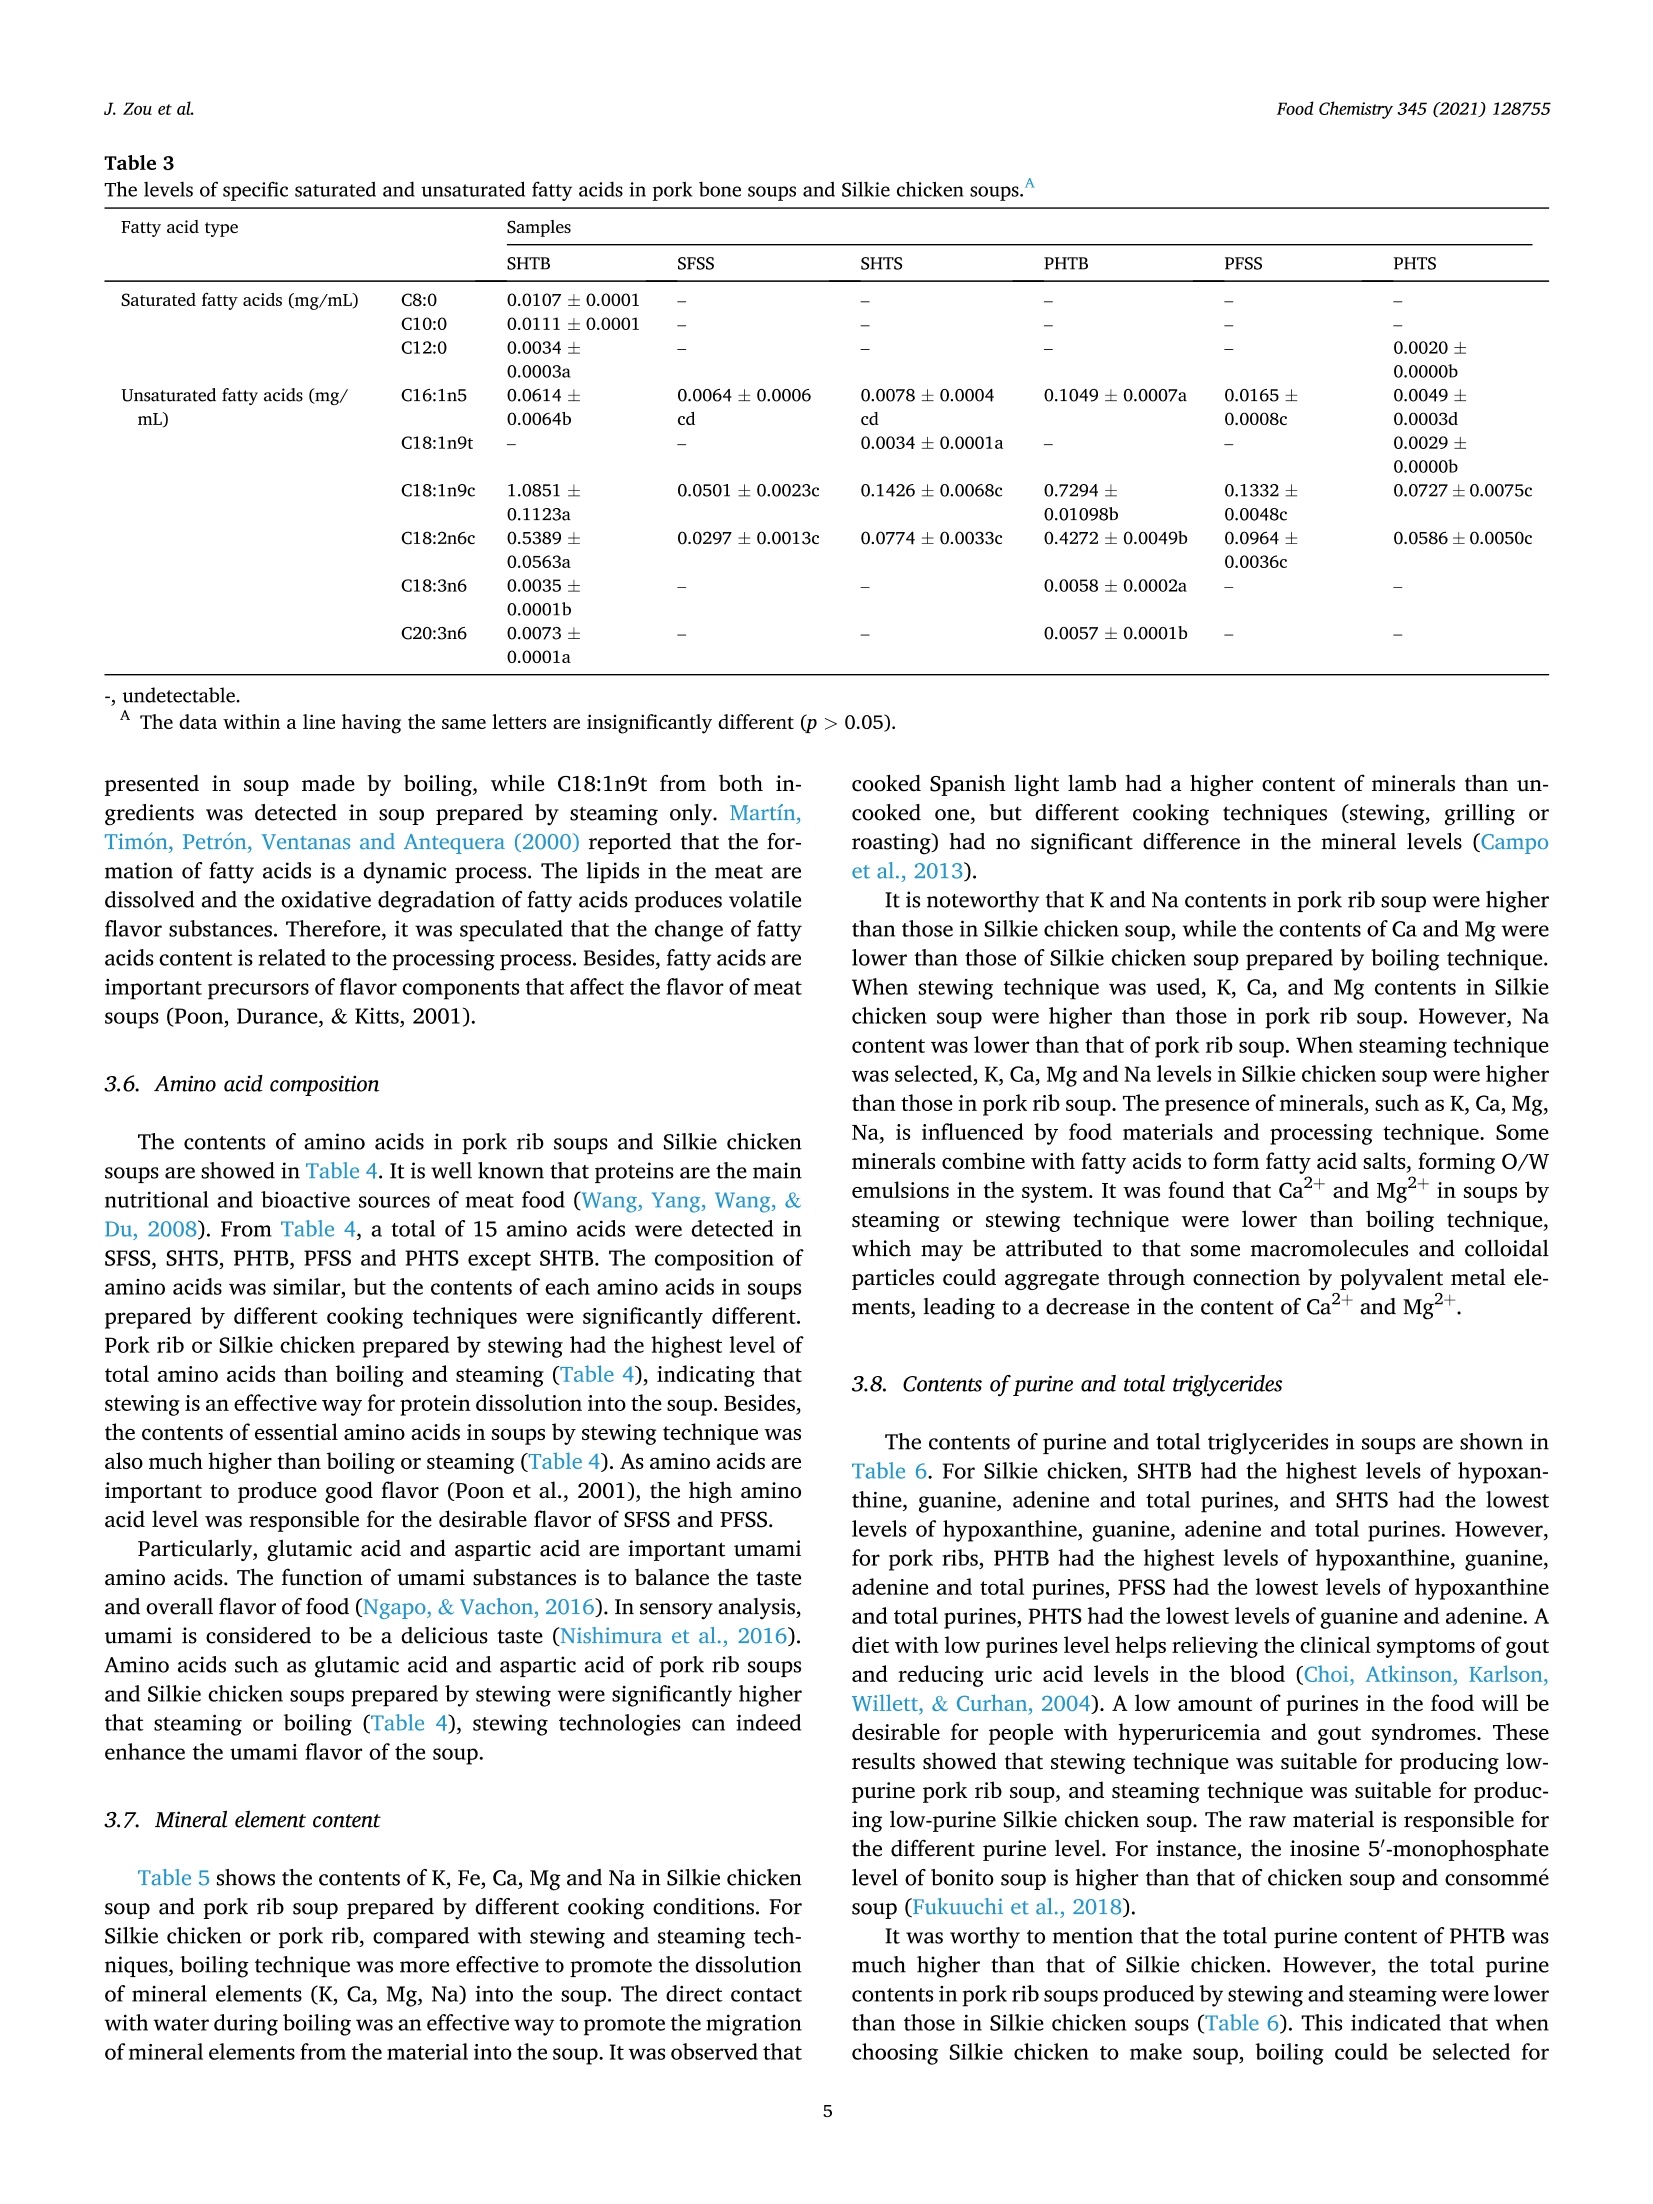
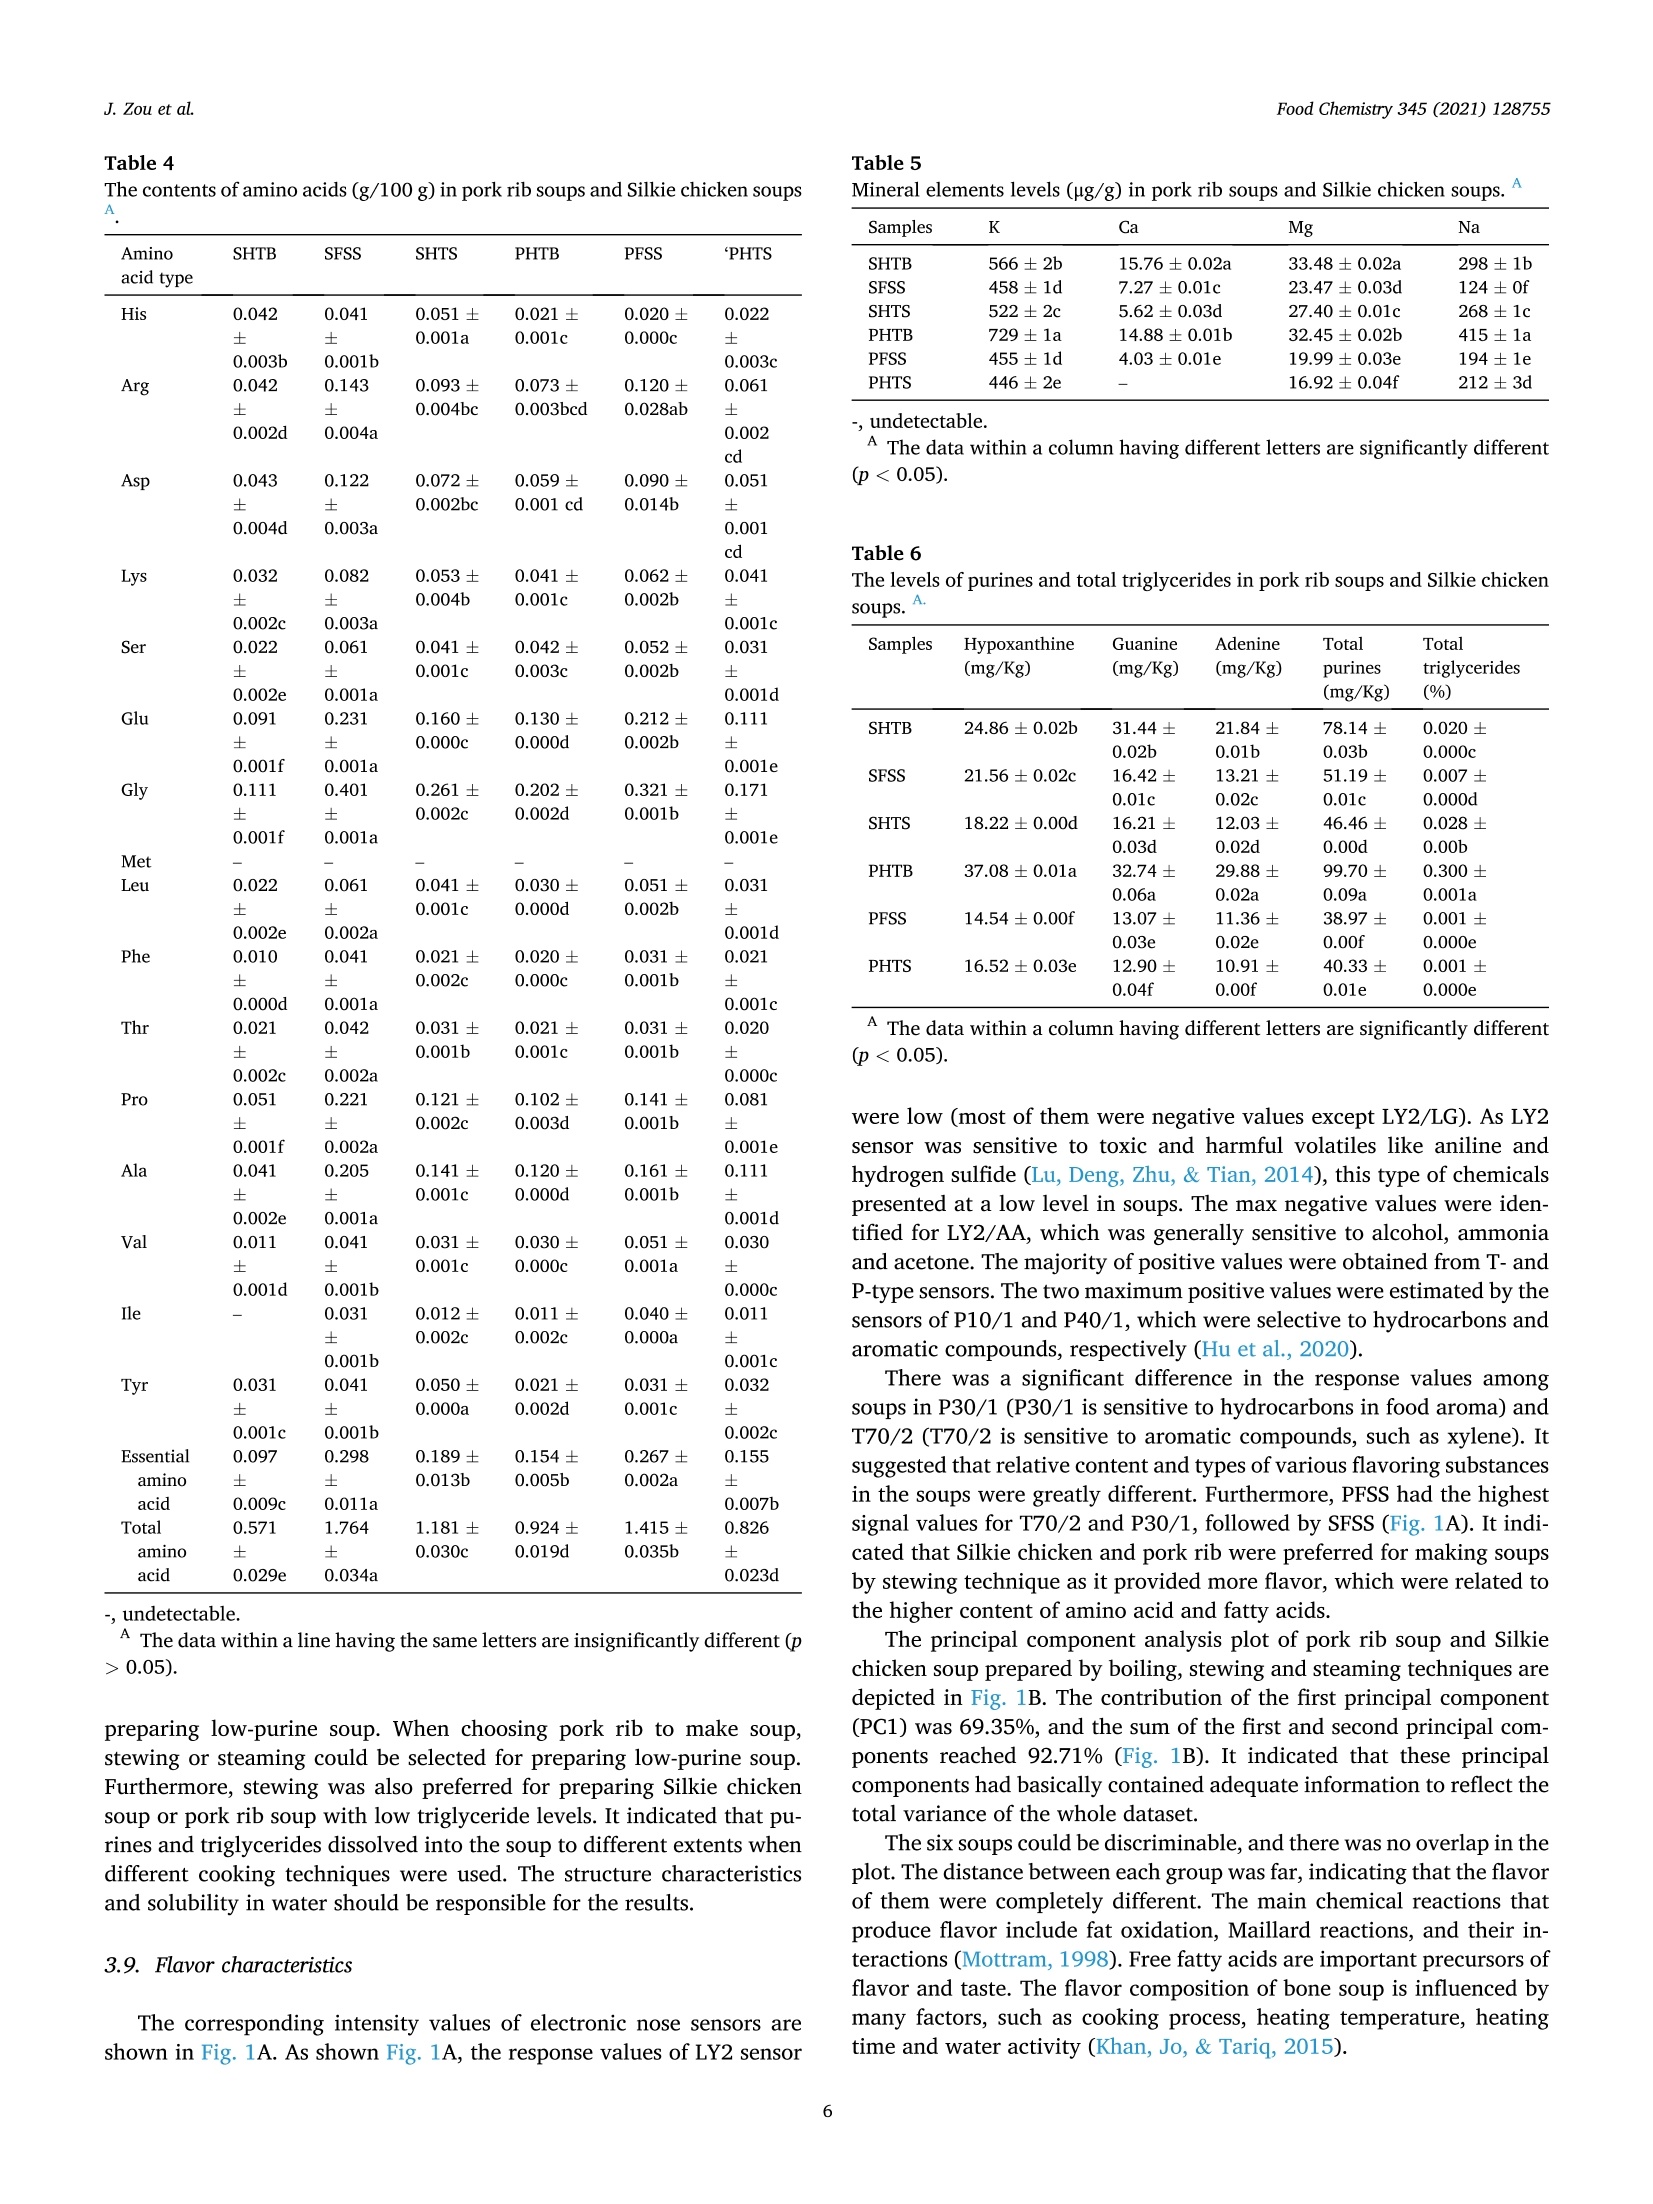
Food Chemistry 345 (2021)128755Contents lists available at ScienceDirect Food Chemistry 345 (2021) 128755J. Zou et al. Food Chemistry journal homepage:www.elsevier.com/locate/foodchem Chemical compositions and sensory characteristics of pork rib and Silkiechicken soups prepared by various cooking techniques Jian Zou , Meijuan Xu, Yifan Zou , Bao Yangb,* College of Food and Biological Engineering, Henan University of Animal Husbandry and Economy, Zhengzhou 450000, China Key Laboratory of South China Agricultural Plant Molecular Analysis and Genetic Improvement, South China Botanical Garden, Chinese Academy of Sciences,Guangzhou 510650, China ARTICLEINFO ABSTRA C T Keywords:Amino acidChemical compositionCooking techniqueSensory qualitySoup Meat soup is an important diet with desirable taste and abundant nutrients. Unveiling the chemical compositionof soup will help to understand the health effects. In this work, pork ribs and Silkie chicken were used to preparesoups by boiling, steaming and four-stage stewing, respectively. The chemical composition and sensory qualitiesof these soups were obviously influenced by the cooking technique. Silkie chicken and pork rib soups prepared byfour-stage stewing technique had particle size smaller than 850 nm, smaller chromatic aberration, higher sta-bility, higher levels of free amino acids,lower levels of fat and total triglycerides than the other two techniques.More abundant flavor and taste characteristics were also detected. The high temperature boiling technique couldpromote the accumulation of the mineral elements in soup. According to healthy and sensory concerns, stewingwas the best choice for preparing soups of pork rib and Silkie chicken. 1. Introduction Soup has been widely accepted by people over the world due to thedelicious taste. In Chinese food, soup usually serves as an important partof daily diets and the diverse soup recipes make our lives better. Besidesthe good taste and nutrients supply,soup can also bring health benefitsto human body. For example, soup intake and dietary fiber intake werepositively correlated with plasma leptin level (Kuroda et al., 2010).Freshwater clam soup has therapeutic effects to ameliorate the acuteliver injury and to inhibit the proliferation of HL-60 human leukaemiacells (Peng et al., 2008). Furthermore, it has been found that thefreshwater clam soup can regulate the plasma lipids and control theangiotensin I converting enzyme (Lin, Tsai, Hung, & Pan, 2011). Micro-nano colloids in soup have important biological activities, which canchange the absorption and utilization behaviors of nutrients andbioactive compounds (Zhou et al.,2017). Moreover, nanocolloids canregulate the inflammation sites on the mucosa, thereby reducing theincidence of colitis in mice (Vong, Tomita, Yoshitomi, Matsui, & Naga-saki, 2012). Cooking conditions, such as temperature and time, influence theflavor profile and chemical composition of soup (Dominguez, Gomez,Fonseca, & Lorenzo, 2014). Rotola-Pukkila, Pihlajaviita, Kaimainen and Hopia (2015) have investigated the effect of cooking temperature andtime on the concentrations of umami compounds in pork soup. Theyhave found that the temperature plays a more important role than timeon the concentration of the umami compounds. Besides, Zhang et al.(2013) have pointed out that crucian carp soup has better flavor andnutritional quality when preparing at 85 °C than those at 55, 65, 75,95and 100 °C, respectively. Processing temperature is highly involved inthe formation of flavor substances of soup (Ames, Guy,& Kipping,2001). The processing conditions will affect the purine content of foodmaterials. In most cases, when the soup is prepared at high temperaturefor long time, it will produce some chemicals which might bring unex-pected health concerns, including purines and triglycerides. The levelsof guanine and adenine increase slightly at a high temperature (Young,1983). As 100 g of food with >200 mg of hypoxanthine will give a highrisk for hyperuricemia (Fukuuchi, Iyama,Yamaoka, & Kaneko, 2018),itis required to restrict purines and triglycerides levels in diet. However, the literatures available have limited information on thechemical compositions and sensory characteristics of soup prepared bydifferent cooking techniques. Besides, the difference between pork ribsoup and Silkie chicken soup prepared by the same cooking technique isbarely known. In the work, by comparing the differences in the color, ( E -mail address: y ang b ao@scbg.a c. c n ( B . Yang). ) ( https: / /doi.or g /1 0 .1016/j.foodchem.2020.128755 ) ( Received 30 July 2020; R eceived in r evised form 26 N ovember 2020; Accepted 26 No v ember 2020 Available online 1 December 2020 ) particle size, Zeta potential, viscosity, flavor, taste and levels of fattyacids, amino acid, mineral elements, purines and total triglycerides ofsoups prepared by different different processing techniques, it willprovide important information to know the health effect of dietary soup. 2. Materials and method 2.1. Materials and reagents Fresh pork rib and Silkie chicken were purchased from local Super-market in Zhengzhou, China. Guanine, adenine, hypoxanthine, andxanthine were obtained from the company of Sigma Aldrich Ltd.(Steinheim, Germany). Acetonitrile was HPLC grade. All the otheragents were analytical grade. 2.2. Preparation of clear soups and pottage The soups of pork rib and Silkie chicken were prepared by the sameprotocol. Here we used pork rib to introduce the details. Pre-treatment: Pork ribs were firstly cut into pieces of about 10 cm inlength and cleaned. They were soaked in 5% citric acid solution at roomtemperature for 1 h. After soaking, pork ribs were rinsed with water andwere placed in boiled water for 30 s, then immediately transferred towater at room temperature. The power of the induction cooker wasmaintained at 800 W. Soup preparation by boiling: The pretreated pork ribs were addedinto a stainless steel pot. The weight ratio of pork ribs/water was 1:3.The water level was marked with a glass rod in the pot, which wasregarded as the initial water level. After mixing, the pork ribs wereboiled and maintained at boiling state for 150 min. During the process,the water level was checked every 30 min, and the boiling water wasadded to keep the initial water level constant in the pot. After the processwa completed, the solids were filtered with four layers of gauze, andthen soup was stored in a glass bottle at -20 °C for further analysis. Soup preparation by steaming: The pretreated pork ribs with water(1:3, w/w) were placed in a pot. It was placed in a stainless steel shelfand heated by steaming for 150 min. The water level of the stainless steelcontainer was maintained and the soup was obtained as describedabove. Soup preparation by stewing: The same proportion of pork ribs/water as described above were treated sequentially at 45°C for 45 min,65°C for 30 min, 85°C for 50 min, and 100°C for 20 min. The waterlevel in the stainless steel pot was maintained and the soup was obtainedas described above. It was noted that there was a great difference in the brightness of thethree soups prepared under different processing techniques. The pork ribsoups prepared by boiling, stewing and steaming were named as PHTB,PFSS, and PHTS, respectively. The Silkie chicken soups obtained byboiling, stewing and steaming were named as SHTB, SFSS and SHTS,respectively. 2.3. Determination of color The color was measured with a CR-400 chromaticity meter (KonicaMinolta, Japan). The soup should be kept at a temperature of 30 °Cbefore determination to avoid of solidification. Each sample wasdetermined for 10 times. L* indicates the brightness degree (black orwhite). a* value represents the change in color from green (-a*) to red(+a*) and b* value represents the change in color from blue (-b*) toyellow (+b*). 2.4. Determination of viscosity The digital viscometer (SNB-1, Shanghai, China) was calibrated tomaintain a horizontal working state, and the temperature of themeasured sample should be accurately controlled at 30 °C to avoid solidification. The liquid sample (150 g) should be placed in a beakerwith a diameter of no<70 mm and a height of no<125 mm. The viscosityof the sample was measured with No. 4 rotor at a speed of 12 rpm. 2.5. Determination of particle size The laser particle size analyzer (Mastersizer 2000, Malvern In-struments Ltd.,UK) was employed to measure the particle size of soup.Each sample (1 mL) was added into a clean detection vessel. During theaddition process, the generation of air bubbles should be avoided. Themeasurement conditions were set as follows: the test temperature,equilibration time, scattering angle, and scanning wavelength were37°C, 120 s, 173° and 633 nm, respectively. 2.6. Determination of Zeta potential Decoction potential was measured with a zeta potential analyzer(Brookhaven Instruments Corporation, NY, USA) according to themethod of Seo, Kim and Lim (2016). The tested sample(1 mL) wasadded into the cell. Afterwards, the electrode was instantly inserted intothe cell to start operational testing. The measurements were carried outat 20°C. The refractive index and viscosity of water were 1.333 and 1.00cP at20 °C, respectively. 2.7. Analyses of fatty acids composition The fat content of each soup was analyzed. Briefly, 10 mL of the soupwas hydrolyzed with hydrochloric acid (10.0 mL). Afterwards, thesample was extracted with acetic ether, and the quantity after elimi-nating the solvent was the total free and bound fats. The content of fattyacids was measured according to the method described by Jin et al.(2020). The total lipids extracted from soups were transformed into fattyacid methyl esters. The levels of fatty acids were evaluated by gaschromatography (Model 7890A, Agilent Technologies, Palo Alto, CA,USA) with a capillary column (DB-23, Agilent Technologies, Palo Alto,CA, USA). GC ChemStation software (Agilent Technologies, Palo Alto,CA, USA) was used for calculation. 2.8. Determination of amino acid composition The amino acid was analyzed by the procotol of Yang, Yang, Li, Liand Jiang (2011). The sample (5.0 g) and hydrochloric acid solution (10mL, 6 mol/L) were added into a tube. The nitrogen was injected for 15min and sealed. The samples were placed in a drying oven at 100 °C for22 h, and then cooled to room temperature. Afterwards, the hydroly-sates were transferred to a 50-mL volumetric flask by adding ultrapurewater to reach the volume of 50 mL. The hydrolysate (1 mL) was placedin a test tube and put it in a drying oven at 45°C, and the sodium citratebuffer (pH 2.2, 1.5 mL) was added to dissolve it. The sample wasdetermined by the automatic amino acid analyzer (L-8800, Hitachi In-struments Ltd.,Japan). 2.9. Determination of mineral level The mineral level in soups was measured by the previous reportswith slight modifications (Alajaji & El-Adawy, 2006). The soup sample(2 g) were weighed accurately in a digestive tube (100 mL) and mixedwith 25 mL of mixed acids (perchloric acid/nitric acid=1:5,v/v). Threeglass beads were added into the digestive tube. The digestive tube wastransferred to a graphite digester for heat digestion at 200 °C. When alarge amount of red-brown gas appeared above the digestive tube, andwhite smoke started to appear after 20 min, the glass slide was opened toremove acid until the sample digestion solution gradually became clear.Finally, the obtained transparent digestive juice was transferred to a 10-mL volumetric flask, and the volume was adjusted with 0.5% dilutednitric acid. A blank control was performed by using water instead of sample. Atomic absorption spectrometer (TAS-990, Beijing) was usedfor measurement. 2.10. Determination of purine level The purine levels of pork rib and Silkie chicken soups were analysedas described by the previous literature with some modifications (Fan,Yang, & Li, 2007). The soup sample (2.5 g) and 2 mL of perchloric acidsolution (6.0%) were mixed quickly, and they were heated in a boilingwater bath for 1 h. Afterwards, the mixture was neutralized with po-tassium hydrogen solution (2.0 M) to adjust the pH to 7.0, and thenadjust the pH to 3.6 with a 5.0% formic acid solution. The mixture abovewas adjusted to 10 mL with a 10.0 mM ammonium formate solution (pH3.6), and then was thoroughly mixed and passed through a 0.22-umfilter membrane. The filtrate obtained was tested by using high perfor-mance liquid chromatograph (HPLC, Agilent 1200, CA, USA). A WatersAtlantis T3 column (4.6 mm × 250 mmx 5 um) was equipped. Thesystem was eluted by 10. 00 mM ammonium formate (pH 3.6) andmethanol (99: 1, v/v). The other details are as follows: flow rate, 1. 00mL/min; column temperature, 30°C; injection volume, 10 pL; detectionwavelength, 254 nm. 2.11. Determination of total triglycerides level Petroleum ether (20 mL) and soup (15 g) were mixed in a centrifugetube. They were shaken and extracted thoroughly. After the extraction,the petroleum ether was removed by evaporation in a water bath. Theisopropanol was added to the centrifuge tube, then the extracted ma-terial was transferred to a 50-mL of volumetric flask, and the iso-propanol was supplemented to a final volume of 50 mL. In thedetermination of the brown reactor bottle, a volume of sample reservoirwas used with a 10%KOH, mixed, placed at a water bath (50°C) for 15min. After the brown reactor bottle cooling to room temperature, theywere mixed with the co-chloride ion solution and oxidation reagents andplaced at room temperature for 10 min, and finally a color reagent wasadded at 50 °C for 30 min. An ultraviolet visible spectrophotometer(Agilent 8453, Agilent, USA) was employed to scan with a wavelengthsetting range of 350-500 nm, and to measure the absorbance at 412 nm.At the same time, a reference was set up and the standard solution wasreplaced with isopropanol. Based on the measured absorbance of thesample, the triglyceride content in the sample was calculated. 2.12. Determination by electronic nose The electronic nose (PEN 3, Airsense, Germany) was used to analyzethe volatile components of several soups. Three types of sensors, LY2-type, T-type and P-type, were used. Sensor chamber A was T30/1,P10/1,P10/2, P40/1, T70/2 and PA/2, respectively. Sensor chamber Bwas P30/1, P40/2, P30/2,T40/2,T40/1 and TA/2, respectively. Sensorchamber CL (High performance control in temperature) was LY2/GH,LY2/gCTL, LY2/gCT, LY2/LG, LY2/G and LY2/AA, respectively. Thedetailed procedure was performed with a slight modification of theprotocol of Hu, Tong, Manyande and Du (2020). The sensor was pre-heated and calibrated before use. After the response signal of the sensorwas stable, 10 mL of sample were placed in a 30-mL electronic nosesample bottle. When the sample was enriched at room temperature for30 min, the volatile chemicals in the sample bottle reached saturation.The parameters of the electronic nose were as follows: detection time,acquisition cycle, automatic zeroing and cleaning time were 60 s, 1 s, 5 sand 300 s,respectively. The internal and injection flow rate was 400mL/min. 2.13. Determination by electronic tongue The taste of soup was measured with electronic tongue (TS-5000Z,Japanese, INSENT). Seven taste sensors were used, including AHS (to detect sour substances), CTS (to detect salty substances), NMS (to detectumami substances), ANS (to detect sweet substances), SCS (to detectbitter substances), PKS and CPS (to detect compound substances). Beforesample determination with electronic tongue, pork rib/Silkie chickensoups were filtered with gauze firstly, and with sand core funnel (0.45-um pore size) to obtain the filtrates. The electronic tongue analyses weredetermined according to the published protocol with a slight modifica-tion (Hu et al., 2020). The above filtrates (80 mL) were analyzed for fivetimes by the electronic tongue. The sampling time, cleaning time,collection period and stirring rate were 120 s, 10 s, 1 s and 3 r/s,respectively. Prior to each analysis cycle, the sensor was firstly rinsedwith deionized water, then NaCl and sodium glutamate calibration so-lution (0.01 mol/L) were used as a reference to monitor and correct thedrift of sensors for 120 s, respectively. 2.14. Data analysis The data determined by electronic nose and electronic tongue wereprocessed by principal component analysis. The response signals ofelectronic nose and electronic tongue were depicted. All the analyseswere performed in triplicate and the data were expressed as mean ±standard deviation. Results were subjected to analysis of variance anddifferences between means were located using ANOVA test followed byTukey’s test or Dunnett’s test (Yang, Zhao, Prasad, Jiang & Jiang, 2010).In all tests, the difference was regarded as significant when p<0.05. 3. Results and analysis 3.1. Color and viscosity Generally, a large L* value indicates that the sample color of tends towhite. It was observed that PHTB and SHTB had the highest L* value(Table 1), which was attributed that boiling for a long time induce thedecomposition of meat tissues. The soups prepared by boiling presenteda thick white soup, rather than clear soup. The L* values of soups pre-pared by steaming and steaming techniques were not significantly (p>0.05) different (Table 1). The b* value in all the soups were larger thana* value (Table 1), indicating that yellow is the most dominant color.The smaller the value of AE is, the smaller the chromatic aberrationpresents. The value of △E of Silkie chicken soup had no significant dif-ferences when comparing with the pork rib soup under the same cookingtechnique (Table 1). The soups made by steaming technique showed thelargest AE values. The viscosities of soups prepared by different cooking technologiesare presented in Table 1. The stewed soups from Silkie chicken or porkrib had higher viscosity than boiled or steamed soups, which may beattributed that the boiled or steamed soups had higher fat content thanstewed ones. The presence of fats might induce emulsification effect to Table 1The color and viscosity of pork bone soups and Silkie chicken soups. Samples L* a* b* AE Viscosity (mPa.s) PHTB 42.62十 -0.87± 3.93± 25.43± 0.046± 1.79a 0.01bc 0.68ab 0.43b 0.002c PFSS 29.92± -1.18± 4.42± 22.73± 0.100± 0.81b 0.03 cd 0.20ab 0.96b 0.000a PHTS 32.63± -1.66± -1.09± 36.29± 0.041± 0.34b 0.05d 0.03d 1.61a 0.001c SHTB 43.69± -0.05± 1.18± 25.16± 0.070± 1.37a 0.00 a 0.15 cd 0.08b 0.002b SFSS 31.33± -0.32± 5.97 ± 23.84± 0.101± 0.56b 0.02ab 0.89a 0.92b 0.001a SHTS 31.79± -2.65± 2.73± 36.64± 0.028± 0.04b 0.03e 0.16bc 1.33a 0.000d The data within a column having the same letters are insignificantlydifferent (p >0.05). 3.2. Particle size Moreover, compared with the soup prepared by the same cookingtechnique, the particle size of PHTB was larger than that of SHTB.However, the particle sizes of PFSS and PHTS were much smaller thanthose of SFSS and SHTS (Table 2). It was speculated that the cookingtechnique and dissolving ingredients were important for the formationof particle size. 3.3. Zeta potential The Zeta potentials of pork rib and Silkie chicken soups are sum-marized in Table 2. They were listed in a decreasing order,SFSS > SHTB> SHTS for Silkie chicken, PFSS> PHTS > PHTB for pork rib. Generally,Zeta potential represents the average potential of particles in the systemand can measure the change in charge density on the surface of thepolysaccharide/protein complex (Langendorff et al., 2000). A small Zetapotential reflects a poor stability of the dispersed system. It was specu-lated that four-stage stewing could cause Silkie chicken/pork rib to forma stable soup system. The small particle sizes of PFSS and SFSS alsocontributed to the stability. It is worthy to mention that compared with the soups prepared by thesame cooking technique. Boiling and stewing techniques induced Silkiechicken to form a soup with high system stability. The steaming andstewing techniques afforded pork rib soup with a high stability. This Table 2Component analysis of pork bone soups and Silkie chicken soups. Samples Particle Zeta Fat(%) Saturated Unsaturated size (nm) potential fatty acids fatty acids (%) (mV) (%) SHTB 953 ±1d -5.31± 0.30± 30.92± 69.11±0.03b 0.03d 0.02a 0.02e SFSS 841± 1e -7.99± 0.20± 32.10± 67.90±0.01c 0.03f 0.01b 0.00d SHTS 4432± -3.08± 0.21± 29.61± 70.40±0.04a 2a 0.02a 0.00b 0.03f PHTB 1116± -3.81± 0.31± 37.30± 62.70 ±0.03f 2c 0.01b 0.01a 0.02a PFSS 555 ±1f -5.87± 0.11± 33.61± 66.41±0.03d 0.02e 0.01c 0.02c PHTS 1987± -4.01± 0.20± 36.40± 63.61±0.02e 1b 0.01c 0.03b 0.02b The data within a column having different letters are significantly different(p<0.05). 3.4. Fat content The fat content of pork rib and Silkie chicken soups prepared bydifferent cooking techniques are shown in Table 2. It could be seen thatthe fat contents of PHTB and SHTB were significantly (p<0.05) higherthan those of the other four soups. There were no significant (p > 0.05)differences in the fat content of Silkie chicken soups prepared bysteaming and stewing. However, the fat content of the pork rib soupprepared by stewing was significantly (p<0.05) lower than that bysteaming (p <0.05). It suggested that boiling treatment facilitated fattransfer into the soup, resulting in an increase in fat content, which wasconsistent with the higher value of L* in Table 1. For the four-stage stewing technique, due to the slow heatinggradient, the body fat transfer into the soup was limited, therebyreducing the fat content in the final soup. Therefore, the four-stagestewing technique could be used for preparing low-fat soup. However,Campo et al. (2013) found that stewing could cause the highest increasein fat of Spanish light lamb than grilling or roasting, which might be dueto fat absorption from the ingredients used in the recipe. This wasdifferent to our results, which might be due to the difference in thecooking conditions and raw material. Similarly, comparing the fat contents between Silkie chicken soupand pork rib soup prepared by the same cooking technique, it could beseen that boiling or steaming had similar fat contents, while the pork ribsoup prepared by stewing technique had a significantly (p<0.05)lowerfat content than that of Silkie chicken soup (Table 2). It suggested thatthe stewing technique could effectively inhibit the fat migration of porkrib into the soup. This provided us a hint that stewing soup could be usedfor the diet of special population, like obesitic people. 3.5. Saturated and unsaturated fatty acids As shown in Table 3, among three cooking techniques, only boilingcould induce Silkie chicken to produce medium-chain fatty acids (C8:0,C10:0, C12:0), and steaming only cause pork rib to produce medium-chain fatty acid (C12:0). Medium-chain fatty acids have been demon-strated to have a negative effect on the proliferation of tumor cells (Haoet al., 2015; Kadochi et al., 2017). Furthermore, ingestion of medium-chain fatty acid (C12:0) could elevate the level of skeletal muscle pro-tein and suppress tumor growth by inducing tumor-selective oxidativestress (Mori et al., 2019). Researchers have found that cooking at hightemperature (grilling or roasting) can alter the fatty acid composition(Campo et al., 2013). Compared with the other two techniques, boiling was effective toincrease the contents of unsaturated fatty acids, such as C16:1n5,C18:1n9c, C18:2n6c for both materials. Moreover, unsaturated fattyacids, such as C18:3n6 and C20:3n6 from both ingredients, were Fatty acid type Samples SHTB SFSS SHTS PHTB PFSS PHTS Saturated fatty acids (mg/mL) C8:0 0.0107±0.0001 二 一 - C10:0 0.0111±0.0001 - - - - - C12:0 0.0034± - - 0.0020± 0.0003a 0.0000b Unsaturated fatty acids (mg/ C16:1n5 0.0614± 0.0064±0.0006 0.0078±0.0004 0.1049±0.0007a 0.0165± 0.0049± mL) 0.0064b cd cd 0.0008c 0.0003d C18:1n9t - 0.0034±0.0001a 一 0.0029± 0.0000b C18:1n9c 1.0851± 0.0501±0.0023c 0.1426±0.0068c 0.7294± 0.1332± 0.0727±0.0075c 0.1123a 0.01098b 0.0048c C18:2n6c 0.5389± 0.0297±0.0013c 0.0774±0.0033c 0.4272±0.0049b 0.0964± 0.0586±0.0050c 0.0563a 0.0036c C18:3n6 0.0035± 0.0058±0.0002a 0.0001b C20:3n6 0.0073± 0.0057 ±0.0001b 0.0001a -, undetectable. presented in soup made by boiling, while C18:1n9t from both in-gredients was detected in soup prepared by steaming only. Martin,Timon, Petron,Ventanas and Antequera (2000) reported that the for-mation of fatty acids is a dynamic process. The lipids in the meat aredissolved and the oxidative degradation of fatty acids produces volatileflavor substances. Therefore, it was speculated that the change of fattyacids content is related to the processing process. Besides, fatty acids areimportant precursors of flavor components that affect the flavor of meatsoups (Poon, Durance, & Kitts,2001). 3.6. Amino acid composition The contents of amino acids in pork rib soups and Silkie chickensoups are showed in Table 4. It is well known that proteins are the mainnutritional and bioactive sources of meat food (Wang, Yang, Wang, &Du, 2008). From Table 4, a total of 15 amino acids were detected inSFSS, SHTS, PHTB, PFSS and PHTS except SHTB. The composition ofamino acids was similar, but the contents of each amino acids in soupsprepared by different cooking techniques were significantly different.Pork rib or Silkie chicken prepared by stewing had the highest level oftotal amino acids than boiling and steaming (Table 4), indicating thatstewing is an effective way for protein dissolution into the soup. Besides,the contents of essential amino acids in soups by stewing technique wasalso much higher than boiling or steaming (Table 4). As amino acids areimportant to produce good flavor (Poon et al., 2001), the high aminoacid level was responsible for the desirable flavor of SFSS and PFSS. Particularly, glutamic acid and aspartic acid are important umamiamino acids. The function of umami substances is to balance the tasteand overall flavor of food (Ngapo, & Vachon, 2016). In sensory analysis,umami is considered to be a delicious taste (Nishimura et al., 2016).Amino acids such as glutamic acid and aspartic acid of pork rib soupsand Silkie chicken soups prepared by stewing were significantly higherthat steaming or boiling (Table 4), stewing technologies can indeedenhance the umami flavor of the soup. 3.7. Mineral element content Table 5 shows the contents of K, Fe, Ca, Mg and Na in Silkie chickensoup and pork rib soup prepared by different cooking conditions. ForSilkie chicken or pork rib, compared with stewing and steaming tech-niques, boiling technique was more effective to promote the dissolutionof mineral elements (K, Ca, Mg, Na) into the soup. The direct contactwith water during boiling was an effective way to promote the migrationof mineral elements from the material into the soup. It was observed that cooked Spanish light lamb had a higher content of minerals than un-cooked one, but different cooking techniques (stewing, grilling orroasting) had no significant difference in the mineral levels (Campoet al., 2013). It is noteworthy that K and Na contents in pork rib soup were higherthan those in Silkie chicken soup, while the contents of Ca and Mg werelower than those of Silkie chicken soup prepared by boiling technique.When stewing technique was used, K, Ca, and Mg contents in Silkiechicken soup were higher than those in pork rib soup. However, Nacontent was lower than that of pork rib soup. When steaming techniquewas selected, K, Ca, Mg and Na levels in Silkie chicken soup were higherthan those in pork rib soup. The presence of minerals, such as K, Ca, Mg,Na, is influenced by food materials and processing technique. Someminerals combine with fatty acids to form fatty acid salts, forming O/Wemulsions in the system. It was found that Ca+and Mgin soups bysteaming or stewing technique were lower than boiling technique,which may be attributed to that some macromolecules and colloidalparticles could aggregate through connection by polyvalent metal ele-ments, leading to a decrease in the content of Caand Mg2+. 3.8. Contents of purine and total triglycerides The contents of purine and total triglycerides in soups are shown inTable 6. For Silkie chicken, SHTB had the highest levels of hypoxan-thine, guanine, adenine and total purines, and SHTS had the lowestlevels of hypoxanthine, guanine, adenine and total purines. However,for pork ribs, PHTB had the highest levels of hypoxanthine, guanine,adenine and total purines, PFSS had the lowest levels of hypoxanthineand total purines, PHTS had the lowest levels of guanine and adenine. Adiet with low purines level helps relieving the clinical symptoms of goutand reducing uric acid levels in the blood (Choi, Atkinson, Karlson,Willett, & Curhan, 2004). A low amount of purines in the food will bedesirable for people with hyperuricemia and gout syndromes. Theseresults showed that stewing technique was suitable for producing low-purine pork rib soup, and steaming technique was suitable for produc-ing low-purine Silkie chicken soup. The raw material is responsible forthe different purine level. For instance, the inosine 5'-monophosphatelevel of bonito soup is higher than that of chicken soup and consommesoup (Fukuuchi et al., 2018). It was worthy to mention that the total purine content of PHTB wasmuch higher than that of Silkie chicken. However, the total purinecontents in pork rib soups produced by stewing and steaming were lowerthan those in Silkie chicken soups (Table 6). This indicated that whenchoosing Silkie chicken to make soup, boiling could be selected for The contents of amino acids (g/100 g) in pork rib soups and Silkie chicken soupsA -, undetectable. The data within a line having the same letters are insignificantly different (p>0.05). preparing low-purine soup. When choosing pork rib to make soup,stewing or steaming could be selected for preparing low-purine soup.Furthermore, stewing was also preferred for preparing Silkie chickensoup or pork rib soup with low triglyceride levels. It indicated that pu-rines and triglycerides dissolved into the soup to different extents whendifferent cooking techniques were used. The structure characteristicsand solubility in water should be responsible for the results. 3.9. Flavor characteristics The corresponding intensity values of electronic nose sensors areshown in Fig. 1A. As shown Fig. 1A, the response values of LY2 sensor Samples K Ca Mg Na SHTB 566±2b 15.76±0.02a 33.48±0.02a 298±1b SFSS 458±1d 7.27 ±0.01c 23.47 ±0.03d 124± Of SHTS 522±2c 5.62±0.03d 27.40±0.01c 268±1c PHTB 729±1a 14.88±0.01b 32.45±0.02b 415±la PFSS 455±1d 4.03±0.01e 19.99±0.03e 194±le PHTS 446±2e 一 16.92±0.04f 212±3d -,undetectable. The data within a column having different letters are significantly different(p <0.05). Table 6 The levels of purines and total triglycerides in pork rib soups and Silkie chickensoupsA.. Samples Hypoxanthine Guanine Adenine Total Total (mg/Kg) (mg/Kg) (mg/Kg) purines triglycerides (mg/Kg) (%) SHTB 24.86±0.02b 31.44± 21.84± 78.14± 0.020± 0.02b 0.01b 0.03b 0.000c SFSS 21.56 ±0.02c 16.42± 13.21± 51.19± 0.007± 0.01c 0.02c 0.01c 0.000d SHTS 18.22±0.00d 16.21± 12.03± 46.46± 0.028± 0.03d 0.02d 0.00d 0.00b PHTB 37.08±0.01a 32.74± 29.88 ± 99.70± 0.300± 0.06a 0.02a 0.09a 0.001a PFSS 14.54±0.00f 13.07± 11.36± 38.97± 0.001± 0.03e 0.02e 0.00f 0.000e PHTS 16.52±0.03e 12.90± 10.91± 40.33± 0.001± 0.04f 0.00f 0.01e 0.000e The data within a column having different letters are significantly different(p < 0.05). were low (most of them were negative values except LY2/LG). As LY2sensor was sensitive to toxic and harmful volatiles like aniline andhydrogen sulfide (Lu, Deng, Zhu, & Tian, 2014), this type of chemicalspresented at a low level in soups. The max negative values were iden-tified for LY2/AA, which was generally sensitive to alcohol, ammoniaand acetone. The majority of positive values were obtained from T-andP-type sensors. The two maximum positive values were estimated by thesensors of P10/1 and P40/1, which were selective to hydrocarbons andaromatic compounds, respectively (Hu et al., 2020). There was a significant difference in the response values amongsoups in P30/1 (P30/1 is sensitive to hydrocarbons in food aroma) andT70/2 (T70/2 is sensitive to aromatic compounds, such as xylene). Itsuggested that relative content and types of various flavoring substancesin the soups were greatly different. Furthermore, PFSS had the highestsignal values for T70/2 and P30/1, followed by SFSS (Fig. 1A). It indi-cated that Silkie chicken and pork rib were preferred for making soupsby stewing technique as it provided more flavor, which were related tothe higher content of amino acid and fatty acids. The principal component analysis plot of pork rib soup and Silkiechicken soup prepared by boiling, stewing and steaming techniques aredepicted in Fig. 1B. The contribution of the first principal component(PC1) was 69.35%, and the sum of the first and second principal com-ponents reached 92.71%(Fig. 1B). It indicated that these principalcomponents had basically contained adequate information to reflect thetotal variance of the whole dataset. The six soups could be discriminable, and there was no overlap in theplot. The distance between each group was far, indicating that the flavorof them were completely different. The main chemical reactions thatproduce flavor include fat oxidation, Maillard reactions, and their in-teractions (Mottram, 1998). Free fatty acids are important precursors offlavor and taste. The flavor composition of bone soup is influenced bymany factors, such as cooking process, heating temperature, heatingtime and water activity (Khan, Jo, & Tariq, 2015). Fig. 1. Responses of the flavour sensors and PCA plot performed by electronicnose for pork rib soups and Silkie chicken soups. 3.10. Taste characteristics The sensors of ANS, SCS, NMS, AHS and CTS determined the taste ofsweet, bitter, fresh, sour and salty substance, respectively. As shown inFig. 2A, there was an obvious difference in sweet, bitter, fresh, sour andsalty taste between PHTB, PFSS and PHTS. PHTB had the highest signalvalue of AHS sensor, mainly presenting sour taste, and PHTS had thehighest NMS signal value, showing significant umami taste. But PFSSwas represented by a complex taste with sweet, bitter and salty. Ishamri,Hwang and Joo (2020) have pointed out that there is an inhibitory effectof astringent chemical on bitter taste, and the salty effect is related toumami and sourness. Yamaguchi and Ninomiya (2000) have reportedthat salty taste can be detected when umami substance presents, due totheir complementary effect. The PCA plot of electronic tongue signals in soups prepared bydifferent cooking techniques is shown in Fig. 2B. The total contributionvariance of the first principal components (PC1) and the second prin-cipal components (PC2) was 98.6%. It indicated that the first twoprincipal components contained sufficient information that reflect thetotal variance of the whole dataset. There is no overlap in the 2D space ofthe first two principal components. The distance between each groupwas far, suggesting that the taste of different soups from different foodmaterials could be distinguished as detected by the electronic tongue.These results might be caused by differences in flavor formation pre-cursors and meat structure. Unsaturated fatty acids contribute to thecharacteristic flavor of the soup (Hoac et al.,2006). K endows a salty Sensors 1.5 B SFSS SHTS ◆ SHTB 1.0 A PFSS PHTS PHTB 0.5 0.0 -0.5 -1.0 -1.5- -5 -4 -3 -2 -1 0 1 2 3 Fig. 2. Responses of the taste sensors and PCA plot performed by the electronictongue for pork rib soups and Silkie chicken soups. taste of soup and the combination of Ca+ with histidine and other basicacids can enhance the sweetness of soup and thus promote the formationof flavor (Diaz, Fernandez, De Fernando, de la Hoz, & Ordonez, 1997).Amino acids, such as glutamic acid, glycine and proline, coexist withtheanine in tea soup have synergistic effect on the umami flavor(Kaneko,Kumazawa, Masuda, Henze, & Hofmann, 2006). 4. Conclusion As mentioned above, the pork rib soup and Silkie chicken soup wereprepared by boiling, stewing and steaming techniques. Stewing tech-nique could prepare a soup with the lowest particle size, chromaticaberration, fat content, total triglycerides level and the highest stability,free amino acids levels. Moreover, stewing could afford the soup with alow total purine level. Therefore, from the viewpoint of health benefit,stewing could be a preferred technique for soup making. The flavorcharacteristics of boiled soup was apparently different to those ofsteamed and stewed soups. These results documented the importance ofcooking technique on soup quality. In the future, it is worthy to inves-tigate the formation mechanism of special sensory characteristics. CRediT authorship contribution statement Jian Zou: Conceptualization, Investigation, Writing-original draft.Meijuan Xu: Investigation, Writing-original draft. Yifan Zou: Inves-tigation. Bao Yang:. Declaration of Competing Interest The authors declare that they have no known competing financialinterests or personal relationships that could have appeared to influencethe work reported in this paper. Acknowledgements We appreciate the financial support from Research and InnovationTeam Construction Plan of Henan University of Animal Husbandry andEconomy (2018KYTD17) and Science and Technology DevelopmentProgramme of Henan Province (202102110284). Appendix A. Supplementary data Supplementary data to this article can be found online at https://doi.org/10.1016/j.foodchem.2020.128755. References Alajaji, S. A., & El-Adawy, T. A. (2006). Nutritional composition of chickpea (Cicerarietinum L.) as affected by microwave cooking and other traditional cookingmethods. Journal of Food Composition & Analysis, 19, 806-812. Ames, J. M., Guy, R. C. E., & Kipping, G. J. (2001). Effect of pH and temperature on theformation of volatile compounds in cysteine/reducing sugar/starch mixtures duringextrusion cooking. Journal of Agricultural and Food Chemistry, 49, 1885-1894. Bozzetto, L., Costabile, G., Luongo, D.,Naviglio, D., Cicala, V., Piantadosi,C., ..Rivellese, A. A. (2016). Reduction in liver fat by dietary MUFA in type 2 diabetes ishelped by enhanced hepatic fat oxidation. Diabetologia, 59, 2697-2701. Campo, M. M., Muela,E., Olleta, J. L., Moreno, L. A., Santaliestra-Pasias, A. M.,Mesana, M. I., & Sanudo, C. (2013). Influence of cooking method on the nutrientcomposition of Spanish light lamb. Journal of Food Composition and Analysis, 31,185-190. Choi, H.K., Atkinson, K., Karlson,E., Willett, W., & Curhan, G. (2004). Purine-rich foods,dairy and protein intake, and the risk of gout in men. New England Journal ofMedicine,350, 1093-1103. Diaz, O.,Fernandez, M., De Fernando, G. D. G., de la Hoz, L., & Ordonez, J. A. (1997).Proteolysis in dry fermented sausages: The effect of selected exogenous proteases.Meat Science, 46, 115-128. Dominguez, R., Gomez, M., Fonseca, S., & Lorenzo,J. M. (2014). Effect of differentcooking methods on lipid oxidation and formation of volatile compounds in foalmeat. Meat Science, 97,223-30. Fan, H., Yang,F. Q.,& Li, S. P. (2007). Determination of purine and pyrimidine bases innatural and cultured cordyceps using optimum acid hydrolysis followed by highperformance liquid chromatography. Journal of Pharmaceutical & BiomedicalAnalysis, 45, 141-144. Fukuuchi, T., Iyama, N., Yamaoka, N., & Kaneko, K. (2018). Simultaneous quantificationby HPLC of purines in umami soup stock and evaluation of their effects onextracellular and intracellular purine metabolism. Nucleosides Nucleotides & NucleicAcids, 37, 273-279. Hao, G. W., Chen, Y. S., He, D. M.,Wang, H. Y., Wu, G. H., & Zhang, B. (2015). Growth ofhuman colon cancer cells in nude mice is delayed by ketogenic diet with or withoutCeomega-3 fatty acids and medium-chain triglycerides. Asian Pacific Organization forCancer Prevention, 16,2061-2068. Hu, Z., Tong, Y., Manyande, A.,& Du, H. (2020). Effective discrimination of flavours andtastes of Chinese traditional fish soups made from different regions of the silver carpusing an electronic nose and electronic tongue. Czech Journal of Food Sciences, 38,84-93. Ishamri, I., Hwang, Y. H, & Joo, S. T. (2020). Low-temperature and long-time heatingregimes on non-volatile compound and taste traits of beef assessed by the electronictongue system. Food Chemistry, 320, Article 126656. Jin, C., Zeng, H., Gao, C., Yan, H., Tan, H., & Wang, X. (2020). Dietary supplementationwith pioglitazone hydrochloride and chromium methionine manipulates lipidmetabolism with related genes to improve the intramuscular fat and fatty acidprofile of yellow feathered chickens.Journal of the Science of Food and Agriculture,100,1311-1319. Kadochi,Y., Mori, S., Fujiwara-Tani, R.,Luo, Y., Nishiguchi, Y., Kishi, S.,... Kuniyasu, H.(2017). Remodeling of energy metabolism by a ketone body and medium-chain fatty acid suppressed the proliferation of CT26 mouse colon cancer cells.Oncology Letters,14, 673-680. Kaneko, S., Kumazawa, K., Masuda,H., Henze, A., & Hofmann, T. (2006).Molecular andsensory studies on the umami taste of Japanese green tea. Journal of Agricultural andFood Chemistry, 54, 2688-2694. Ke, L., Zhou, J., Lu, W., Gao, G., & Rao, P. (2011). The power of soups: Super-hero orteam-work? Trends in Food Science& Technology, 22, 492-497. Khan, M. I., Jo, C., & Tariq, M. R. (2015). Meat flavor precursors and factors influencingflavor precursors-A systematic review. Meat Science, 110, 278-284. Kuroda, M., Ohta, M., Okufuji, T., Takigami, C., Eguchi, M., Hayabuchi, H., & Ikeda, M. (2010). Frequency of soup intake and amount of dietary fiber intake are inverselyassociated with plasma leptin concentrations in Japanese adults. Appetite, 54,538-543. Langendorff, V., Cuvelier, G., Michon, C., Launay, B., Parker, A., & De kruif, C. G. (2000).Effects of carrageenan type on the behaviour of carrageenan/milk mixtures. FoodHydrocolloids, 14, 273-280. Lin, Y. H., Tsai, J. S., Hung, L. B., & Pan, B. S. (2011). Plasma lipid regulatory effect ofcompounded freshwater clam hydrolysate and Gracilaria insoluble dietary fibre.Food Chemistry, 125, 397-401. Lu, L., Deng,S., Zhu, Z., & Tian, S. (2014). Classification of Rice by Combining ElectronicTongue and Nose. Food Analytical Methods, 8, 1893-1902. Maranesi, M., Bochicchio, D., Montellato, L., Zaghini, A., Pagliuca, G., & Badiani,A.(2005). Effect of microwave cooking or broiling on selected nutrient contents, fattyacid patterns and true retention values in separable lean from lamb rib-loins, withemphasis on conjugated linoleic acid. Food Chemistry, 90, 207-218. Martin,L., Timon, M. L., Petron, M. J., Ventanas, J., & Antequera, T.(2000).Evolution ofvolatile aldehydes in Iberian ham matured under different processing conditions.Meat Science, 54, 333-337. Mori,T., Ohmori, H., Luo, Y., Mori, S., Miyagawa, Y., Nukaga, S.,... Kuniyasu, H. (2019).Giving combined medium-chain fatty acids and glucose protects against cancer-associated skeletal muscle atrophy. Cancer Science, 110, 3391-3399. Mottram, D. S. (1998). Flavour formation in meat and meat products: A review. FoodChemistry, 62, 415-424. Ngapo, T.M., & Vachon,L. (2016). Umami and related components in “chilled"pork forthe Japanese market. Meat Science, 121, 365-374. Nishimura, T., Goto, S., Miura, K., Takakura, Y., Egusa, A., & Wakabayashi,H. (2016).Umami compounds enhance the intensity of retronasal sensation of aromas frommodel chicken soups. Food Chemistry, 196, 577-583. Peng, T. C., Subeq, Y. M., Lee, C. J., Lee, C. C., Tsai, C. J., Chang, F. M., &Lee, R. (2008).Freshwater clam extract ameliorates acute liver injury induced by hemorrhage inrats. The American Journal of Chinese Medicine, 36, 1121-1133. Rotola-Pukkila, M. K., Pihlajaviita, S. T., Kaimainen, M. T., & Hopia, A. I. (2015).Concentration of umami compounds in pork meat and cooking juice with differentcooking times and temperatures. Journal of Food Science, 80, C2711-C2716. Seo, T. R., Kim, H. Y., & Lim, S. T. (2016). Preparation and characterization of aqueousdispersions of high amylose starch and conjugated linoleic acid complex. FoodChemistry,211, 530-537. Simopoulos,A. (2010). Genetic variants in the metabolism of omega-6 and omega-3 fattyacids: Their role in the determination of nutritional requirements and chronicdisease risk. Experimental Biology and Medicine, 235, 785-795. Vong, L. B., Tomita, T., Yoshitomi, T., Matsui, H., & Nagasaki, Y. (2012). An orallyadministered redox nanoparticle that accumulates in the colonic mucosa and reducescolitis in mice. Gastroenterology, 143, 1027-1036. Wang, L., Yang, B., Wang, R., & Du, X. (2008). Extraction of pepsin-soluble collagen fromgrass carp (Ctenopharyngodon idella) skin using an artificial neural network. FoodChemistry, 111, 683-686. Yamaguchi, S., & Ninomiya, K. (2000). Umami and food palatability. The Journal ofNutrition, 130, 921S-926S. Yang, B., Yang, H., Li, J., Li, Z., & Jiang, Y. (2011). Amino acid composition, molecularweight distribution and antioxidant activity of protein hydrolysates of soy sauce lees.Food Chemistry, 124, 551-555. Yang, B., Zhao, M., Prasad, K. N., Jiang, G., & Jiang, Y. (2010). Effect of methylation onthe structure and radical scavenging activity of polysaccharides from longan(Dimocarpus longan Lour.) fruit pericarp. Food Chemistry, 118, 364-368. Young,L. L. (1983). Effect of stewing on purine content of broiler tissues. Journal ofFoodScience, 48, 315-316. Zhang, J., Yao, Y., Ye, X., Fang, Z., Chen, J., Wu, D.,... Hu, Y.(2013). Effect of cookingtemperatures on protein hydrolysates and sensory quality in crucian carp (Carassiusauratus) soup. Journal of Food Science and Technology, 50, 542-548. Zhou, J., Liu, J., Lin, D., Gao, G., Wang, H., Guo,J., ... Ke, L. (2017). Boiling-inducednanoparticles and their constitutive proteins from Isatis indigotica Fort. rootdecoction: Purification and identification. Journal of Traditional & ComplementaryMedicine, 7, 178-187. 肉汤是一种重要的饮食,具有良好的口味和丰富的营养。揭示汤的化学成分将有助于了解其对健康的影响。本研究以排骨和丝香鸡为原料,分别采用煮、蒸、四步炖制汤。这些汤的化学成分和感官品质明显受到烹饪技术的影响。四步炖制的丝虫鸡排骨汤的粒度小于850 nm,色差小,稳定性好,游离氨基酸含量高,脂肪和总甘油三酯含量低。更丰富的风味和口味特征也被检测出来。高温煮沸技术能促进汤中矿物质元素的积累。从健康和感官角度考虑,炖制是制作猪肋排和丝虫鸡汤的最佳选择。 检测仪器:TS-5000Z(日本INSENT电子舌)等
确定

还剩6页未读,是否继续阅读?

产品配置单
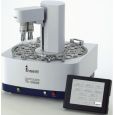
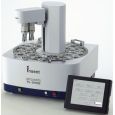
北京盈盛恒泰科技有限责任公司为您提供《猪肋排和丝虫鸡汤中化学成分和感官特性检测方案(感官智能分析)》,该方案主要用于熟肉制品中营养成分检测,参考标准--,《猪肋排和丝虫鸡汤中化学成分和感官特性检测方案(感官智能分析)》用到的仪器有电子舌、日本INSENT味觉分析系统(电子舌)
相关方案
更多
该厂商其他方案
更多