


方案详情
文
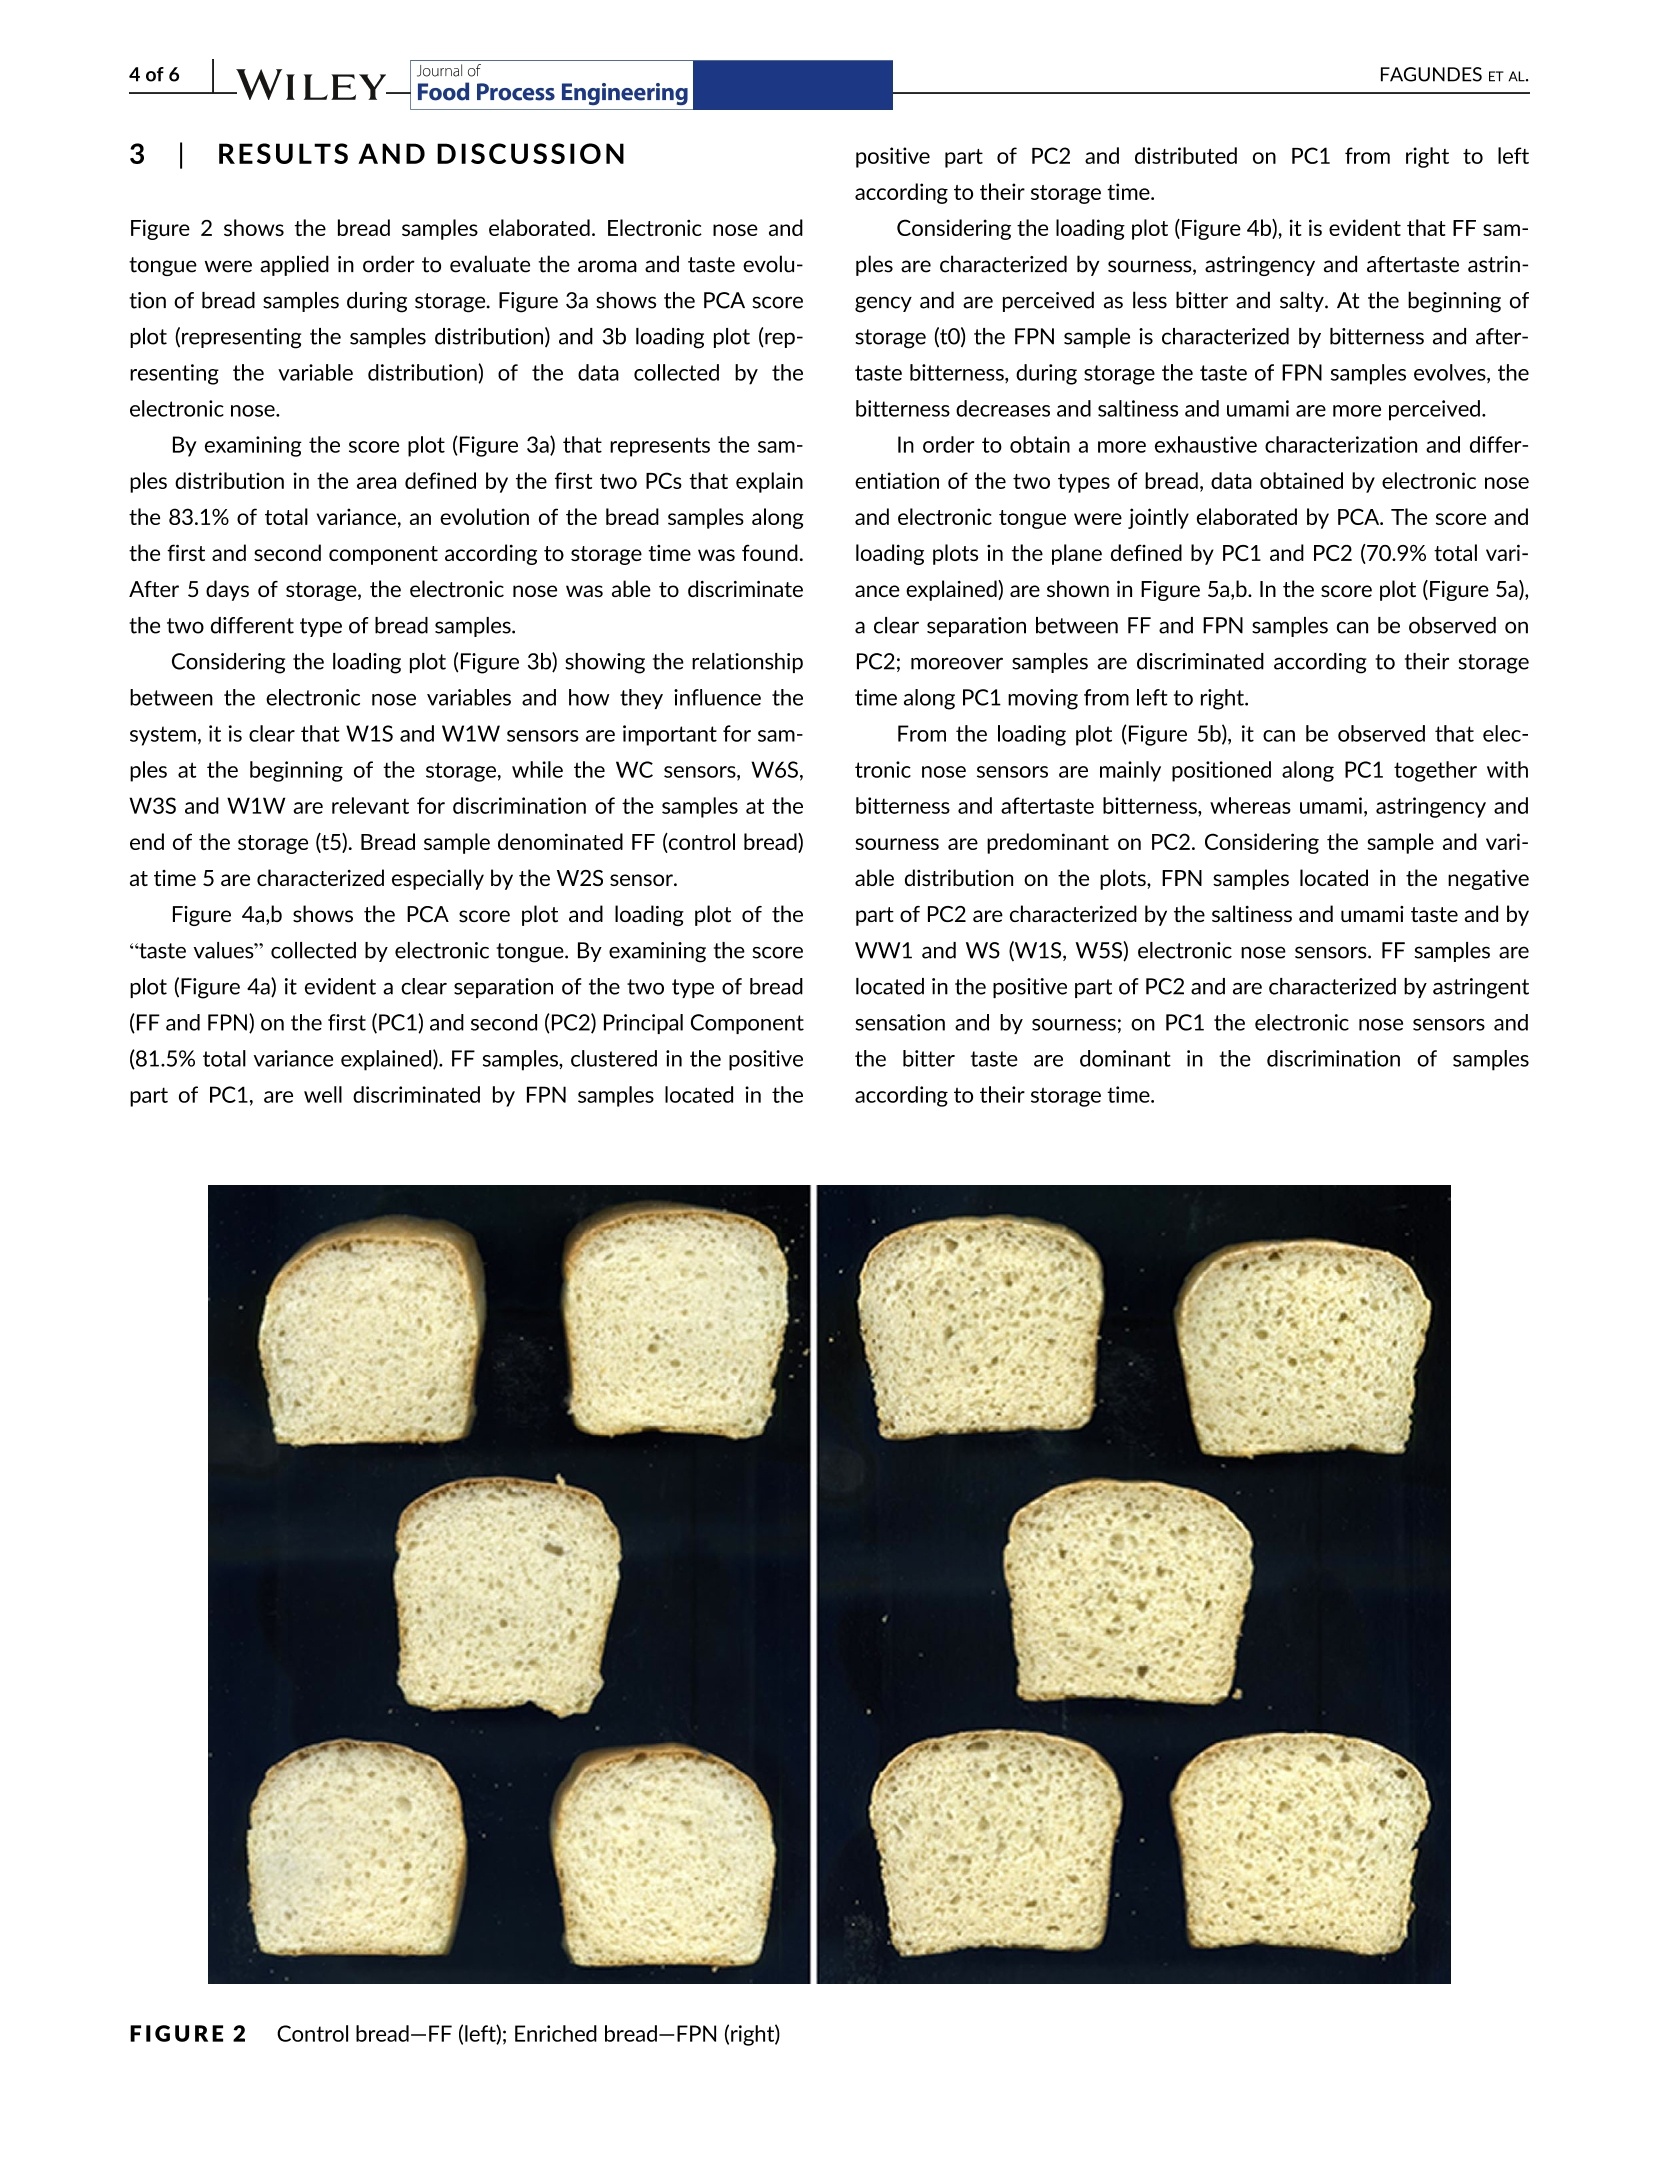
目的是通过电子鼻(EN)和舌(ET)对添加军曹鱼蛋白的面包在不同贮藏时间下的感官品质进行评价。电子传感方法的应用显示出了前景。使产品的气味和味道的测定具有更大的特异性。因此,这些工具可以用来改善新产品的感官特性。
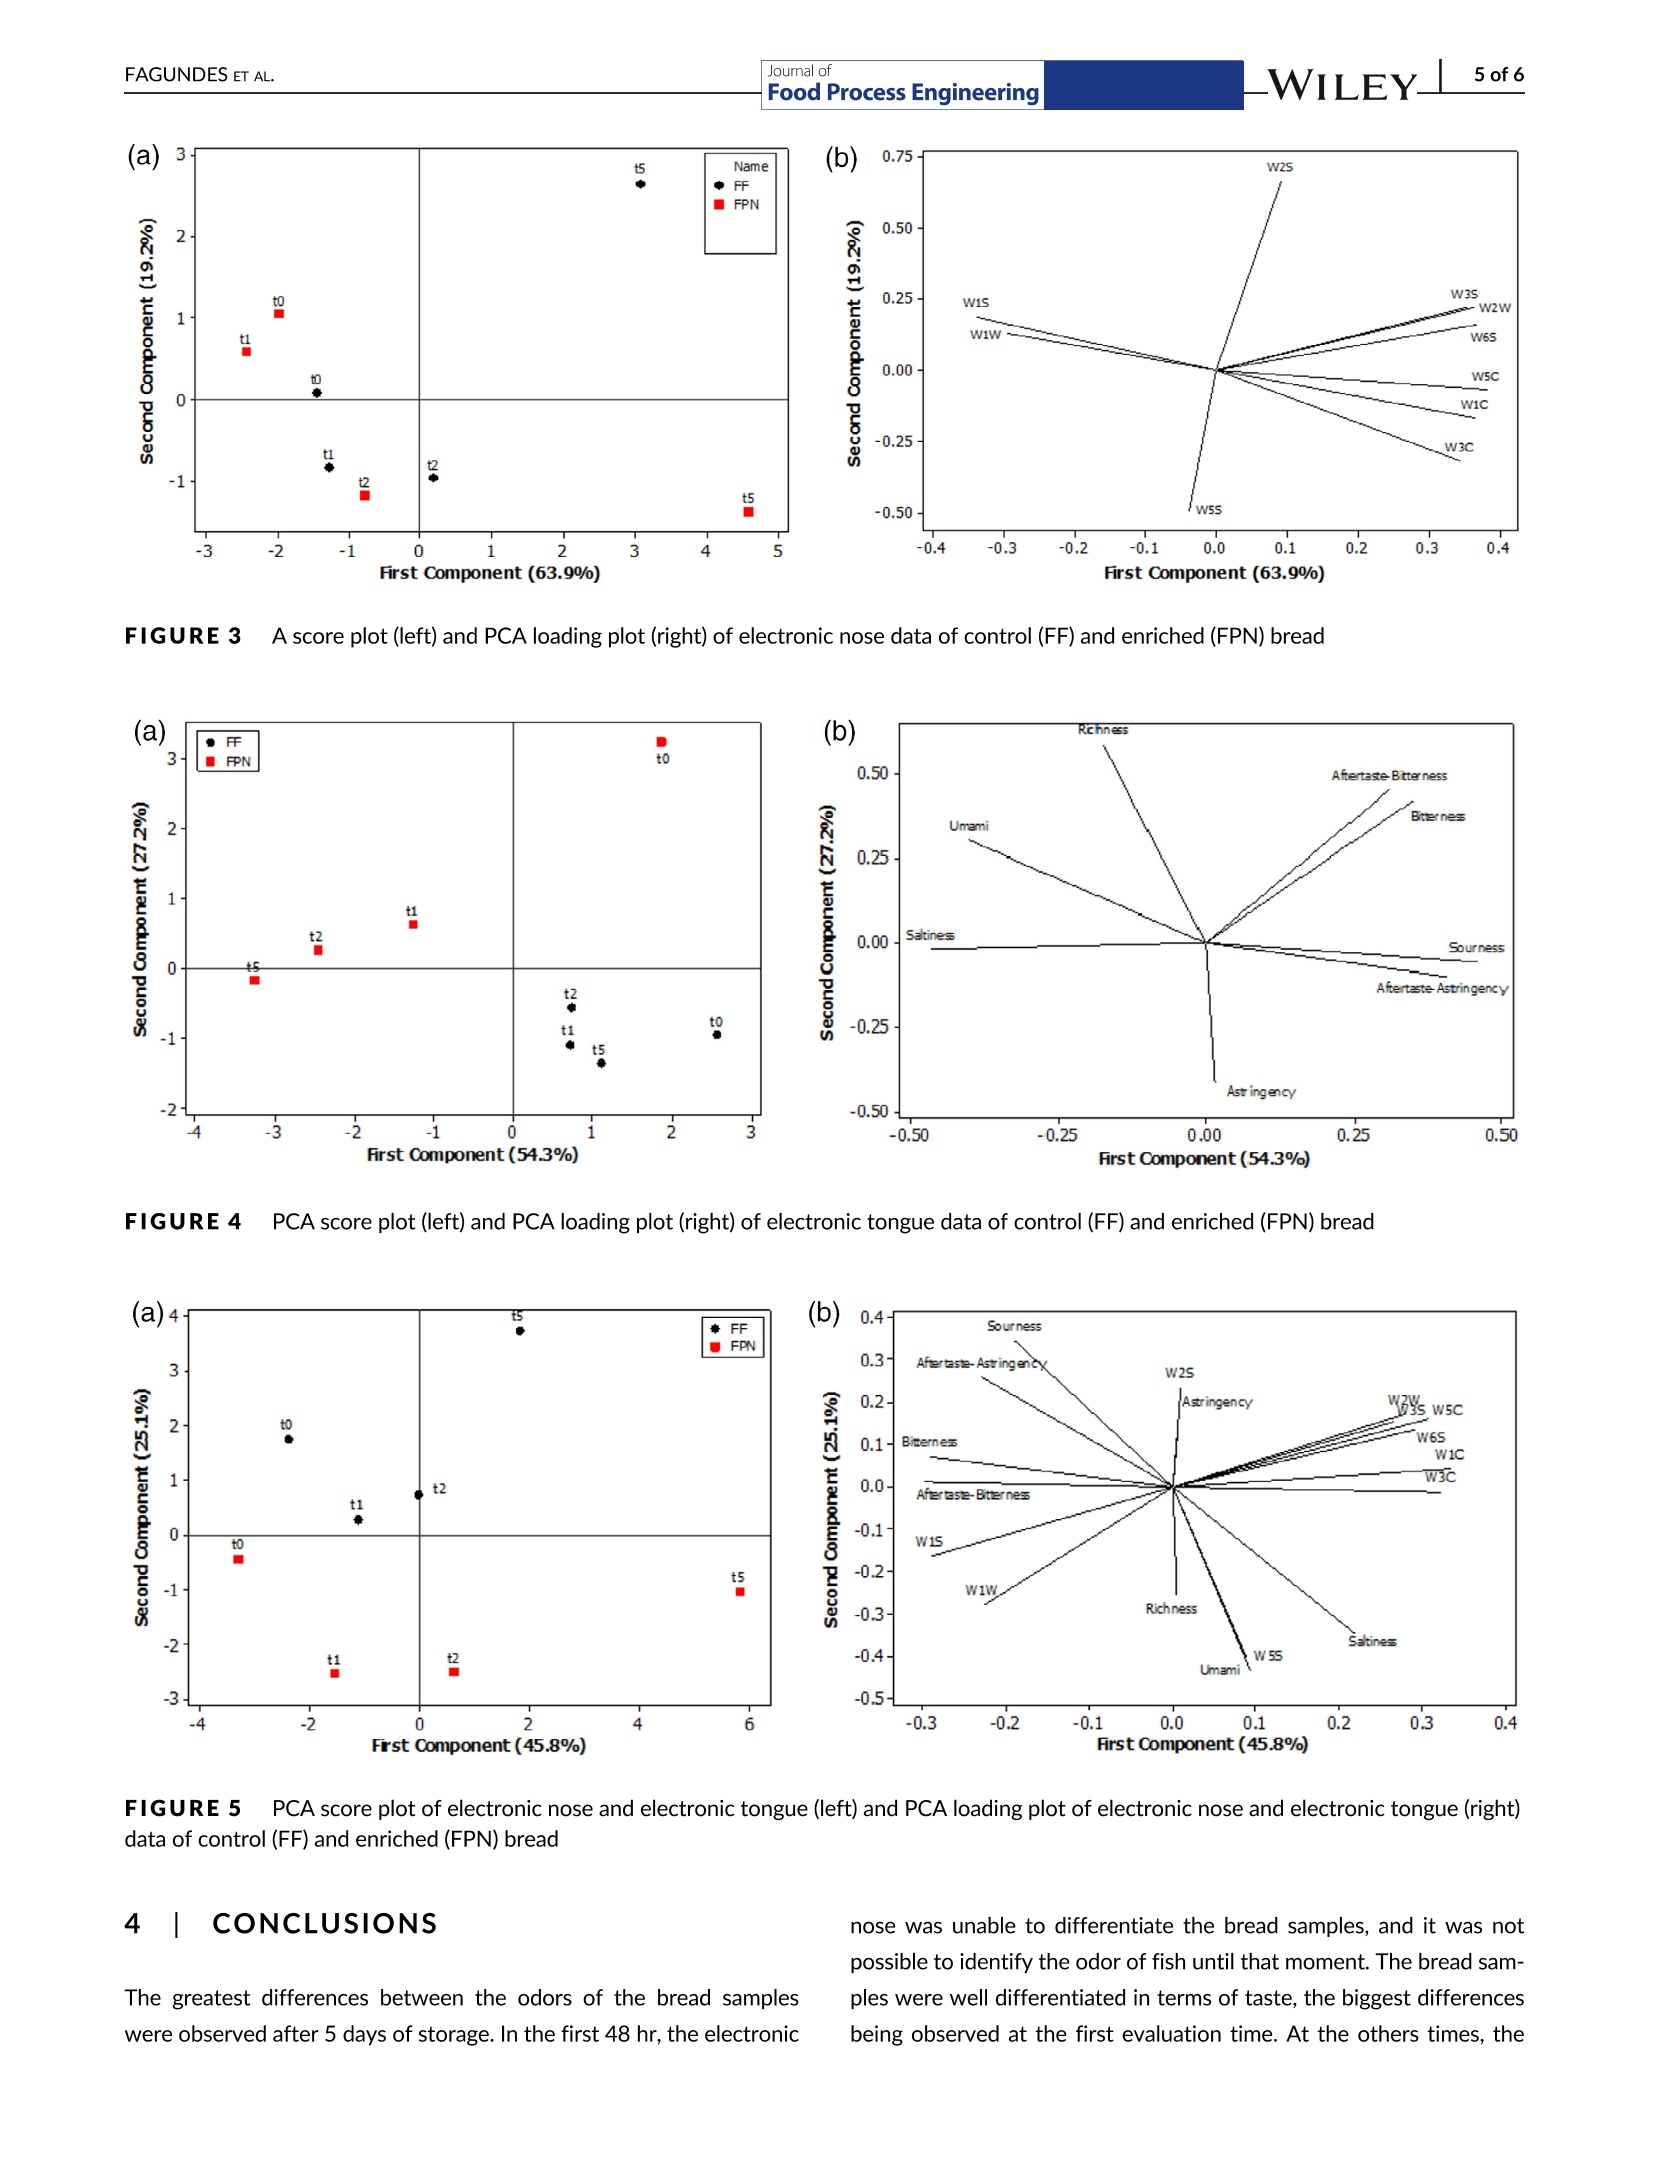
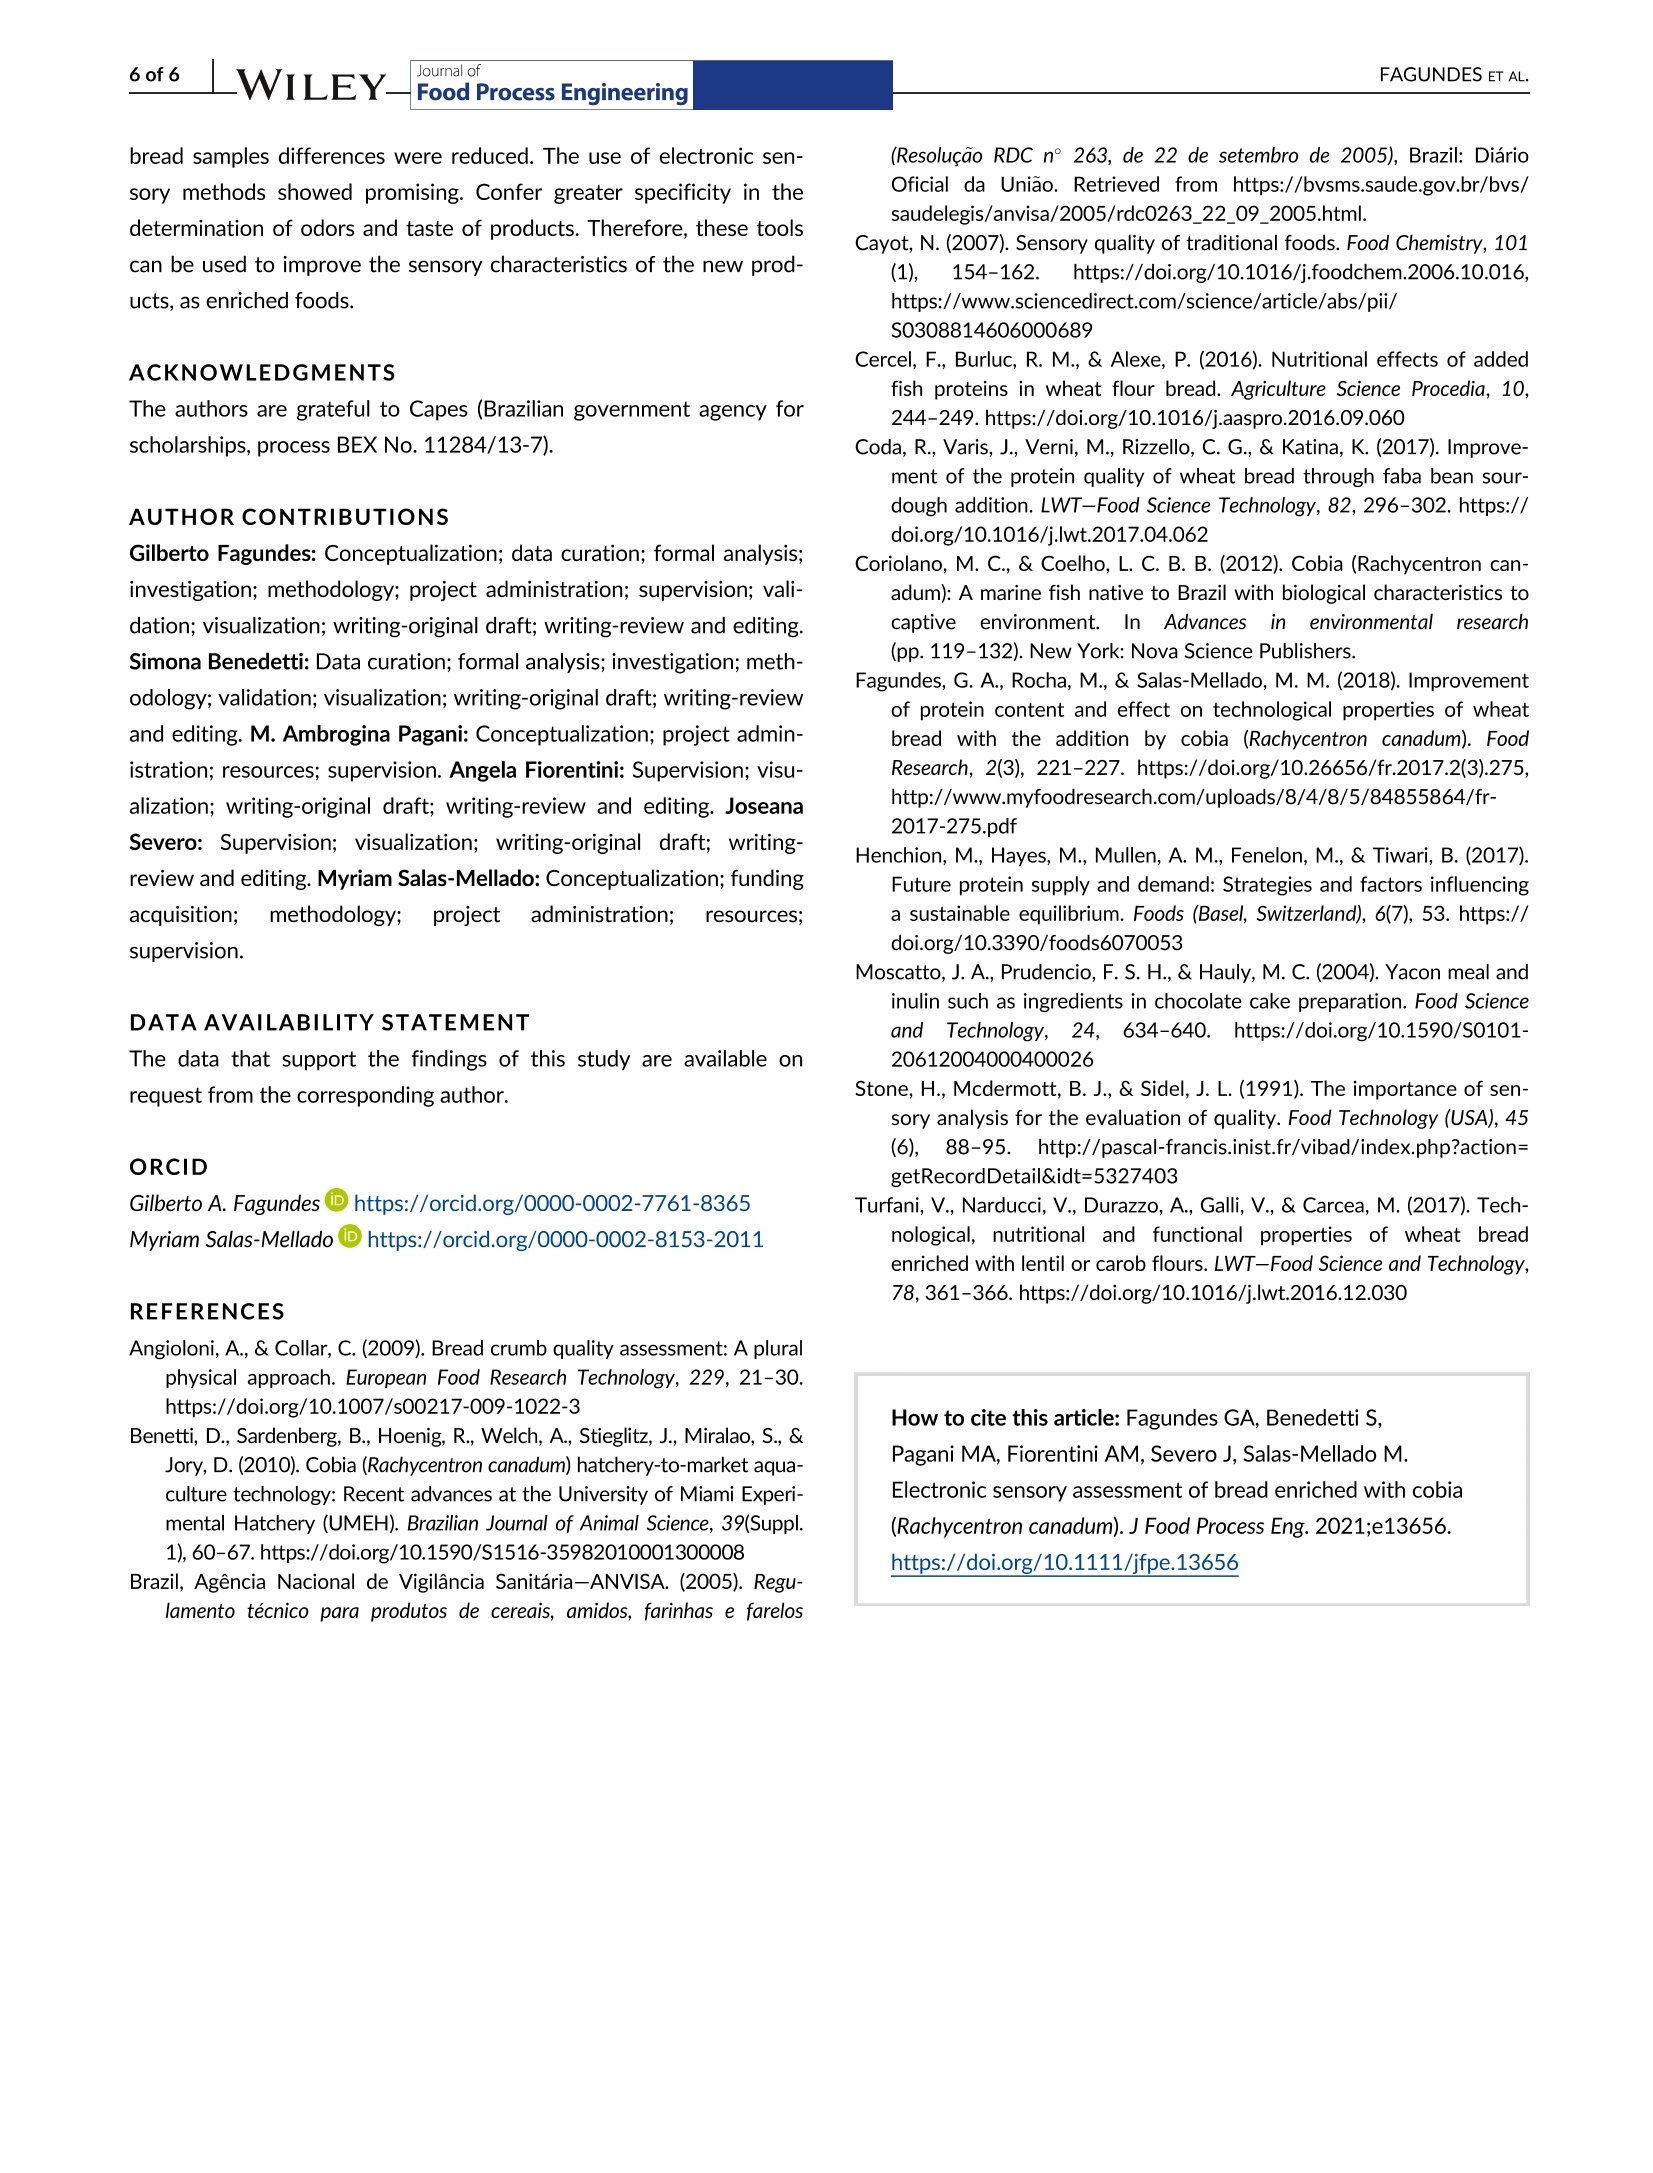
方案详情

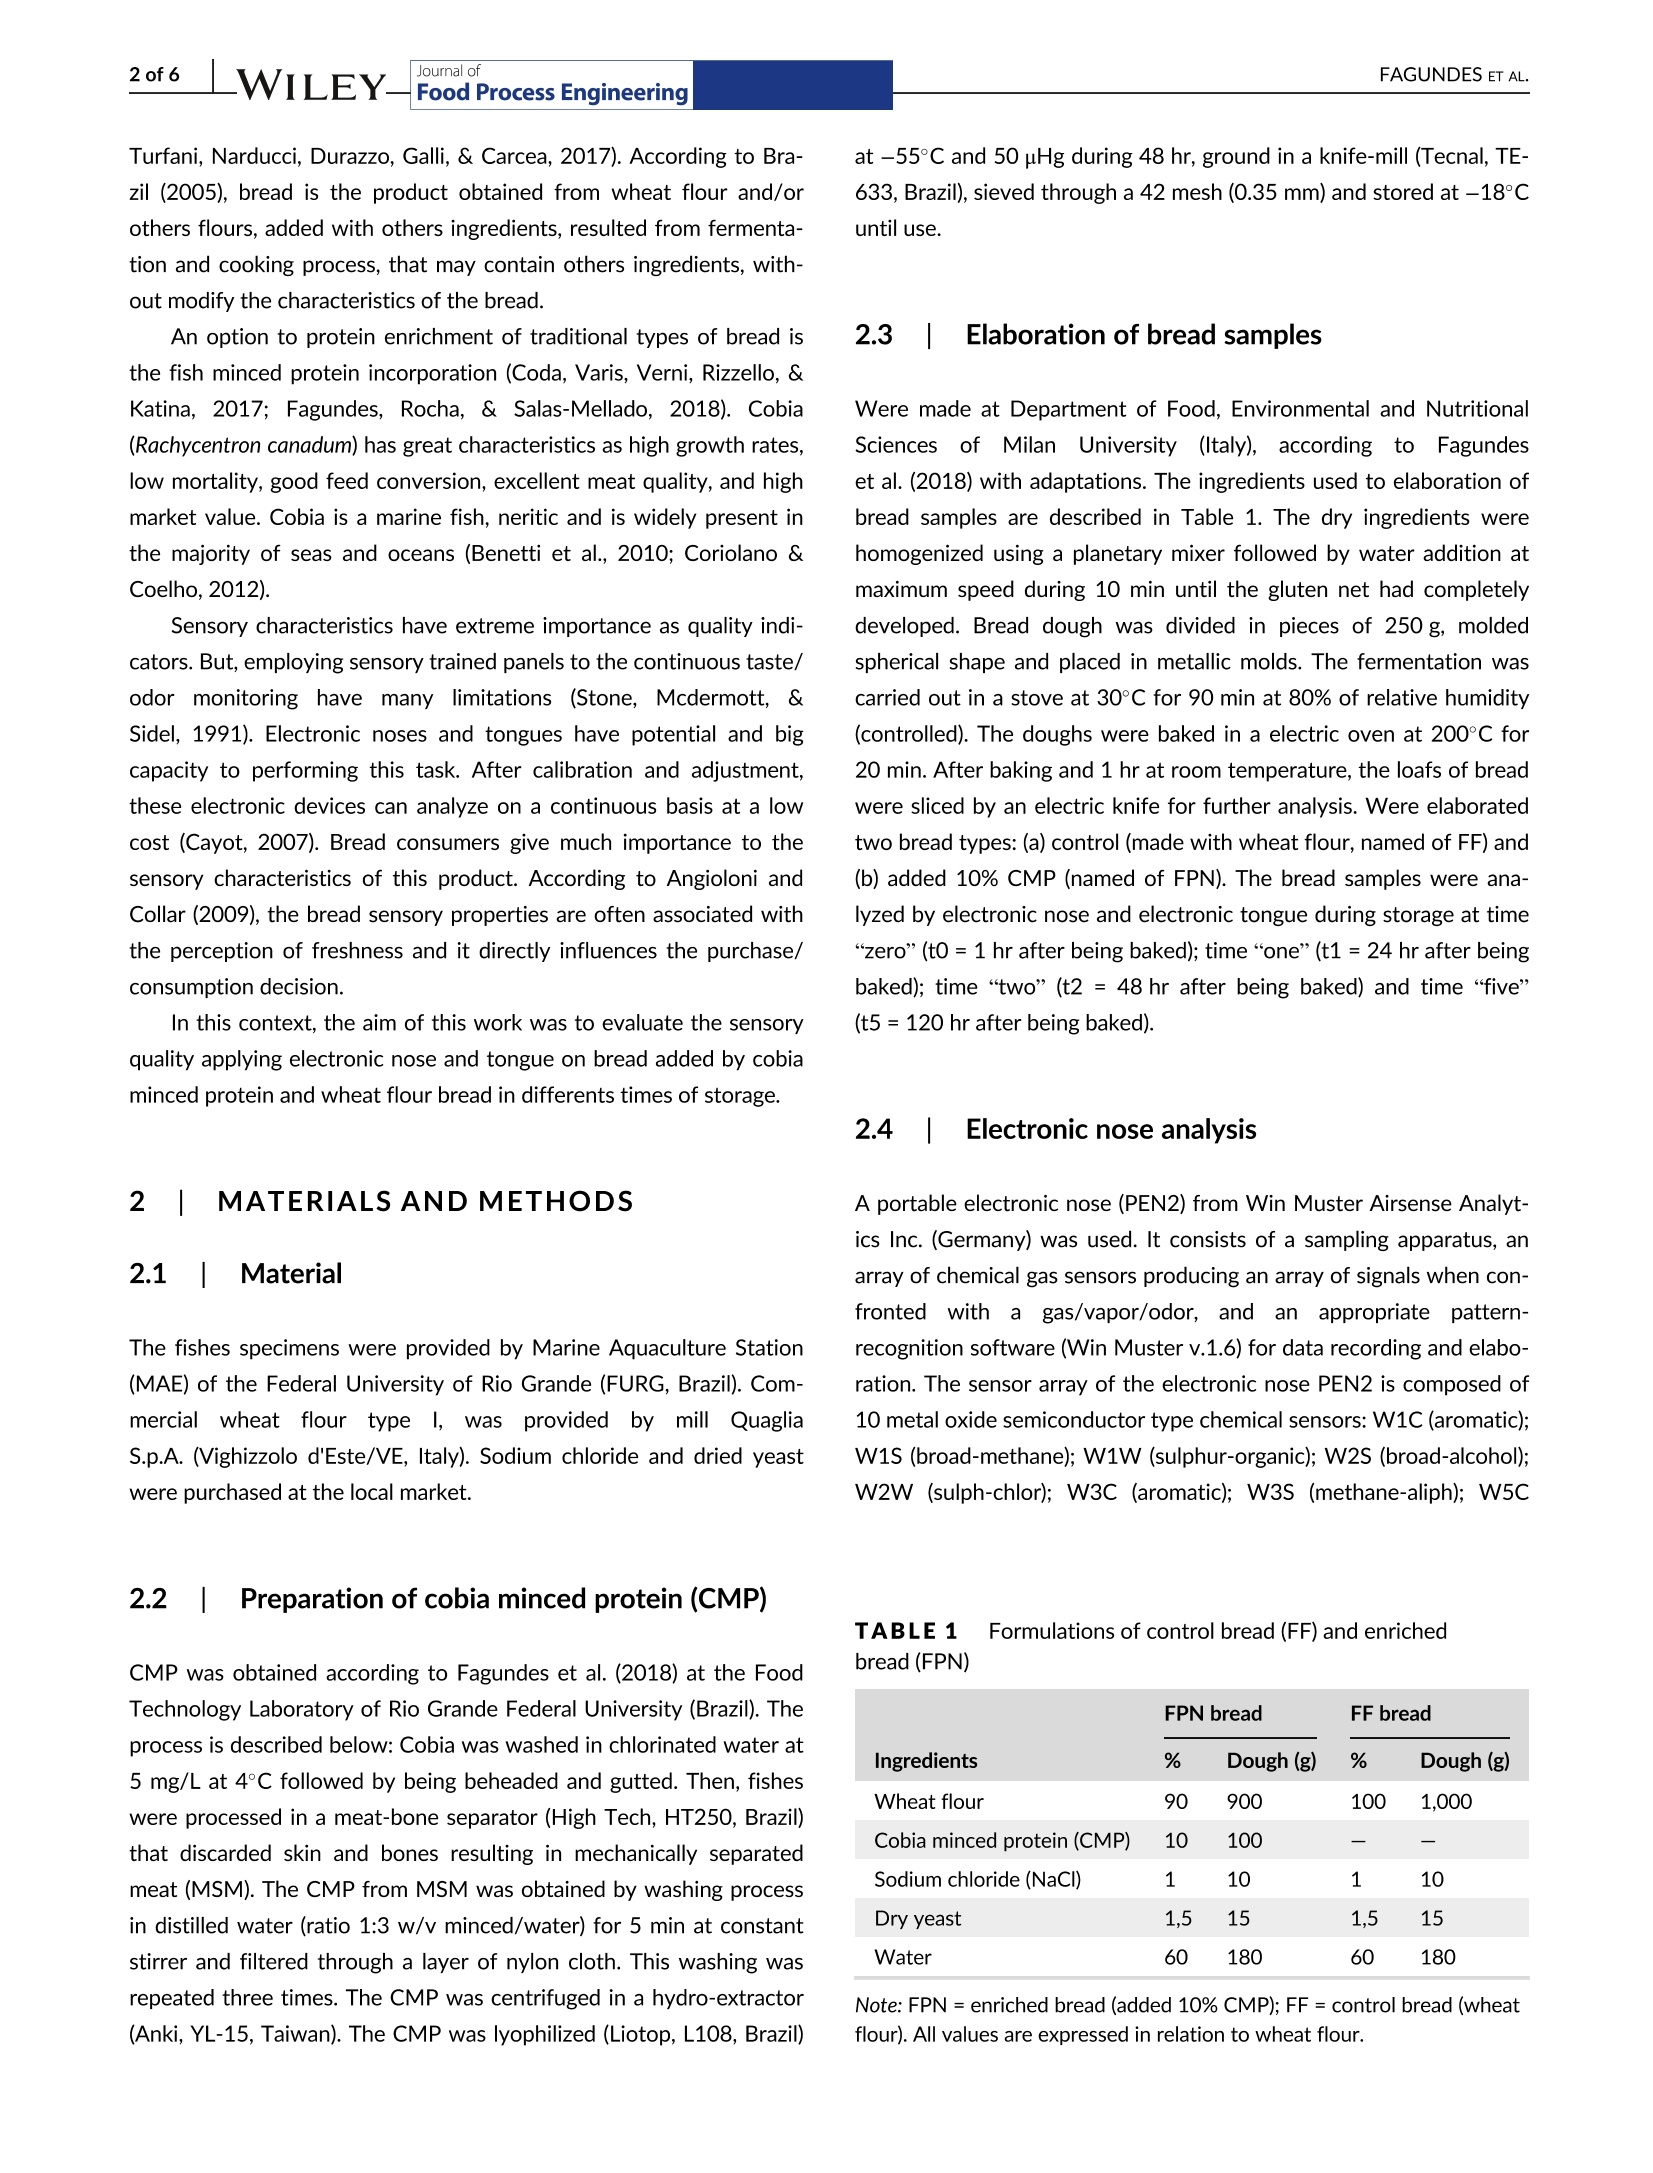
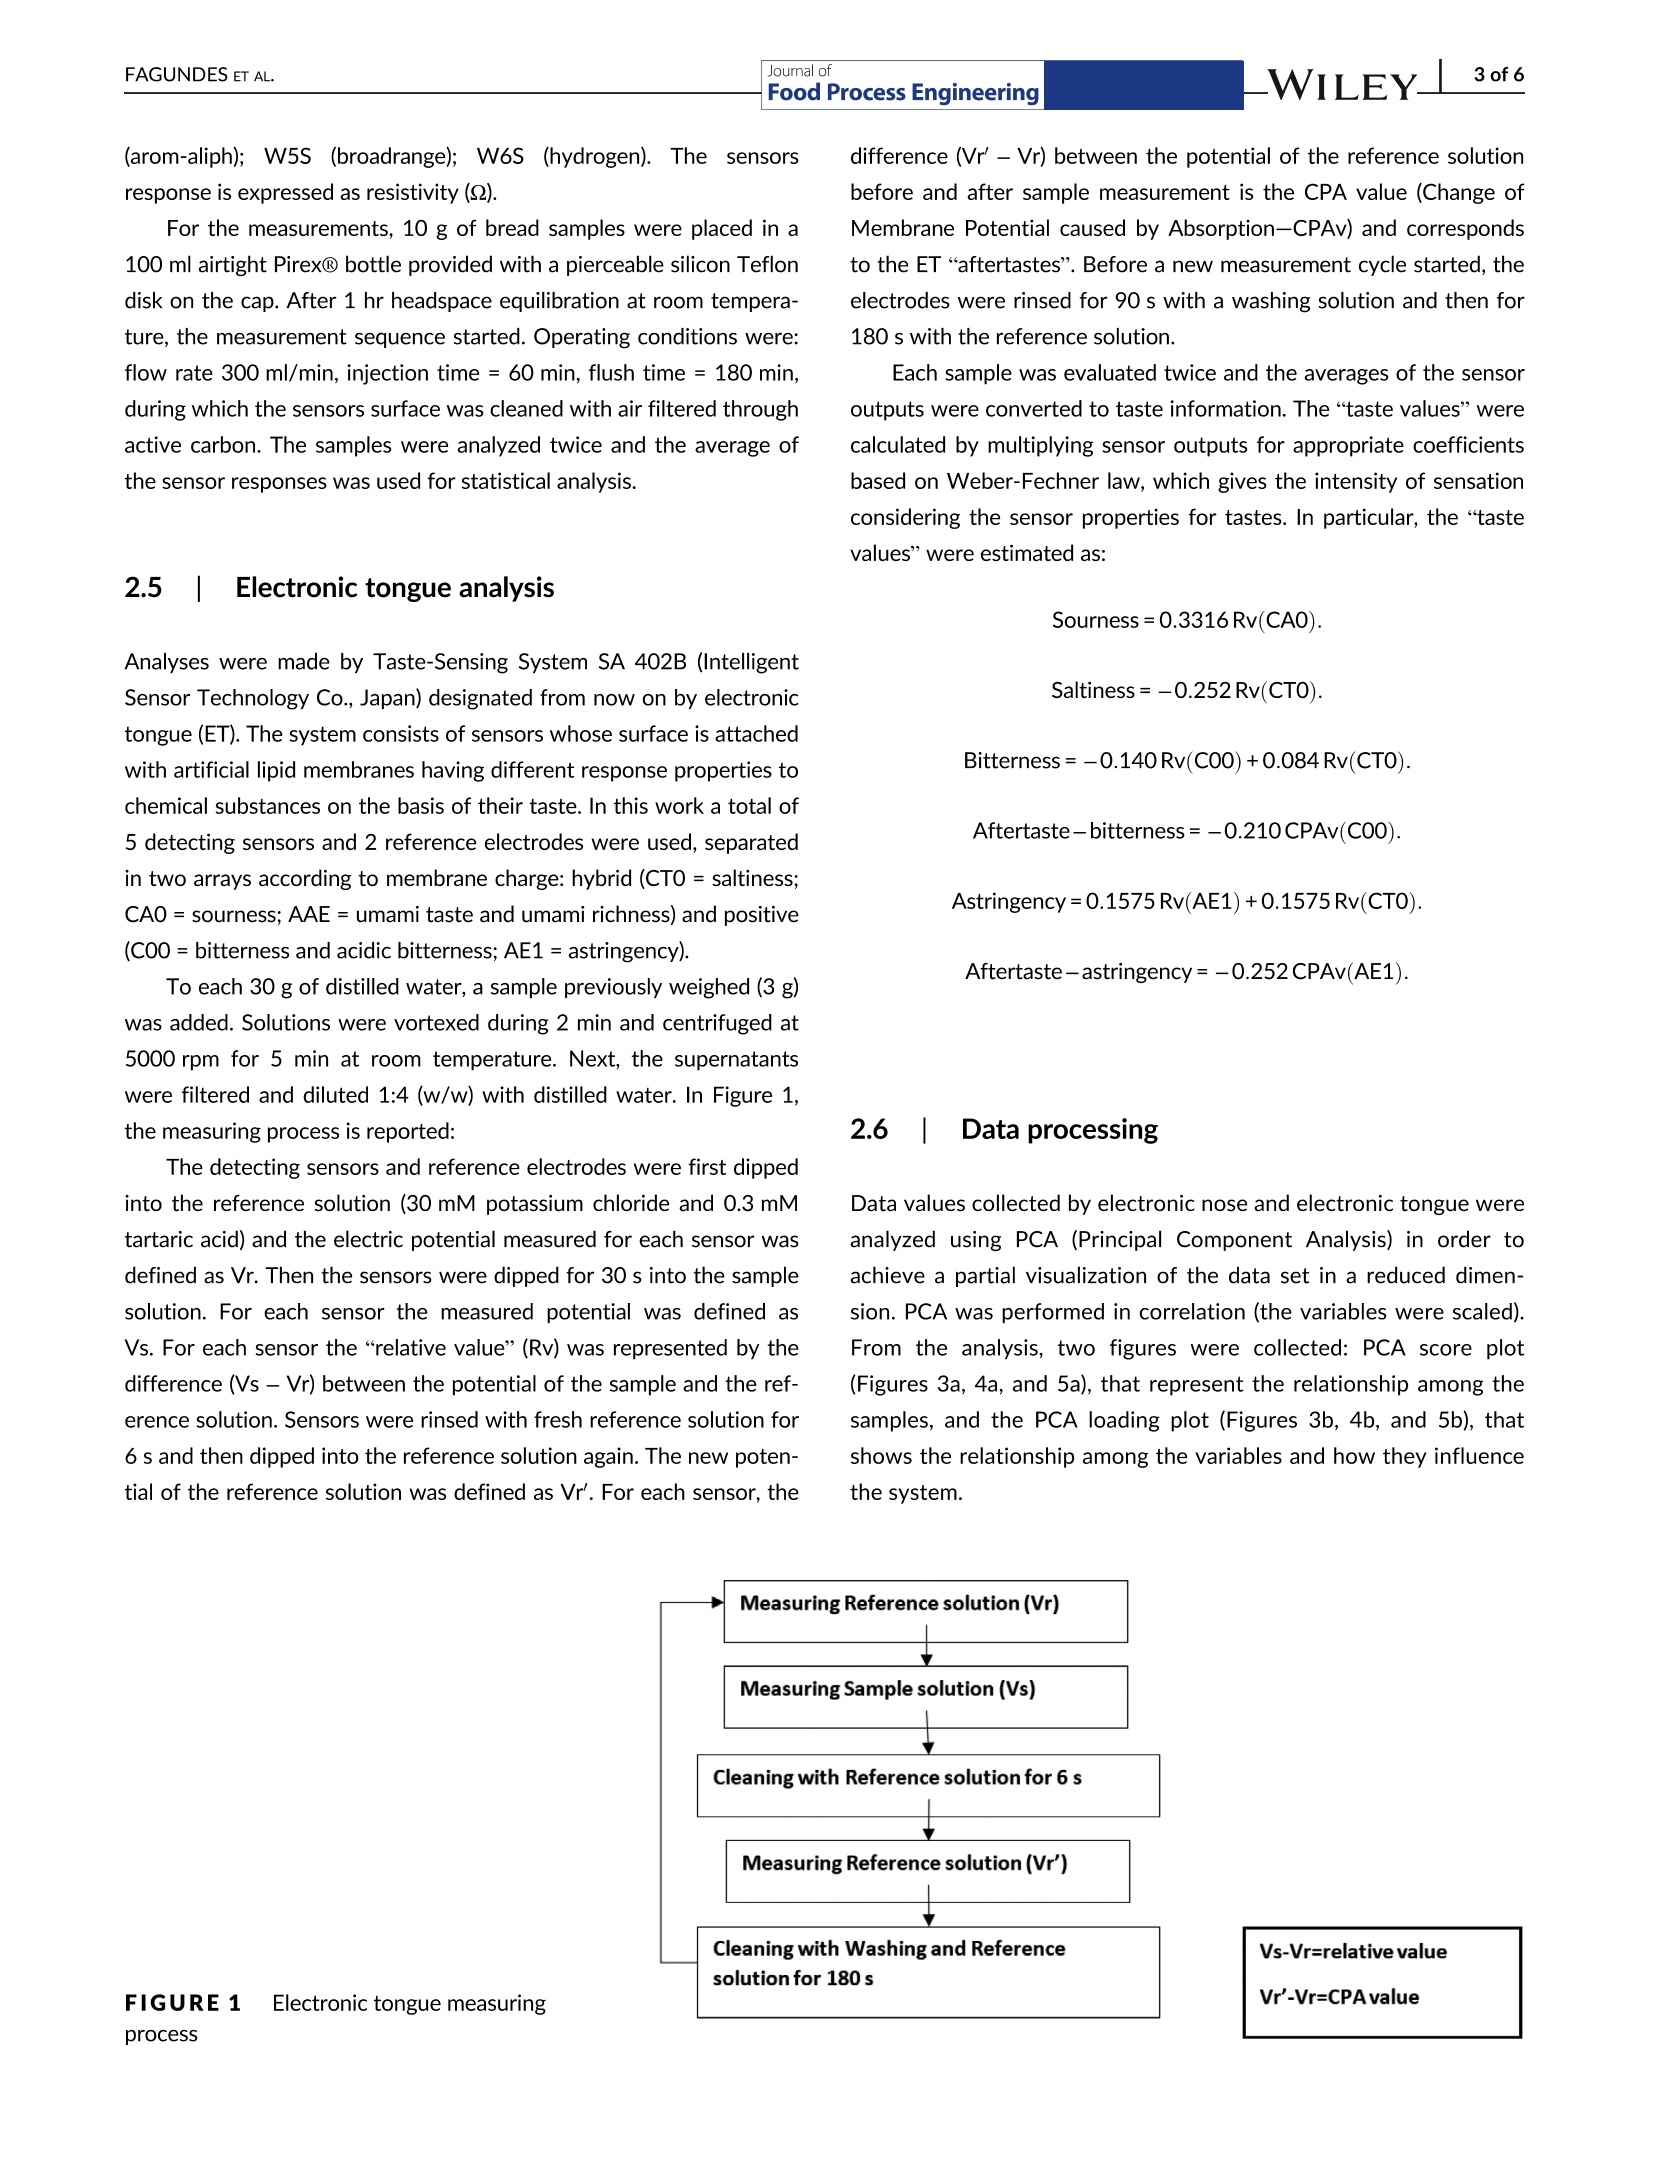
Received: 25 August 2020DOI: 10.1111/jfpe.13656Revised:15 January 2021Accepted: 17 January 2021SPECIALISSUEORIGINALARTICLE 2 of6FAGUNDES ET AL..WILEY-Journal ofFood Process Engineering O 2021 Wiley Periodicals LLC. 1 of 6J Food Process Eng. 2021;e13656. wileyonlinelibrary.com/journal/jfpehttps://doi.org/10.1111/jfpe.13656 Electronic sensory assessment of bread enriched with cobia(Rachycentron canadum) Gilberto A. Fagundes1,2,3, Simona Benedetti²MMaria A. Pagani?Angela M. Fiorentini4 Joseana Severo1Myriam Salas-Mellado Food Technology, Federal FarroupilhaInstitute (IFFar), Santo Augusto, Brazil Department of Food, Environmental,Nutritional Sciences (DeFENS), University ofMilan (UNIMI), Italy School of Chemistry and Food, FederalUniversity of Rio Grande (FURG), Brazil “Food Science and Technology Department,Federal University of Pelotas (UFPel), Brazil Correspondence Gilberto A. Fagundes, Food Technology,Federal Farroupilha Institute (IFFar), Santo Augusto,Brazil. Email:arcanjogaf@yahoo.com.br Funding information Coordenacao de Aperfeicoamento de Pessoalde Nivel Superior, Grant/Award Number: BEX11284/13-7 Abstract The aim was to evaluate the sensory quality by electronic nose (EN) and tongue(ET) of bread added by cobia minced protein in differents times of storage. Two sam-ples were elaborated: (a) control (FF-traditional bread); (b) added by 10% Cobiaminced protein (FPN). The two samples of bread were analyzed from time “zero”(1 hr after being baked) to time “five” (120 hr). A Portable EN (PEN2) composed of10 sensors was used. Operating conditions: flow rate 300 ml/min, injection time60 min, flush time 180 min. To ET (Taste-Sensing System SA402B) 5 sensors wereused. All samples were analyzed twice and the average was analyzed by PrincipalComponent Analysis, showing the relationship among the samples and the variables.The greatest differences between the odors were observed after 120 hr of storage.In the first 48 h, the EN was unable to differentiate the samples. The biggest differ-ences of taste were observed at t0. In the other evaluation times, the samplesreduced their differences. The use of electronic sensory methods showed promising.Confer greater specificity in the determination of odors and taste of products. There-fore, these tools can be used to improve the sensory characteristics of the new prod-ucts, as enriched foods. Practical Applications: Bread is a basic food of the world population, but it does notpresent a big quantity/quality protein content. Using fish protein concentrate inbread improves the nutritional quality of this product, however, in function of thephysico-chemical composition, fish and derivates may present a strong characteristicodor/taste, rejected by a large part of the population. The sensory characteristics ofa product are determining factors for the choice and purchase by the consumers.Maintaining a permanent panel of trained evaluators takes high time and continuouscosts, and is not entirely accurate. The use of technologies used by the electronicnose and tongue can assist in a greater standardization of food, especially when itinvolves the development of new products, ingredients, or differentiated raw ingredi-ents, as made in this study. 11IINTRODUCTION Proteins as others nutrients availability and supply to humanity is aserious problem in the world (Henchion, Hayes, Mullen, Fenelon, & Tiwari, 2017; Moscatto, Prudencio, & Hauly, 2004). Bread is a staplefood, consumed daily by people of all countries, and it is a way toimprove the health of some people groups by increasing the nutri-tional quality of traditional bread (Cercel, Burluc, & Alexe, 2016; Turfani, Narducci, Durazzo, Galli, & Carcea, 2017). According to Bra-zil (2005), bread is the product obtained from wheat flour and/orothers flours, added with others ingredients, resulted from fermenta-tion and cooking process, that may contain others ingredients, with-out modify the characteristics of the bread. An option to protein enrichment of traditional types of bread isthe fish minced protein incorporation (Coda, Varis, Verni, Rizzello, &Katina, 2017; Fagundes, Rocha, & Salas-Mellado, 2018). Cobia(Rachycentron canadum) has great characteristics as high growth rates,low mortality, good feed conversion, excellent meat quality, and highmarket value. Cobia is a marine fish, neritic and is widely present inthe majority of seas and oceans (Benetti et al., 2010; Coriolano &Coelho,2012). Sensory characteristics have extreme importance as quality indi-cators. But, employing sensory trained panels to the continuous taste/odor monitoring have many limitations (Stone, Mcdermott, &Sidel, 1991). Electronic noses and tongues have potential and bigcapacity to performing this task. After calibration and adjustment,these electronic devices can analyze on a continuous basis at a lowcost (Cayot, 2007). Bread consumers give much importance to thesensory characteristics of this product. According to Angioloni andCollar (2009), the bread sensory properties are often associated withthe perception of freshness and it directly influences the purchase/consumption decision. In this context, the aim of this work was to evaluate the sensoryquality applying electronic nose and tongue on bread added by cobiaminced protein and wheat flour bread in differents times of storage. 21 MATERIALS AND METHODS 2.1 Material The fishes specimens were provided by Marine Aquaculture Station(MAE) of the Federal University of Rio Grande (FURG, Brazil). Com-mercial wheat flour type I, was provided by mill QuagliaS.p.A. (Vighizzolo d'Este/VE, Italy). Sodium chloride and dried yeastwere purchased at the local market. 2.2 Preparation of cobia minced protein (CMP) CMP was obtained according to Fagundes et al. (2018) at the FoodTechnology Laboratory of Rio Grande Federal University (Brazil). Theprocess is described below: Cobia was washed in chlorinated water at5 mg/L at 4°C followed by being beheaded and gutted. Then, fisheswere processed in a meat-bone separator (High Tech, HT250, Brazil)that discarded skin and bones resulting in mechanically separatedmeat (MSM). The CMP from MSM was obtained by washing processin distilled water (ratio 1:3 w/v minced/water) for 5 min at constantstirrer and filtered through a layer of nylon cloth. This washing wasrepeated three times. The CMP was centrifuged in a hydro-extractor(Anki, YL-15, Taiwan). The CMP was lyophilized (Liotop, L108, Brazil) at -55°C and 50 uHg during 48 hr, ground in a knife-mill (Tecnal, TE-633,Brazil), sieved through a 42 mesh (0.35 mm) and stored at -18Cuntil use. 2.3 Elaboration of bread samples Were made at Department of Food, Environmental and NutritionalSciences of Milan University (ltaly), according to Fagundeset al. (2018) with adaptations. The ingredients used to elaboration ofbread samples are described in Table 1. The dry ingredients werehomogenized using a planetary mixer followed by water addition atmaximum speed during 10 min until the gluten net had completelydeveloped. Bread dough was divided in pieces of 250 g, moldedspherical shape and placed in metallic molds. The fermentation wascarried out in a stove at 30°C for 90 min at 80% of relative humidity(controlled). The doughs were baked in a electric oven at 200°C for20 min. After baking and 1 hr at room temperature, the loafs of breadwere sliced by an electric knife for further analysis. Were elaboratedtwo bread types: (a) control (made with wheat flour, named of FF) and(b) added 10% CMP (named of FPN). The bread samples were ana-lyzed by electronic nose and electronic tongue during storage at time“zero”(t0=1 hr after being baked); time“one”(t1=24 hr after beingbaked); time “two”(t2= 48 hr after being baked) and time “five”(t5= 120 hr after being baked). 2.4 Electronic nose analysis A portable electronic nose (PEN2) from Win Muster Airsense Analyt-ics Inc. (Germany) was used. It consists of a sampling apparatus, anarray of chemical gas sensors producing an array of signals when con-fronted with a gas/vapor/odor, and12an appropriate pattern-recognition software (Win Muster v.1.6) for data recording and elabo-ration.The sensor array of the electronic nose PEN2 is composed of10 metal oxide semiconductor type chemical sensors: W1C (aromatic);W1S (broad-methane); W1W (sulphur-organic); W2S (broad-alcohol);W2W (sulph-chlor); W3C (aromatic); W3S (methane-aliph); W5C TABLE 1 Formulations of control bread (FF) and enrichedbread (FPN) FPN bread FF bread Ingredients % Dough (g) % Dough (g) Wheat flour 90 900 100 1,000 Cobia minced protein (CMP) 10 100 一 Sodium chloride (NaCl) 1 10 1 10 Dry yeast 1,5 15 1,5 15 Water 60 180 60 180 Note: FPN= enriched bread (added 10% CMP); FF= control bread (wheatflour). All values are expressed in relation to wheat flour. (arom-aliph);W5SS (broadrange);; W6S (hydrogen). The sensorsresponse is expressed as resistivity (Q). For the measurements, 10 g of bread samples were placed in a100 ml airtight Pirex@ bottle provided with a pierceable silicon Teflondisk on the cap. After 1 hr headspace equilibration at room tempera-ture, the measurement sequence started. Operating conditions were:flow rate 300 ml/min, injection time = 60 min, flush time = 180 min,during which the sensors surface was cleaned with air filtered throughactive carbon. The samples were analyzed twice and the average ofthe sensor responses was used for statistical analysis. 2.5 Electronic tongue analysis Analyses were made by Taste-Sensing System SA 402B (IntelligentSensor Technology Co., Japan) designated from now on by electronictongue (ET). The system consists of sensors whose surface is attachedwith artificial lipid membranes having different response properties tochemical substances on the basis of their taste. In this work a total of5 detecting sensors and 2 reference electrodes were used, separatedin two arrays according to membrane charge: hybrid (CTO=saltiness;CA0 = sourness; AAE = umami taste and umami richness)and positive(CO0=bitterness and acidic bitterness; AE1=astringency). To each 30 g of distilled water, a sample previously weighed (3 g)was added. Solutions were vortexed during 2 min and centrifuged at5000 rpm for 5 min at room temperature. Next, the supernatantswere filtered and diluted 1:4 (w/w) with distilled water. In Figure 1,the measuring process is reported: The detecting sensors and reference electrodes were first dippedinto the reference solution (30 mM potassium chloride and 0.3 mMtartaric acid) and the electric potential measured for each sensor wasdefined as Vr. Then the sensors were dipped for 30 s into the samplesolution. For each sensor the measured potential was defined asVs. For each sensor the “relative value”(Rv) was represented by thedifference (Vs -Vr) between the potential of the sample and the ref-erence solution. Sensors were rinsed with fresh reference solution for6 s and then dipped into the reference solution again. The new poten-tial of the reference solution was defined as Vr'. For each sensor, the difference (Vr’-Vr) between the potential of the reference solutionbefore and after sample measurement is the CPA value (Change ofMembrane Potential caused by Absorption-CPAv) and correspondsto the ET“aftertastes”. Before a new measurement cycle started, theelectrodes were rinsed for 90 s with a washing solution and then for180 s with the referencesolution. Each sample was evaluated twice and the averages of the sensoroutputs were converted to taste information. The“taste values”werecalculated by multiplying sensor outputs for appropriate coefficientsbased on Weber-Fechner law, which gives the intensity of sensationconsidering the sensor properties for tastes. In particular, the “tastevalues”were estimated as: Sourness=0.3316Rv(CA0). Saltiness=-0.252 Rv(CTO). Bitterness=-0.140Rv(C00)+0.084Rv(CTO). Aftertaste-bitterness=-0.210CPAv(C00). Astringency=0.1575Rv(AE1)+0.1575Rv(CTO). Aftertaste-astringency=-0.252CPAv(AE1). 2.6 Data processing Data values collected by electronic nose and electronic tongue wereanalyzed using PCA (Principal Component Analysis) in order toachieve a partial visualization of the data set in a reduced dimen-sion. PCA was performed in correlation (the variables were scaled).From the analysis, two figures were collected: PCA score plot(Figures 3a, 4a, and 5a), that represent the relationship among thesamples, and the PCA loading plot (Figures 3b, 4b, and 5b), thatshows the relationship among the variables and how they influencethe system. Vs-Vr=relative valueVr'-Vr=CPAvalue 3 RESULTS AND DISCUSSION Figure 2 shows the bread samples elaborated. Electronic nose andtongue were applied in order to evaluate the aroma and taste evolu-tion of bread samples during storage. Figure 3a shows the PCA scoreplot (representing the samples distribution) and 3b loading plot (rep-resenting the variable distribution) of the data collected by theelectronic nose. By examining the score plot (Figure 3a) that represents the sam-ples distribution in the area defined by the first two PCs that explainthe 83.1% of total variance, an evolution of the bread samples alongthe first and second component according to storage time was found.After 5 days of storage, the electronic nose was able to discriminatethe two different type of bread samples. Considering the loading plot (Figure 3b) showing the relationshipbetween the electronic nose variables and how they influence thesystem, it is clear that W1S and W1W sensors are important for sam-ples at the beginning of the storage, while the WC sensors, W6S,W3S and W1W are relevant for discrimination of the samples at theend of the storage (t5). Bread sample denominated FF (control bread)at time 5 are characterized especially by the W2S sensor. Figure 4a,b shows the PCA score plot and loading plot of the“taste values”collected by electronic tongue. By examining the scoreplot (Figure 4a) it evident a clear separation of the two type of bread(FF andFPN) on the first (PC1) and second (PC2) Principal Component(81.5% total variance explained). FF samples, clustered in the positivepart of PC1, are well discriminated by FPN samples located in the positive part of PC2 and distributed on PC1 from right to leftaccording to their storage time. Considering the loading plot (Figure 4b), it is evident that FF sam-ples are characterized by sourness,astringency and aftertaste astrin-gency and are perceived as less bitter and salty. At the beginning ofstorage (t0) the FPN sample is characterized by bitterness and after-taste bitterness, during storage the taste of FPN samples evolves, thebitterness decreases and saltiness and umami are more perceived. In order to obtain a more exhaustive characterization and differ-entiation of the two types of bread, data obtained by electronic noseand electronic tongue were jointly elaborated by PCA. The score andloading plots in the plane defined by PC1 and PC2 (70.9% total vari-ance explained) are shown in Figure 5a,b. In the score plot (Figure 5a),a clear separation between FF and FPN samples can be observed onPC2; moreover samples are discriminated according to their storagetime along PC1 moving from left to right. From the loading plot (Figure 5b), it can be observed that elec-tronic nose sensors are mainly positioned along PC1 together withbitterness and aftertaste bitterness, whereas umami, astringency andsourness are predominant on PC2. Considering the sample and vari-able distribution on the plots, FPN samples located in the negativepart of PC2 are characterized by the saltiness and umami taste and byWW1 and WS (W1S, W5S) electronic nose sensors. FF samples arelocated in the positive part of PC2 and are characterized by astringentsensation and by sourness; on PC1 the electronic nose sensors andthe bitter taste are dominant in the discrimination of samplesaccording to their storage time. FIGURE 3 A score plot (left) and PCA loading plot (right) of electronic nose data of control (FF) and enriched (FPN) bread FIGURE 4 PCA score plot (left) and PCA loading plot (right) of electronic tongue data of control (FF) and enriched (FPN) bread FIGURE 5 PCA score plot of electronic nose and electronic tongue (left) and PCA loading plot of electronic nose and electronic tongue (right)data of control (FF) and enriched (FPN) bread 4 CONCLUSIONS The greatest differences between the odors of the bread sampleswere observed after 5 days of storage. In the first 48 hr, the electronic nose was unable to differentiate the bread samples, and it was notpossible to identify the odor of fish until that moment. The bread sam-ples were well differentiated in terms of taste, the biggest differencesbeing observed at the first evaluation time. At the others times, the bread samples differences were reduced. The use of electronic sen-sory methods showed promising. Confer greater specificity in thedetermination of odors and taste of products. Therefore, these toolscan be used to improve the sensory characteristics of the new prod-ucts, as enriched foods. ACKNOWLEDGMENTS The authors are grateful to Capes (Brazilian government agency forscholarships, process BEX No.11284/13-7). AUTHOR CONTRIBUTIONS Gilberto Fagundes: Conceptualization; data curation; formal analysis;investigation; methodology; project administration; supervision; vali-dation; visualization; writing-original draft; writing-review and editing.Simona Benedetti: Data curation; formal analysis; investigation;meth-odology; validation; visualization; writing-original draft; writing-reviewand editing. M. Ambrogina Pagani: Conceptualization; project admin-istration; resources; supervision. Angela Fiorentini: Supervision; visu-alization; writing-original draft; writing-review and editing. JoseanaSevero: Supervision; visualization; writing-original draft; writing-review and editing. Myriam Salas-Mellado: Conceptualization; fundingacquisition; methodology; project administration; resources;supervision. DATAAVAILABILITY STATEMENT The data that support the findings of this study are available onrequest from the corresponding author. ORCID REFERENCES ( Angioloni, A., & Collar, C. (2009). Bread crumb quality assessment: A pluralphysical approach. European Food R esearch T echnology, 229, 2 1-30. https://doi.org/10.1007/s00217-009-1022-3 ) ( Benetti, D ., S ardenberg, B., Hoenig, R., Welch, A., Stieglitz, J., Miralao, S. , &Jory, D. (2010). Cobia (Rachycentron canadum) hatchery-to-market aqua-culture technology: Recent a dvances at the University o f M iami Experi-mental Hatchery (UMEH). Brazilian Journal o f Animal S c ience, 39(Suppl. 1),60-67.https://doi.org/10.1590/S1516-35982010001300008 ) ( Brazil, Agencia Nacional de V i gilancia S a nitaria-ANVISA. (20 0 5). Reg u - lamento t e cnico p ara p r odutos d e ce r eais, a m idos, f a rinhas e farelos ) ( ( Resolucao RDC n° 2 6 3, d e 22 de se t embro de 20 0 5), Brazil: Diario O ficial da Uniao. Re trieved f r om ht t ps://bvsms.saude.gov.br/bvs/ saudelegis/anvisa/2005/rdc0263_22_09_2005.html. ) ( Cayot, N. (2007). Sensory quality of t r aditional foods.Food Chemistry, 101 (1), 154-162. h ttps://doi.org/10.1016/j.foodchem.2006.10.016,https://www.sciencedirect.com/science/article/abs/pii/ S0308814606000689 ) ( Cercel, F ., Burluc, R. M., & Alexe, P . (2016). N u tritional e f fects o f added fish proteins in wheat flour bread. Agriculture S cience P rocedia, 1 0, 244-249. https://doi.org/10.1016/j.aaspro.2016.09.060 ) ( Coda, R . , Varis, J., V erni, M., Rizzello, C . G . , & Katina, K. (2017). Improve- m ent of the protein quality of wheat bread through f a ba bean so u r- dough addition. LWT-Food Science Technology, 8 2, 296-302. https:// doi.org/10.1016/j.lwt.2017.04.062 ) ( Coriolano, M. C ., & Coelho, L . C. B . B. (2012). Cobia (Rachycentron can- adum): A m a rine fish n a tive to B r azil with biological characteristics tocaptive environment. In A dvances in environmental research (pp. 119-132). N ew York: Nova Science Publishers. ) ( Fagundes, G. A., Rocha, M ., & Salas-Mellado, M . M. (2018). Improvement of p rotein c ontent and e f fect on technological properties of wheat bread w ith t he addition b y c o bia (Rachycentron c a nadum). Food R esearch, 2 (3), 2 21-227. https://doi.org/10.26656/fr.2017.2( 3 ).275, http://www.myfoodresearch.com/uploads/8/4/8/5/84855864/fr-2017-275.pdf ) ( Henchion, M . , H a yes, M., M u llen, A. M., Fenelon, M. , & Tiwari, B. (2017). F uture p rotein s upply a nd demand: Strategies and factors i n fluencing a s ustainable e q uilibrium. Foods (Basel, Sw i tzerland), 6( 7 ), 53 . https:// doi.org/10.3390/foods6070053 ) ( M oscatto, J. A., Prudencio, F. S . H., & Hauly, M . C. (2004). Yacon meal and i nulin such a s i ngredients i n chocolate cake p r eparation. Food Sc i ence and Technology, 24. 634-640. h ttps://doi.org/10.1590/S0101- 20612004000400026 ) ( S tone, H ., Mcdermott, B . J., & Sidel, J . L.(1991). The importance of sen-sory analysis for the evaluation of quality. Food Technology (USA), 45 (6), 88-95. h ttp://pascal-francis.inist.fr/vibad/index.php?action=getRecordDetail&idt=5327403 ) ( T urfani, V., Narducci,V., D u razzo, A., Galli, V., & Carcea, M. (2017). Tec h - n ological, nutritiona l and f unctional p roperties of wh eat breadenriched with lentil or carob flours. LWT-Food Science a nd Technology, 7 8, 361-366. https://doi.org/10.1016/j.lwt.2016.12.030 ) 目的是通过电子鼻(EN)和舌(ET)对添加军曹鱼蛋白的面包在不同贮藏时间下的感官品质进行评价。阐述了两个样品:(a)对照(ff -传统面包);(b)添加10%军曹鱼蛋白(FPN)。从“0”时间(烘烤后1小时)到“5”时间(120小时)对两个面包样本进行分析。采用由10个传感器组成的便携式EN (PEN2)。操作条件:流速300 ml/min,进样时间60 min,冲洗时间180 min。ET (Taste-Sensing System SA402B)使用了5个传感器。所有样本进行两次分析,平均由Principal分析成分分析,显示样本和变量之间的关系。储存120小时后,气味差异最大。在前48 h, EN不能区分样品。味觉差异最大的是t0。在其他的评估时间,样本减少了他们的差异。电子传感方法的应用显示出了前景。使产品的气味和味道的测定具有更大的特异性。因此,这些工具可以用来改善新产品的感官特性。
确定
还剩4页未读,是否继续阅读?

产品配置单

北京盈盛恒泰科技有限责任公司为您提供《面包中感官评估检测方案(感官智能分析)》,该方案主要用于糕点/月饼/粽子中营养成分检测,参考标准--,《面包中感官评估检测方案(感官智能分析)》用到的仪器有德国AIRSENSE品牌PEN3电子鼻、日本INSENT味觉分析系统(电子舌)
相关方案
更多
该厂商其他方案
更多