


方案详情
文
采用立陶宛Ekspla公司的Ekspla NL640 型二倍频SHG调QNd: YAG激光器。脉冲宽度10ns。波长532 nm. 重复频率200 Hz。聚焦光腰直径20μm.焦点处光功率密度可达113MW/cm^2。采用Z扫描技术对掺镧TiO2纳米阵列的线性和非线性光学响应特性进行了实验研究。
方案详情

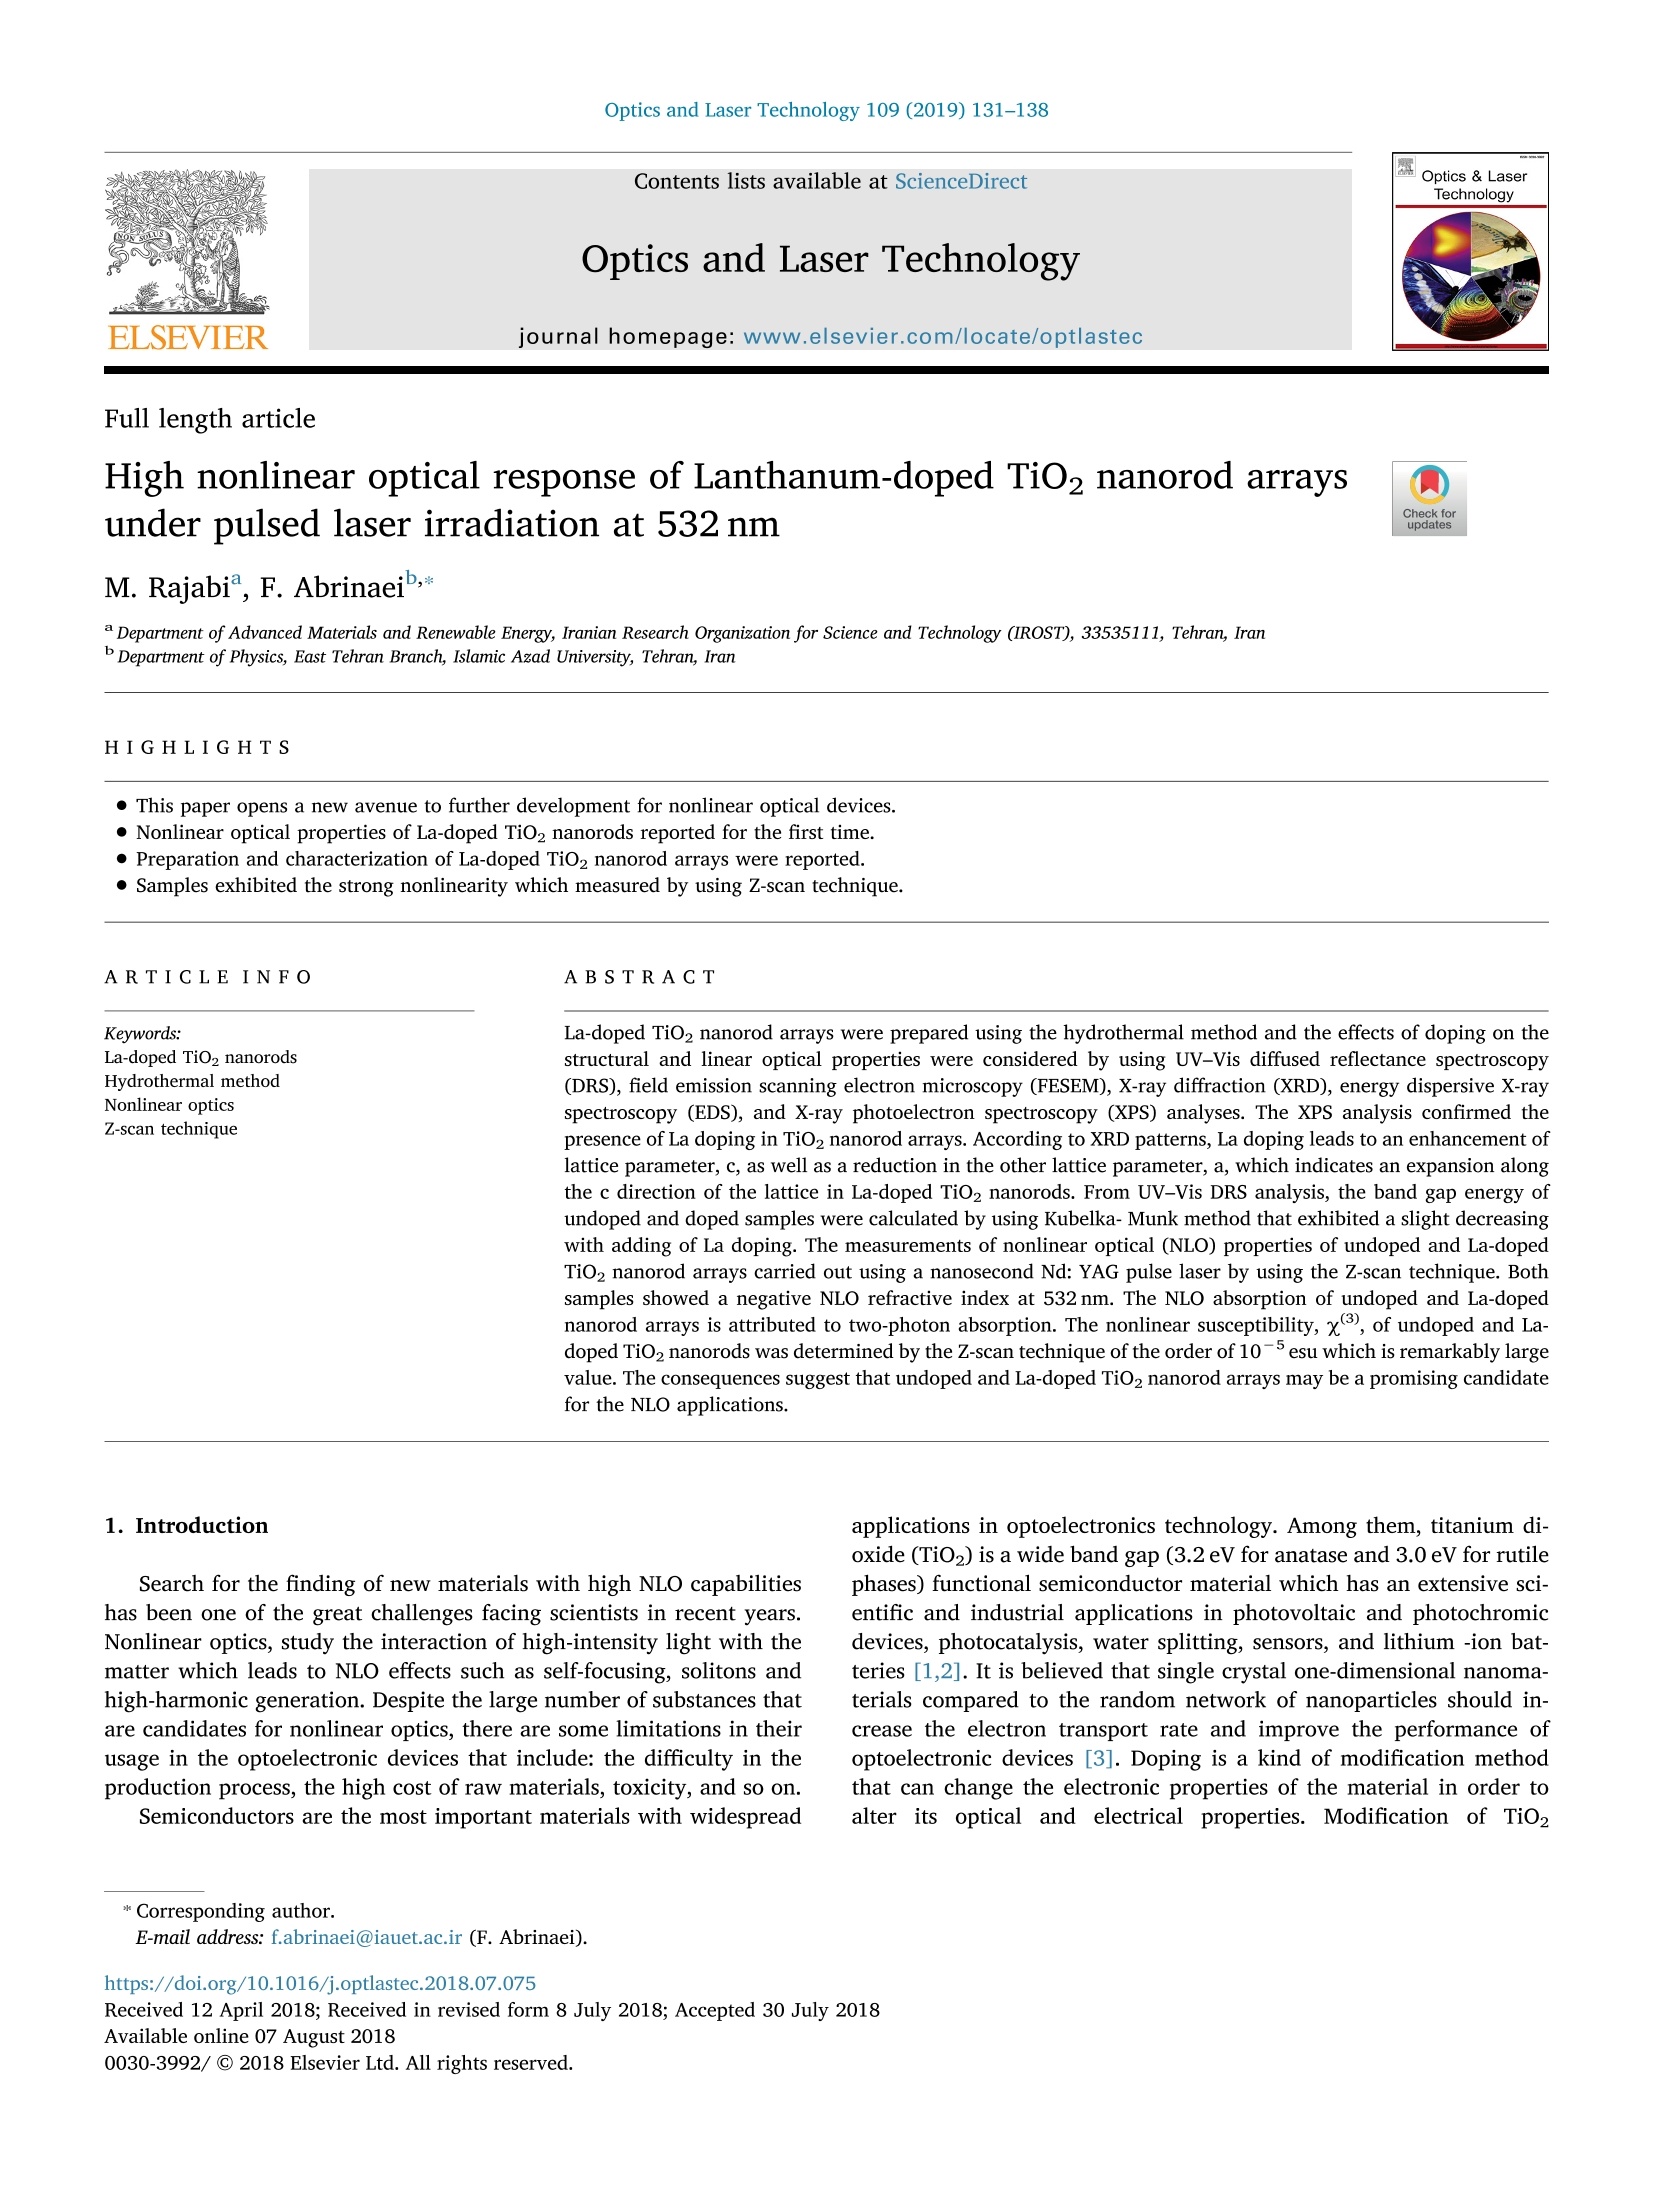
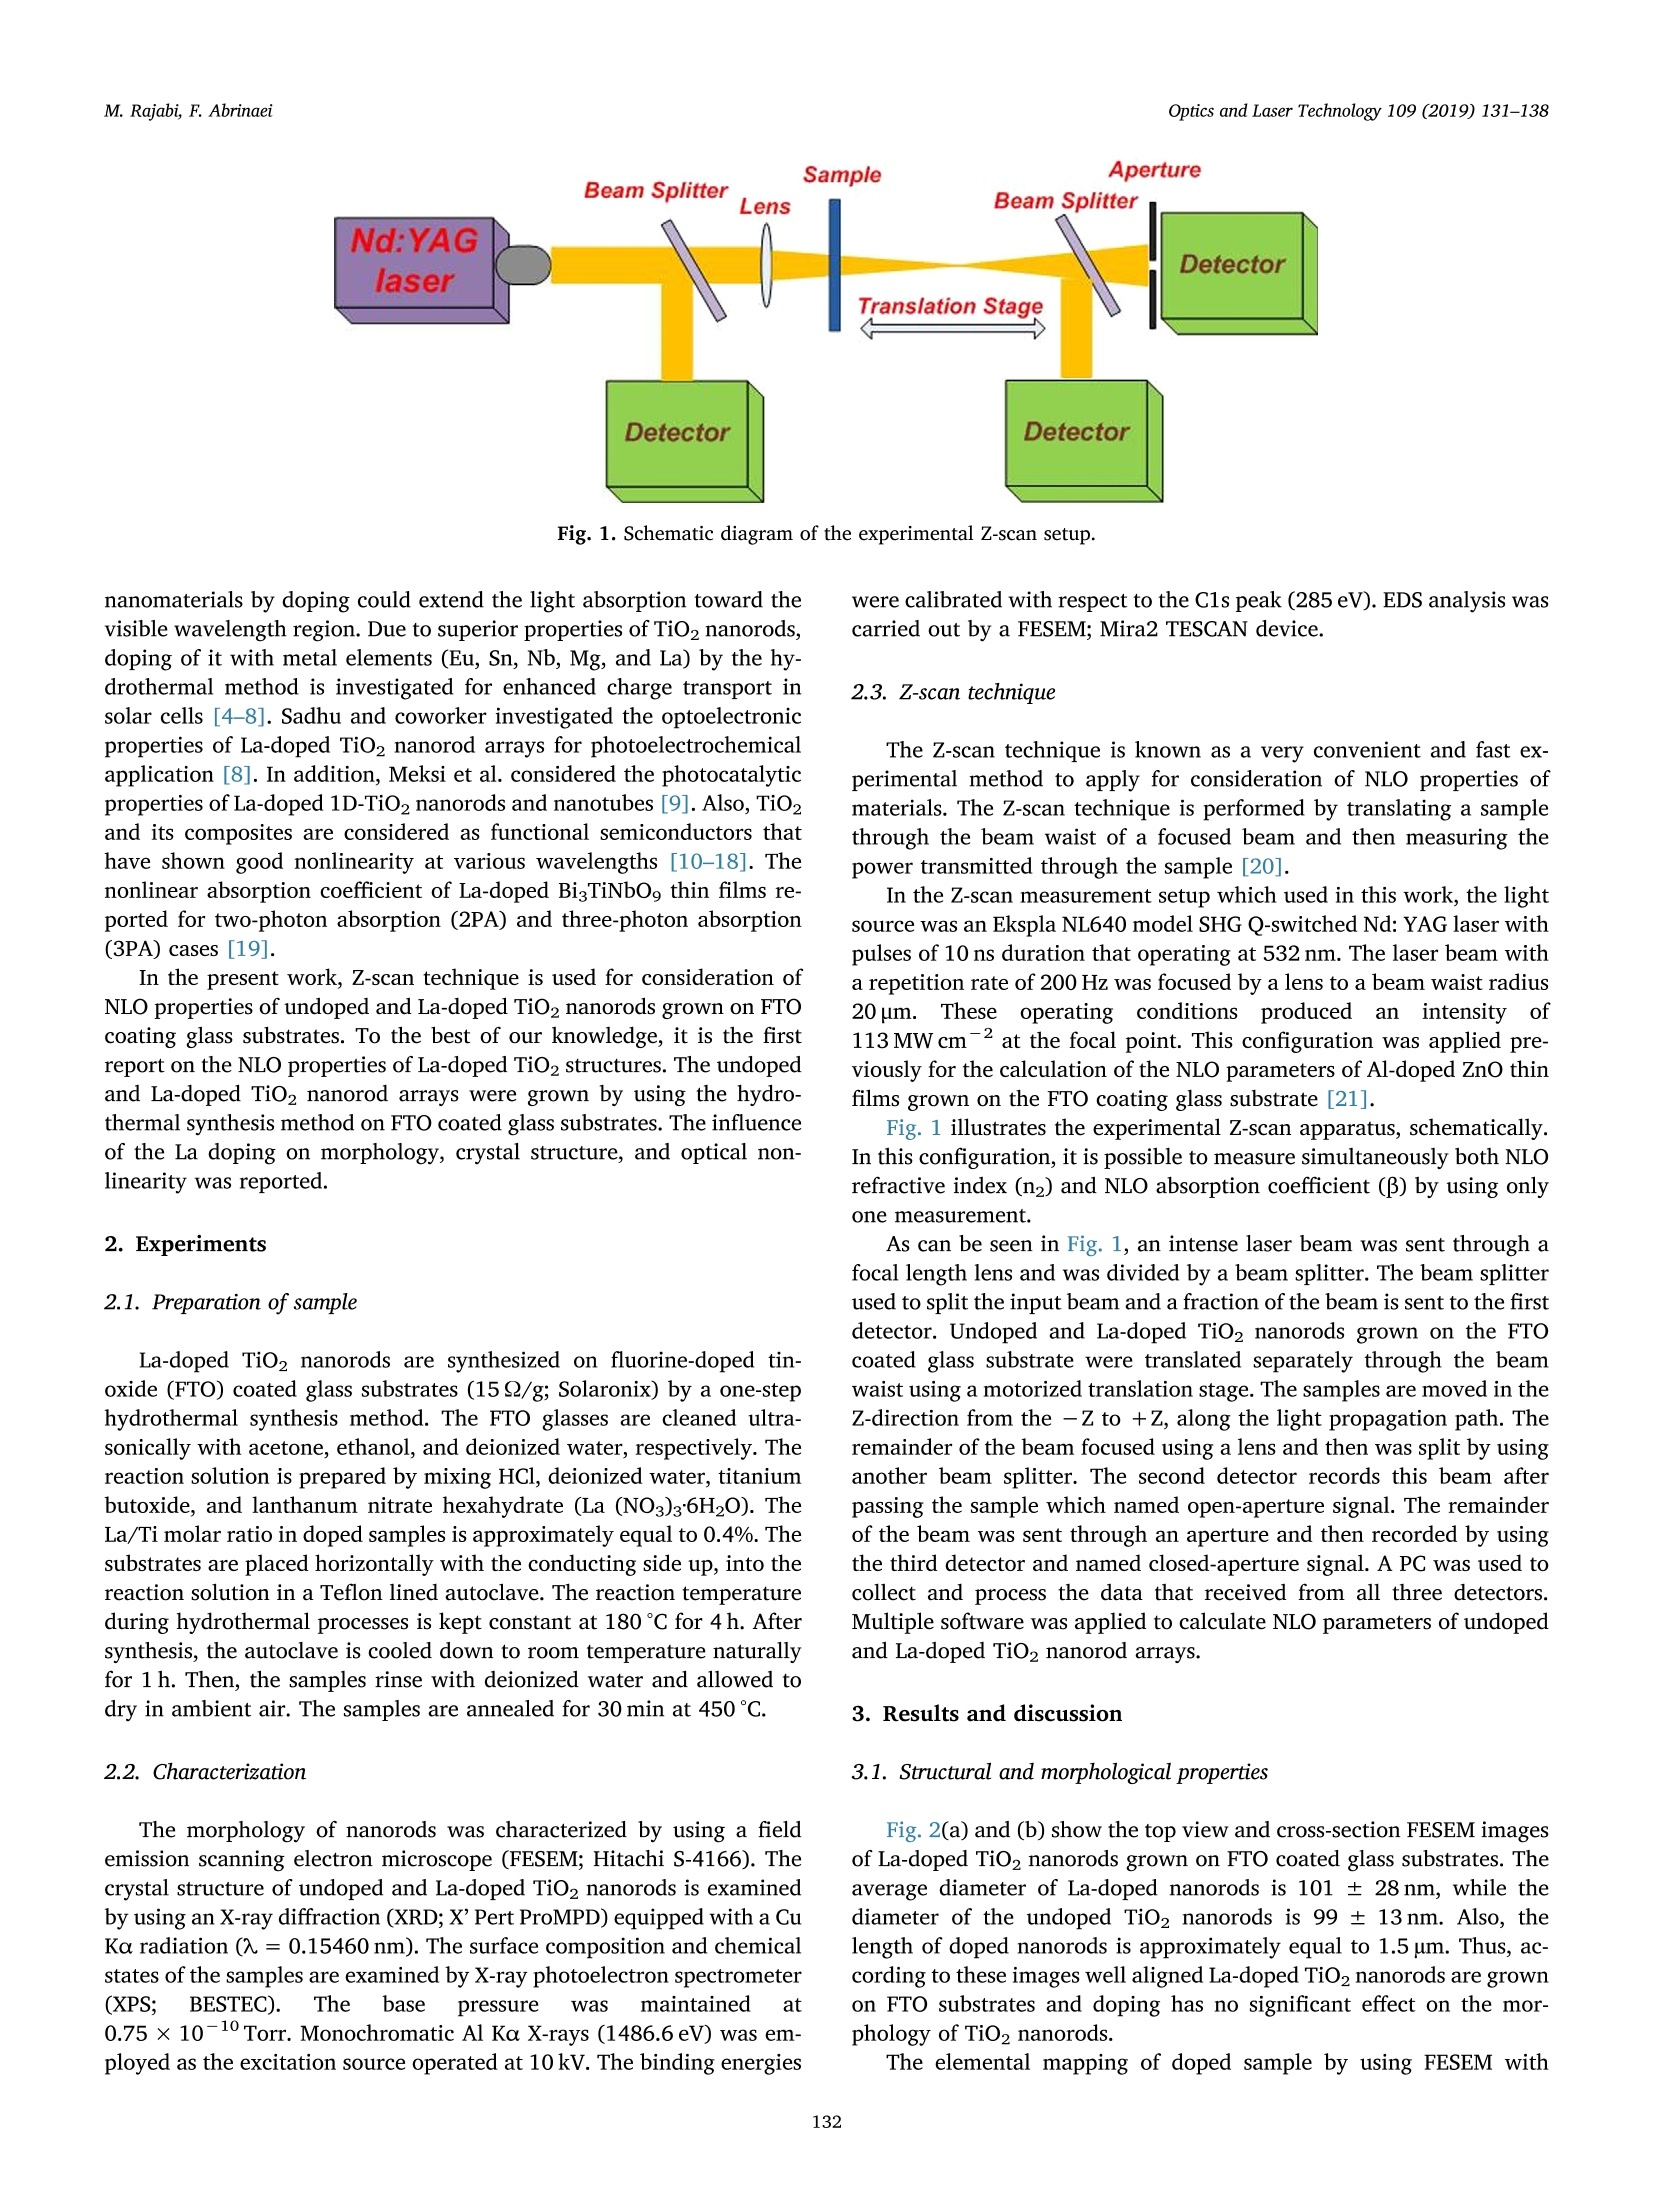
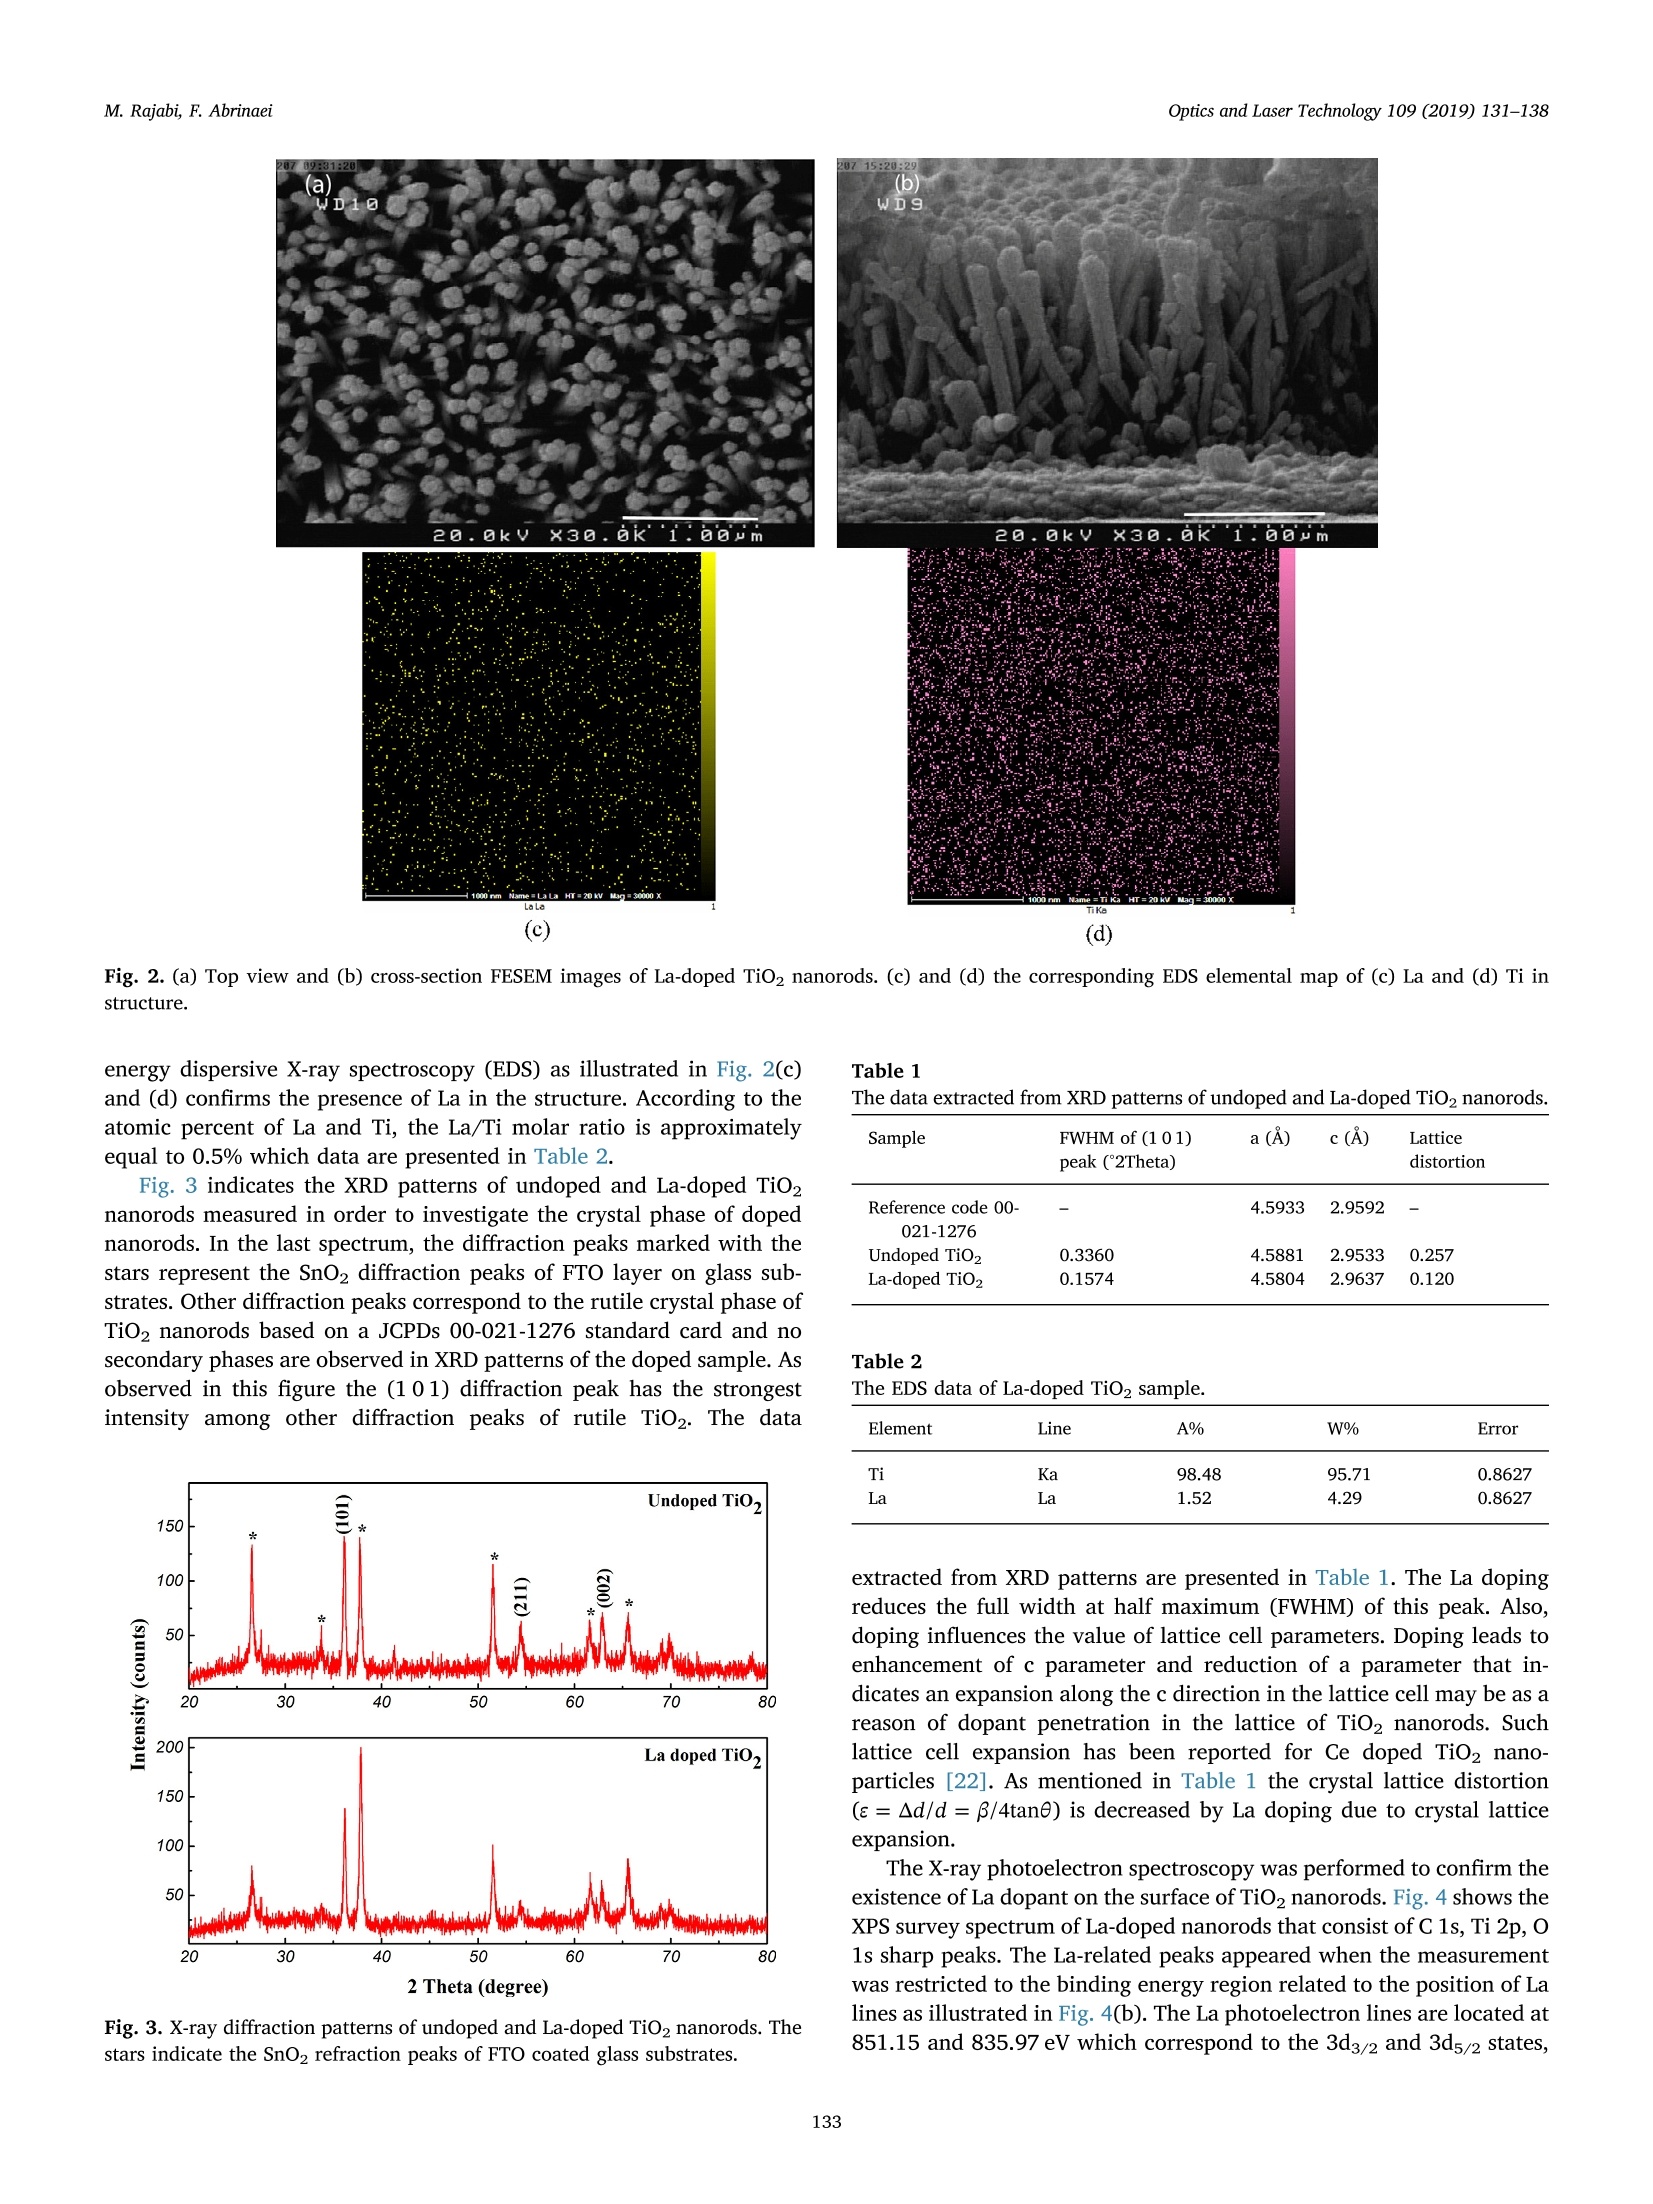
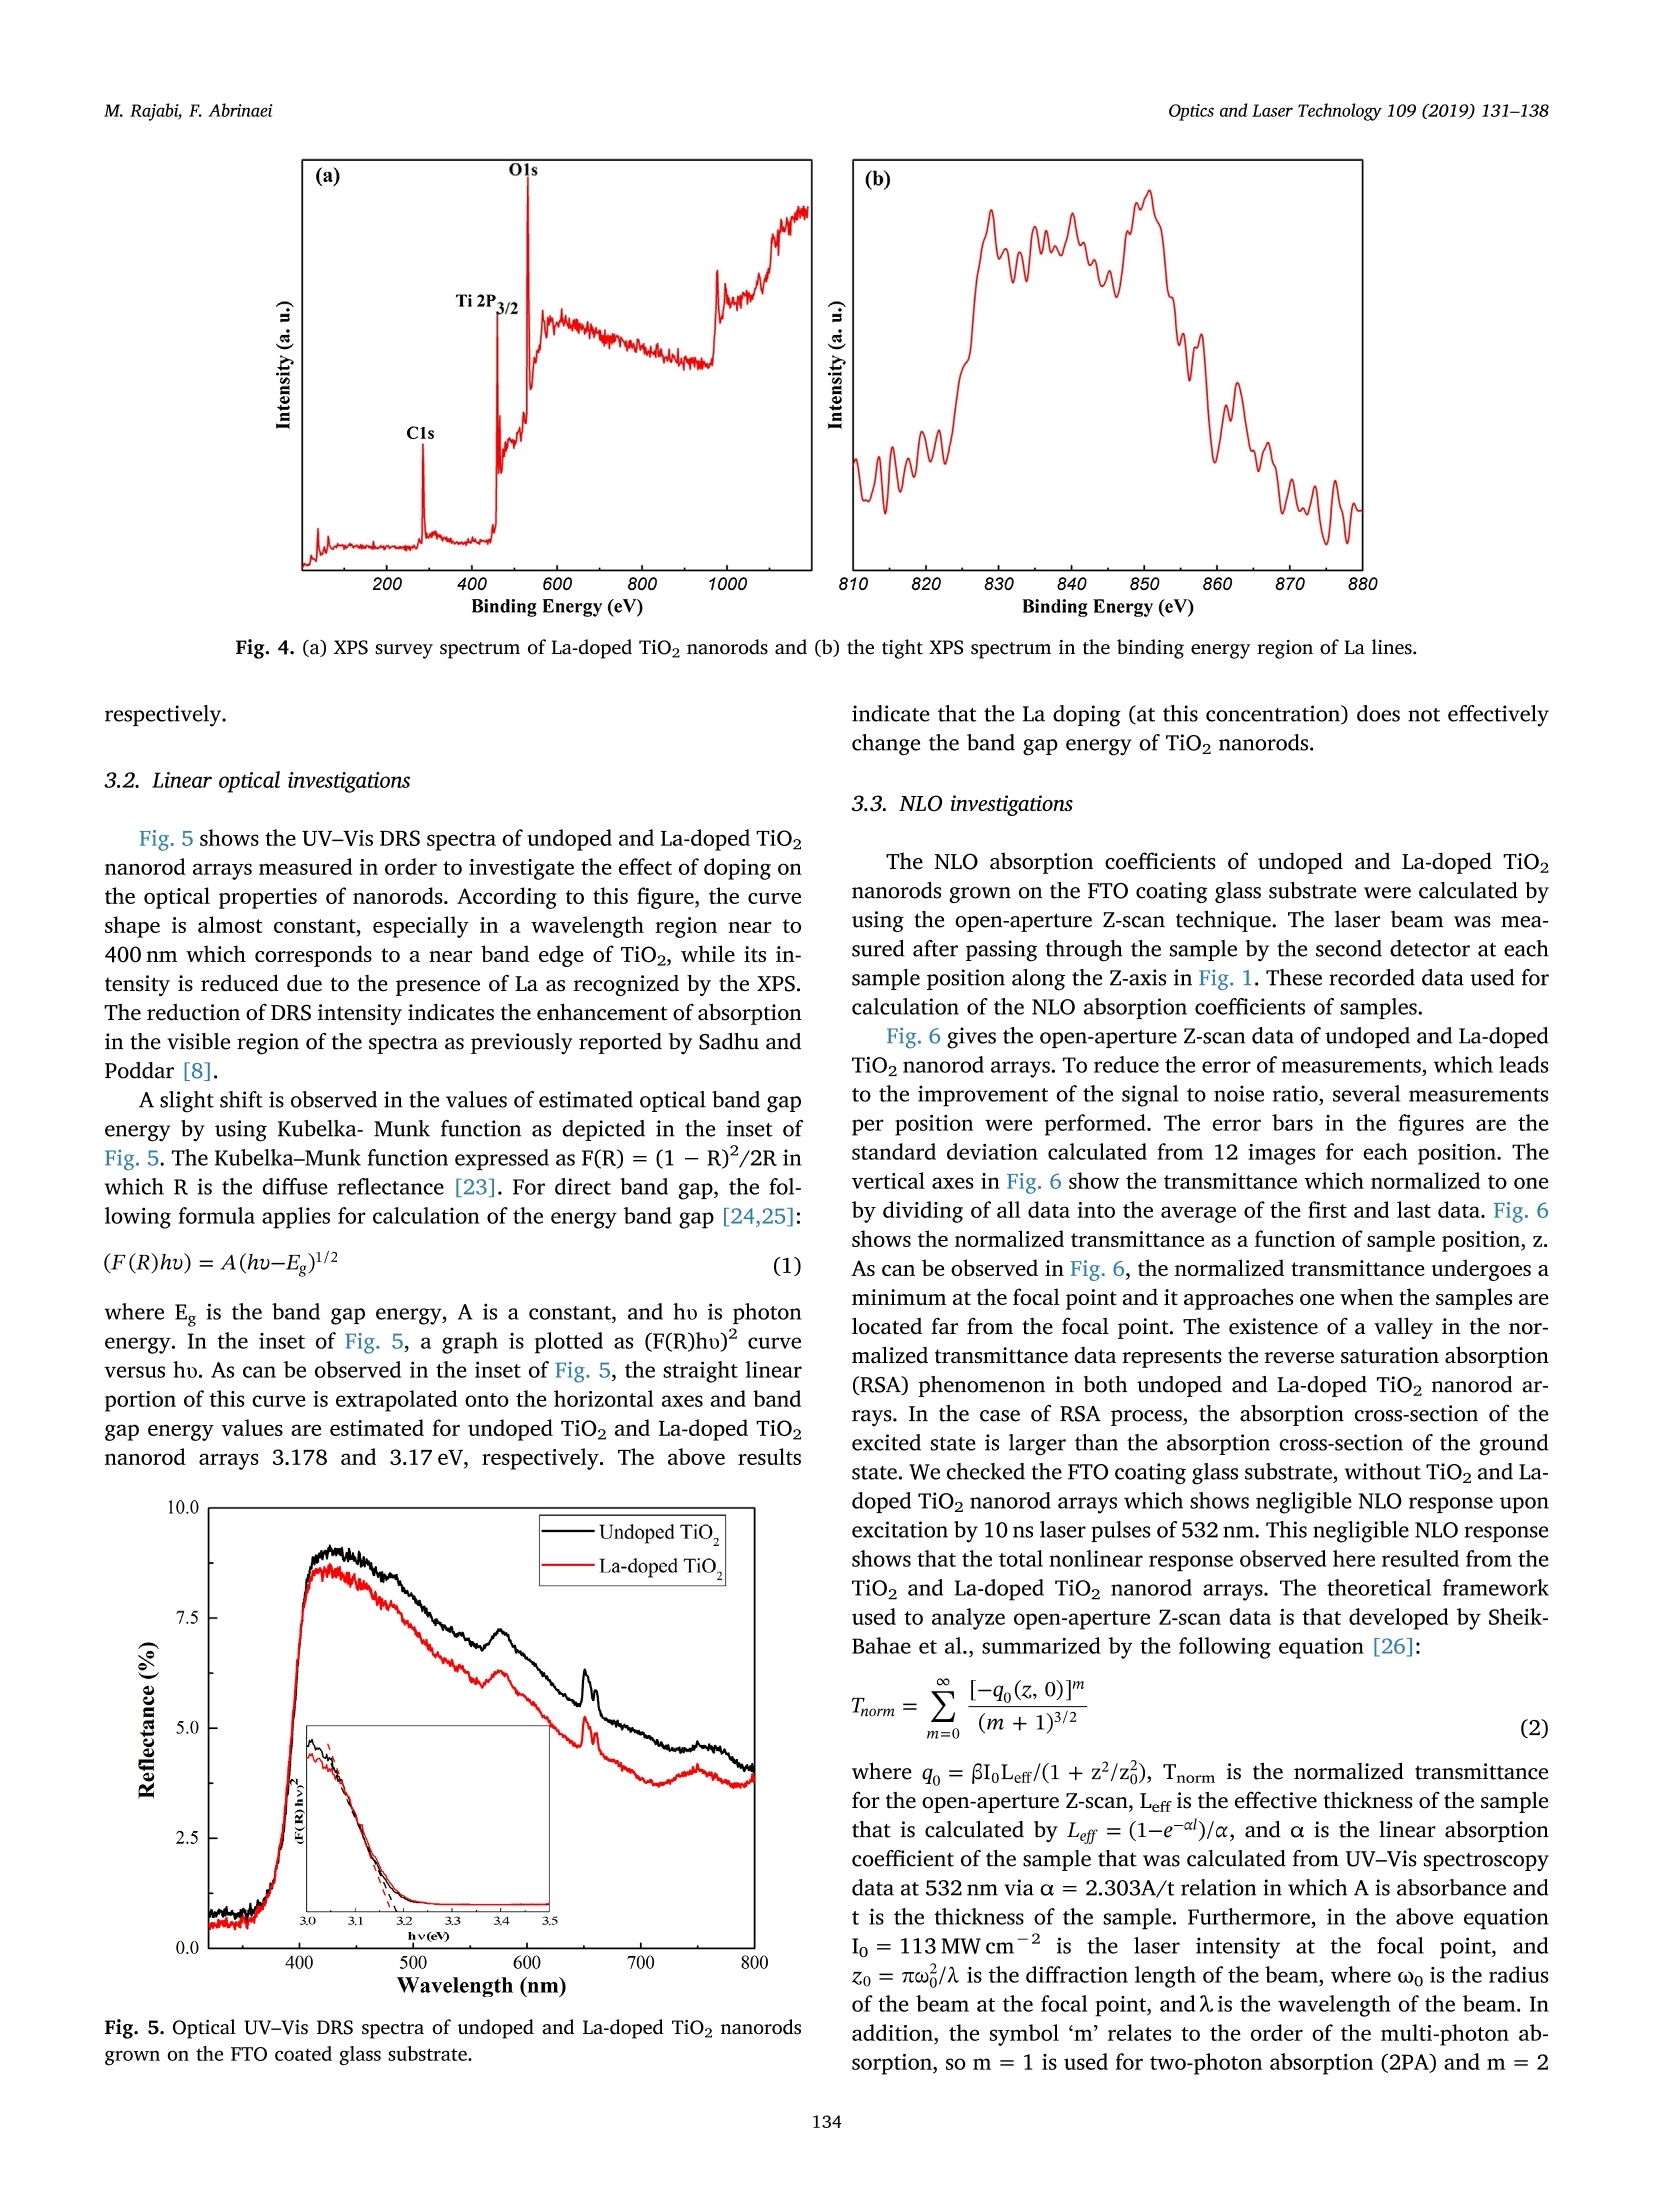
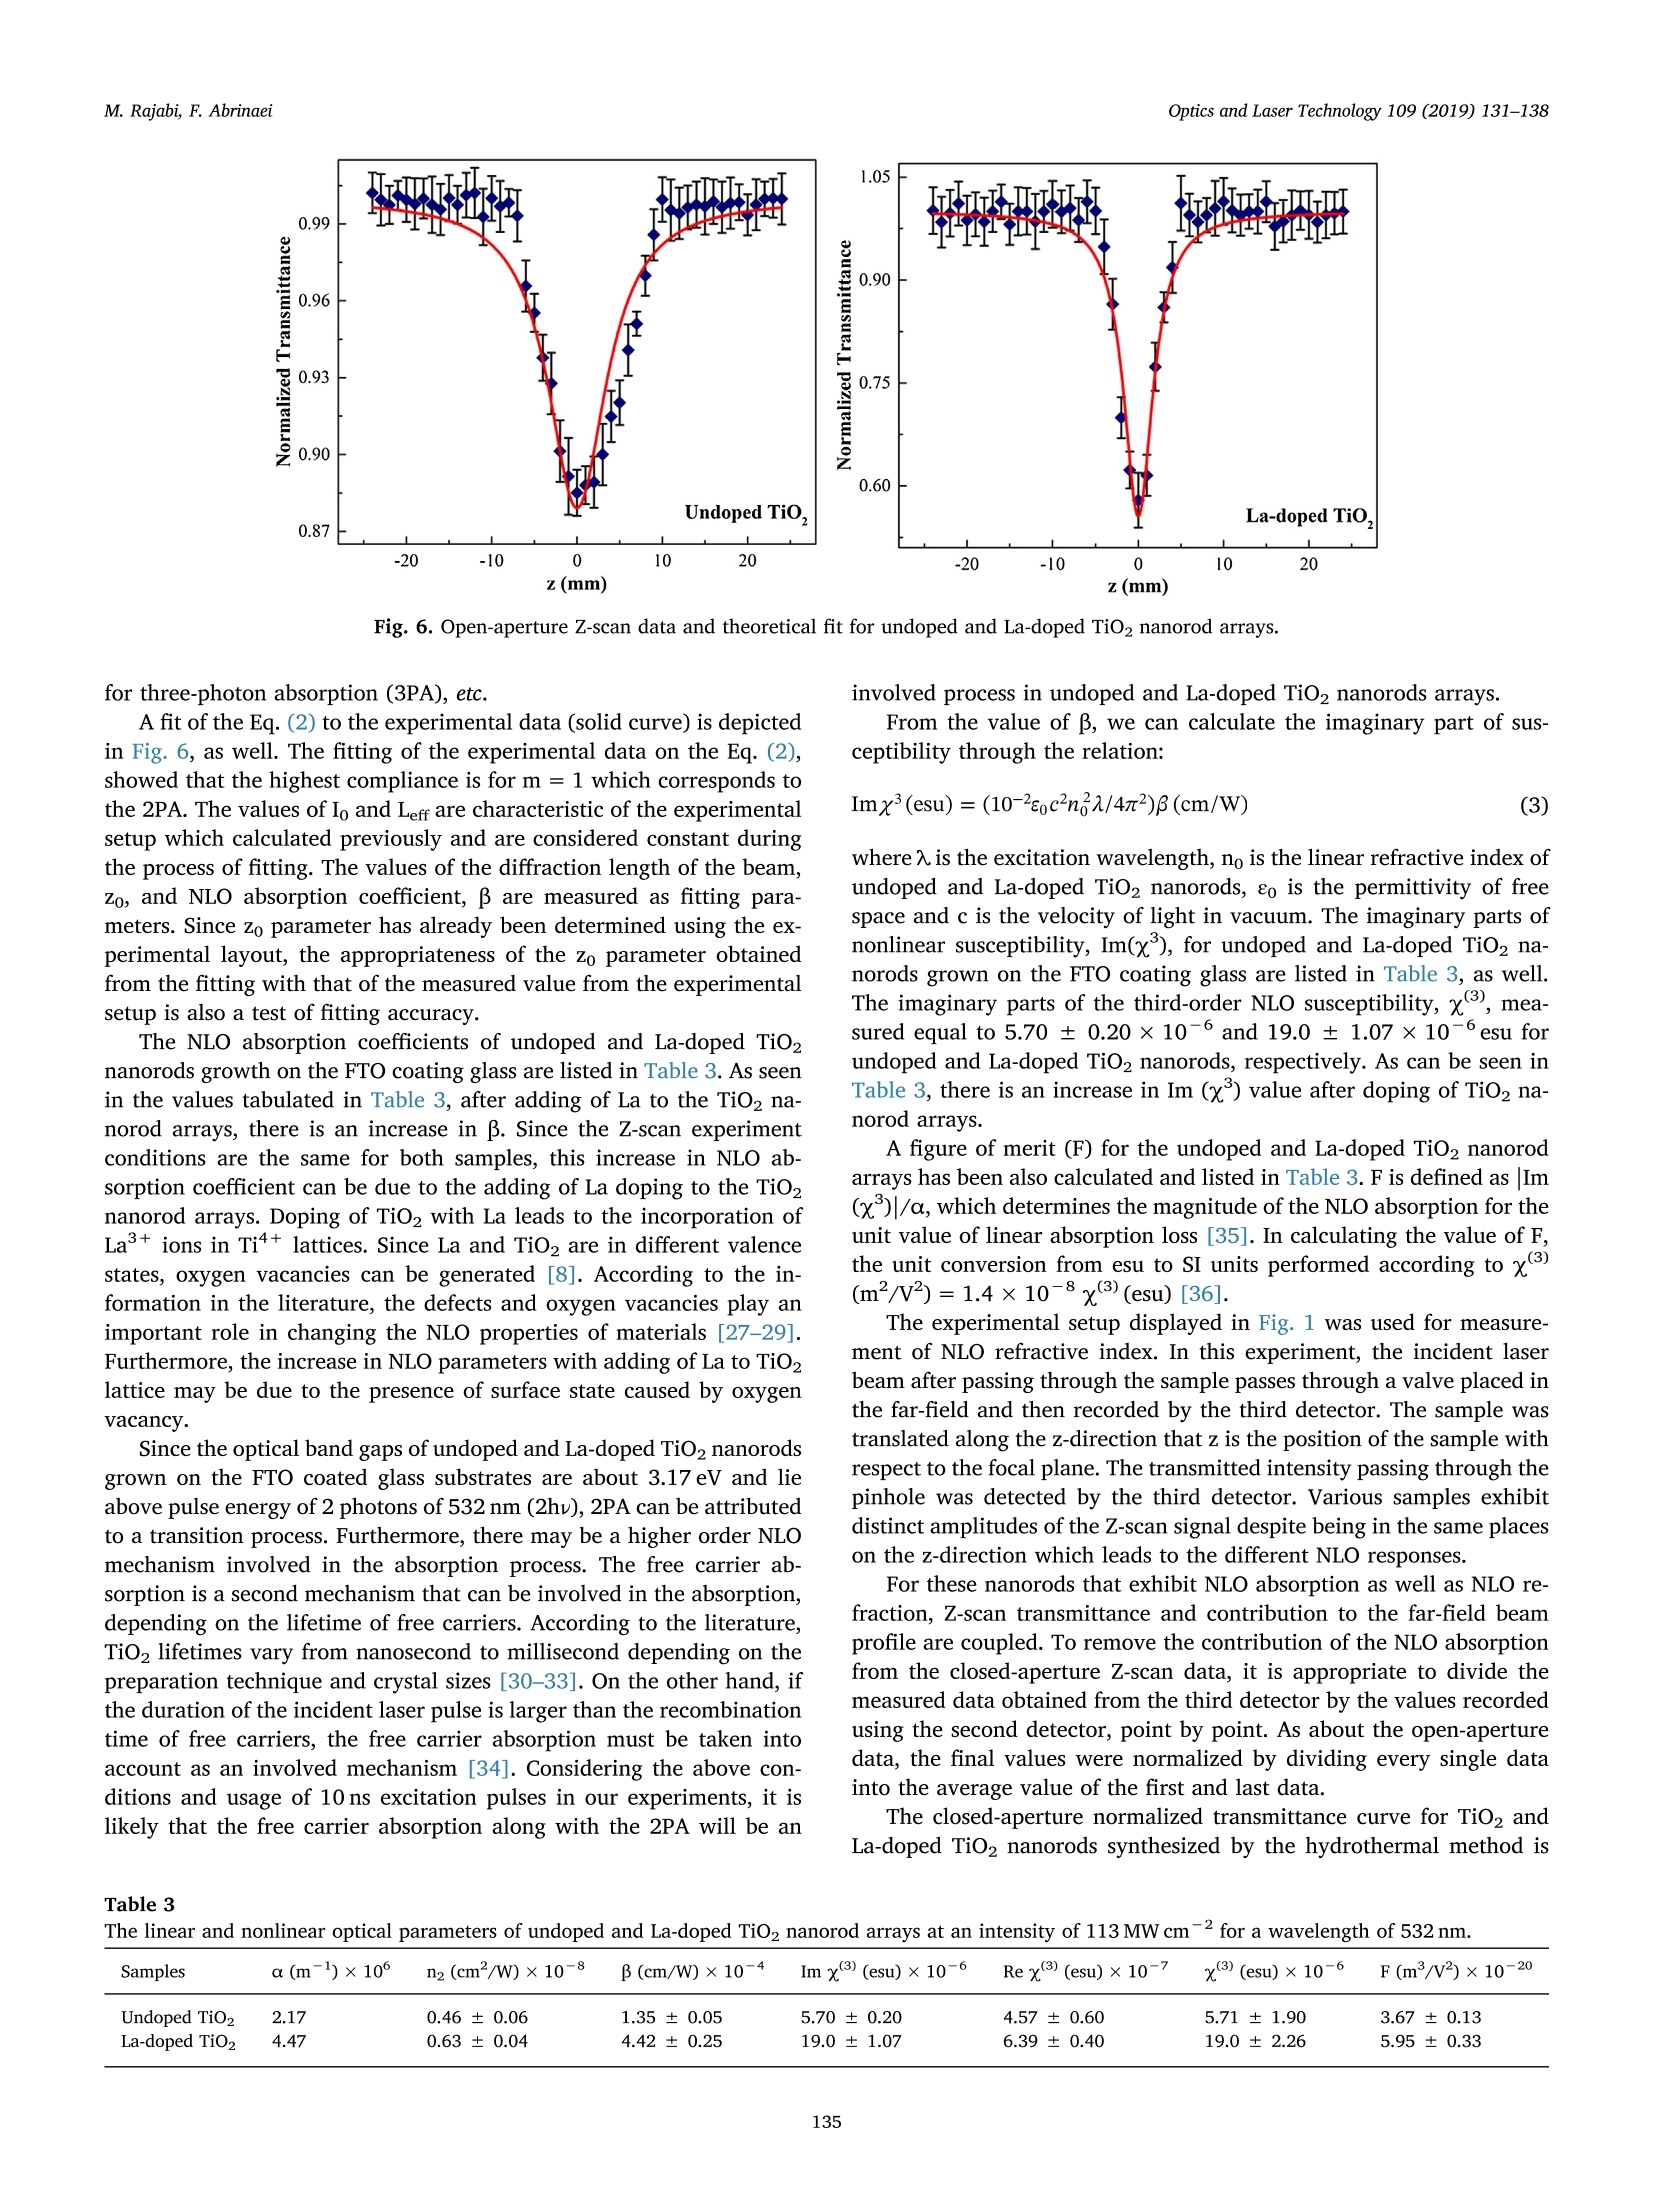
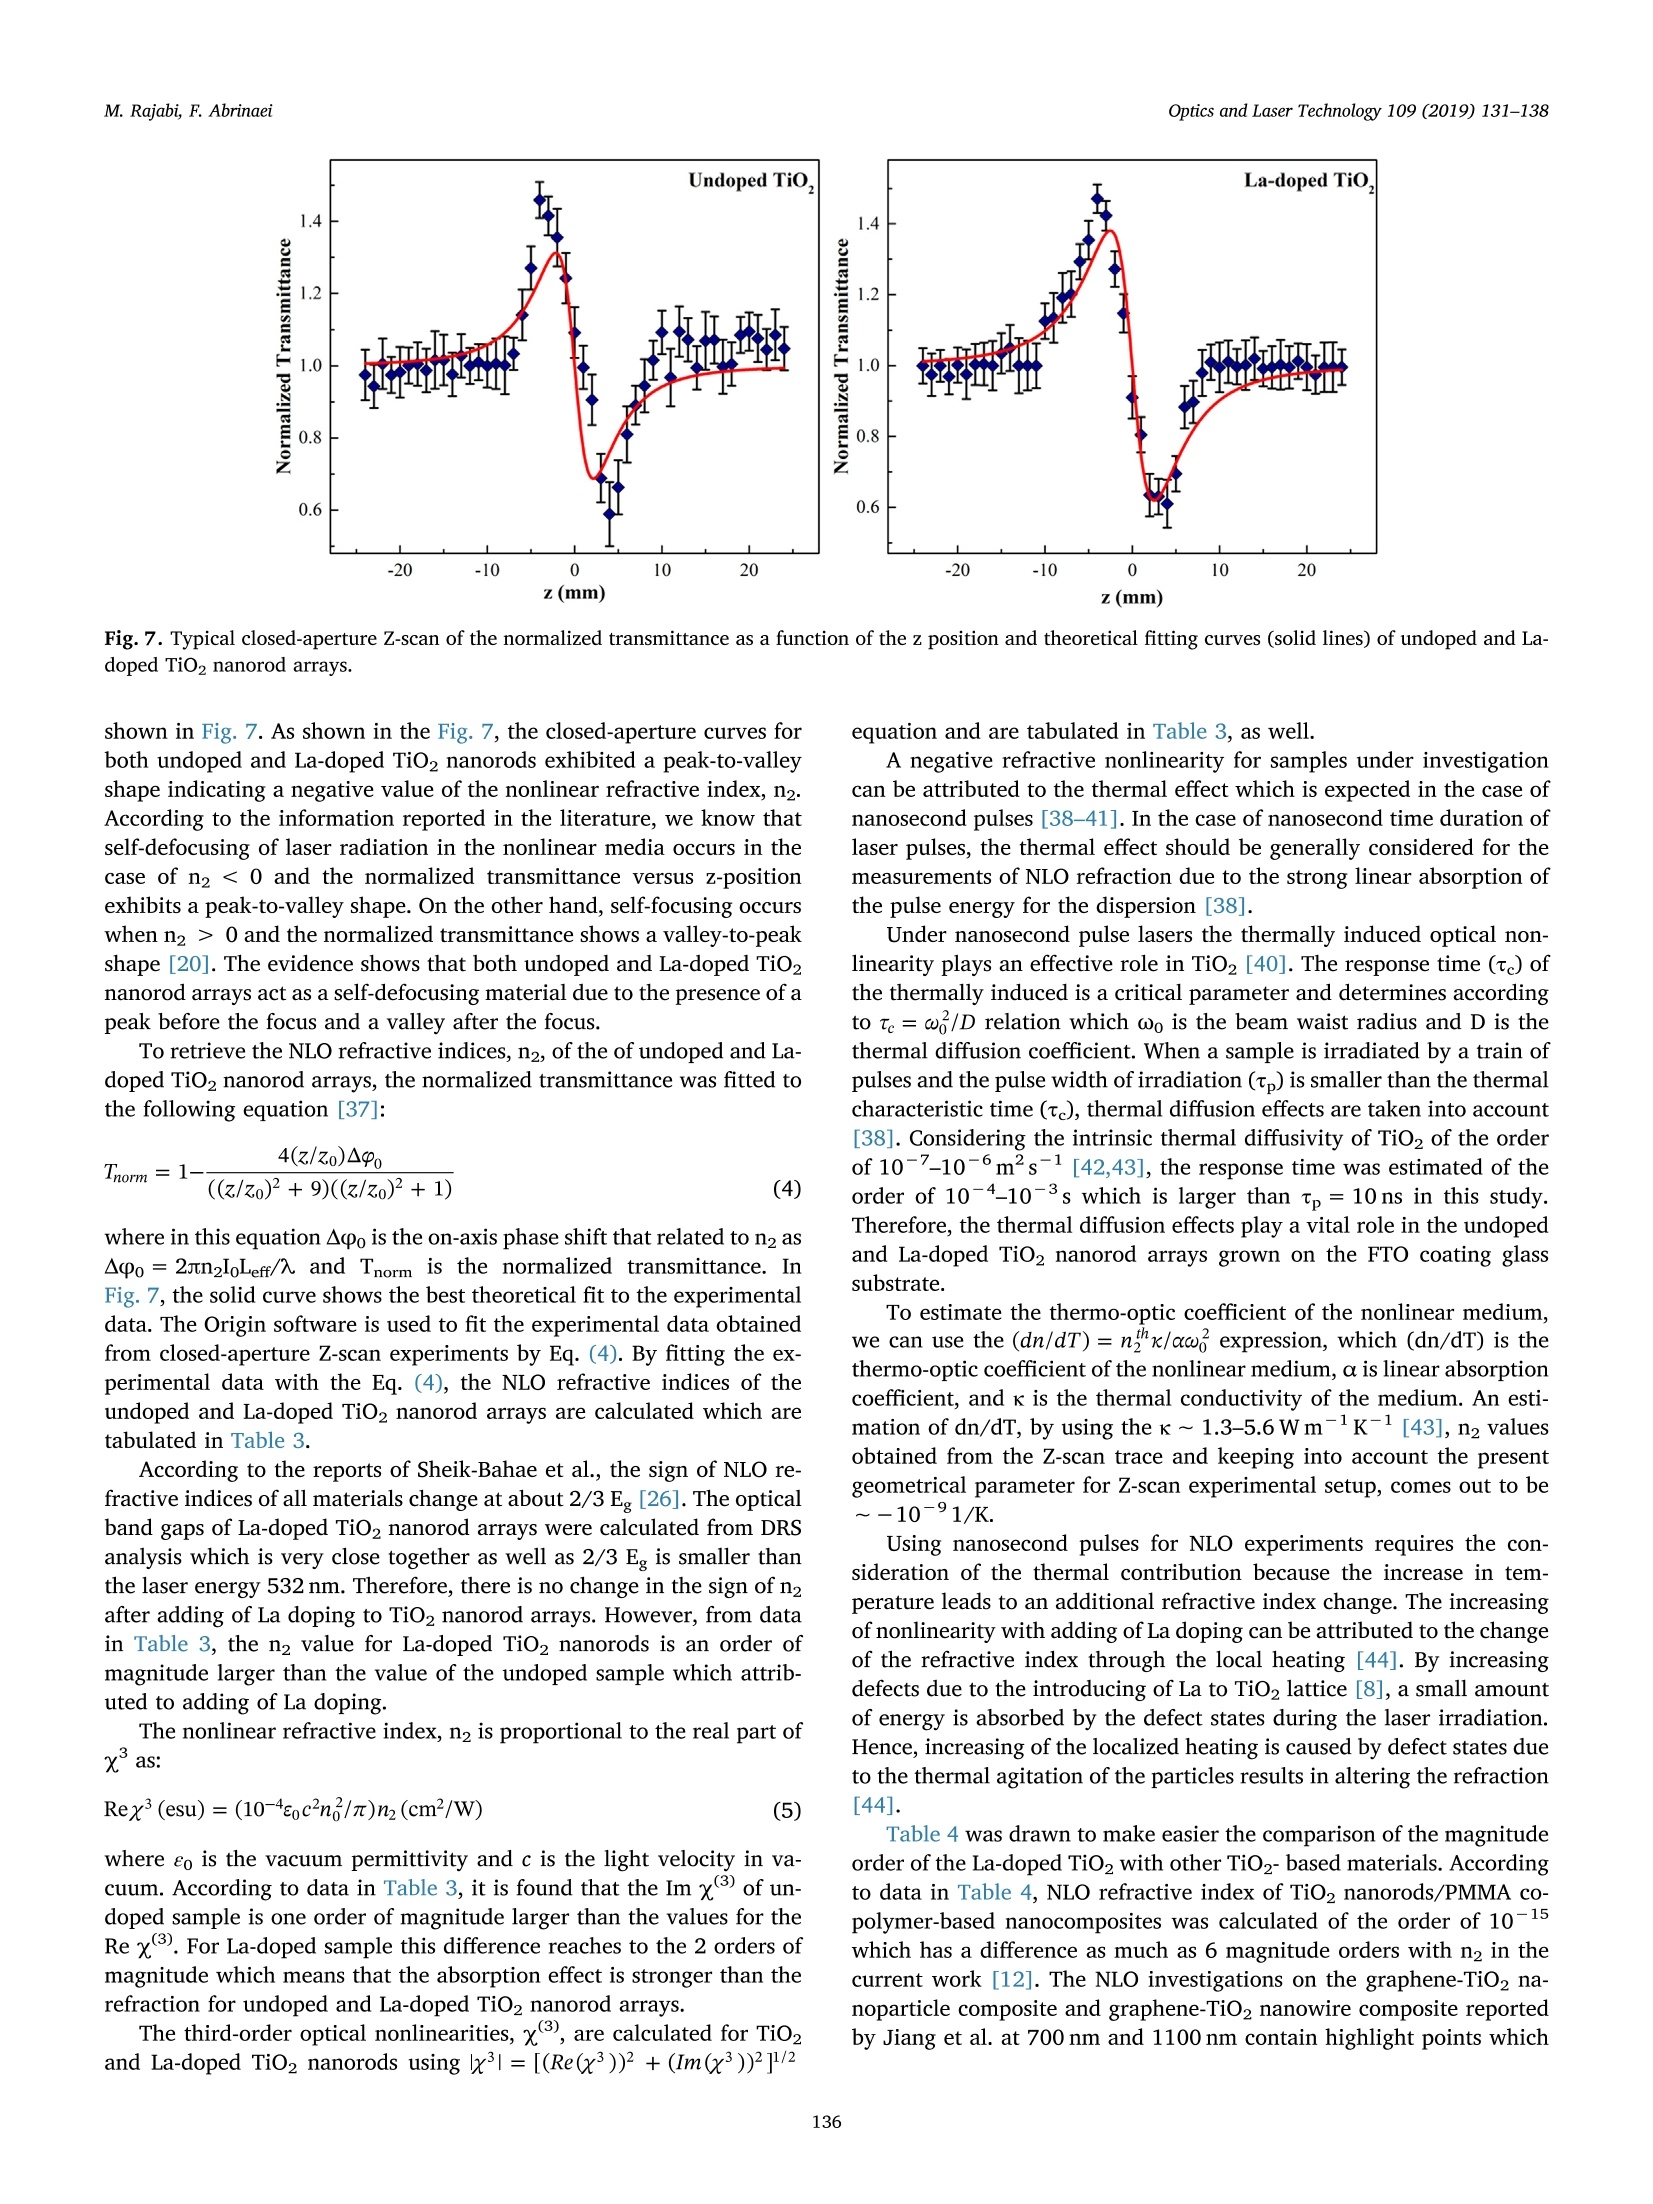
Optics and Laser Technology 109 (2019) 131-138 M. Rajabi, F. AbrinaeiOptics and Laser Technology 109 (2019) 131-138 Contents lists available at ScienceDirect Optics and Laser Technology journal homepage: www.elsevier.com/locate/optlastec Full length article High nonlinear optical response of Lanthanum-doped TiO2 nanorod arraysunder pulsed laser irradiation at 532 nm M. Rajabi, F. Abrinaei,* Department of Advanced Materials and Renewable Energy, Iranian Research Organization for Science and Technology (IROST), 33535111, Tehran, Iran"Department of Physics, East Tehran Branch, Islamic Azad University, Tehran, Iran H IGHLIGHT S · This paper opens a new avenue to further development for nonlinear optical devices. ·Nonlinear optical properties of La-doped TiO2 nanorods reported for the first time. · Preparation and characterization of La-doped TiO2 nanorod arrays were reported. · Samples exhibited the strong nonlinearity which measured by using Z-scan technique. ARTICLEINFO ABSTRAC T Keywords:La-doped TiO2 nanorodsHydrothermal methodNonlinear opticsZ-scan technique La-doped TiO2 nanorod arrays were prepared using the hydrothermal method and the effects of doping on thestructural and linear optical properties were considered by using UV-Vis diffused reflectance spectroscopy(DRS), field emission scanning electron microscopy (FESEM), X-ray diffraction (XRD), energy dispersive X-rayspectroscopy (EDS), and X-ray photoelectron spectroscopy (XPS) analyses. The XPS analysis confirmed thepresence of La doping in TiO2 nanorod arrays. According to XRD patterns, La doping leads to an enhancement oflattice parameter, c, as well as a reduction in the other lattice parameter, a, which indicates an expansion alongthe c direction of the lattice in La-doped TiO2 nanorods. From UV-Vis DRS analysis, the band gap energy ofundoped and doped samples were calculated by using Kubelka- Munk method that exhibited a slight decreasingwith adding of La doping. The measurements of nonlinear optical (NLO) properties of undoped and La-dopedTiO2 nanorod arrays carried out using a nanosecond Nd: YAG pulse laser by using the Z-scan technique. Bothsamples showed a negative NLO refractive index at 532 nm. The NLO absorption of undoped and La-dopednanorod arrays is attributed to two-photon absorption. The nonlinear susceptibility, x, of undoped and La-doped TiO nanorods was determined by the Z-scan technique of the order of 10- esu which is remarkably largevalue. The consequences suggest that undoped and La-doped TiO2 nanorod arrays may be a promising candidatefor the NLO applications. 1. Introduction Search for the finding of new materials with high NLO capabilitieshas been one of the great challenges facing scientists in recent years.Nonlinear optics,study the interaction of high-intensity light with thematter which leads to NLO effects such as self-focusing, solitons andhigh-harmonic generation. Despite the large number of substances thatare candidates for nonlinear optics, there are some limitations in theirusage in the optoelectronic devices that include: the difficulty in theproduction process, the high cost of raw materials, toxicity, and so on. Semiconductors are the most important materials with widespread applications in optoelectronics technology. Among them, titanium di-CLoxide (TiO2) is a wide band gap (3.2 eV for anatase and 3.0 eV for rutilephases) functional semiconductor material which has an extensive sci-entific and industrial applications in photovoltaic and photochromicdevices, photocatalysis, water splitting, sensors, and lithium -ion bat-teries [1,2]. It is believed that single crystal one-dimensional nanoma-terials compared to the random network of nanoparticles should in-crease the electron transport rate and improve the performance ofoptoelectronic devices [3]. Doping is a kind of modification methodthat can change the electronic properties of the material in order toalter its optical and electrical properties. Modification of TiO2 ( E-mail a ddress: f .abr i naei @ ia u e t .ac.i r ( F. Abrinaei). ) ( 0030-3992/C 2018 Elsevier Lt d . All rights r eserved. ) Fig. 1. Schematic diagram of the experimental Z-scan setup. nanomaterials by doping could extend the light absorption toward thevisible wavelength region. Due to superior properties of TiO2 nanorods,doping of it with metal elements (Eu, Sn, Nb,Mg, and La) by the hy-drothermal method is investigated for enhanced charge transport insolar cells [4-8]. Sadhu and coworker investigated the optoelectronicproperties of La-doped TiO2 nanorod arrays for photoelectrochemicalapplication [8]. In addition, Meksi et al. considered the photocatalyticproperties of La-doped 1D-TiO2 nanorods and nanotubes [9]. Also, TiO2and its composites are considered as functional semiconductors thathave shown good nonlinearity at various wavelengths [10-18]. Thenonlinear absorption coefficient of La-doped Bi TiNbOg thin films re-ported for two-photon absorption (2PA) and three-photon absorption(3PA) cases [19]. In the present work, Z-scan technique is used for consideration ofNLO properties of undoped and La-doped TiO2 nanorods grown on FTOcoating glass substrates. To the best of our knowledge, it is the firstreport on the NLO properties of La-doped TiO2 structures. The undopedand La-doped TiO2 nanorod arrays were grown by using the hydro-thermal synthesis method on FTO coated glass substrates. The influenceof the La doping on morphology, crystal structure, and optical non-linearity was reported. 2. Experiments 2.1. Preparation of sample La-doped TiO2 nanorods are synthesized on fluorine-doped tin-oxide (FTO) coated glass substrates (15Q/g; Solaronix) by a one-stephydrothermal synthesis method. The FTO glasses are cleaned ultra-sonically with acetone, ethanol, and deionized water, respectively. Thereaction solution is prepared by mixing HCl, deionized water, titaniumbutoxide, and lanthanum nitrate hexahydrate (La (NO3)36H20). TheLa/Ti molar ratio in doped samples is approximately equal to 0.4%. Thesubstrates are placed horizontally with the conducting side up, into thereaction solution in a Teflon lined autoclave. The reaction temperatureduring hydrothermal processes is kept constant at 180℃ for 4 h. Aftersynthesis, the autoclave is cooled down to room temperature naturallyfor 1 h. Then, the samples rinse with deionized water and allowed todry in ambient air. The samples are annealed for 30 min at 450°C. 2.2. Characterization The morphology of nanorods was characterized by using a fieldemission scanning electron microscope (FESEM; Hitachi S-4166). Thecrystal structure of undoped and La-doped TiO2 nanorods is examinedby using an X-ray diffraction (XRD; X'Pert ProMPD) equipped with a CuKa radiation (入=0.15460 nm). The surface composition and chemicalstates of the samples are examined by X-ray photoelectron spectrometer(XPS; BESTEC). The base pressure Was maintained at0.75×10-10Torr. Monochromatic Al Ka X-rays (1486.6 eV) was em-ployed as the excitation source operated at 10 kV. The binding energies were calibrated with respect to the C1s peak (285eV). EDS analysis wascarried out by a FESEM; Mira2 TESCAN device. 2.3. Z-scan technique The Z-scan technique is known as a very convenient and fast ex-perimental method to apply for consideration of NLO properties ofmaterials. The Z-scan technique is performed by translating a samplethrough the beam waist of a focused beam and then measuring thepower transmitted through the sample [20]. In the Z-scan measurement setup which used in this work, the lightsource was an Ekspla NL640 model SHG Q-switched Nd:YAG laser withpulses of 10 ns duration that operating at 532 nm. The laser beam witha repetition rate of 200 Hz was focused by a lens to a beam waist radius20 um.1.Theseoperating conditionsproducedan intensity of113 MW cm-2 at the focal point. This configuration was applied pre-viously for the calculation of the NLO parameters of Al-doped ZnO thinfilms grown on the FTO coating glass substrate [21]. Fig. 1 illustrates the experimental Z-scan apparatus, schematically.In this configuration, it is possible to measure simultaneously both NLOrefractive index (n2) and NLO absorption coefficient (B) by using onlyone measurement. As can be seen in Fig. 1, an intense laser beam was sent through afocal length lens and was divided by a beam splitter. The beam splitterused to split the input beam and a fraction of the beam is sent to the firstdetector. Undoped and La-doped TiO2 nanorods grown on the FTOcoated glass substrate were translated separately through the beamwaist using a motorized translation stage. The samples are moved in theZ-direction from the -Z to +Z, along the light propagation path. Theremainder of the beam focused using a lens and then was split by usinganother beam splitter. The second detector records this beam afterpassing the sample which named open-aperture signal. The remainderof the beam was sent through an aperture and then recorded by usingthe third detector and named closed-aperture signal. A PC was used tocollect and process the data that received from all three detectors.Multiple software was applied to calculate NLO parameters of undopedand La-doped TiO2 nanorod arrays. 3. Results and discussion 3.1. Structural and morphological properties Fig.2(a) and (b) show the top view and cross-section FESEM imagesof La-doped TiO2 nanorods grown on FTO coated glass substrates. Theaverage diameter of La-doped nanorods is 101±28nm, while thediameter of the undoped TiO2 nanorods is 99 ± 13nm. Also, thelength of doped nanorods is approximately equal to 1.5 um. Thus, ac-cording to these images well aligned La-doped TiO2 nanorods are grownon FTO substrates and doping has no significant effect on the mor-phology of TiO2 nanorods. 20.0kVx La La (c) (d) Fig. 2. (a) Top view and (b) cross-section FESEM images of La-doped TiO2 nanorods. (c) and (d) the corresponding EDS elemental map of (c) La and (d) Ti instructure. energy dispersive X-ray spectroscopy (EDS) as illustrated in Fig. 2(c)and (d) confirms the presence of La in the structure. According to theatomic percent of La and Ti, the La/Ti molar ratio is approximatelyequal to 0.5% which data are presented in Table 2. Fig. 3 indicates the XRD patterns of undoped and La-doped TiO2nanorods measured in order to investigate the crystal phase of dopednanorods. In the last spectrum, the diffraction peaks marked with thestars represent the SnO2 diffraction peaks of FTO layer on glass sub-strates. Other diffraction peaks correspond to the rutile crystal phase ofTiO2 nanorods based on a JCPDs 00-021-1276 standard card and nosecondary phases are observed in XRD patterns of the doped sample. Asobserved in this figure the (101) diffraction peak has the strongestintensity among other diffraction peaks of rutile TiO2. The data Fig.3. X-ray diffraction patterns of undoped and La-doped TiO2 nanorods. Thestars indicate the SnO2 refraction peaks of FTO coated glass substrates. Table 1 The data extracted from XRD patterns of undoped and La-doped TiO2 nanorods. Sample FWHM of (101) a (A) c (A) Lattice peak(2Theta) distortion Reference code 00- 4.5933 2.9592 一 021-1276 Undoped TiO2 0.3360 4.5881 2.9533 0.257 La-doped TiO2 0.1574 4.5804 2.9637 0.120 Table 2 The EDS data of La-doped TiO2 sample. Element Line A% W% Error Ti Ka 98.48 95.71 0.8627 La La 1.52 4.29 0.8627 extracted from XRD patterns are presented in Table 1. The La dopingreduces the full width at half maximum (FWHM) of this peak. Also,doping influences the value of lattice cell parameters. Doping leads toenhancement of c parameter and reduction of a parameter that in-dicates an expansion along the c direction in the lattice cell may be as areason of dopant penetration in the lattice of TiO2 nanorods. Suchlattice cell expansion has been reported for Ce doped TiO2 nano-particles [22]. As mentioned in Table 1 the crystal lattice distortion(e=Ad/d=B/4tan0) is decreased by La doping due to crystal latticeexpansion. The X-ray photoelectron spectroscopy was performed to confirm theexistence of La dopant on the surface of TiO2 nanorods. Fig. 4 shows theXPS survey spectrum of La-doped nanorods that consist of C 1s, Ti 2p, O1s sharp peaks. The La-related peaks appeared when the measurementwas restricted to the binding energy region related to the position of Lalines as illustrated in Fig.4(b). The La photoelectron lines are located at851.15 and 835.97 eV which correspond to the 3d3/2 and 3d5/2 states, Fig. 4. (a) XPS survey spectrum of La-doped TiO2 nanorods and (b)the tight XPS spectrum in the binding energy region of La lines. 3.2. Linear optical investigations Fig. 5 shows the UV-Vis DRS spectra of undoped and La-doped TiO2nanorod arrays measured in order to investigate the effect of doping onthe optical properties of nanorods. According to this figure, the curveshape is almost constant, especially in a wavelength region near to400 nm which corresponds to a near band edge of TiO2, while its in-tensity is reduced due to the presence of La as recognized by the XPS.The reduction of DRS intensity indicates the enhancement of absorptionin the visible region of the spectra as previously reported by Sadhu andPoddar [8]. A slight shift is observed in the values of estimated optical band gapenergy by using Kubelka-Munk function as depicted in the inset ofFig. 5. The Kubelka-Munk function expressed as F(R)= (1- R) /2R inwhich R is the diffuse reflectance [23]. For direct band gap, the fol-lowing formula applies for calculation of the energy band gap [24,25]: where Eg is the band gap energy, A is a constant, and ho is photonenergy. In the inset of Fig. 5, a graph is plotted as (F(R)ho) curveversus ho. As can be observed in the inset of Fig. 5, the straight linearportion of this curve is extrapolated onto the horizontal axes and bandgap energy values are estimated for undoped TiO2 and La-doped TiO2nanorod arrays 3.178 and 3.17 eV, respectively. The above results Fig. 5. Optical UV-Vis DRS spectra of undoped and La-doped TiO2 nanorodsgrown on the FTO coated glass substrate. indicate that the La doping (at this concentration) does not effectivelychange the band gap energy of TiO2 nanorods. 3.3. NLO investigations The NLO absorption coefficients of undoped and La-doped TiO2nanorods grown on the FTO coating glass substrate were calculated byusing the open-aperture Z-scan technique. The laser beam was mea-sured after passing through the sample by the second detector at eachsample position along the Z-axis in Fig. 1. These recorded data used forcalculation of the NLO absorption coefficients of samples. Fig. 6 gives the open-aperture Z-scan data of undoped and La-dopedTiO2 nanorod arrays. To reduce the error of measurements, which leadsto the improvement of the signal to noise ratio, several measurementsper position were performed. The error bars in the figures are thestandard deviation calculated from 12 images for each position. Thevertical axes in Fig. 6 show the transmittance which normalized to oneby dividing of all data into the average of the first and last data. Fig. 6shows the normalized transmittance as a function of sample position, z.As can be observed in Fig. 6, the normalized transmittance undergoes aminimum at the focal point and it approaches one when the samples arelocated far from the focal point. The existence of a valley in the nor-malized transmittance data represents the reverse saturation absorption(RSA) phenomenon in both undoped and La-doped TiO2 nanorod ar-rays. In the case of RSA process, the absorption cross-section of theexcited state is larger than the absorption cross-section of the groundstate. We checked the FTO coating glass substrate, without TiO2 and La-doped TiO2 nanorod arrays which shows negligible NLO response uponexcitation by 10 ns laser pulses of 532 nm. This negligible NLO responseshows that the total nonlinear response observed here resulted from theTiO2 and La-doped TiO2 nanorod arrays. The theoretical frameworkused to analyze open-aperture Z-scan data is that developed by Sheik-Bahae et al., summarized by the following equation [26]: where go=BILe/(1+z?/z), Tnorm is the normalized transmittancefor the open-aperture Z-scan, Leff is the effective thickness of the samplethat is calculated by Leff=(1-e-)/a, and a is the linear absorptioncoefficient of the sample that was calculated from UV-Vis spectroscopydata at 532 nm via a=2.303A/t relation in which A is absorbance andt is the thickness of the sample. Furthermore,in the above equationIo =113 MW cm2 is the laser intensity at the focal point, andzo =w/兀 is the diffraction length of the beam, where ωo is the radiusof the beam at the focal point, andA is the wavelength of the beam. Inaddition, the symbol ‘m’relates to the order of the multi-photon ab-sorption, so m = 1 is used for two-photon absorption (2PA) and m =2 Fig. 6. Open-aperture Z-scan data and theoretical fit for undoped and La-doped TiO2 nanorod arrays. for three-photon absorption (3PA), etc. A fit of the Eq. (2) to the experimental data (solid curve) is depictedin Fig. 6, as well. The fitting of the experimental data on the Eq. (2),showed that the highest compliance is for m =1 which corresponds tothe 2PA. The values of Io and Leff are characteristic of the experimentalsetup which calculated previously and are considered constant duringthe process of fitting. The values of the diffraction length of the beam,Zo, and NLO absorption coefficient, β are measured as fitting para-meters. Since zo parameter has already been determined using the ex-perimental layout, the appropriateness of the zo parameter obtainedfrom the fitting with that of the measured value from the experimentalsetup is also a test of fitting accuracy. The NLO absorption coefficients of undoped and La-doped TiO2nanorods growth on the FTO coating glass are listed in Table 3. As seenin the values tabulated in Table 3, after adding of La to the TiO2 na-norod arrays, there is an increase in B. Since the Z-scan experimentconditions are the same for both samples, this increase in NLO ab-sorption coefficient can be due to the adding of La doping to the TiO2nanorod arrays. Doping of TiO2 with La leads to the incorporation ofLa+ions in Ti4+ lattices. Since La and TiO2 are in different valencestates, oxygen vacancies can be generated [8]. According to the in-formation in the literature, the defects and oxygen vacancies play animportant role in changing the NLO properties of materials [27-29].Furthermore, the increase in NLO parameters with adding of La to TiO2lattice may be due to the presence of surface state caused by oxygenvacancy. Since the optical band gaps of undoped and La-doped TiO2 nanorodsgrown on the FTO coated glass substrates are about 3.17 eV and lieabove pulse energy of 2 photons of 532 nm (2hy), 2PA can be attributedto a transition process. Furthermore, there may be a higher order NLOmechanism involved in the absorption process. The free carrier ab-sorption is a second mechanism that can be involved in the absorption,depending on the lifetime of free carriers. According to the literature,TiO2 lifetimes vary from nanosecond to millisecond depending on thepreparation technique and crystal sizes [30-33]. On the other hand, ifthe duration of the incident laser pulse is larger than the recombinationtime of free carriers, the free carrier absorption must be taken intoaccount as an involved mechanism [34]. Considering the above con-ditions and usage of 10 ns excitation pulses in our experiments, it islikely that the free carrier absorption along with the 2PA will be an involved process in undoped and La-doped TiO2 nanorods arrays. From the value of B, we can calculate the imaginary part of sus-ceptibility through the relation: where入 is the excitation wavelength, no is the linear refractive index ofundoped and La-doped TiO2 nanorods, eo is the permittivity of freespace and c is the velocity of light in vacuum. The imaginary parts ofnonlinear susceptibility, Im(x), for undoped and La-doped TiO2 na-norods grown on the FTO coating glass are listed in Table 3, as well.The imaginary parts of the third-order NLO susceptibility, x, mea-sured equal to 5.70±0.20×10- and 19.0±1.07×10-esu forundoped and La-doped TiO2 nanorods,respectively. As can be seen inTable 3, there is an increase in Im (x) value after doping of TiO2 na-norod arrays. A figure of merit (F) for the undoped and La-doped TiO2 nanorodarrays has been also calculated and listed in Table 3. F is defined as Im(x)|/a, which determines the magnitude of the NLO absorption for theunit value of linear absorption loss [35]. In calculating the value of F,the unit conversion from esu to SI units performed according to x(m²/v)=1.4×10-8x(3(esu) [36]. The experimental setup displayed in Fig. 1 was used for measure-ment of NLO refractive index. In this experiment, the incident laserbeam after passing through the sample passes through a valve placed inthe far-field and then recorded by the third detector. The sample wastranslated along the z-direction that z is the position of the sample withrespect to the focal plane. The transmitted intensity passing through thepinhole was detected by the third detector. Various samples exhibitdistinct amplitudes of the Z-scan signal despite being in the same placeson the z-direction which leads to the different NLO responses. For these nanorods that exhibit NLO absorption as well as NLO re-fraction, Z-scan transmittance and contribution to the far-field beamprofile are coupled. To remove the contribution of the NLO absorptionfrom the closed-aperture Z-scan data, it is appropriate to divide themeasured data obtained from the third detector by the values recordedusing the second detector, point by point. As about the open-aperturedata, the final values were normalized by dividing every single datainto the average value of the first and last data. The closed-aperture normalized transmittance curve for TiO2 andLa-doped TiO2 nanorods synthesized by the hydrothermal method is Table 3 The linear and nonlinear optical parameters of undoped and La-doped TiO2 nanorod arrays at an intensity of 113 MW cmfor a wavelength of 532 nm. Samples α(m-)×10 n2 (cm²/W)×10-8 β (cm/W)×10 Im x(esu)×10-6 Rex(esu)× 10- y(3) (esu)×10-6 F(m’/v2)×10-20 Undoped TiO2 2.17 0.46±0.06 1.35±0.05 5.70±0.20 4.57±0.60 5.71±1.90 3.67±0.13 La-doped TiO2 4.47 0.63±0.04 4.42±0.25 19.0±1.07 6.39±0.40 19.0±2.26 5.95±0.33 Fig. 7. Typical closed-aperture Z-scan of the normalized transmittance as a function of the z position and theoretical fitting curves (solid lines) of undoped and La-doped TiO2 nanorod arrays. shown in Fig. 7. As shown in the Fig. 7, the closed-aperture curves forboth undoped and La-doped TiO2 nanorods exhibited a peak-to-valleyshape indicating a negative value of the nonlinear refractive index, n2.According to the information reported in the literature, we know thatself-defocusing of laser radiation in the nonlinear media occurs in thecase of n2<0 and the normalized transmittance versus z-positionexhibits a peak-to-valley shape. On the other hand, self-focusing occurswhen n2> 0 and the normalized transmittance shows a valley-to-peakshape [20]. The evidence shows that both undoped and La-doped TiO2nanorod arrays act as a self-defocusing material due to the presence of apeak before the focus and a valley after the focus. To retrieve the NLO refractive indices, n2, of the of undoped and La-doped TiO2 nanorod arrays, the normalized transmittance was fitted tothe following equation [37]: where in this equation Apo is the on-axis phase shift that related to n2 asAo =2sn2IoLeff/7 and Tnorm is the normalized transmittance. InFig. 7, the solid curve shows the best theoretical fit to the experimentaldata. The Origin software is used to fit the experimental data obtainedfrom closed-aperture Z-scan experiments by Eq. (4). By fitting the ex-perimental data with the Eq. (4), the NLO refractive indices of theundoped and La-doped TiO2 nanorod arrays are calculated which aretabulated in Table 3. According to the reports of Sheik-Bahae et al., the sign of NLO re-fractive indices of all materials change at about 2/3 E, [26]. The opticalband gaps of La-doped TiO2 nanorod arrays were calculated from DRSanalysis which is very close together as well as 2/3 E is smaller thanthe laser energy 532 nm. Therefore, there is no change in the sign of n2after adding of La doping to TiO2 nanorod arrays. However, from datain Table 3, the n2 value for La-doped TiO2 nanorods is an order ofmagnitude larger than the value of the undoped sample which attrib-uted to adding of La doping. The nonlinear refractive index, n2 is proportional to the real part ofxas: where eo is the vacuum permittivity and c is the light velocity in va-cuum. According to data in Table 3, it is found that the Im x3 of un-doped sample is one order of magnitude larger than the values for theRe x3. For La-doped sample this difference reaches to the2 orders ofmagnitude which means that the absorption effect is stronger than therefraction for undoped and La-doped TiO2 nanorod arrays. The third-order optical nonlinearities, x3, are calculated for TiO2and La-doped TiO2 nanorods using lx3l=[(Re(x’))?+(Im(x))]1/2 equation and are tabulated in Table 3, as well. A negative refractive nonlinearity for samples under investigationcan be attributed to the thermal effect which is expected in the case ofnanosecond pulses [38-41]. In the case of nanosecond time duration oflaser pulses, the thermal effect should be generally considered for themeasurements of NLO refraction due to the strong linear absorption ofthe pulse energy for the dispersion [38]. Under nanosecond pulse lasers the thermally induced optical non-linearity plays an effective role in TiO2 [40]. The response time (tc) ofthe thermally induced is a critical parameter and determines accordingto te=w/D relation which ωo is the beam waist radius and D is thethermal diffusion coefficient. When a sample is irradiated by a train ofpulses and the pulse width ofirradiation (tp) is smaller than the thermalcharacteristic time (tc), thermal diffusion effects are taken into account[38]. Considering the intrinsic thermal diffusivity of TiO2 of the orderof 10-7-10-6m²s-1[42,43], the response time was estimated of theorder of 10-4-10-3s which is larger than tp=10 ns in this study.Therefore, the thermal diffusion effects play a vital role in the undopedand La-doped TiO2 nanorod arrays grown on the FTO coating glasssubstrate. To estimate the thermo-optic coefficient of the nonlinear medium,we can use the (dn/dT)= nfhx/aw,expression, which (dn/dT) is thethermo-optic coefficient of the nonlinear medium, a is linear absorptioncoefficient, and k is the thermal conductivity of the medium. An esti-mation of dn/dT, by using the K~1.3-5.6Wm-1K-1[43], n2 valuesobtained from the Z-scan trace and keeping into account the presentgeometrical parameter for Z-scan experimental setup, comes out to be~-10-°1/K. Using nanosecond pulses for NLO experiments requires the con-sideration of the thermal contribution because the increase in tem-perature leads to an additional refractive index change. The increasingof nonlinearity with adding of La doping can be attributed to the changeof the refractive index through the local heating [44]. By increasingdefects due to the introducing of La to TiO2 lattice [8], a small amountof energy is absorbed by the defect states during the laser irradiation.Hence, increasing of the localized heating is caused by defect states dueto the thermal agitation of the particles results in altering the refraction[44]. Table 4 was drawn to make easier the comparison of the magnitudeorder of the La-doped TiO2 with other TiO2-based materials.Accordingto data in Table 4, NLO refractive index of TiO2nanorods/PMMA co-polymer-based nanocomposites was calculated of the order of 10-15which has a difference as much as 6 magnitude orders with n2 in thecurrent work [12]. The NLO investigations on the graphene-TiO2 na-noparticle composite and graphene-TiO2 nanowire composite reportedby Jiang et al. at 700 nm and 1100 nm contain highlight points which Table 4The NLO parameters of the various TiO2-based nanoparticles (NPs), nanocomposites (NCs), nanowires (NWs) and thin films. Ref. Material B (cm/W) n2 (cm’/W) x(3) (esu) Laser specs [10] Ag-doped TiO2 NPs RSA, 10-° - Nd:YAG, 532 nm, 7 ns, 1 Hz [11] Pt-doped TiO2 NPs RSA, 10 Nd:YAG, 532 nm, 7 ns, 1 Hz [12] TiO2 nanorods/PMMA NCs -10-15 - Ng:YAG, 532 nm, 25 ps, 10 Hz [13] Graphene-TiO2 NPs & NWs RSA, 10-6 -10-12 700nm SA, 10-' +10-11 - 1100 nm 35 fs, 2kHz [14] TiO, thin films SA, 10-4 +10-9 10-7 Nd:YAG, 532 nm, 35 ps, 10 Hz [15] PMMA-TiO2 nanohybrid thin films 一 +10-12 Ti:sapphire, 800 nm, 120 fs, 200 Hz [16] Au-doped TiO2 thin films SA, 10-6 +10-12 10-10 Ti:sapphire, 800 nm, 200 fs, 76 MHz [17] TiO2 thin films SA, 10-9 -10-13 10-11 Ti:sapphire, 800 nm, 50 fs, 200 Hz [18] TiO2 NPs RSA,- - 10-11 Nd:YAG, 532nm, 7 ns, 10 Hz, [19] La-doped BisTiNbOg thin films RSA, 10-5 Ti:sapphire, 800 nm, 100fs, 1 kHz Current work La-doped TiO2 nanorod arrays RSA, 10-+ -10-9 10-5 Nd:YAG, 532 nm, 10 ns, 200 Hz listed in Table 4 [13]. Iliopoulos et al. have reported the influence of thedeposition period on the NLO properties of TiO2 films on glass sub-strates prepared by hydrothermal method [14]. The NLO parameters, Band n2 have been obtained respectively of the order of 10-3cm/W (SAprocess) and 10-8cm²/W (with the sign opposite to the present work)which have the same order of magnitude for n2 of the La-doped TiO2nanorod arrays. Furthermore, the third-order nonlinearity in that workhas been reported in the order of 10-’esu. A positive NLO refractive index was reported by Sun et al., whosynthesized nanohybrid thin films of TiO2 nanoparticles in PMMAmatrix via sol-gel method [15]. They were obtained n2 of the order of10-12cm²/W at the wavelength of 800 nm with 120 fs pulses by usingthe Z-scan setup which was 3 times smaller than those of this work.Furthermore, Li et al. have reported NLO parameters of Au-doped TiO2and obtained a positive n2 of the order of 10-12 at 10°cm/W intensitywhich shows a magnitude of 3 times smaller than La-doped TiO2 in thiswork. They also calculated β for Au-doped TiO2 thin films on the orderof 10-6cm/W indicating 2 times smaller than that of La-doped TiO2here. The third-order nonlinearities reported of the order of 10-10 esuand 5 magnitude orders smaller than those of in the present work [16].In addition, Mani Rahulan et al. measured the NLO absorption coeffi-cients of Ag-doped TiO2 and Pt-doped TiO2 by means of Nd:YAG laser at532 nm of the order of 10-° with RSA process [10,11]. Due to theimportance of silver and gold in optoelectronics for high NLO para-meters compared to the most materials, the difference of several ordersof magnitude in NLO parameters of La-doped TiO2 and Au-doped TiO2thin films at similar intensity of radiation show that these nanorodarrays have a good NLO response and can be an ideal candidate forpotential applications in nonlinear optics. Third-order optical nonlinearities in anatase and rutile TiO2 thinfilms were studied by Long et al. by using the Z-scan method using afemtosecond laser (50 fs) at the wavelength of 800 nm. The anatase andrutile TiO2 thin films showed the SA process and NLO absorptioncoefficients of the order of 10-° and 10-8cm/W, respectively. On theother hand, both of them showed negative n2 of the order of10-13 cm²/W. Comparing the NLO refractive indices in that researchwith the current work reveals the differences as much as 5 times in theorder of magnitude of n2 [17]. The similar results in the sign of NLO parameters were reported inRef. [18]. They reported the values of the nonlinear susceptibility foramorphous, anatase, and rutile phases of TiO2 nanoparticles of theorder of 10-11 esu at the same laser intensity to the present work whichis 6 times smaller than the current values here. Chen et al., prepared La-doped Bi TiNbOg thin films with a layeredperovskite structure on the fused silica substrates by using the pulsedlaser deposition method [19]. They calculated β using a Z-scan tech-nique at a wavelength of 800 nm with a 100 fs duration laser. The va-lues of β in their work were of the order of 10-5cm/W and 10-1 cm/w² for 2PA and 3PA, respectively. Compared to the NLO parameters of TiO2- based materials whichlisted in Table 4, the large amounts of third-order NLO susceptibilitymeasured by the Z-scan technique in the present work exhibited theundoped and La-doped TiO2 nanorods synthesized by the hydrothermalmethod have a high NLO response and could be chosen as a goodcandidate for potential applications in nonlinear optics. 4. Conclusion Undoped and Lanthanum-doped TiO2 nanorod arrays with a bandgap energy about 3.17 eV were synthesized by hydrothermal method onthe FTO coating glass substrate. The X-ray analysis showed that La-doped TiO2 nanorods have rutile phase with lattice parameters ofa= 4.5804 and c =2.9637 A. The linear and nonlinear optical prop-erties were studied by UV-Vis spectroscopy measurement and Z-scantechnique, respectively. The measured third-order nonlinear suscept-ibilities of undoped and La-doped TiO2 nanorod arrays at 532 nm arequite high and of the order of 10-5 esu. The NLO considerations showed a tendency of increasing the valuesof B, n2, and xas the La doping added to TiO2 nanorod arrays. Theresults showed that the adding of La doping to the TiO2 nanorod arraysmake it a promising candidate for NLO device applications. ( References ) ( [1 ] X . C hen, S . S . Mao , Che m . R e v . 10 7 (2007) 2891- 2 95 9 . ) ( [2] A . R. A rm s t r on g , G . A r m str o ng , J . C a n a l e s , R . G arc ia, P . G . Bru ce , A dv. M a t er. 1 7 ( 20 0 5 ) 862-865 . ) ( V .V. Ki s l y u k, O . P . Dimitriev , J . N a n o sci. N an otech n ol. 8 ( 2008) 1 3 1-1 4 8 . ) ( H . H af e z , J. W u, Z . L a n, Q . L i , G . Xie , J . L in ,M . Hu a n g , Y. H u a n g , M.S . Abd e l - ) ( M o t t a l eb, N a no t ech n ology 2 1 ( 2 01 0) 41 5201. ) ( [5] X . Z h a n g, Z. B a o , X . T ao, H . S un , W . C hen , X . Z h o u , R SC A d v . 4 ( 2 0 14) ) 64001-64005. ( [6] M . Y an g , R . G u o , K . K a d e l, Y . L i u , K . O 'S h e a, R. B one, X. W an g , J. He, W . Li , J . M a ter. Chem. A 2 ( 2 014) 1 9 616- 1 962 2 . ) ( [7]K 1 . M an s ek i , T . I k ey a, A . T a mura , T . Ba n , T. Su gi u ra, T . Yo s h i d a , RS C Adv . 4 ( 201 4 ) 9 65 2-9655. ) ( [8 ] S . S ad h u, P . Poddar, RS C Adv . 3 (2 01 3 ) 10 363- 1 03 69 . ) ( [9] M 1. M e ks i , G . B e rhault , C . G uillard , H. Ko ch ka r, C a t a l . Commun. 6 1 ( 2 01 5 ) 107- 1 1 1 . [10] K . M an i Ra h ul a n , N .P a d m a natha n , L . D e v a r a j St e p hen , C har l e s ) ( Ch ristophe r K a nakam, J. Alloys Co mpd. 5 5 4 (2 01 3 ) 4 3 2 -4 37. ) ( [11] K . M an i Rahul a n , N. P a d manath a n, G. Vini t ha , C h arles Ch r i s t opher K anakam, M a ter . R e s. Bull . 4 8 (201 3 ) 3 0 3 7 -3 0 42. ) ( [12] C . S cia n ca l ep or e , T . C a s sano , M . L. C u r r i , D . M e c e rre y es, A. V al e n t in i , A. A gos tia n o, R . T o m masi, M . S tricc o li , N anote c hnolog y 1 9 (2008) 2 0 5 705- 2 0 5713. ) ( [ 13] Y . J ia n g, Y . Ma , Z . F an, P . Wa n g, X . Li , Y . W a ng , Y . Z ha n g, J . S h en, G . W ang, Z .- J . Y a n g, S. X i a o, Y . G a o, J . H e , O pt. L e tt. 43 ( 2 01 8 ) 52 3 -5 26. ) ( [14] K . I l i opoulos, G . Ka l o ge r a k is, D . V e r n ardou, N . Ka t s a rak is , E . K oudou m as, S . C o u ris, T h in S olid Film s 5 18 ( 20 0 9 ) 1 1 74 -1 1 7 6 . ) ( [15] X . S un, X . C h en, X . L iu, S . Qu , A ppl. P hy s. B 1 03 ( 2011)39 1 - 3 98. ) ( [16]J . L i, Y. G o ng , J . X u, G . W a ng, G. F a n g , J. So l - G e l S c i . Techno l . 6 7 (201 3 )5 2 7- 53 3 . ) ( [ 17] H . L o n g, A . C h e n, G . Y a n g , Y . L i , P . L u , T hin Sol id F il ms 5 17 (2 0 09) 56 01-5 6 0 4 .[ 18 ] S . D i vy a , S . Ind u , V . P . N. N a mp o o r i , P . R adha k r i shnan , A . M uj e e b , L aser T e chnol . 5 6 ( 2 0 1 4 )2 07 - 210 . ) ( [19]H . C h e n , B . Y a n g, M . Z ha ng, F . W an g, K . C h eah , W . C a o , J. A l l o y . C o mpd. 5 0 9 (20 11 )53 6 4 - 53 67. ) ( [20] M . Sh ei k - B a hae, A . A. Sa id,T. H. W e i, D.J. H a g an , E . W . v a n S t r yla n d , I EE E J . Q uant u m El e c t. 2 6 ( 4 ) ( 19 9 0) 7 60-769. ) ( [21] F . A b r i n aei, M . S h i raz i, J . M ater. S c i . M at e r. E l e c t r . 2 8 ( 2 0 1 7 ) 17 5 41 - 1 7 5 5 0. ) ( [22] J . Z ha n g, W . P eng, Z . C h e n , H . C hen, L . H a n , J. P hy s. C hem. C 1 1 6 (2012)1 9 182-1 9 1 9 0. ) ( [23 ] ] P . K u belk a , F. M un k , Z . T e ch. P h y s. 12 ( 1 93 1 ) 5 93 - 601 . ) ( [24 ] ] J . T o r r e n t , V. B arron, D iffuse r ef l ectance s pect r osco p y o f i r o n ox i des, i n: A . T . H ubb a r d (E d . ) , E n c y c l op e dia of S u r f ac e a n d Collo id S c ienc e , vol . 1 , M a r c el D ekk e r, I nc ., N e w Y o r k , 2 0 0 2 , p p . 1 4 3 8 -1446. ) ( [25] R . L o pez, R . G o mez, J. S ol - Ge l Sci . T ec h n ol . 6 1 ( 20 1 2) 1 - 7. ) ( [26] M . S hei k - B a h a e , D . C . H utch i ngs, D . J. H agan , E . W . V a n Stryl a n d, I E EE J . Q u an t . E l e c tron . 27 ( 1991) 1 2 96-1 3 0 9. ) ( [27] B . A nan d , S . R . K r i sh na n , R . P o d i l a, S . S i va S a n k a r a Sa i , A.M . Ra o , R . Ph i l i p, P h y s Chem. C hem . Ph ys. 1 6 ( 2 014 ) 8 168. ) ( [28] A . H. R es h a k , S . A u l u ck , R SC A d v. 7 ( 2 01 7 ) 1 47 5 2. ) ( [29] . A . A g rawal , R . K . S a ro j , T . A. Dar, P . Baraskar , P . Se n , S . Dhar , J . A pp l. P h ys . 1 2 2 ( 2 017) 1 95 3 03. ) ( [30 ] ] K . F uji ha ra ,S . I z um i, T . O hno,M. M a tsu m ura, J. P h oto ch em. Ph o to b i o l . Ch e m . 1 3 2 ( 2000) 99-10 4 . ) ( [31] ] Y . Y am ada, Y. K a nemitsu, Ap pl. P hy s. L ett. 1 01 ( 201 2 )13 39 07. ) ( [32] T . S e ki ya, M . T a s a k i , K . W akab a y a shi, S. K u rita, J. L um in. 1 0 8 ( 2 0 04 ) 69-7 3 . ) ( [ 33] K . W aka b a ya s h i, Y. Y a m ag u ch i, T . S e k i ya, S. K u r i t a , J . L u mi n . 11 2 ( 2 0 0 5 ) 5 0- 5 3. [34]L i tt y I r im p a n , A . D e e p t hy, B . K r i s h n a n , L . M. K ukreja, V . P. N . R a dh a k r ish n a n , ) P. Nampoori, Optics Commun. 281 (2008)2938-2943. ( [35] | A. S a nt h i , V . V. N a mboodiri, P . R a d ha k rishnan , V . P .N. Na m p oori, J. A p p l. P h y s. 1 0 0 (20 06)053 1 0 9 . ) ( [36] T .Sc hneider, N o nlinear O p t i c s i n T e l eco m municati o ns, S p r ing e r , 20 04 . ) ( [37] E . W . V an S t r yl a n d, M . S h e i k -Ba h ae, Z - s c an me a s u r em e n ts of opt i c a l nonlineari t ies, i n: M .G . K u z yk , C . W. D ir k (Ed s.), C h ar a c te r i z a t ion T echni q ues a n d T a bul a ti o ns fo r O rganic N onl i n e a r O p t i c a l M a terials , M a r ce l D ek k er I n c , N ew Y o r k, 1 9 98, pp . 655-692 . ) ( [38] M . F al c oni eri , J . O pt. A : P ure A p pl. Opt .1 ( 19 99) 6 6 2. ) ( [39] M . Y u k s e k , T. C e y ha n, F . B a g c i, H. G ii l Y ag l i og lu, A. E l m a l i , o . B e k a r og l u , Op t . Commun. 2 81( 2 0 0 8) 3 897 . ) ( [40 ] S . D i vy a , V . P. N . N a m poori, P . R a d h akri s hnan, A. M u j ee b , C h i n . Ph y s . B 23 ( 8) ( 20 14) 0842 03. ) [41]J. Yang, Y. Song, J. Gu, H. Zheng, Opt. Commun. 282 (2009) 122. ( [42] X 】 . F e n g, X. Huang, X. Wang, N a n ote c h n o l o gy 2 3 ( 2 012) 1 85701 . ) ( [43] R 1 iy a Sebas t i an, M . S . Sw ap na , Vi m a l R a j , M i sh a H a r i , S. S a n k ar a ra m an , Ma te r. R e s . E x p r ess 5 (2018) 0750 0 1. ) ( [44] 1 R . P o nnusamy , D . S i v as u brama n ia n , P. S re e ka n th, V. G a n d h i raj, R. P h i l ip, G . M. B hal e r a o , R S C A dv. 5 (2 01 5 ) 80 7 56 . ) La-doped TiO2 nanorod arrays were prepared using the hydrothermal method and the effects of doping on the structural and linear optical properties were considered by using UV–Vis diffused reflectance spectroscopy (DRS), field emission scanning electron microscopy (FESEM), X-ray diffraction (XRD), energy dispersive X-ray spectroscopy (EDS), and X-ray photoelectron spectroscopy (XPS) analyses. The XPS analysis confirmed the presence of La doping in TiO2 nanorod arrays. According to XRD patterns, La doping leads to an enhancement of lattice parameter, c, as well as a reduction in the other lattice parameter, a, which indicates an expansion along the c direction of the lattice in La-doped TiO2 nanorods. From UV–Vis DRS analysis, the band gap energy of undoped and doped samples were calculated by using Kubelka- Munk method that exhibited a slight decreasing with adding of La doping. The measurements of nonlinear optical (NLO) properties of undoped and La-doped TiO2 nanorod arrays carried out using a nanosecond Nd: YAG pulse laser by using the Z-scan technique. Both samples showed a negative NLO refractive index at 532 nm. The NLO absorption of undoped and La-doped nanorod arrays is attributed to two-photon absorption. The nonlinear susceptibility, χ(3), of undoped and Ladoped TiO2 nanorods was determined by the Z-scan technique of the order of 10−5 esu which is remarkably largevalue. The consequences suggest that undoped and La-doped TiO2 nanorod arrays may be a promising candidate for the NLO applications.
确定
还剩6页未读,是否继续阅读?

产品配置单

北京欧兰科技发展有限公司为您提供《掺镧TiO2纳米阵列中非线性光学响应检测方案(激光产品)》,该方案主要用于其他中非线性光学响应检测,参考标准--,《掺镧TiO2纳米阵列中非线性光学响应检测方案(激光产品)》用到的仪器有Ekspla NL200型 紧凑纳秒激光器
相关方案
更多
该厂商其他方案
更多