方案详情
文
The flexibility provided by the inverted microscope configuration of the LabRAM INV is ideally suited to in situ Raman measurements within microreactor channels.
Information on flow properties, mixing and reactions within channel networks can be obtained, allowing reactions to be fully optimised. In particular, the Raman concentration imaging method described in this application note provides a valuable tool for testing and validating mathematical models of organic reactions in these microchannel systems. reactions within channel networks can be obtained, allowing reactions to be fully optimized, In particular, the Raman concentration imaging method described in this application note provides a valuable tool for testing and validating mathematical models of organic reactions in these microchannel systems.
方案详情

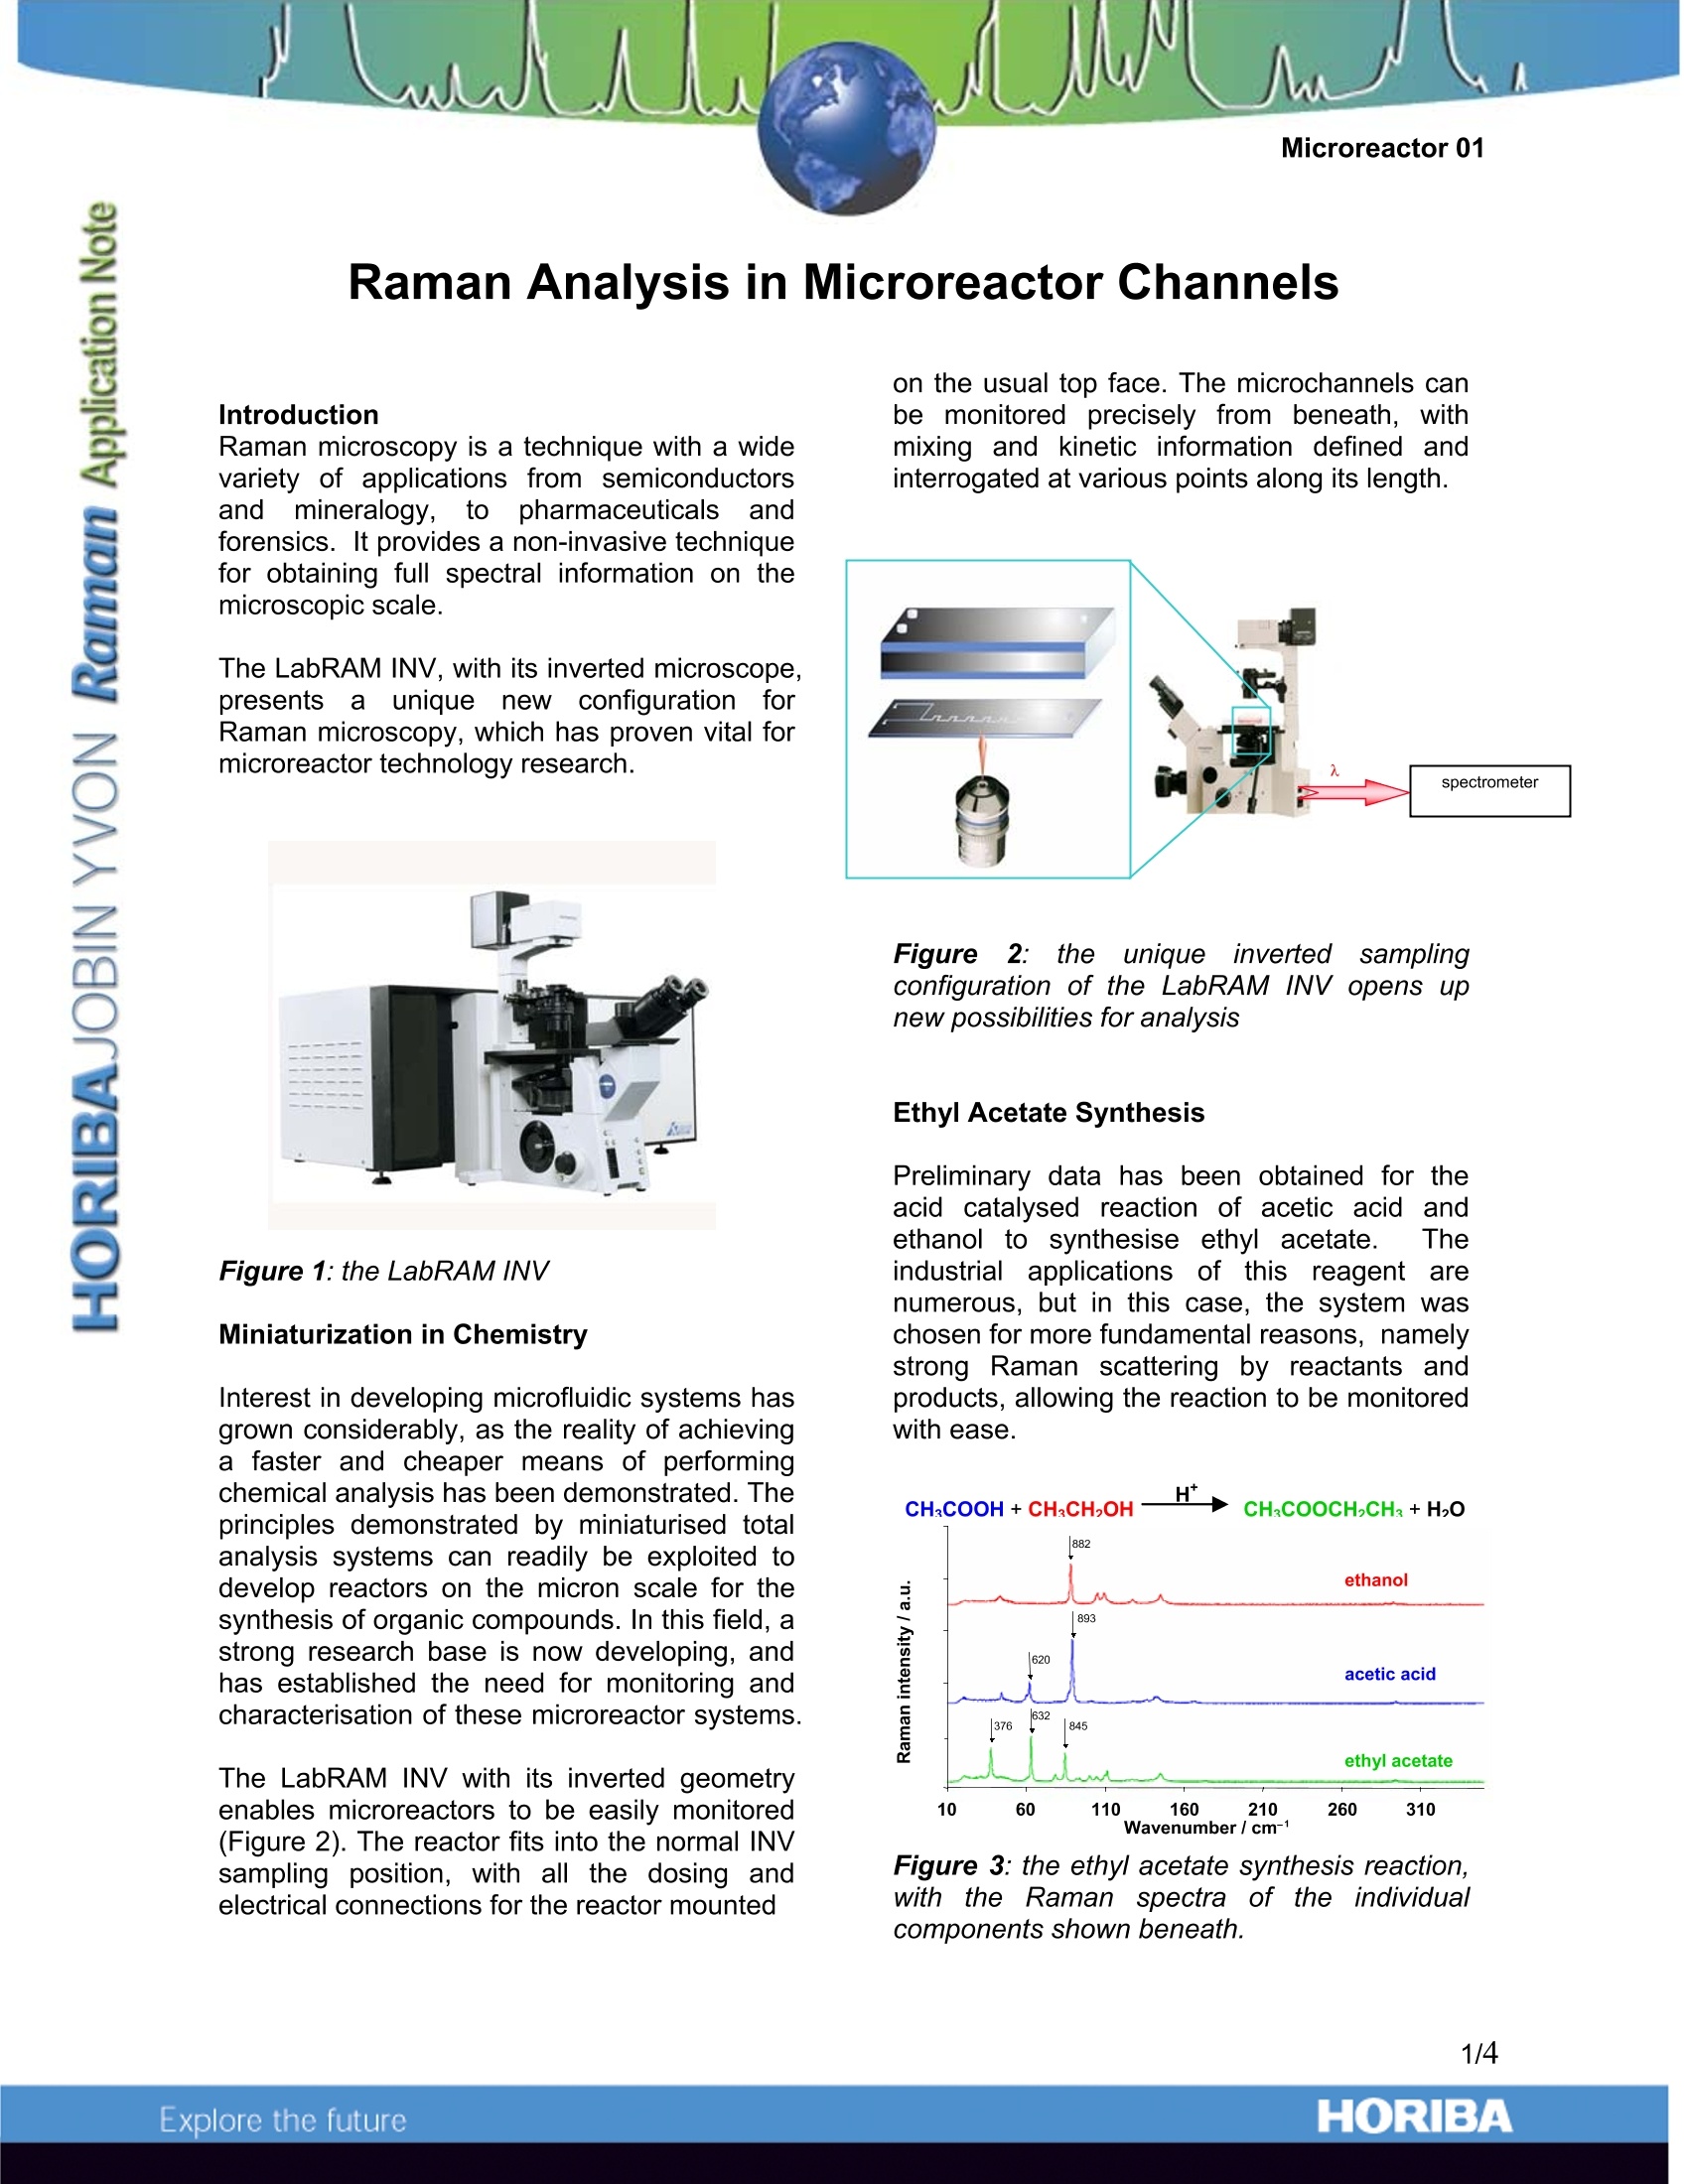
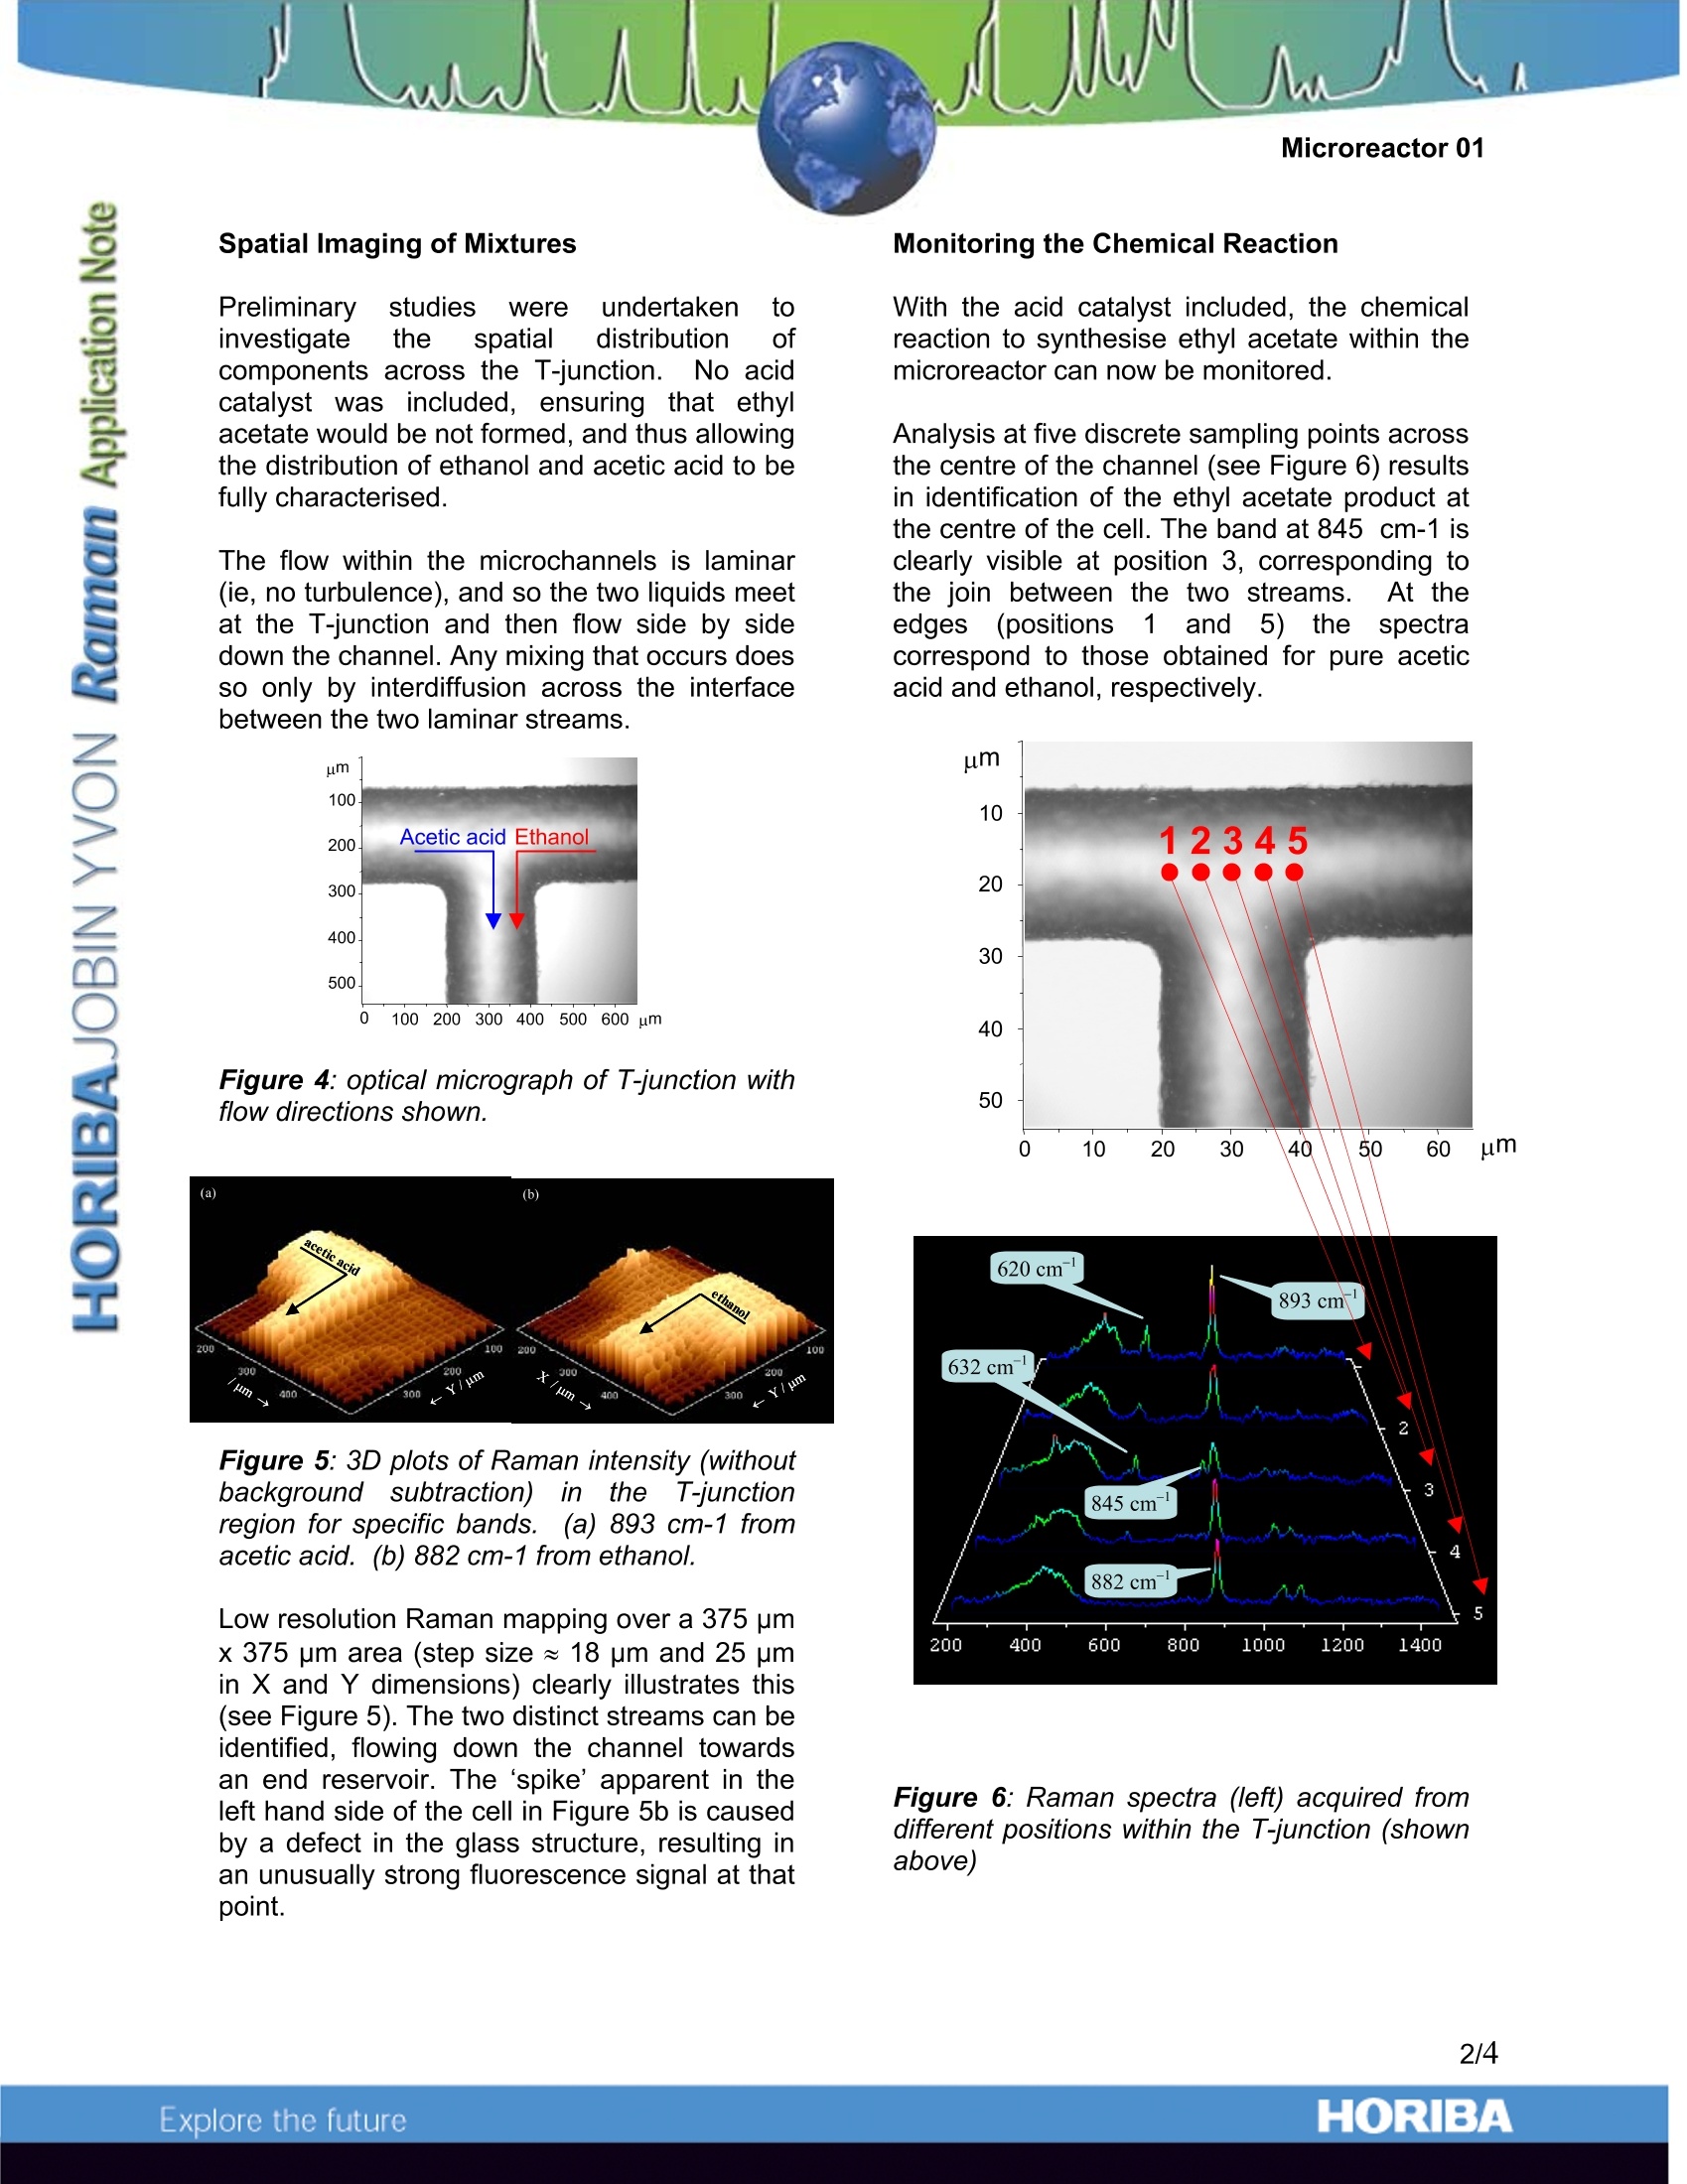
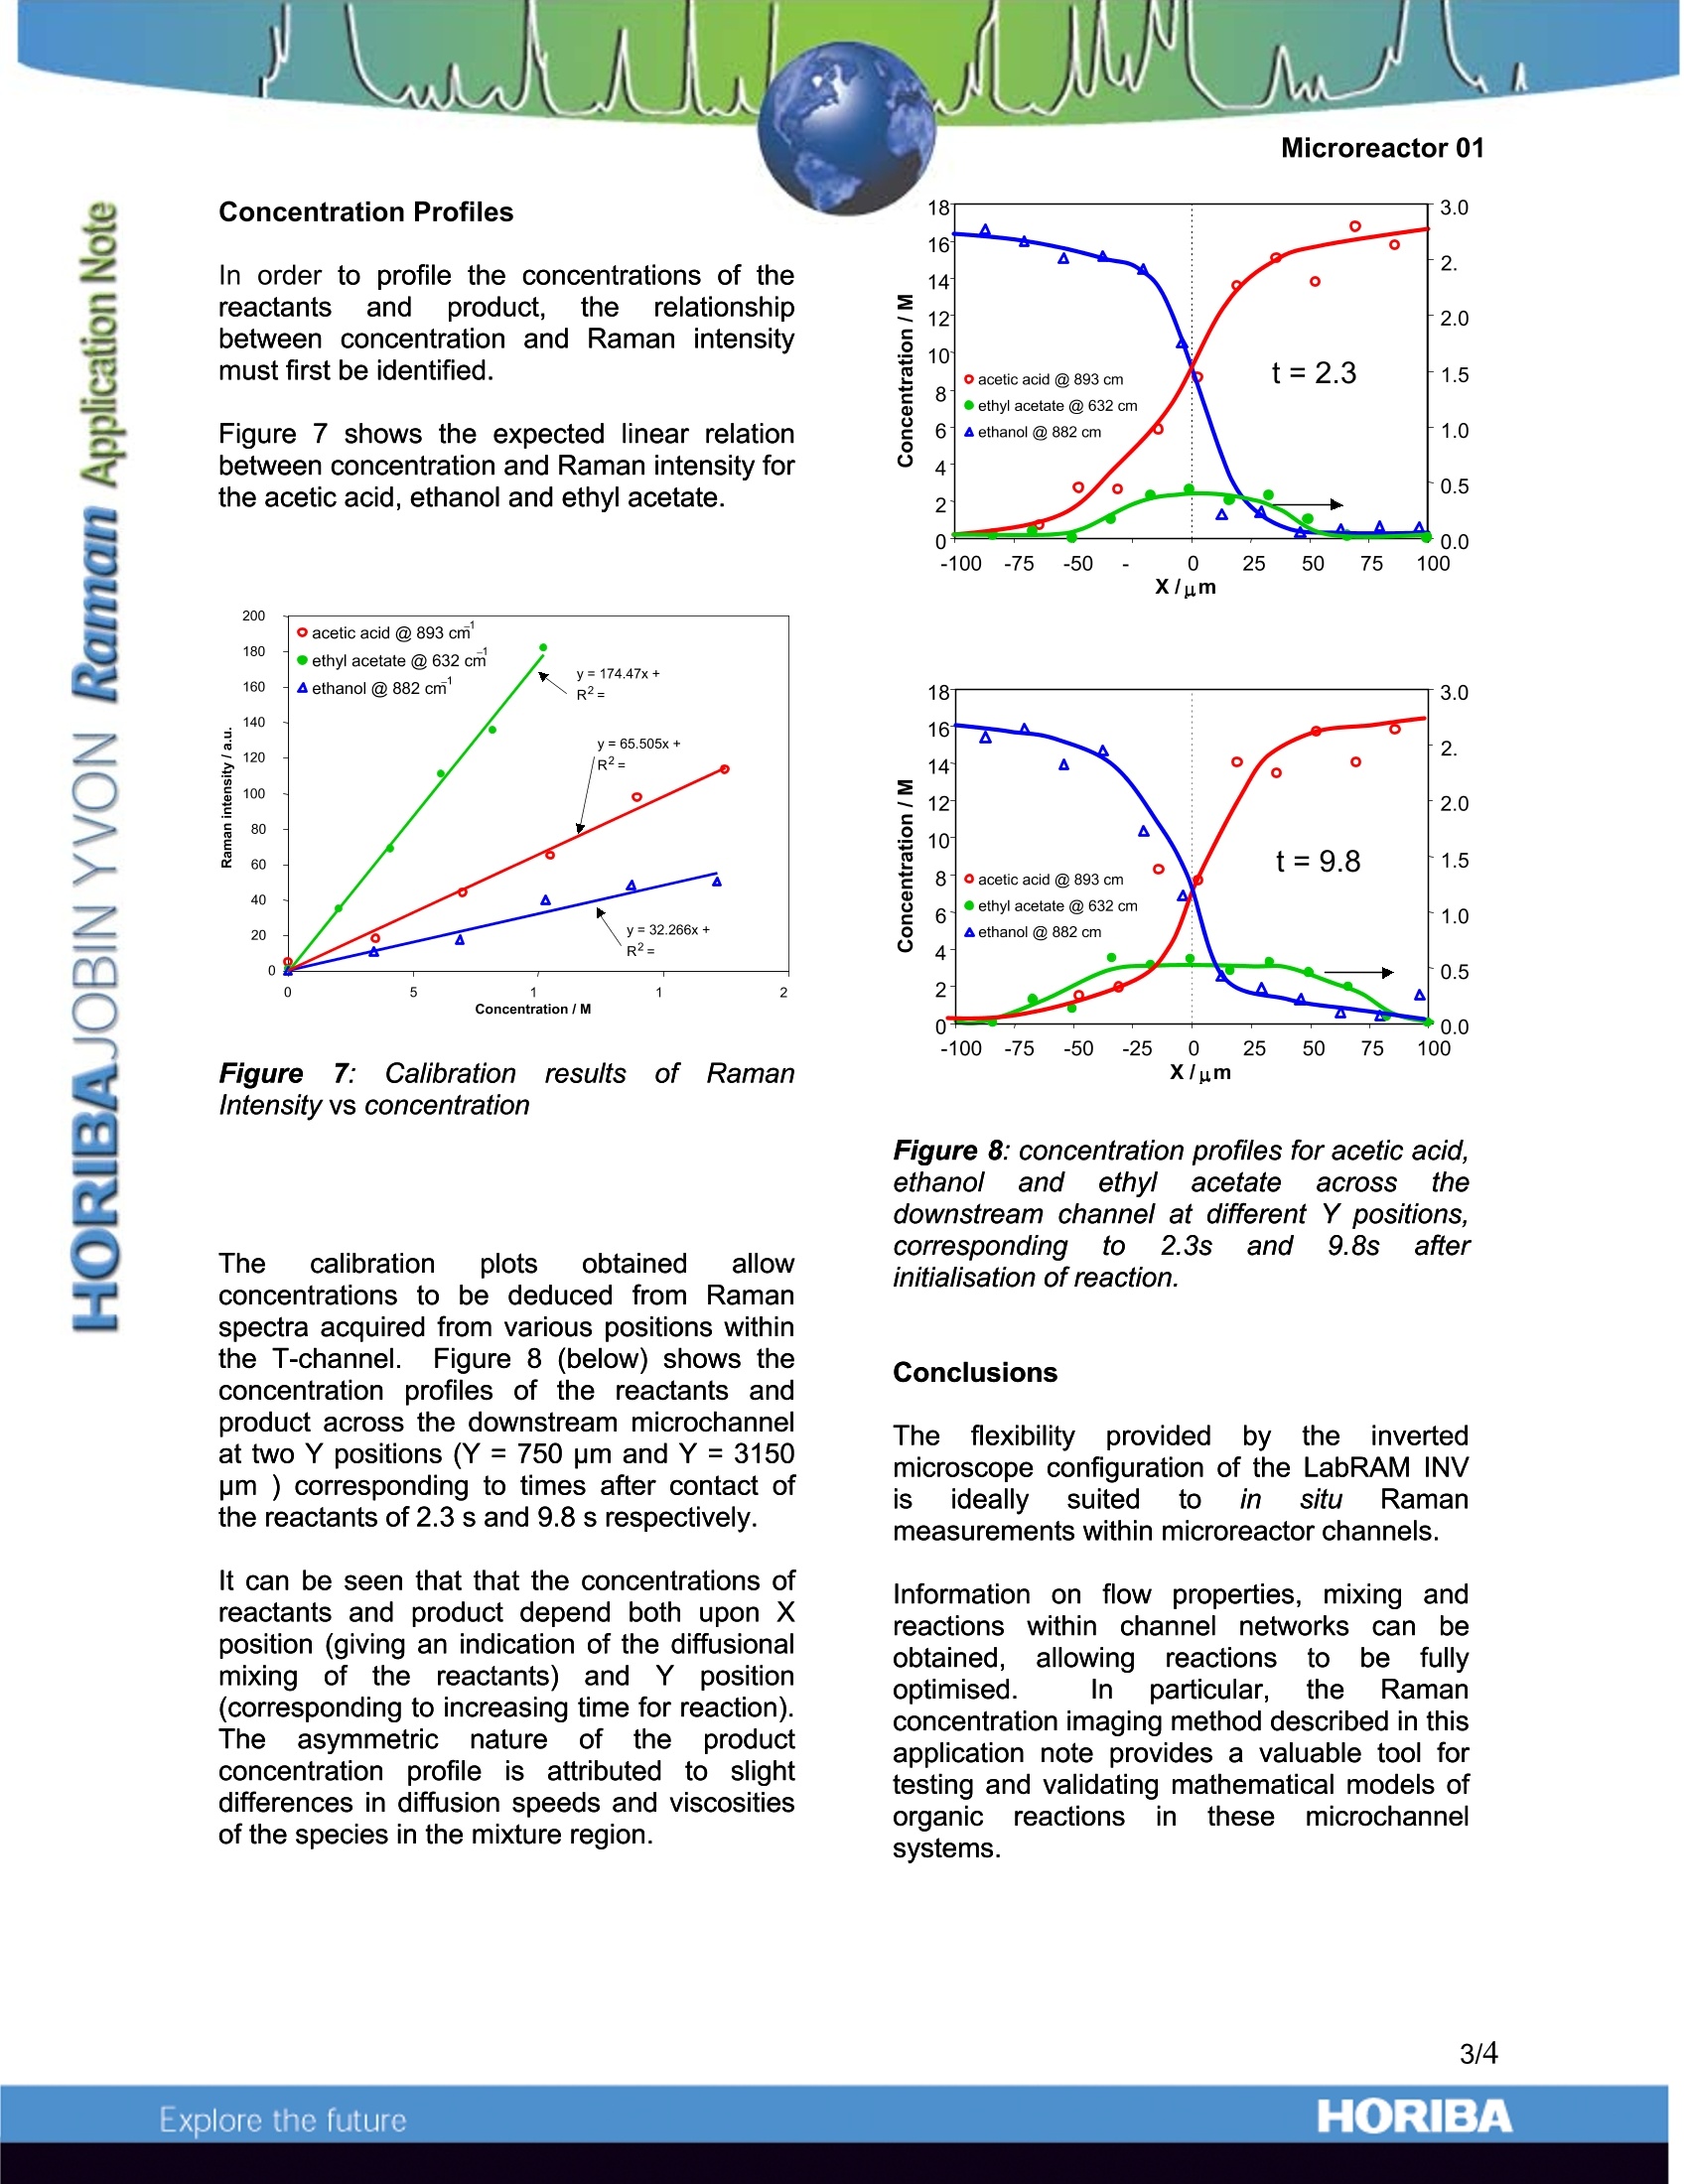
Microreactor 01 Raman Analysis in Microreactor Channels Introduction Raman microscopy is a technique with a widevariety of applications from semiconductorsand mineralogy, to pharmaceuticals andforensics. It provides a non-invasive techniquefor obtaining full spectral information on themicroscopic scale. The LabRAM INV, with its inverted microscope,presentsaLunique new configuration forRaman microscopy, which has proven vital formicroreactor technology research. Figure 1: the LabRAM INV Miniaturization in Chemistry Interest in developing microfluidic systems hasgrown considerably, as the realityof achievinga faster and cheaper means of performingchemical analysis has been demonstrated. Theprinciples demonstrated by miniaturised totalanalysis systems can readily be exploited todevelop reactors on the micron scale for thesynthesis of organic compounds. In this field, astrong research base is now developing, andhas established the need for monitoring andcharacterisation of these microreactor systems. The LabRAM INV with its inverted geometryenables microreactors to be easily monitored(Figure 2). The reactor fits into the normal INVsampling position, with all the dosing andelectrical connections for the reactor mounted on the usual top face. The microchannels canbe monitored precisely from beneath, withmixing and kinetic information defined andinterrogated at various points along its length. Figure 22:: the unique invertedsamplingconfiguration of the LabRAM INV opens upnew possibilities for analysis Ethyl Acetate Synthesis Preliminary data has been obtained for theacid catalysed reaction of acetic acid andethanol to synthesisee ethyl acetate. Theindustrial applications; of this reagentitarenumerous, but in this case, the system waschosen for more fundamental reasons, namelystrong Raman scattering by reactants andproducts, allowing the reaction to be monitoredwith ease. Figure 3: the ethyl acetate synthesis reaction,with the Raman spectra of the individualcomponents shown beneath. Spatial Imaging of Mixtures Preliminarysstudies were undertakeninvestigate the spatialdistribution bfcomponents across the T-junction. No acidcatalyst was included, ensuring that ethylacetate would be not formed, and thus allowingthe distribution of ethanol and acetic acid to befully characterised. The flow within the microchannels is laminar(ie, no turbulence), and so the two liquids meetat the T-junction and then flow side by sidedown the channel. Any mixing that occurs doesso only by interdiffusion across the interfacebetween the two laminar streams. Figure 4: optical micrograph of T-junction withflow directions shown. Figure 5: 3D plots of Raman intensity (withoutbackground subtraction) in theT-junctionregion for specific bands. (a) 893 cm-1 fromacetic acid. (b) 882 cm-1 from ethanol. Low resolution Raman mapping over a375 pmx 375 pm area (step size ~ 18 pm and 25 pmin X and Y dimensions) clearly illustrates this(see Figure 5). The two distinct streams can beidentified, flowing down the channel towardsan end reservoir. The 'spike' apparent in theleft hand side of the cell in Figure 5b is causedby a defect in the glass structure, resulting inan unusually strong fluorescence signal at thatpoint. Monitoring the Chemical Reaction With the acid catalyst included, the chemicalreaction to synthesise ethyl acetate within themicroreactor can now be monitored. Analysis at five discrete sampling points acrossthe centre of the channel (see Figure 6) resultsin identification of the ethyl acetate product atthe centre of the cell. The band at 845 cm-1 isclearly visible at position 3, corresponding tothe join between the two streams.5.At theedgeess ((prositions11 and 5) theesspectracorrespond to those obtained for pure aceticacid and ethanol,respectively. Figure 6: Raman spectra (left) acquired fromdifferent positions within the T-junction (shownabove) Concentration Profiles In order to profile the concentrations of thereactants and product. the relationshipbetween concentration and Raman intensitymust first be identified. Figure 7 shows the expected linear relationbetween concentration and Raman intensity forthe acetic acid, ethanol and ethyl acetate. Figure7:: Calibration results: ofRamanIntensity vs concentration The calibration plots obtained allowconcentrations to be deduced from Ramanspectra acquired from various positions withinthe T-channel. Figure 8 (below) shows theconcentration profiles of the reactants andproduct across the downstream microchannelat two Y positions (Y=750 pm and Y= 3150pm) corresponding to times after contact ofthe reactants of 2.3 s and 9.8 s respectively. It can be seen that that the concentrations ofreactants and product depend both upon Xposition (giving an indication of the diffusionalmixing of the reactants) and Y position(corresponding to increasing time for reaction).The asymmetric nature of the productconcentration profile is attributed to slightdifferences in diffusion speeds and viscositiesof the species in the mixture region. X/um Figure 8: concentration profiles for acetic acid,ethanolandethy/acetate acrosstthedownstream channel at different Y positions,correspondingto)22.3s and 9.8s afterinitialisation of reaction. Conclusions The flexibilityprovided bytheinvertedmicroscope configuration of the LabRAM INVis ideally suited tooin situ Ramanmeasurements within microreactor channels. Information on flow properties, mixing andreactions within channel networks can beobtained,, allowing reactionsto be ifullyoptimised. Inn particular,the Ramanconcentration imaging method described in thisapplication note provides a valuable tool fortesting and validating mathematical models oforganicreactions in thesemicrochannelsystems. 八 The true confocal performance of the LabRAMsystems ensures that the best possible spatialresolution can be achieved so that the Ramansignalccanbe analysedwith minimainterference from background effects, such asfluorescence from the glass substrate. lnaddition, the capability for multiple laserwavelengths allows a wide range of reactionsto be studied with the one instrument. Acknowledgements Paul Fletcher, Stephen Haswell (Department ofChemistry, University of Hull) and Xunli Zhang(Micro Chemical Systems, Ltd., Hull) are kindlythanked for providing thee data forthisapplication note. Key Reference Paul D. I. Fletcher, Stephen J. Haswell andXunli Zhang, Monitoring of chemical reactionswithin microreactors using an inverted Ramanmicroscopic spectrometer, Electrophoresis,2003,24,3239 ORIBAExplore the future ORIBAExplore the future The flexibility provided by the inverted microscope configuration of the LabRAM INV is ideally suited to in situ Raman measurements within microreactor channels.Information on flow properties, mixing and reactions within channel networks can be obtained, allowing reactions to be fully optimised. In particular, the Raman concentration imaging method described in this application note provides a valuable tool for testing and validating mathematical models of organic reactions in these microchannel systems. reactions within channel networks can be obtained, allowing reactions to be fully optimized, In particular, the Raman concentration imaging method described in this application note provides a valuable tool for testing and validating mathematical models of organic reactions in these microchannel systems.
确定
还剩2页未读,是否继续阅读?
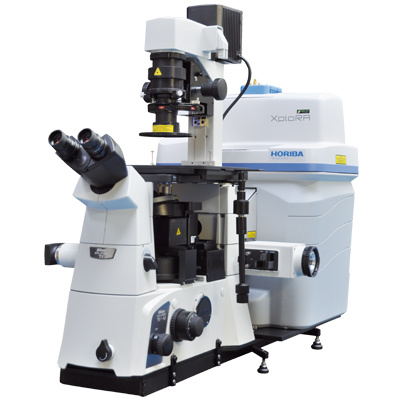
HORIBA(中国)为您提供《微反应器通道中乙酸乙酯反应监控检测方案(激光拉曼光谱)》,该方案主要用于其他中乙酸乙酯反应监控检测,参考标准--,《微反应器通道中乙酸乙酯反应监控检测方案(激光拉曼光谱)》用到的仪器有HORIBA XploRA INV多功能拉曼及成像光谱仪
相关方案
更多
该厂商其他方案
更多

