


The molecular origins of second order nonlinear effects in type I collagen fibrils have been identified with sum-frequency generation vibrational spectroscopy. The dominant contributing molecular groups are: i) the methylene groups associated with a Fermi resonance between the fundamental symmetric stretch and the bending overtone of methylene, and ii) the carbonyl and peptide groups associated with the amide I band. The noncentrosymmetrically aligned methylene groups are characterized by a distinctive tilt relative to the axis perpendicular to the main axis of the collagen fiber, a conformation
producing a strong achiral contribution to the second order nonlinear
effect. In contrast, the stretching vibration of the carbonyl groups associated with the amide I band results in a strong chiral contribution to the optical second order nonlinear effect. The length scale of these chiral effects ranges from the molecular to the supramolecular.
方案详情

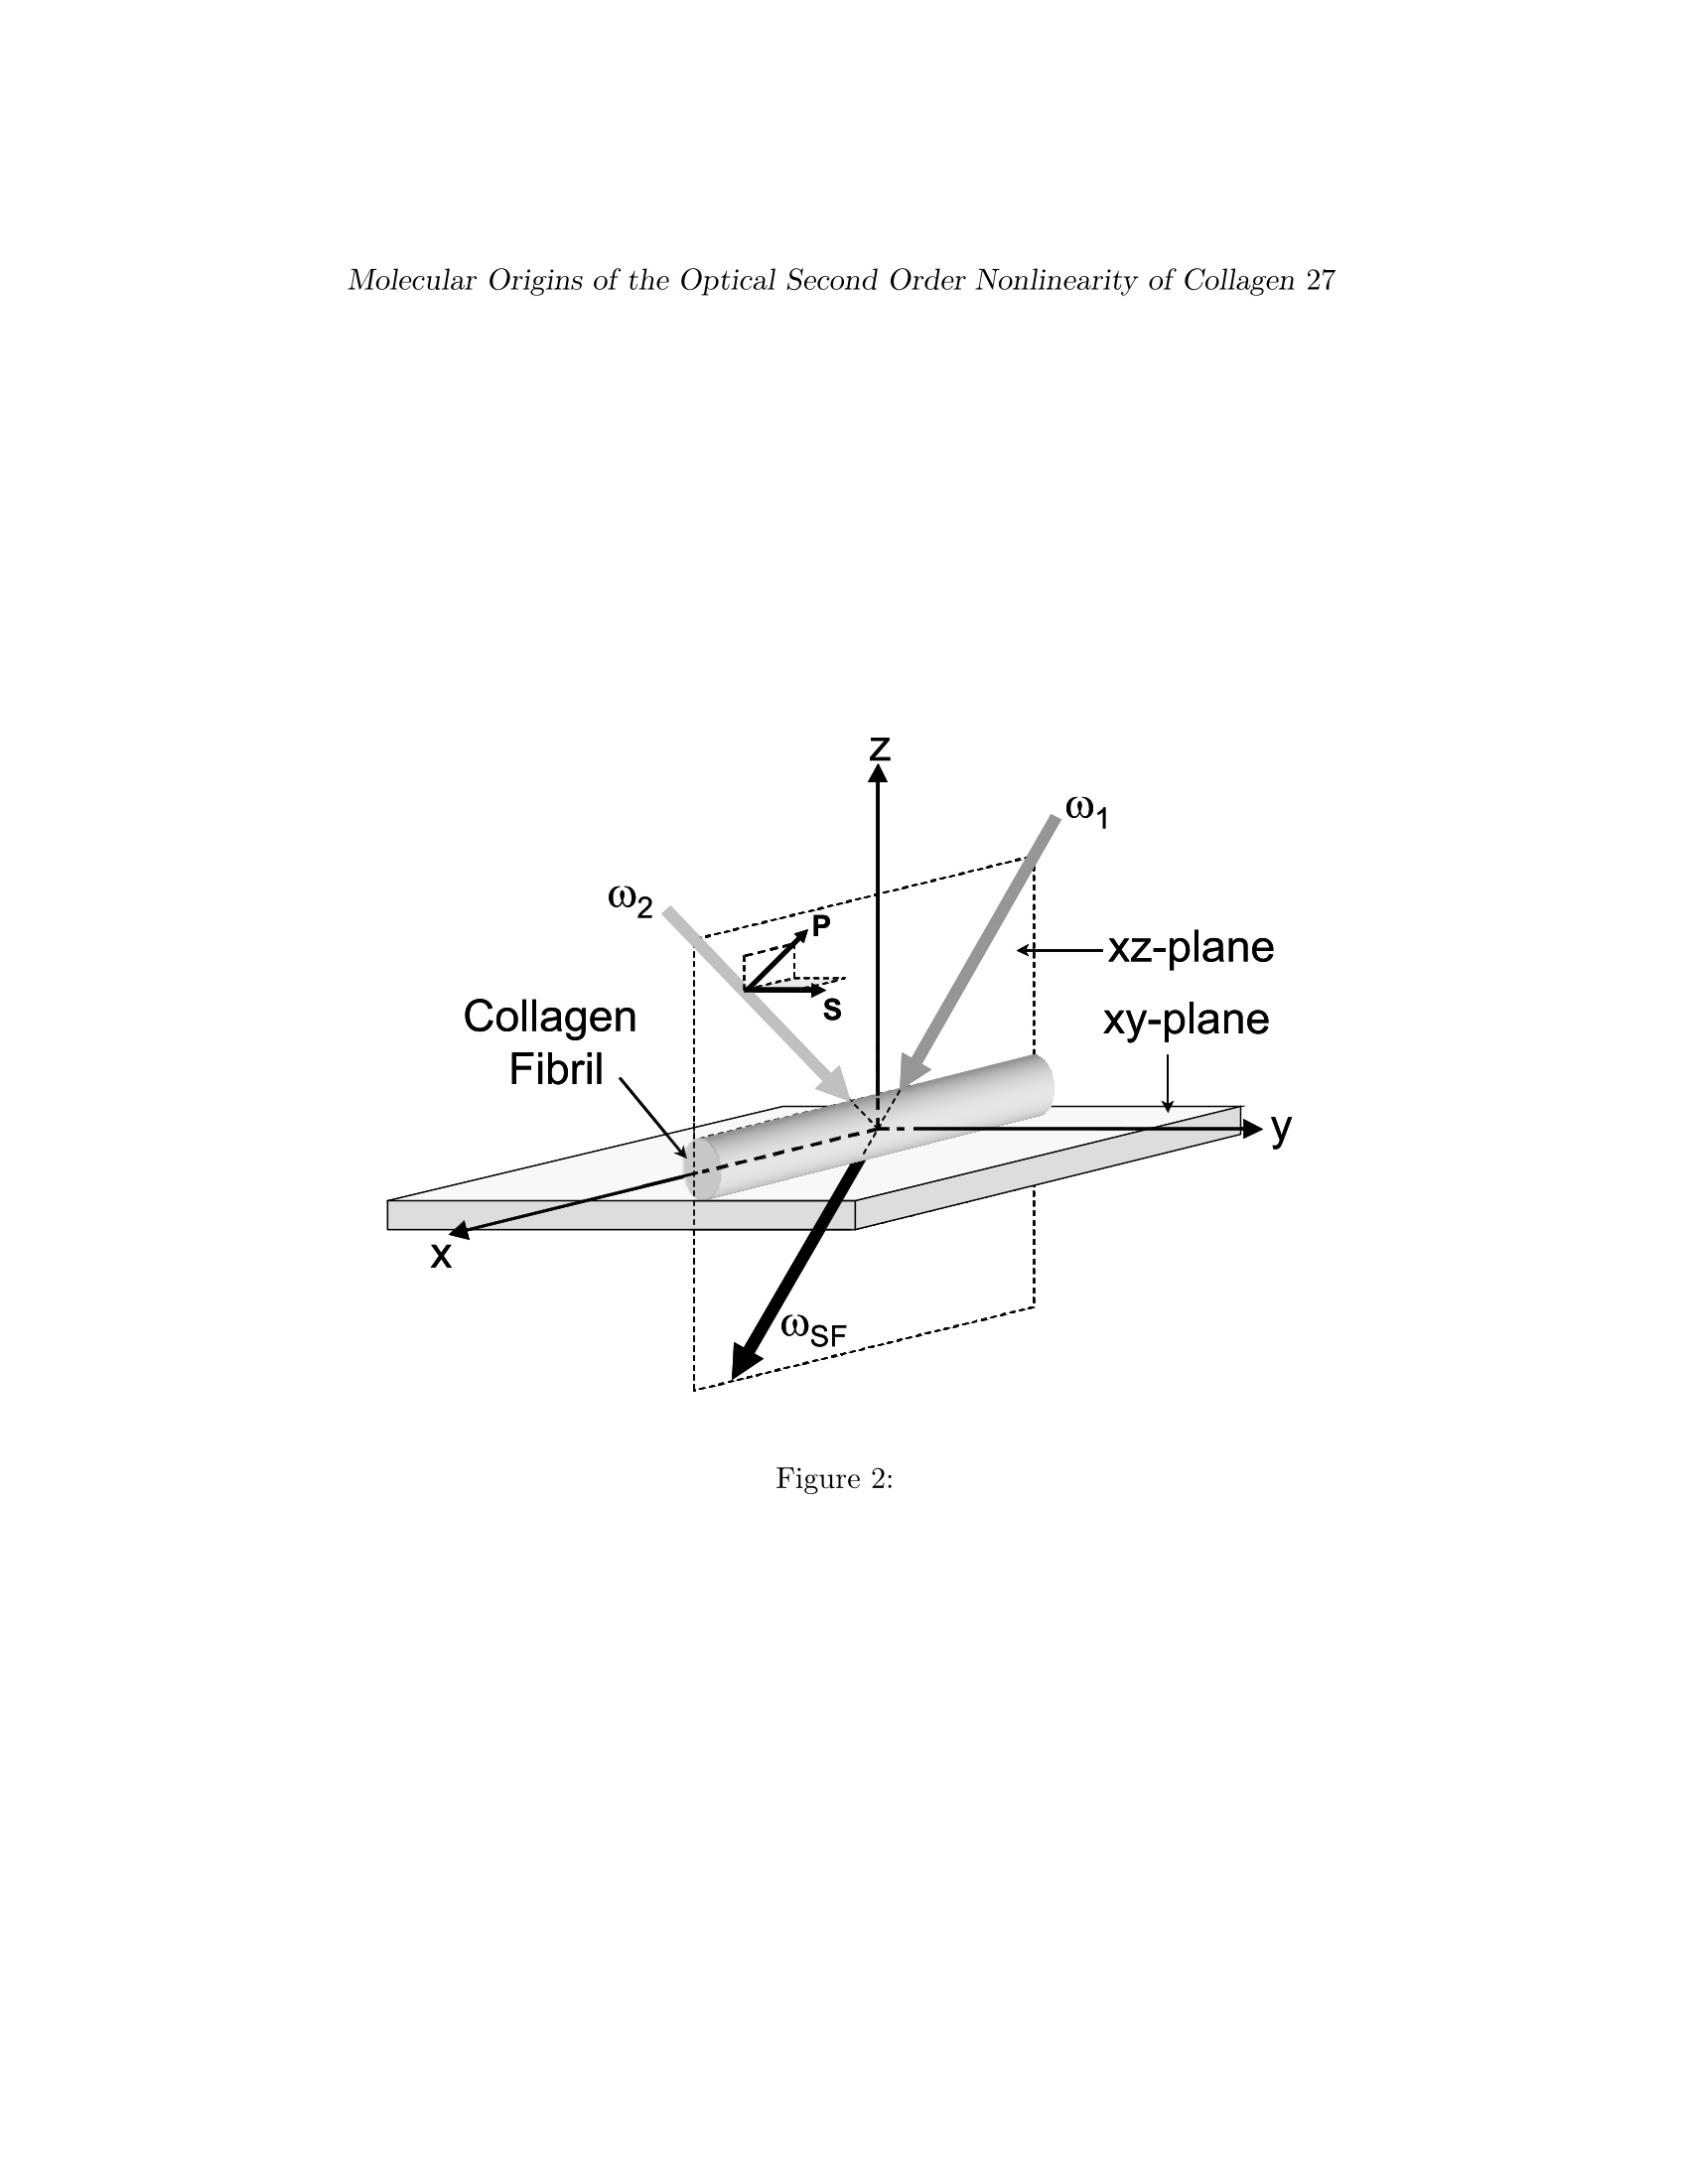
Biophys J BioFAST, published on August 31, 2007 as doi:10.1529/biophysj.107.111047 Molecular Origins of the Optical Second Order Nonlinearity of Collagen2 Copyright 2007 by The Biophysical Society. This un-edited manuscript has been accepted for publication in Biophysical Journal and is freely available onBioFast at http://www.biophysj.org. The final copyedited version of the paper may be found at http://www.biophysj.org. Sum Frequency Vibrational Spectroscopy: TheMolecular Origins of the Optical Second OrderNonlinearity of Collagen Israel Rocha-Mendoza*2, Diego R Yankelevich*, Mingshi Wang*, Karen M Reisert, Curt W Frank and Andre Knoesen* *Department of Electrical and Computer Engineering, University of California, Davis,CA, USA;IDepartment of Neurological Surgery,University of California, Davis, CA, USA; +Department of Chemical Engineering, Stanford University, Palo Alto,CA, USA. August 16, 2007 Acknowledgement: The research was funded by the National Science Founda-tion under Award DMR0213618 to the Center on Polymer Interfaces and Macro-molecular Assemblies (CPIMA). I. Rocha-Mendoza was also supported by the UCMexus-Conacyt Research Followships No. 030197 and 140019. "Present affiliation: Cardiff University, School of Biosciences, Cardiff, Wales,UK Abstract The molecular origins of second order nonlinear effects in type I collagenfibrils have been identified with sum-frequency generation vibrational spec-troscopy. The dominant contributing molecular groups are: i) the methylenegroups associated with a Fermi resonance between the fundamental symmet-ric stretch and the bending overtone of methylene, and ii) the carbonyl andpeptide groups associated with the amide I band. The noncentrosymmetri-cally aligned methylene groups are characterized by a distinctive tilt relativeto the axis perpendicular to the main axis of the collagen fiber, a conforma-tion producing a strong achiral contribution to the second order nonlineareffect. In contrast, the stretching vibration of the carbonyl groups associ-ated with the amide I band results in a strong chiral contribution to theoptical second order nonlinear effect. The length scale of these chiral effectsranges from the molecular to the supramolecular. Introduction The collagens are a superfamily of extracellular matrix proteins that playa crucial role throughout the lifespan of all metazoan lifeforms, from earlygrowth and development through maintenance of homeostasis. All colla-gens are composed of three polypeptide chains, called a-chains, that foldtogether to form the characteristic triple helix. Each a-chain is coiled into aleft-handed helix that winds around a common axis to form a right-handedtriple helix (Fig.1). The collagen molecule may be either a homotrimer(three identical a-chains) or a heterotrimer (a mixture of two or three genet-ically distinct chains). More than 27 collagen types and 42 distinct a-chainshave been identified in vertebrates, as well as 15 additional proteins withcollagen-like domains (1). All members of the collagen superfamily sharecertain characteristics, necessitated by the coiled-coil structure of the triplehelix. Glycine, the smallest amino acid, must occupy every third position inorder to allow packing of the coiled-coil structure. Hydroxyproline frequentlyoccupies the third position in the Gly-X-Y triplet, providing stability to thehelix, while proline is often in the X position (2-6). Each twist is about threeamino-acids in length. These tight twists do not result in steric hindrancedue to the location of glycine, the smallest amino acid, at the center of thesuperhelix, a conformation that allows the bulky side chains of amino acidsat the X and Y positions to point outward. The three a-chains are connectedby hydrogen bonds between the NH of the glycine and the CO of the prolinein the X position of a neighboring a-chain. The pyrrolidine rings of prolineand hydroxyproline impose additional steric restrictions, causing each a-chain to fold into a left-handed helix while simultaneously twisting togetheralong a common axis to form a right-handed superhelix. At the supramolec-ular level, collagen molecules are organized into complex assemblies of fibrilsor networks related to their tissue functions; structural features of these as-semblies, in conjunction with other post-translational modifications, serveas the basis for grouping the different collagen types into 9 “families” (1).The fibril-forming collagens represent the most abundant group, consistingof collagen types I, II, III, V, XI, XXIV and XXVII. In this paper we focuson type I collagen, the predominant member of this group. Type I collagen is characterized by a complex hierarchical organization,in which discrete structural features are discernible at scales of organizationextending over many orders of magnitude (7).The process of fibril for-mation begins as soon as procollagen, the precursor of collagen, undergoesenzymatic cleavage of its nonhelical propeptide extensions at its C- and N-termini, shortly after it is secreted by the cell. It is energetically favorable for the collagen molecules to line up next to each other, with each molecule off-set by approximately 1/4 its length from neighboring molecules. This offsetof 67 nm is known as the D-period (8). Microfibrils, consisting of pentamericassemblies of aligned collagen molecules, represent the first supramolecularstructures. The fibers have a mean diameter between 0.5 and 3 microme-ters and can be up to several hundred micrometers long. These structuresare stabilized over time by enzymatically-mediated intermolecular covalentcrosslinks. In many tissues microfibrils interact to form architecturally com-plex structures. Although fibrillar collagen has been extensively studied fordecades, the molecular mechanisms underlying many structural and func-tional properties have been remarkably difficult to elucidate, perhaps duein part to the complexity of its organization.. The electro-optical proper-ties of collagen, such as piezoelectricity and second harmonic generation,have proven to be particularly elusive with respect to identifying proximalmolecular mechanisms. Piezo-electricty and second harmonic generation are present only in ma-terials characterized by the absence of a center of symmetry on a micro-scopic scale that extends over macroscopic distances. Non-centrosymmetryin nonlinear optical organic media can be satisfied in at least three ways.First, noncentrosymmetric alignment of dipolesproduces a large second or-der hyperpolarizability, an effect we refer to as the “achiral”contribution.Second, the chirality of helical macromolecules, which are by definition non-centrosymmetric, can produce a significant nonlinear chiral contribution (9).A characteristic of the chiral contribution is that a fundamental input beampolarized parallel to the plane of incidence, produces a second harmonic ra-diation polarized orthogonal to the input polarization. Third, the intrinsicasymmetry present at any interface can produce “surface effects” however,this effect is typically negligible in macromolecular organic structures. Themolecular origins of chirality in second order nonlinear effetcs have beenrecently reviewed (10). Freund and co-workers have performed an extensive investigation of thep5Tolarity of collagen with SHG(11-15).The cylindrical symmetrical ar-rangement of collagen molecules about the long axis present in collagenfibril implies an effective Co symmetry when an average is taken over thedimensions of the wavelength of light. Freund confirmed that the Co sym-metry produces an achiral effect that generates the largest second harmonicradiation polarized along the symmetry axis for a fundamental beam polar-ized parallel to the same axis. They concluded that the polarity in type Icollagen is associated with two structures: a network of very fine polar fila-ments permeating the tendon and a small number of polar surface regions that may represent dense accumulations of the filaments. All of the filamen-tous structures have same direcitonality.. While they could not determinethe molecular origins of the polarity,they argued that structural consider-ations suggested that it was unlikely to arise from the collagen triple helixitself. First, covalent bonds that could potentially contribute to polarity,such as C=O, N-H and C-H bonds are almost all perpendicular to the mainaxis. Second, the dipolar effects produced by C-N bonds would cancel eachother out.The contribution of bound water was excluded because SHGproduced in wet and dry samples did not differ remarkably. They concludedthat the“polar structures of connective tissue are likely to be composed ofother substances”. The contribution of supramolecular helicity to nonlinear chiral effectshas been an area of recent interest, following the report that the helical ar-rangement in helicene is the source of a supra-molecular nonlinear chirality(9). Campagnola and co-workers speculated that the SHG in collagen couldbe enhanced by chiral contributions (16). While each a-chain is expected toproduce a chiral second-harmonic contribution, the cooperative effect of thetriple-helical supra-molecular structure of collagen should produce an evenlarger chiral nonlinear effect. No conclusive experimental evidence was pre-sented in support of this claim at that time. Recently, Plotnikiv et. al. (17),supported this claim by concluding that SHG signal arises from the pitchangle of a single collagen glycine-proline helix. While this conclusion was jus-tified by theoretical fittings of SHG polarization anisotropy signal of fibrillarcollagen, there is no identification of the molecular groups contributing tothe chiral and achiral second order optical nonlinearity. Pena and co-workersshowed that the chiral enhancement in the optical nonlinearity of collagenis small (less than a factor of 2) by performing SHG experiments on thinlayers of collagen molecules isotropically oriented on a substrate but werenot organized into fibrils (18). It was concluded that the large SHG signalsobserved in connective tissue is due to the high density and microscopiccrystalline order in collagen fibrils. Williams and co-workers concluded thatthe SHG is produced by the outer shell of a collagen fibril and within a<50 nm region, instead of from the bulk of the fibril by measuring ratiosof forward and backward scattering of SHG from fibrils (19). Sum-frequency generation vibrational (SFG-V) spectroscopy representsan attractive approach for identifying the molecular groups responsible forsecond-order nonlinear optical effects (20-22). Initially, applications of SFG-V focused on relatively small molecules oriented at interfaces; the methodis increasingly being applied to more complicated macromolecules such asproteins (23-27). Helical proteins are of particular interest, since they are inherently noncentrosymmetric and possess electric-dipole allowed second-order nonlinearity (28,29). For example, our group has identified the achiralmolecular origins of second order nonlinear effects in poly-alpha-benzyl-L-glutamate (PBLG), a synthetic o-helical protein, self-assembled film (25). In this paper we use sum-frequency generation vibrational (SFG-V) spec-troscopy to identify the molecular structures that give rise to both the chiraland achiral optical second order nonlinear effects in native Type I collagenfibrils. In sum-frequency generation a sample is irradiated with two beams ofcoherent light at different angles of incidence, one at a frequency in the vis-ible range, one at a frequency in the infrared range. Within the sample twophotons (one from each beam) combine to form a single photon at a thirdfrequency, which is dependent on the second order optical nonlinearity ten-sor elements (wSF=Wvis+WIR). In SFG-V spectroscopy wIR is tuned whilekeeping Wuis fixed, and near some molecular vibration resonances the out-put signal is increased through resonant enhancement, producing the SFG-Vspectra. A vibrational transition will only be observable in a SF spectrumif it is both Raman and IR active, which also implies that centrosymmetricmolecular transitions will not be detected (20). Near a molecular vibrationtransition (wy),provided the input frequencies are not close to an electronicresonance of the medium, each molecular hyperpolarizability tensor elementBij'k', expressed in the molecule-fixed coordinate system (i',j',k’=a,b,c),is proportional to a factor that depends on the Raman transition dipole mo-ment and the IR transition dipole moment associated with that vibrationtransition (21). In the limit of weak coupling between the microscopic non-linear molecular units, the macroscopic second-order susceptibility tensorelements are xink = NDivik Rijk,i'j'k Bij'k in the laboratory coordinatesystem (i,j,k=c,y,z), where N is the number density of molecules whichcontribute to the SFG signal, Rijk,i'j'k are elements of the Euler rotationmatrix, Bi i'k is the hyperpolarizability tensor in the molecular coordinates,and the subscripts ijk are associated with the sum-frequency, visible,andIR electric fields, respectively. The output intensity is IsF x XeffIvisIIRand Xeff=[e(wsf)·L(wsf)]·x(2):[e(Wwvis)·L(wvis)][e(wIR)·L(wIR)], wheree(w) is the unit polarization vector and L(w) the Fresnel factor at w (30).By controlling the input polarizations and detecting a specific output polar-ization,specific tensor elements can be accessed, from which the orientationof molecular groups can be deduced. The coordinate system shown in Fig. 2 is used for our SFG-V transmis-sion measurements. The main axis of the collagen fiber is oriented alongthe x-axis and the z-axis. The z-axis is perpendicular to the sample in the plane of incidence. A uniform orientation of the collagen fiber parallel tothe x-axis is important to avoid misinterpreting any anisotropic effects aschiral contributions (31). The notations P and S refer to beam polarizationsparallel and perpendicular to the plane of incidence, respectively. With themain axis of the collagen molecules along the x-axis, the 27 Xijk tensorelements can be divided into elements that contribute to either achiral orchiral effects.The susceptibility tensor elements that contribute to chiraleffects are those pertaining to orthogonal components, e. g. Xijk (i/j/k)(10, 18, 22, 28, 32). The remaining elements contribute to the more commonsecond-order nonlinear effects, the achiral effects. Experimentally one canaccess the chiral and/or achiral tensor elements by setting different input(visible and IR) beam polarizations and analyzing the SFG intensity. Table1 shows the tensor elements accessed by the different input output polariza-tion combinations according to the coordinate system shown in Fig. 2. ThePPP (with e(wsf),evis, and eIn all P polarized), SSP, PSP and SPP config-urations couple to IR-vibrations molecules within the plane of incidence thathave components normal and/or parallel to the collagen fibril axes. The SSS,PPS, SPS and PSS configurations couple to the IR-vibrations of moleculesperpendicular to the plane of incidence. Only achiral elements are accessedby the input/output beam polarization combinations configurations PPP,SSP, SPS, SSS, and PSS. Both chiral and achiral elements are accessed bythe SPP, PSP, and PPS configurations. In these configurations the achiralcontributions are zero under certain conditions. One example is the isotropicorientation of chiral molecules in a liquid (32). Another example occurs inazimuthally isotropic media with the symmetry axis along either the x- orz-axis, in which case Xyox = Xyzz = Xrya =Xxary= Xzzy=0 (28, 33). Toavoid that anisotropic effects are misinterpreted as chiral contributions, wewill use second harmonic imaging to ensure that the sample has a uniformdistribution of fibers along a preferential axis, and will align this axis to thex-axis in our SFG-V measurements.3.With this uniformity and orientationestablished in our experimental configuration, it can be assumed that onlychiral tensor elements contribute sum-frequency generated by the SPP, PSPand PPS configurations. The polarization properties of SHG intensity from fibrillar and filamentprotein structures is well modelled using a C. cylindrical rod symmetry(15, 17, 34). This symmetry has four nonzero elements Xror, Xxyy=XxzzyXyry =Xyyo =Xzxz=Xzza and Xyzx =-Xzyc =-Xzoy = Xyaz· Typically inSHG measurements a single beam with a wavelength far off electronic reso-nances is used. Considering the particular case when the beam is propagat-ing along the z-direction, with a linear polarization in the xy-plane, the only tensor elements probed by the laser beam are Xxor and Xryy =Xyry. A smallratio between these two independent susceptibility tensors, Xxae/Xryy << 1,implies that the SHG intensity signal polarized along the fibril axis is lesswhen the polarization of the fundamental electric field is parallel to the fib-ril than perpendicular to it. Having a signal polarized perpendicular to theplane of incidence is an indication that a chiral contribution is taking placeand in such a case it is bigger than the achiral contribution. This techniquehas been used to determine the relative chiral and achiral contributions ofcollagen fibrils, myosin filaments and astroglial filaments (17, 34). In con-trast to such SHG measurements, with SFG-Vspectroscopy we were capableto explicitly identify the chiral and achiral contributions of the moleculargroups to the second order optical nonlinearity of collagen. Experimental Methods Native type I collagen fibrils, a few hundred of microns in width and aboutone centimeter long, were prepared in vitro from native rat tail tendons(Sprague-Dawley). Individual tendon fascicles were removed from rat tailtendon bundles under a dissecting microscope. SFG spectroscopy measure-ments of collagen samples were made in transmission mode under condi-tions of ambient temperature and humidity.The IR and visible light beamswere overlapped spatially and temporally as shown in Fig. 3.The visi-ble green 0.532 um beam was produced by a frequency-doubled Nd:YAGlaser with 22-picosecond pulses at 10 Hz repetition rate (EKSPLA modelPL2143C) whereas the infrared tunable beam (2.5 to 8 um) was produced byan OPG/OPA/DFG unit (EKSPLA PG501VIR/DFG). For this wavelengthrange the system was delivering 60 to 15 uJ pulse energy while its line widthwas kept smaller than 6 cm-1. The energy fluence in the collagen samplewas kept constant by setting the energy of the focused IR and visible beamsfrom 50 uJ and 3 uJ, respectively. The IR wavelength was stepped undercomputer control in 5 nm increments. Using a combination of a polarizer, a入/2 plate and a focusing lens, the visible beam was attenuated, set to P/S-polarization and focused onto the collagen sample. The IR P/S-polarizationwas set using a ZnSe IR-coated Fresnel rhomb (II-VICorp.) and a ZnSe 25cm focal length lens focused the beam to the sample. The angle betweenthe incident infrared and visible laser beams was kept constant at 90 de-grees.The direction of the transmitted SFG beam was determined by themomentum conservation condition. Due to the roughness of the sample thetransmitted SFG and the pump visible beam where strongly scattered. The use of a telescope system allowed the SFG beam to be collected withoutthe necessity of tracking its direction. An analyzer was placed before thephotomultiplier tube (PMT) to characterize the polarization of the SFG sig-nal. An interference filter (Notch-PlusTM, Kaiser Optical system, Inc.) wasused to reject the scattered 0.532 um beam, and sharp cut edge color filters(Edmund Scientific, #J30635) were used to filter spurious signals from theOPA while transmitting the sum-frequency signal. The signal produced inthe PMT was transformed via a 50 resistance and then pre-amplified us-ing a 300MHz quad preamplifier (Stanford Research Systems, SR445). Thepre-amplified data was averaged using a gated integrator (Stanford ResearchSystems, SR250) where baseline subtraction was performed to reduce thebackground noise floor. The averaged data was digitized using an A/D (IOTech. Corp.) and sent to a PC. SHG polarization modulation imaging (35) was used to confirm that themicrofibrils were distributed evenly over the region of exposure and thatmolecular orientation was parallel to the main axis of the collagen fibril. ATi:Sapphire oscillator (SpectraPhysics, Tsunami) was used to generate lin-early polarized ~200 fs pulses at a wavelength of 840 nm, with a maximumenergy of 5 nJ, and at a repetition rate of 79 MHz.The laser beam wasspatially filtered and collimated. The polarization direction of the linearlypolarized input beam was rotated at a 1.5 kHz rate with an electro-opticmodulator (EOM, Model 360-80; Conoptics, Danbury, CT) and quarter-wave plate (Babinet-Soleil compensator, Karl Lambrecht Corp.). The EOMhas its axes oriented at 45 degrees to the polarization of the input beam andthe quarter-wave plate has its axis oriented at 45 degrees to that of the EOM.The quarter-wave plate converts the elliptically polarized light that exits theEOM into linearly polarized light rotated by some angle with respect to thelaser polarization direction. The degree of rotation is directly proportionalto the applied voltage: from 0 degrees for 0 V to 180 degrees for the full-wave voltage of the EOM. A function generator (DS345; Stanford ResearchSystems, Sunnyvale, CA) provided a saw-tooth waveform at 4 kHz with anamplitude that drives a high voltage power supply (Conoptics 302A) to thefull-wave voltage of the EOM. The beam was focused onto the sample by along working distance microscope objective (100X, NA=0.7,6.35mm work-ing distance, Mitutoyo) to a measured beam waist ~1.5 mm. The sampleis mounted on motorized x-y-z translation stages (Newport ESP300 Con-troller, 850F Motorized Micrometers, connected to a National InstrumentsPCI-GPIB card). The transmitted second harmonic signal was collected us-ing a microscope condenser (Olympus 1.4 Achromat). The second harmonicsignal was filtered with color glass bandpass filter (Newport BG-40) with a peak transmission of ~95% (at ~415 nm) and the second harmonic signalwas detected with a photomultiplier tube (Hamamatsu, R212UH) mountedin a light-tight enclosure to minimize stray light. The polarization modu-lated beam produced a SHG signal with frequency components at the firstand second harmonic of the modulation frequency (35). Lock-in amplifiers(SR830; Stanford Research Systems, Sunnyvale, CA) were set to detect theamplitude and phase of the SHG signal at both the first and second har-monic of the modulation frequency. The reference frequency was the 4 kHzharmonic of the signal modulating the driving the EOM. Assuming that acollection of collagen molecules in a fibril has Co symmetry, the intensityof the first modulation harmonic is proportional to the maximum secondharmonic intensity produced in the plane of the sample, and the phase ofthe second harmonic of the modulated intensity is proportional to the pro-jection of the average orientation for collagen molecules onto the plane ofthe sample. The x and y outputs from the lock-in amplifier were digitizedby an A/D converter (National Instruments PCI-6025E) from which the sec-ond harmonic intensity produced by collagen and average orientation of thecollagen molecules were determined. A second harmonic image of the orien-tation of collagen assemblies of a typical sample used in our experiments isshown in Fig. 4. The sample shows good uniformity in fibril orientation overan area of 300 × 300 micron which is larger than the 50 micron diameterspot of the focused IR beam used in the SFG-V measurements. Unpolarized Fourier transform IR vibrational spectra (Nicolet Nexus670 FT-IR) were taken in transmission mode..Raman spectral measure-ments (Bruker RFS 100/S Raman spectrophotometer, using a diode-pumpedNd:YAG laser as pump, coupled to microscope (Bruker, RamanScopeIII)were taken in reflection mode from a sample mounted onto a optically-thickgold-coated microscope slide. Results and Discussion Vibrational IR and Raman Spectra of Fibrillar Collagen We performed our investigation in a type I collagen fibrillar array becauseboth the macromolecular structure as well as the supramolecular organi-zation of collagen molecules contribute to the macroscopic optical nonlin-earity of fibrous collagen. This requirement significantly complicates theinterpretation of the SFG-V spectra. Even for relatively simple molecularstructures the spectral assignments for SFG-V is less straightforward thanfor IR absorption and Raman spectra (20). Furthermore, extracting infor- mation about the orientation of molecules or parts of molecules from theSFG-V spectra is challenging (36, 37). In addition,the interpretation of IRabsorption and Raman spectra of protein is complicated by overlap in thecontributions produced by the many different vibrational modes that canoccur in these large, complex molecules. The investigation of structure atthe supramolecular level of organization introduces an additional level ofcomplexity in the interpretation of the SFG-V spectra. For such reasons wecomplement of our SFG-V spectra with IR absorption and Raman spectrataken on the same sample, since a vibration peak is only sum-frequencyactive if it is both IR and Raman active. The unpolarized IR and unpolarized Raman spectra for the collagensample are shown in Fig. 5. The observed IR and Raman spectral featuresare consistent with other measurements of collagen in the spectral regionfrom 1200 cm-1 to 3400 cm-1. General spectral assignments areire l eby comparing the polarized SFG-V spectra with unpolarized Raman and IRspectra, and focusing on commonalities. The spectroscopic characteristics ofcollagen appear to be dominated by the tripeptide sequence glycine, prolineand hydroxypoline (Gly-Pro-Hyp) (38), based on similarities between theIR spectra of polyproline and polyglycine and the spectra of collagen (38-41). Due to the proximity of the frequency positions of methyl (CH3) andmethylene (CH2), a common mistake is to assign the peaks ofthese spectralregions to the vibrational stretching and bending modes of both groups inconnective tissue (40, 42-44). The overall content of methyl in collagen isvery low when compared to methylene; for every 1000 residues in collagenthere are approximately 1236 methylene and 230 methyl groups (45,46). Forthis reason, collagen spectral features in the 1300 to 1500 cm-1 and 2800 to3000 cm-regions are primarily due to the methylene groups of the prolineside chains where no methyl groups are present. Collagen spectra compriseseven general regions: i)the amide A region caused by the first excited statestretching vibrations of peptide NH-groups involved in interchain hydrogenbonding (38, 39, 42), ii) the amide B that originates from an interactionbetween the amide A band and the overtone of the amide II vibration (47);such an interaction is known as a Fermi resonance, iii) the methylene CH2region, iv) the amide I region that arises mainly from the C=0 stretchingvibration with a small contribution from N-H in-plane bending (42, 47), v)the amide II region caused by an out-of-phase combination of C-N stretchingand N-H bending modes (42, 47), vi) the CH2 wagging and bending region,and vii) the amide III region caused by a combination of N-H bending andC-N stretching vibration mixed with the CH2 wagging vibration from theglycine backbone and proline side chains (38). Based on polarization sensitive SFG-V measurements, we assign the IRband centered at 2945 cm-1 to a Fermi resonance between the symmet-ric stretch vibration of methylene at 2869 cm-1 and the overtone of themethylene bending mode at 1457 cm-1. The peak found at 1403cm-1 is acharacteristic band of polyglycine peptides due to the CH2 wagging mode(41). The peak at 1338 cm- is the absorption from CH2 wagging vibrationof the imino acid side chains (38), the peak at 1239 cm-1is the amide III(38). The other IR molecular vibrations assignments are: amide A at 3326cm-1; amide B at 3078 cm-(47); amide I at 1659 cm-l; and amide II at1549 cm-1. In the Raman spectra the dominant peaks are assigned to theFermi resonance at 2940 cm-1, the symmetric CH2 resonance at 2890 cm-1,amide I resonance at 1670 cm-1, the CH2 bending mode at 1450 cm-1 andthe amide III resonance at 1272 cm-. The spectral bands of amide A andamide B peaks are observable but are poorly resolved. Note that the amideII is absent in this Raman spectra. SFG-Vibrational Spectra of Fibrillar Collagen Fig. 6 shows for the first time, to our knowledge, the SFG-V spectra ofcollagen type I fibers. The IR and Raman spectra of collagen indicate thatthe amide I, III, A and B bands, as well as the CH2 bending and waggingmodes, are both IR- and Raman-active and all appear in Fig. 5. The amideA and B bands are present but very weak (for example see also Fig. 7).Freund and co-workers predicted that because of extensive cancellation ofdipoles of the C-N bonds they do not contribute to optical nonlinearity (14).This is now experimentally confirmed in the measured IR, Raman and SFG-V spectra. The amide II band is only present in IR-spectra; as expected, itdoes not appear in the SFG-V spectra. The achiral x.elements contribute to the spectra measured with thePPP-and SSS-configuration. The chiral xelements cor e iespectra measured with the PPS- and SPP-configuration. [The dominantpeaks in the achiral and the chiral spectra are distinctly different.Theachiral x. elements produce a dominant peak in CH2 region at 2949 cm-ofthe PPP spectra and we assign it to the CH2 groups located in the pyrollidinerings of proline and hydroxyproline amino acid residues stabilized towardsthe outside of the collagen molecule by strong steric interactions. In contrast,the chiral xiik elements produce a dominant peak in the amide I region at1627 cm- of the PPS spectra and we assign it to a helical ladder formed byhydrogen bonding between the peptide NH groups of glycine residue in one a-chain and the CO groups in the proline residue of the neighboring a-chainin the middle of the triple helical collagen molecule. The CO groups are themain contributors to the chiral signal. The intensity ratio of the dominantCH2 band in the achiral PPP SFG-V spectrum with respect to the dominantCO band of the chiral SFG-V spectrum,IpPp/Ipps=0.8, confirms thatthe optical nonlinearity of collagen is caused by both a dipolar and chiralitycontributions of about equal order of magnitude. The achiral and chiral SFG-V spectrums directly confirm that the nonlin-ear optical nonlinearity of collagen is caused by both a dipolar and chiralitycontributions of about equal order of magnitude. In the achiral nonlinearspectra the remaining prominent bands are attributable to the amide I,amide III and others that involve methylene groups, i.e. the bending mode,the wagging mode at 1385 cm-1 and finally the amide III band. In thechiral nonlinear spectra the remaining prominent bands involve the Fermiresonance 6(CH2) that involves methylene groups,i.e. the bending mode,the wagging mode at 1385 cm-1 and finally the amide III band. Methylene Group: The dominant achiral contribution The experimental results shown in Fig. 6 clearly indicate that the methy-lene functional group in the pyrollidine rings of proline and hydroxyprolineamino acid residues plays a dominant role in the achiral contributions to thesecond order nonlinearity of collagen. More detailed spectral results in the2800-3400 cm-1 regime are shown in Fig. 7. Peak-fitting in the methyleneCH2 region consistently produced three peaks.The Raman spectra showthe presence of a very strong peak at 2936 cm-1 and two weaker peaksat 2897 cm-1 and 296655 ccmm--11.. The IR spectra reveal two peaks of equalstrength at 2874 cm-1 and 2970 cm-1, and a slightly stronger peak at 2931cm-1. PPP spectra has a very strong peak at 2949 cm-1, a strong peak at2994 cm-1 and a very weak peak at 2888 cm-1. We performed a detailedpolarization analysis of the SFG signal at the 2949 cm- peak assumingsymmetries of either symmetric or asymmetric stretching CH2 modes (seebelow for details), and only the symmetric symmetry produced results thatare consistent with the experimental results. Therefore, we assign this bandto a Fermi resonance between the symmetric stretch vibration of methyleneat 2888 cm-1 and the overtone of the methylene bending mode at 1478cm-1. The broad characteristic of this band could be due to a mixing of theFermi resonance and the corresponding asymmetric stretch mode at 2994cm-1..The Fermi band always dominates the achiral SSP, PPP and SSSspectra in this frequency region; a phenomenonobserved also in the remain achiral spectra (SPS and PSS, not shown). The mixing of the Fermi reso-nance and the corresponding asymmetric stretching mode of CH2 is evidentfor the band shoulder near 3000 cm- of the PPP and SSS spectra. In theSSP this shoulder is less pronounced since the tensor elements Xyyz fromthe symmetric and asymmetric vibrational stretching modes have oppositesigns and a destructive interference occurs between the two contributions(48). In collagen proteins the methylene groups of proline and hydroxyproline(with three and two CH2 molecules in their side chains, respectively) pointout from the rod-like collagen triple helix. The CH stretching spectral re-gion of methyl and methylene groups, between 2800 and 3000 cm-1, hasbeen extensively studied and documented in SFG-V spectroscopy of surfaceadsorbates (48-52). A detailed assignment of methylene vibration spectralcontributions from SFG-V spectra is complicated even when present in rela-tively simple organic molecules with methylene groups identified as a majorcontributing factor (48). Following the approach by Lu and coworkers (48),the average orientation of the methylene groups at interfaces was estimatedorrreelating the expected effective susceptibility tensor in the laboratorysystem with the corresponding SFG intensities measured at different in-put/output beam polarization configurations.The methylene orientationmodel with respect to the helical, or fiber, axis is shown in Fig.8. In the fig-ure (z,y,z) and (a,b, c) denote the laboratory-fixed and the molecular-fixedcoordinate systems, respectively. The symmetric stretch vibration of CH2consists of in-phase oscillations of the hydrogen atoms along the axis of sym-metry and the asymmetric vibration consists of out of phase oscillations ofthe hydrogen atom along the bond axis in the ac-plane. The laboratory andthe sample coordinate systems are considered the same with x-axis along thefiber direction. In the molecular-fixed coordinates, the c-axis is along thesymmetry axis of CH2 (bisecting the two CH bonds away from the H-atomside), the a-axis is in the H-C-H plane perpendicular to c, and the b-axisis orthogonal to a and c out of the CH plane. The three angles (w,0,)are the transformation Euler angles, where odenotes the twist angle alongthe molecule symmetry (c-axis), 0 the polar angle between the z-axis of thelaboratory coordinate system and the c-axis of the molecular coordinate sys-tem, and w the azimuth angle between the projection of the c-axis of themolecule and the x-axis of the laboratory system. The molecular symmetryof a specific functional group determines the nonzero elements of the molec-ular polarizability tensor ik In this work weuse the symmetry of thesymmetric stretch of the methylene group because the overtone and the fun- damental frequencies of the symmetric CH2 stretching modes produce theFermi resonance. The methylene group has symmetry with three nonvanish-ing tensor elements, Baac, Bbbe and Bccc, for the symmetric stretching mode(49, 50). Based on the Euler rotation angles (w,0,p), assuming a randomorientation distribution of the CH2 molecules within the molecular ab-planeand applying the relationship Baac + Bbbc =2Bccc between the nonvanishingtensor elements (48, 49), the effective macromolecular susceptibility is where tensor elements are reduced to only three independent componentsby The three independent tensor elements depend only on the hyperpolarizabil-ity tensor element Bccc, with c along the molecular axis of symmetry, andthe respective polar 0 and azimuthal w average angles. The SFG intensi-ties ratio of the two input /output polarization combinations SSP and SSS,is proportional to the three components, Xxaw, Xyyy and Xzzz, in the formIssp/Isss= dr, where d is a constant of proportionality and r is given by The orientation of methylene groups was simulated using Eqns. 1 and 2considering a Gaussian distribution for angles 0 and w along the collagenfibrils. The input angles of the IR and visible beams with the z-axis, were-45° and 45°, respectively. Fig. 9 (a) and (b) show the experimental andsimulated polarization state of the SFG signal, respectively, for the fourpossible input beam polarization aPP, aPS, aSP, and aSS. The polar an-gle a is the position of the analyzer measured with respect to the planeof incidence (i.e. the xz-plane of Fig. 2).The experimental results arequalitatively in good agreement with the simulation. If there was no tiltwith respect to the z-axis, (i.e. (0=0°, then Xacru = Xyyx =Xzzx / 0,Xyyy =Xxry = Xzzy /0, and Xzzz =Xxaz = Xyyz (0) the configurationsSSS and PPS would not excite any SFG signal (see Table 1). The non-zerointensities obtained in our SSS and PPS spectra indicate that on average the methylene groups are tilted with respect to the z-axis. To estimate theorientation of the symmetry axis of the methylene groups, the experimentalcondition Issp ≥ IpPP ≥ Isss ≥ Issp, obtained for the average maxi-mum intensities of the polar plots (a=0 and n for P, n/2 and 3m/2 forP) shown in Fig. 9 (b)), is the determining criteria. Fig. 9 (b) shows theSFG of the IPPP, IPPS, Issp, and Isss, intensities, simulated from Eq. 1to Eq. 3, as a function of the polar angle, 0, with a fixed azimuth angle,w, where a Gaussian distribution was assumed for both the polar and theazimuth angles. The best fit to our experimental results was obtained for0=14.5° andw=25°, with the respective distribution widths of og=20°and ow =85°. Different values for 0 and w yield results that are not ex-perimentally observed, e.g. Issp=IpPP= Isss or inverted ratio for Ipppand Ipps,etc. The fitted angles indicate that the CH2 molecules that con-tribute to the nonlinear response have an axis of symmetry nearly normalto the fibril and in the plane of incidence. The small, but distinctive, 14.5°tilt from the normal to the main axis is enough to obtain strongly polarizedSFG signals parallel and perpendicular to the fiber axis present in Fig. 9 (a)in the PPP and SSS configurations. Using Eq. 3, a value of r= 2.1 is ob-tained demonstrating that there is a stronger molecular nonlinear responsefor fields oscillating along the plane of incidence. The SHG investigationby Williams and co-workers concluded that the nonlinearity originates fromthe outer shell region, estimated at 50 nm, of a collagen fibril (19). In thecontext of their conclusion and our finding that the orientation of the methy-lene groups plays a dominant role in the achiral second order nonlinearityin collagen fibers, given that the spot size used in the SFG-V measurementsaverage over several microfibrils that are aligned parallel to each other, it isconcluded that only the metylene groups oriented toward the outside of in-dividual microfibrils contribute collectively to produce a large second orderoptical nonlinearity. Carbonyl Group: The dominant chiral contribution Given the prominence of the amide I band in the chiral spectra, and itspresence in the achiral spectra, the C=0 and N-H play an important rolein the molecular origins of optical nonlinearity in collagen. Unlike the helical arrangement of C=0 and N-H groups in a protein a-helix that are stabilized by intra-chain hydrogen bonds, in the collagen triplehelix they are stabilized by inter-chain bonding between adjacent a-chains.Even so, the a-helix and the triple-helical collagen has the helical arrange-ment of the C=0 and N-H groups in common, and have the same hyper- polarizibility tensor symmetry for amide I. In the coordinate system shownin Fig. 2 where the fiber axis is along the x-axis, the orientational averagehyperpolarizibility non-zero tensor elements of the helically arranged amidegroups in collagen fiber are expected to be Xxa, Xxzz =XacyyyXzzx = Xyyz,Xzxz =Xyry, Xzyx =-Xyzx, Xzacy = -Xyrz, and Xxzy =-Xryz (27). Thefirst four entries cause an achiral contribution, and the last three are as-sociated with the chiral effect.The measured SFG spectra of collagen inthe amide I region are in general consistent with this symmetry. Althoughthe amide I peak dominates both the PPS and SPP nonlinear SFG-V spec-tra, it is predominant in the PPS configuration where the SFG signal ispolarized parallel to the fibrils directions. The Co symmetry of the macro-molecular effective susceptibility tensor of collagen fibrils suggests that thechiral tensor elements of the amide I are such that Xxzy<< Xzoy, andXyzx= -Xzyr≈-Xzry = Xyoz. In that way there is only one tensor ele-ment, -Xzry, contributing to the PPS spectrum while the magnitude of theSPP spectrum is cancelled by a destructive interference between Xyrz and-Xzoy Therefore amide I peak is large in the PPS spectra and small inthe SPP spectra as is shown experimentally. The amide A is alexistant in the SFG-V spectra, and since it is associated with the NH-groupsinvolved in interchain hydrogen bondings, it is concluded that the observednonlinearity is dominated by the CO-groups, however the contribution ofthe NH-groups are not neglible as evidenced by the notable presence of theAmide III band in all spectra. It is noted that the assumed symmetry modelfor the amide I does not explain the amide I peak present in the SSS spectra.This peak is attributed to the organization of the collagen molecules thatis not perfectly uniform when averaged over several collagen fibers. Type Icollagen fibrils reveals noticeable achiral contributions to the amide I band,as clearly evidenced by the PPP and SSS spectra shown in Fig. 6. Nevertheless, the achiral contributions in this region are significantly smaller thanchiral contributions. Semiempirical computations and second harmonic measurements per-formed by Mitchell et.al. (53) indicated that chiral contribution to secondharmonic generation of a-helices, such as PBLG, is small and mainly due toa structural effect associated with the tilt of the plane of each amide chro-mophore relative to the long axis of the helix. SFG-Vspectroscopy on PLBGmonolayers confirmed this conclusion (25). In the PPP spectra of collagenthe C=O band in collagen is neglible, whereas in PBLG it is a dominant con-tribution. In contrast to PBLG, in which a large achiral component arisesfrom the non-centrosymmetric alignment of the NH- and CO-groups alongthe main axis of each alpha helix, a fibrillar collagen array is characterized by helical organization at the macroscopic scale as well as the microscopicscale. The nonlinear chiral effects in collagen structures (fiber, fibril, mi-crofibrils, etc.) are expected to be more pronounced since the tilt of theplane of each amide chromophore is much more pronounced in the collagentriple helix than than a single a-helix. The chiral effects are attributable tomacroscopic structural features, since the wavelength of the optical radia-tion is much larger than the individual collagen molecule. This observationis consistent with recent crystallographic investigations into structural or-ganization of type I collagen fibrillar arrays (54) where it was shown thatneighboring collagen molecules are packed together to form a supertwisted,discontinuous, right-handed microfibril that interdigitates with neighboringmicrofibrils to form a crystallographic superlattice. Conclusions The molecular origins of the second order optical nonlinearity of collagenfibrils have been identified with SFG-V spectroscopy. While Freund et. al.correctly observed that in collagen the NH and CO-groups are very nearlynormal to the main axis of the triple helix and that the C-H bonds aremostly perpendicular to the main axis (14), they incorrectly speculated thatthese groups do not contribute to the polarity of collagen fibrils. The smallyet distinctive tilt of methylene groups in the pyrollidine rings of prolineand hydroxyproline amino acid residues that are stabilized normal to themain axis ofcollagen molecule produce a large achiral contribution andthe helical arrangement of CO-groups around the main axis of a collagenmolecule causes a significant chiral contribution to the second order opticalnonlinearity present in collagen fibrils I. References 1. Myllyharju, J., and K. I. Kivirikko, 2004. Collagens, modifying enzymesand their mutations in humans, flies and worms.Trends in Genetics20:33-43. 2. Engel, J., and H. P. Bachinger, 2005. Structure, stability and folding ofthe collagen triple helix. In Collagen, Springer Berlin/Heidelberg, 7-33. 3. Ramachandran, G., M. Bansal, and R. Bhatnagar, 1973. A hypothesison the role of hydroxyproline in stabilizing collagen structure. Biochim-ica Et Biophysica Acta 322:166-171. 4. Holmgren, S. K., K. M. Taylor, L. E. Bretscher, and R. T. Raines, 1998.Code for collagen's stability deciphered. Nature 392:666-667. 5. Raines, R. T., 2006. 2005 Emil Thomas Kaiser Award. Protein Science15:1219-1225. 6. Silver, F. H., J. W. Freeman, and G. P. Seehra, 2003. Collagen self-assembly and the development of tendon mechanical properties. Journalof Biomechanics 36:1529-1553. 7. Baer, E., J. J. Cassidy, and A. Hiltner, 1988. Hierarchical structure ofcollagen and its relationship to the physical properties of tendon. InM. E. Nimni, editor, Collagen Vol II: Biochemistry and Biomechanics,CRC Press, 177-200. 8. Brodsky, B., E. F. Eikenberry, K. C. Belbruno, and K. Sterling, 1982.Variations in collagen fibril structure in tendons. Biopolymers 21:935-951. 9.Verbiest, T., S. V. Elshocht, M. Kauranen, L. Hellemans, J. Snauwaert,C. Nuckolls, T. J. Katz, and A. Persoons, 1998. Strong enhancement ofnonlinear optical properties through supramolecular chirality. Science282:913-915. 10. Simpson, G. J., 2004. Molecular origins of the remarkable chiral sensi-tivity of second-order nonlinear optics. Chemphyschem 5:1301-1310. 11. Roth, S., and I. Freund, 1979. 2nd harmonic-generation in collagen.Journal of Chemical Physics 70:1637-1643. 12. Roth, S., andI. Freund, 1981. Optical 2nd-harmonic scattering in rat-tail tendon. Biopolymers 20:1271-1290. 13. Roth, S., and I. Freund, 1982. 2nd harmonic-generation and orienta-tional order in connective-tissue - a mosaic model for fibril orientationalordering in rat-tail tendon. Journal of Applied Crystallography 15:72-78. 14. Freund, I., M. Deutsch, and A. Sprecher, 1986. Connective-tissue po-larity-optical 2nd-harmonic microscopy,crossed-beam summation, andsmall-angle scattering in rat-tail tendon. Biophysical Journal 50:693712. 15. Freund, I., and M. Deutsch, 1986. Macroscopic polarity of connective-tissue is due to discrete polar structures. Biopolymers 25:601-606. 16. Campagnola, P. J., A. C. Millard, M. Terasaki, P. E. Hoppe, C. J.Malone, and W. A. Mohler, 2002.2. Three-dimensional high-resolutionsecond-harmonic generation imaging of endogenous structural proteinsin biological tissues. Biophysical Journal 82:493-508. 17. Plotnikov, S. V., A. C. Millard, P. J. Campagnola, and W. A.Mohler, 2006. Characterization of the Myosin-Based Source for Second-Harmonic Generation from Muscle Sarcomeres.Biophysical Journal90:693-703. 18. Pena, A. M., T. Boulesteix, T. Dartigalongue, and M.C. Schanne-Klein,2005. Chiroptical effects in the second harmonic signal of collagens I andIV. Journal of the American Chemical Society 127:10314-10322. 19. Williams, R. M., W. R. Zipfel, and W. W. Webb, 2005.IInterpret-ing second-harmonic generation images of collagen I fibrils. BiophysicalJournal 88:1377-1386. 20. Bain, C. D., 1995. Sum-frequency vibrational spectroscopy of the solid-liquid interface. Journal of the Chemical Society-Faraday Transactions91:1281-1296. 21. Shen, Y.R., 1998. Chap. 10. In R. W. Field, E. Hirota, J. P.Maier, andS. Tsuchiya, editors, Nonlinear Spectroscopy for Molecular StructureDetermination, Blackwell Science, Oxford. 22. Shen, Y. R., 2001. Exploring new opportunities with sum-frequencynonlinear optical spectroscopy.Pure and Applied Chemistry 73:1589-1598. 23. Wang, J., S. M. Buck, M. A. Even, and Z. Chen, 2002. Molecular re-sponses of proteins at different interfacial environments detected by sumfrequency generation vibrational spectroscopy. Journal of the AmericanChemical Society 124:13302-13305. 24. Wang, J., M. Buck, and Z. Chen, 2003. The effect of surface cover-age on conformation changes of bovine serum albumin molecules at theair-solution interface detected by sum frequency generation vibrationalspectroscopy. Analyst 128:773-778. 25. Knoesen, A., S. Pakalnis, M. Wang, W. D. Wise, N. Lee, and C. W.Frank, 2004. Sum-frequency spectroscopy and imaging of aligned helicalpolypeptides. IEEE Journal of Selected Topics in Quantum Electronics10:1154-1163. 26. Paszti, Z., J. Wang, M. L. Clarke, and Z. Chen, 2004. Sum frequencygeneration vibrational spectroscopy studies of protein adsorption onoxide-covered Ti surfaces. Journal of Physical Chemistry B 108:7779-7787. 27. Perry, J. M., A. J. Moad, N. J.Begue, R. D. Wampler, and G. J. Simp-son,2005.Electronic and vibrational second-order nonlinear opticalproperties of protein secondary structural motifs. Journal of PhysicalChemistry B 109:20009-20026. 28. Wang, J., X. Y. Chen, M. L. Clark, and Z. Chen, 2005.Detectionof chiral sum frequency generation vibrational spectra of proteins andpeptides at interfaces in situ. Proceedings of the National Academy ofSciences of the United States of America 102:4978-4983. 29. Ji, N., and Y. R. Shen, 2004. Optically active sum frequency generationfrom molecules with a chiral center: Amino acids as model systems.Journal of the American Chemical Society 126:15008-15009. 30. Zhuang, X., P. B. Miranda, D. Kim, and Y. R. Shen, 1999. Mappingmolecular orientation and conformation at interfaces by surface nonlin-ear optics. Physical Review B 59:12632-12640. 31. Sioncke, S., S. V. Elshocht, T. Verbiest, A. Persoon, M. Kauranen,K. E. S. Phillips, and T. J. Katz, 2000. Optical activity effects in sec-ond harmonic generation from anisotropic chiral thin films. Journal ofChemical Physics 113:7578-7581. 32. Belkin, M. A., T. A. Kulakov, K. H. Ernst, L. Yan, and Y. R. Shen,2000. Sum-frequency vibrational spectroscopy on chiral liquids: A noveltechnique to probe molecular chirality. Physical Review Letters 85:4474-4477. 33. Fischer, P., and F. Hache,2005. Nonlinear optical spectroscopy of chiralmolecules. Chirality 17:421-437. 34. Fu, Y., H. Wang, R. Shi, and J. Cheng, 2007. Second Harmonic andSum Frequency Generation Imaging of Fibrous Astroglial Filaments inEx Vivo Spinal Tissues. Biophysical Journal 92:3251-3259. 35. Stoller, P., K. M. Reiser, P. M. Celliers, and A. M. Rubenchik, 2002.Polarization-modulated second harmonic generation in collagen.Bio-physical Journal 82:3330-3342. Molecular Origins of the Optical Second Order Nonlinearity of Collagen 21 36. Wang, J., M. L. Clarke, and Z. Chen, 2004. Polarization mapping: Amethod to improve sum frequency generation spectral analysis. Analyt-ical Chemistry 76:2159-2167. 37. Moad, A. J., and G. J. Simpson, 2004. A unified treatment of selectionrules and symmetry relations for sum-frequency and second harmonicspectroscopies. Journal of Physical Chemistry B 108:3548-3562. 38. Jackson, M., L. P. Choo, P. H. Watson, W. C. Halliday, and H. H.Mantsch, 1995. Beware of connective-tissue proteins - assignment andimplications of collagen absorptions in infrared-spectra of human tissues.Biochimica Et Biophysica Acta-Molecular Basis of Disease 1270:1-6. 39. Jayasuriya, A. C., J. I. Scheinbeim, V. Lubkin, G. Bennett, andP. Kramer, 2003.FPiezoelectric and mechanical properties in bovinecornea. Journal of Biomedical Materials Research Part A 66A:260-265. 40. Fringeli, U. P., 1981. In E. Grelle, editor, Membrane Spectroscopy,Springer-Verlag, 271-332. 41. Dwivedi, A. M., and S. Krimm, 1982. Vibrational analysis of peptides,polypeptides, and proteins .10. poly(Glycine-I) and its isotopic deriva-tives.Macromolecules 15:177-185. 42. Lazarev, Y. A., A. V. Lazareva, A. Shibnev, and N. G. Esipova, 1978.Infrared-spectra and structure of synthetic polytripeptides. Biopolymers17:1197-1214. 43. Edwards, H. G. M., and F. R. Perez, 2004.Application of Fouriertransform Raman spectroscopy to the characterization of parchmentand vellum. II-Effect of biodeterioration and chemical deterioration onspectral interpretation. Journal of Raman Spectroscopy35:754-760. 44. Leikin, S., V. A. Parsegian, W. H. Yang, and G. E. Walrafen, 1997.Raman spectral evidence for hydration forces between collagen triplehelices. Proceedings of the National Academy ofSciences of the UnitedStates of America 94:11312-11317. 45. Nimni, M. E., and R. D. Harkness, 1988. Molecular structure and func-tion of collagen. In M. E. Nimni, editor, Collagen, Vol. 1: Biochemistry,Boca Raton: CRC Press, 1-77. 46. Ikoma, T., H. Kobayashi, J. Tanaka, D. Walsh, and S. Mann, 2003.Physical properties of type I collagen extracted from fish scales of Pagrusmajor and Oreochromis niloticas.International Journal of BiologicalMacromolecules 32:199-204. 47. Susi, H., J. S. Ard, and R. J. Carroll, 1971. Infrared spectrum andwater binding of collagen as a function of relative humidity. Biopolymers10:1597-1604. 48. Lu, R., W. Gan, B. H. Wu, H. Chen, and H. F. Wang, 2004. Vibrationalpolarization spectroscopy of CH stretching modes of the methylene goupat the vapor/liquid interfaces with sum frequency generation. Journalof Physical Chemistry B 108:7297-7306. 49. Hirose, C., N. Akamatsu, and K. Domen, 1992. Formulas for the analysisof surface sum-frequency generation spectrum by Ch Stretching modesof methyl and methylene groups. Journal of Chemical Physics 96:997-1004. 50. Hirose, C., H. Yamamoto, N. Akamatsu, and K. Domen, 1993. Ori-entation analysis by simulation of vibrational sum-frequency generationspectrum-Ch stretching bands of the methyl-group. Journal of PhysicalChemistry 97:10064-10069. 51. Wei, X., X. W. Zhuang, S. C. Hong, T. Goto, andY. R. Shen, 1999. Sum-frequency vibrational spectroscopic study of a rubbed polymer surface.Physical Review Letters 82:4256-4259. 52. Follonier, S., W. J. W. Miller, N. L. Abbott, and A. Knoesen, 2003.Characterization of the molecular orientation of self-assembled mono-layers of alkanethiols on obliquely deposited gold films by using infrared-visible sum-frequency spectroscopy. Langmuir 19:10501-10509. 53. Mitchell, S. A., R. A. McAloney, D. Moffatt, N. Mora-Diez, andM. Z. Zgierski, 2005. Second-harmonic generation optical activity ofa polypeptide a-helix at the air/water interface. The Journal of Chem-ical Physics 20:114707-15. 54. Orgel, J.,T. C. Irving, A. Miller, and T. J. Wess, 2006. Microfibrillarstructure of type I collagen in situ. Proceedings of the National Academyof Sciences of the United States ofAmerica 103:9001-9005. 55. Bhattacharjee, A., and M. Bansal, 2005.Collagen structure:TheMadras triple helix and the current scenario. IUBMB Life 57:161-172. Table 1: Macroscopic second-order susceptibility tensor elementsof collagen for the different input/output polarization combina-tions.The main axis of the collagen fiber is oriented along thex-axis. I/O PolarizationAchiralChiralConfigurationsElementsElements (SF, VIS,IR) PPP Xzco, Xzoz, Xzzm, Xzzz SSP Xyya, Xyyz SPS Xyay, Xyzy SSS Xyyy PSS Xayy, Xzyy SPP (chiral) Xyom, Xyzz Xyz, Xyoz PSP (chiral) Xry, Xzyz Xayz, Xzyo PPS (chiral) Xaoy, Xzzy Xazy, Xzry Figure Legends Figure 1. The triple helical structure for a collagen molecule. The amino acid sequenceof a single a-chain is Gly-X-Y, where the smallest amino acid glycine (Gly)and X and Y are frequently proline (Pro) and hydroxyproline (Hyp), re-spectively. The sequence shown is (Gly-Pro-Hyp)3. The small Gly aminoacid is always in the center of the superhelix and the bulky pyrolidone ringsof Pro and Hyp point outward. The non-centrosymmetric orientation ofthe methylene groups in the rings produce an achiral nonlinear effect. Thethree a-chains (denoted with blue, green and purple) are connected by hy-drogen bonds between the NH of the glycine and the CO of the proline inthe X position of a neighboring a-chain, indicated by dashed lines in thefigure, create a helical ladder in the middle of the triple helix that givesrise to a supramolecular nonlinear chiral effect. Figure reproduced fromRef. (55)reprinted by permission of the publisher (Taylor and Francis Ltd,http://www.informaworld.com) Figure 2. SFG in the transmission mode. In the figure, w1, W2 and wsr are the visible,infrared and sum-frequency beams, respectively. The collagen fibrils areoriented along the x-axis. Figure 3. Experimental configuration for transmitted SFG spectroscopy.The beamare w1, w2 and wsF are the visible, IR and SFG beams, respectively. Theangle between the IR and visible is kept at 90 degrees with respect to eachother. The anglep between the transmitted visible and the SFG beamsis determined by momentum conservation. In the figure: CS, L, f, F, PL,F and PMT, means Collagen Sample, Lens, focal length, Linear Polarizer,Filters and Photomultiplier Tube,respectively. Dashed lines represent thescattered wi collected by the lens whereas dotted line is the normal of thexy plane. Figure 4. The spatial distribution of collagen fibrils obtained by polarization modu-lated second harmonic imaging in a typical sample used in the sum-frequency spectroscopy measurements. Collagen assemblies are selected with a uniformdistribution of fibrils along a dominant axis in order to minimize anisotropiccontributions to chiral second order nonlinear effects.The standard devi-ation of the distribution of angles is 13.0 degrees and the average is 17.5degrees. Figure 5. Unpolarized Raman and FT-IR spectrum of a native RTT collagen sample. Figure 6. SFG-V PPS,PPP,SPP and SS spectra of collagen type I taken in transmis-sion mode. Figure 7. Comparison of the achiral SFG-V spectra PPP, SSP, and SSS in the 2800to 3400 cm-1 spectral region. Figure 8. Orientation model of methylene groups in collagen. Figure 9. Polarization analysis of the Fermi resonance peak:: (a) experimental dataand (b) simulated data. In the figure: aPP (-o-), aSP (-□-), aPS (--), andaSS (-A-). The polar angle denotes the angle a of the analyzer measuredwith respect to the plane of incidence. Figure 10. Simulated SFG intensities as a function of the polar angle 0 and fixed az-imuth angle w=25°. A Gaussian distribution is assumed for both the polarand azimuth angles. Figure 1: Figure 2: Figure 3: Raman Amide A Amide B CH, Amidel Amide ll Amide III IR CH, bendingand wagging Figure 5: Figure 6: 一 Figure 7: Figure 8: Figure 9: 1.0 Figure 10:
确定


还剩34页未读,是否继续阅读?

产品配置单

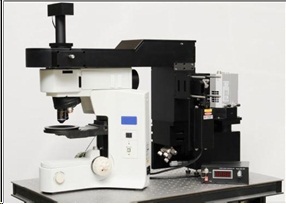
北京欧兰科技发展有限公司为您提供《胶原蛋白中二阶光学非线性效应,分子学起源检测方案(其它光谱仪)》,该方案主要用于其他中二阶光学非线性效应,分子学起源检测,参考标准--,《胶原蛋白中二阶光学非线性效应,分子学起源检测方案(其它光谱仪)》用到的仪器有Ekspla SFG 表面和频光谱分析系统、Ekspla PL2230型高能量皮秒激光器
推荐专场


相关方案
更多
该厂商其他方案
更多