


方案详情
文
本方案介绍了一种基于广泛使用的激光脉冲法技术开发的块状和薄膜材料热扩散率测量技术,这种技术的核心是测量激光脉冲发出时间与脉冲到达探测器所需时间。同时采用实验室搭建的试验装置和计算模型,模拟了探测器的响应和由于空气对流所带来的热损失。这种方法的优点是可以不需要在真空条件下就可以准确测量热扩散率。在试验中,激光脉冲照射一端固定在热沉上另一端自由悬浮的长试样,通过电阻温度传感器,测量激光热脉冲在已知距离上的传输。对银线进行了测量,测量结果与参考值吻合的很好。
作为一个重要的应用,这种方法测量其他方法很难测试的薄膜的试样热扩散率。例如我们测量了附着在陶瓷衬底上的石墨烯薄膜。通过采用计算模型和简单试验过程,可以有效和准确的各种薄膜材料的导热系数。
方案详情

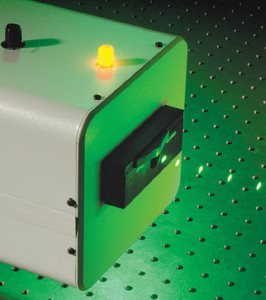
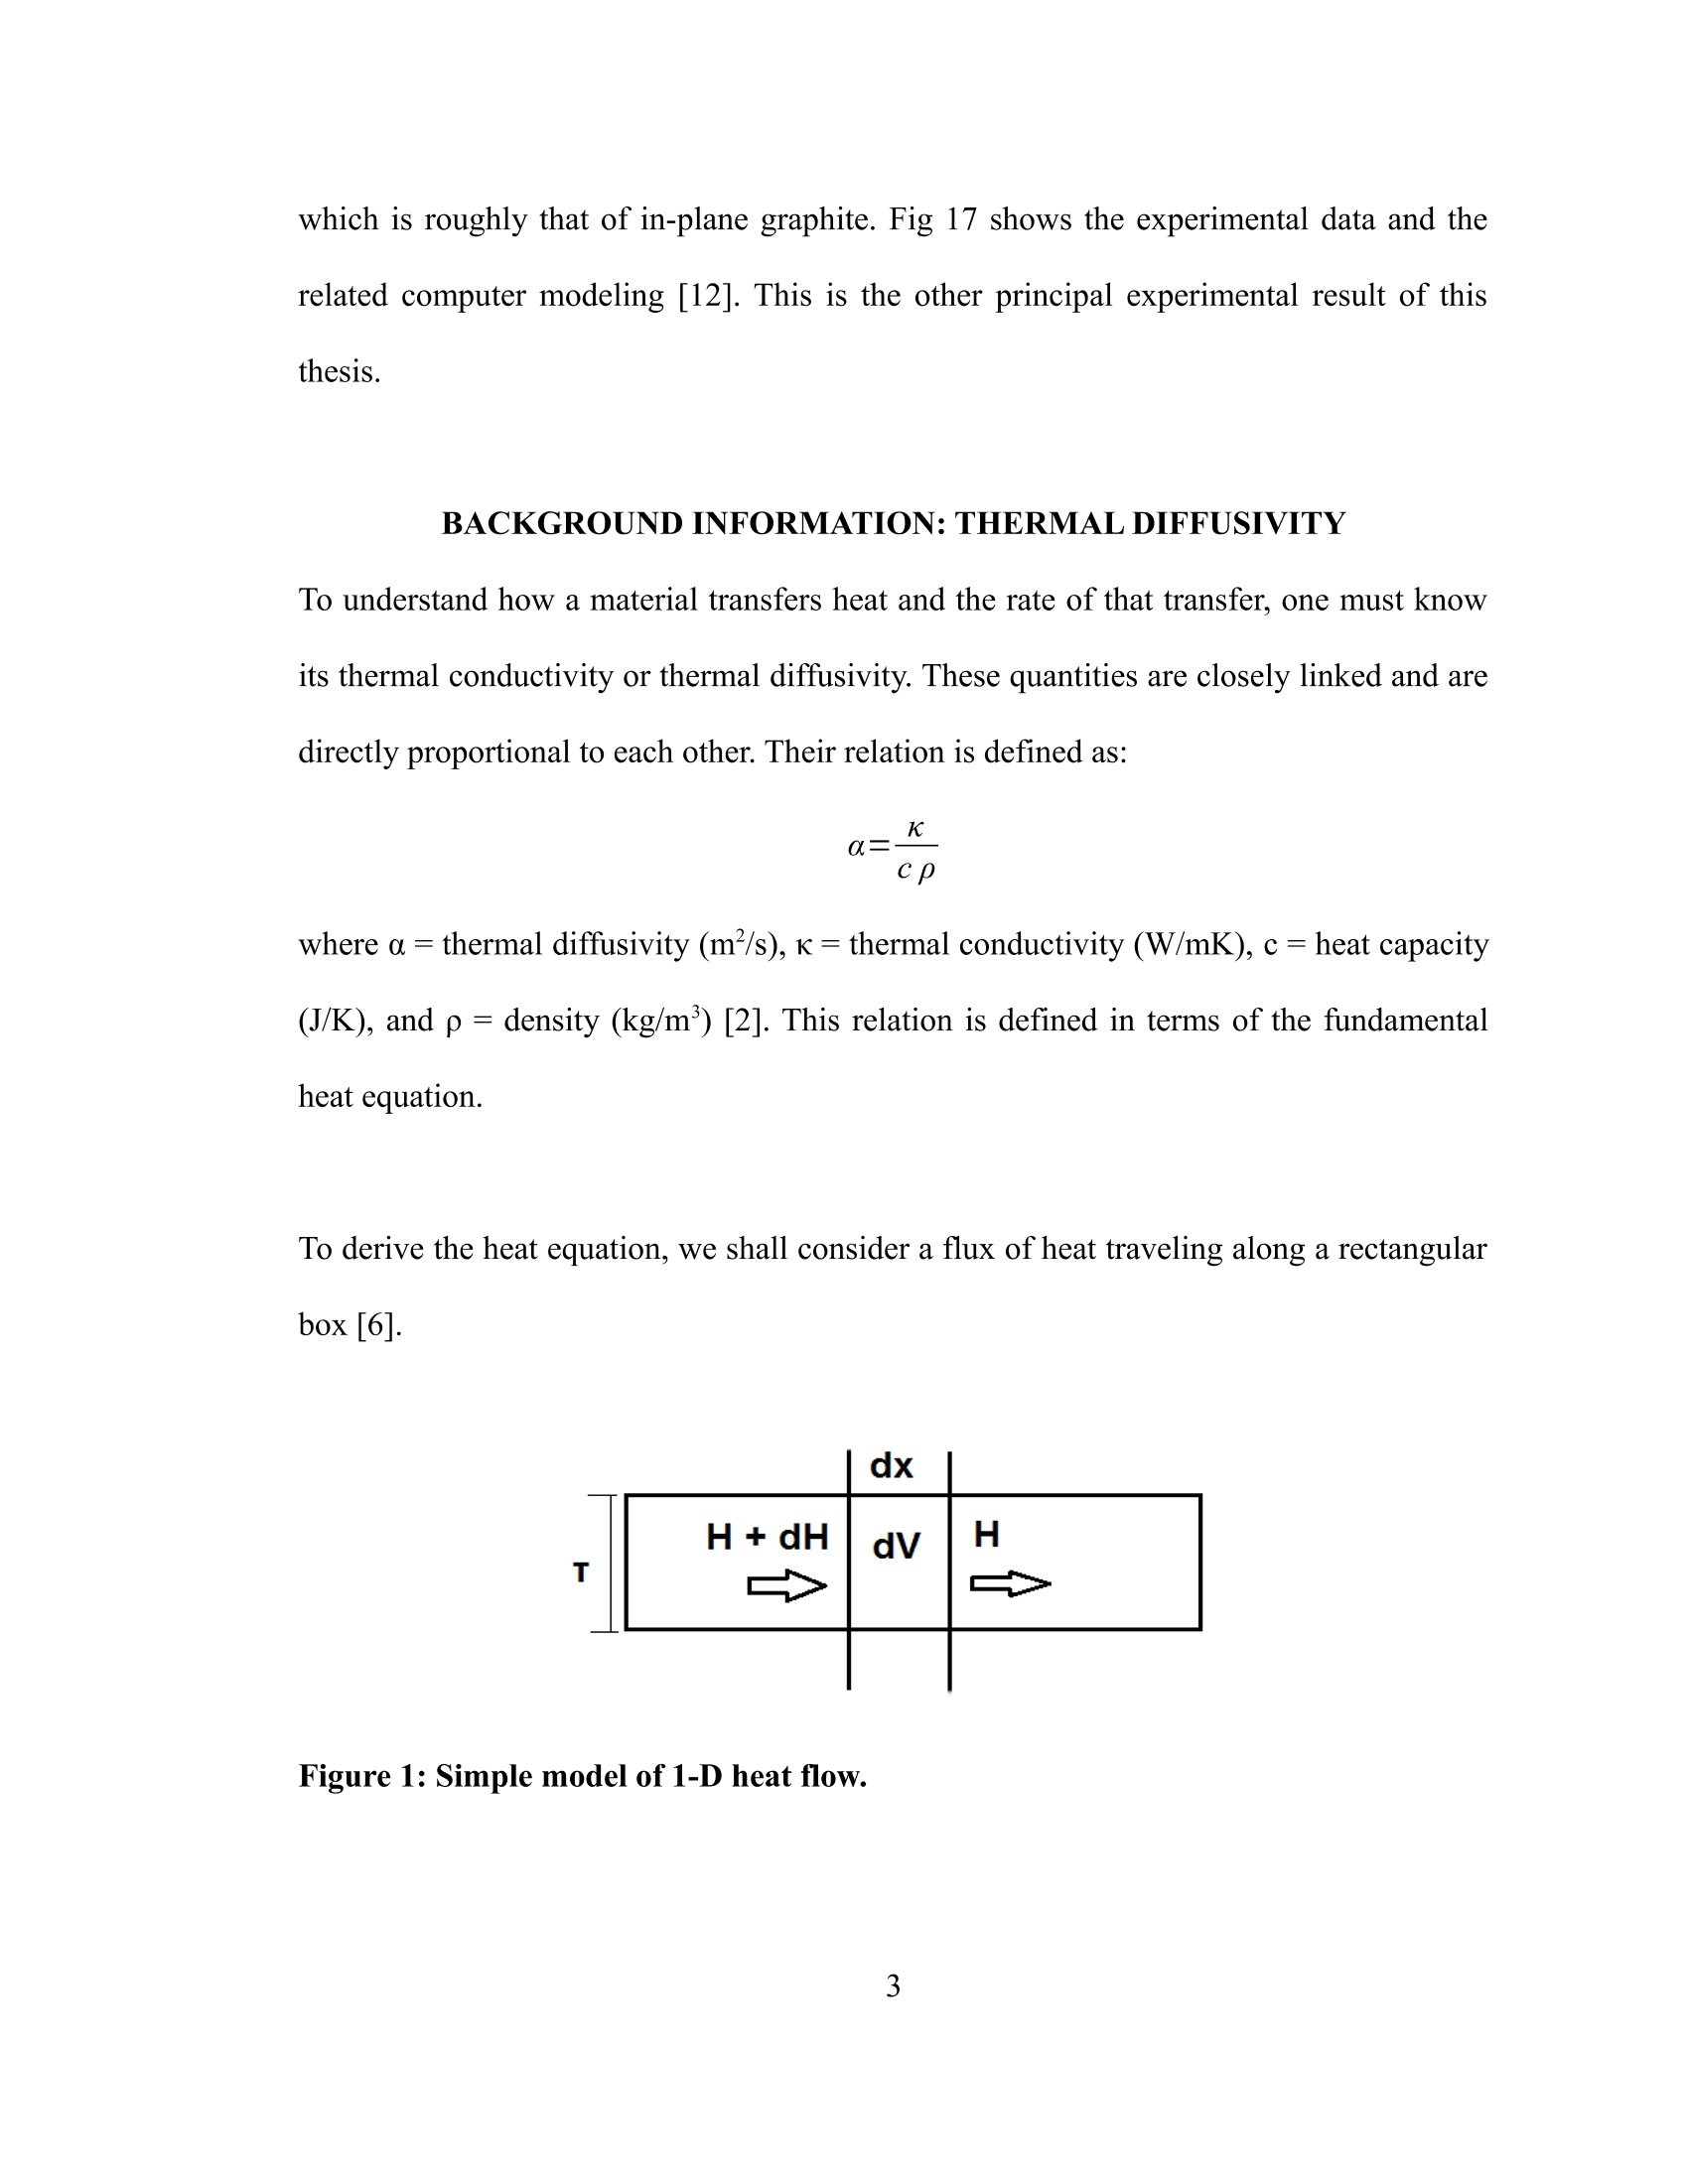
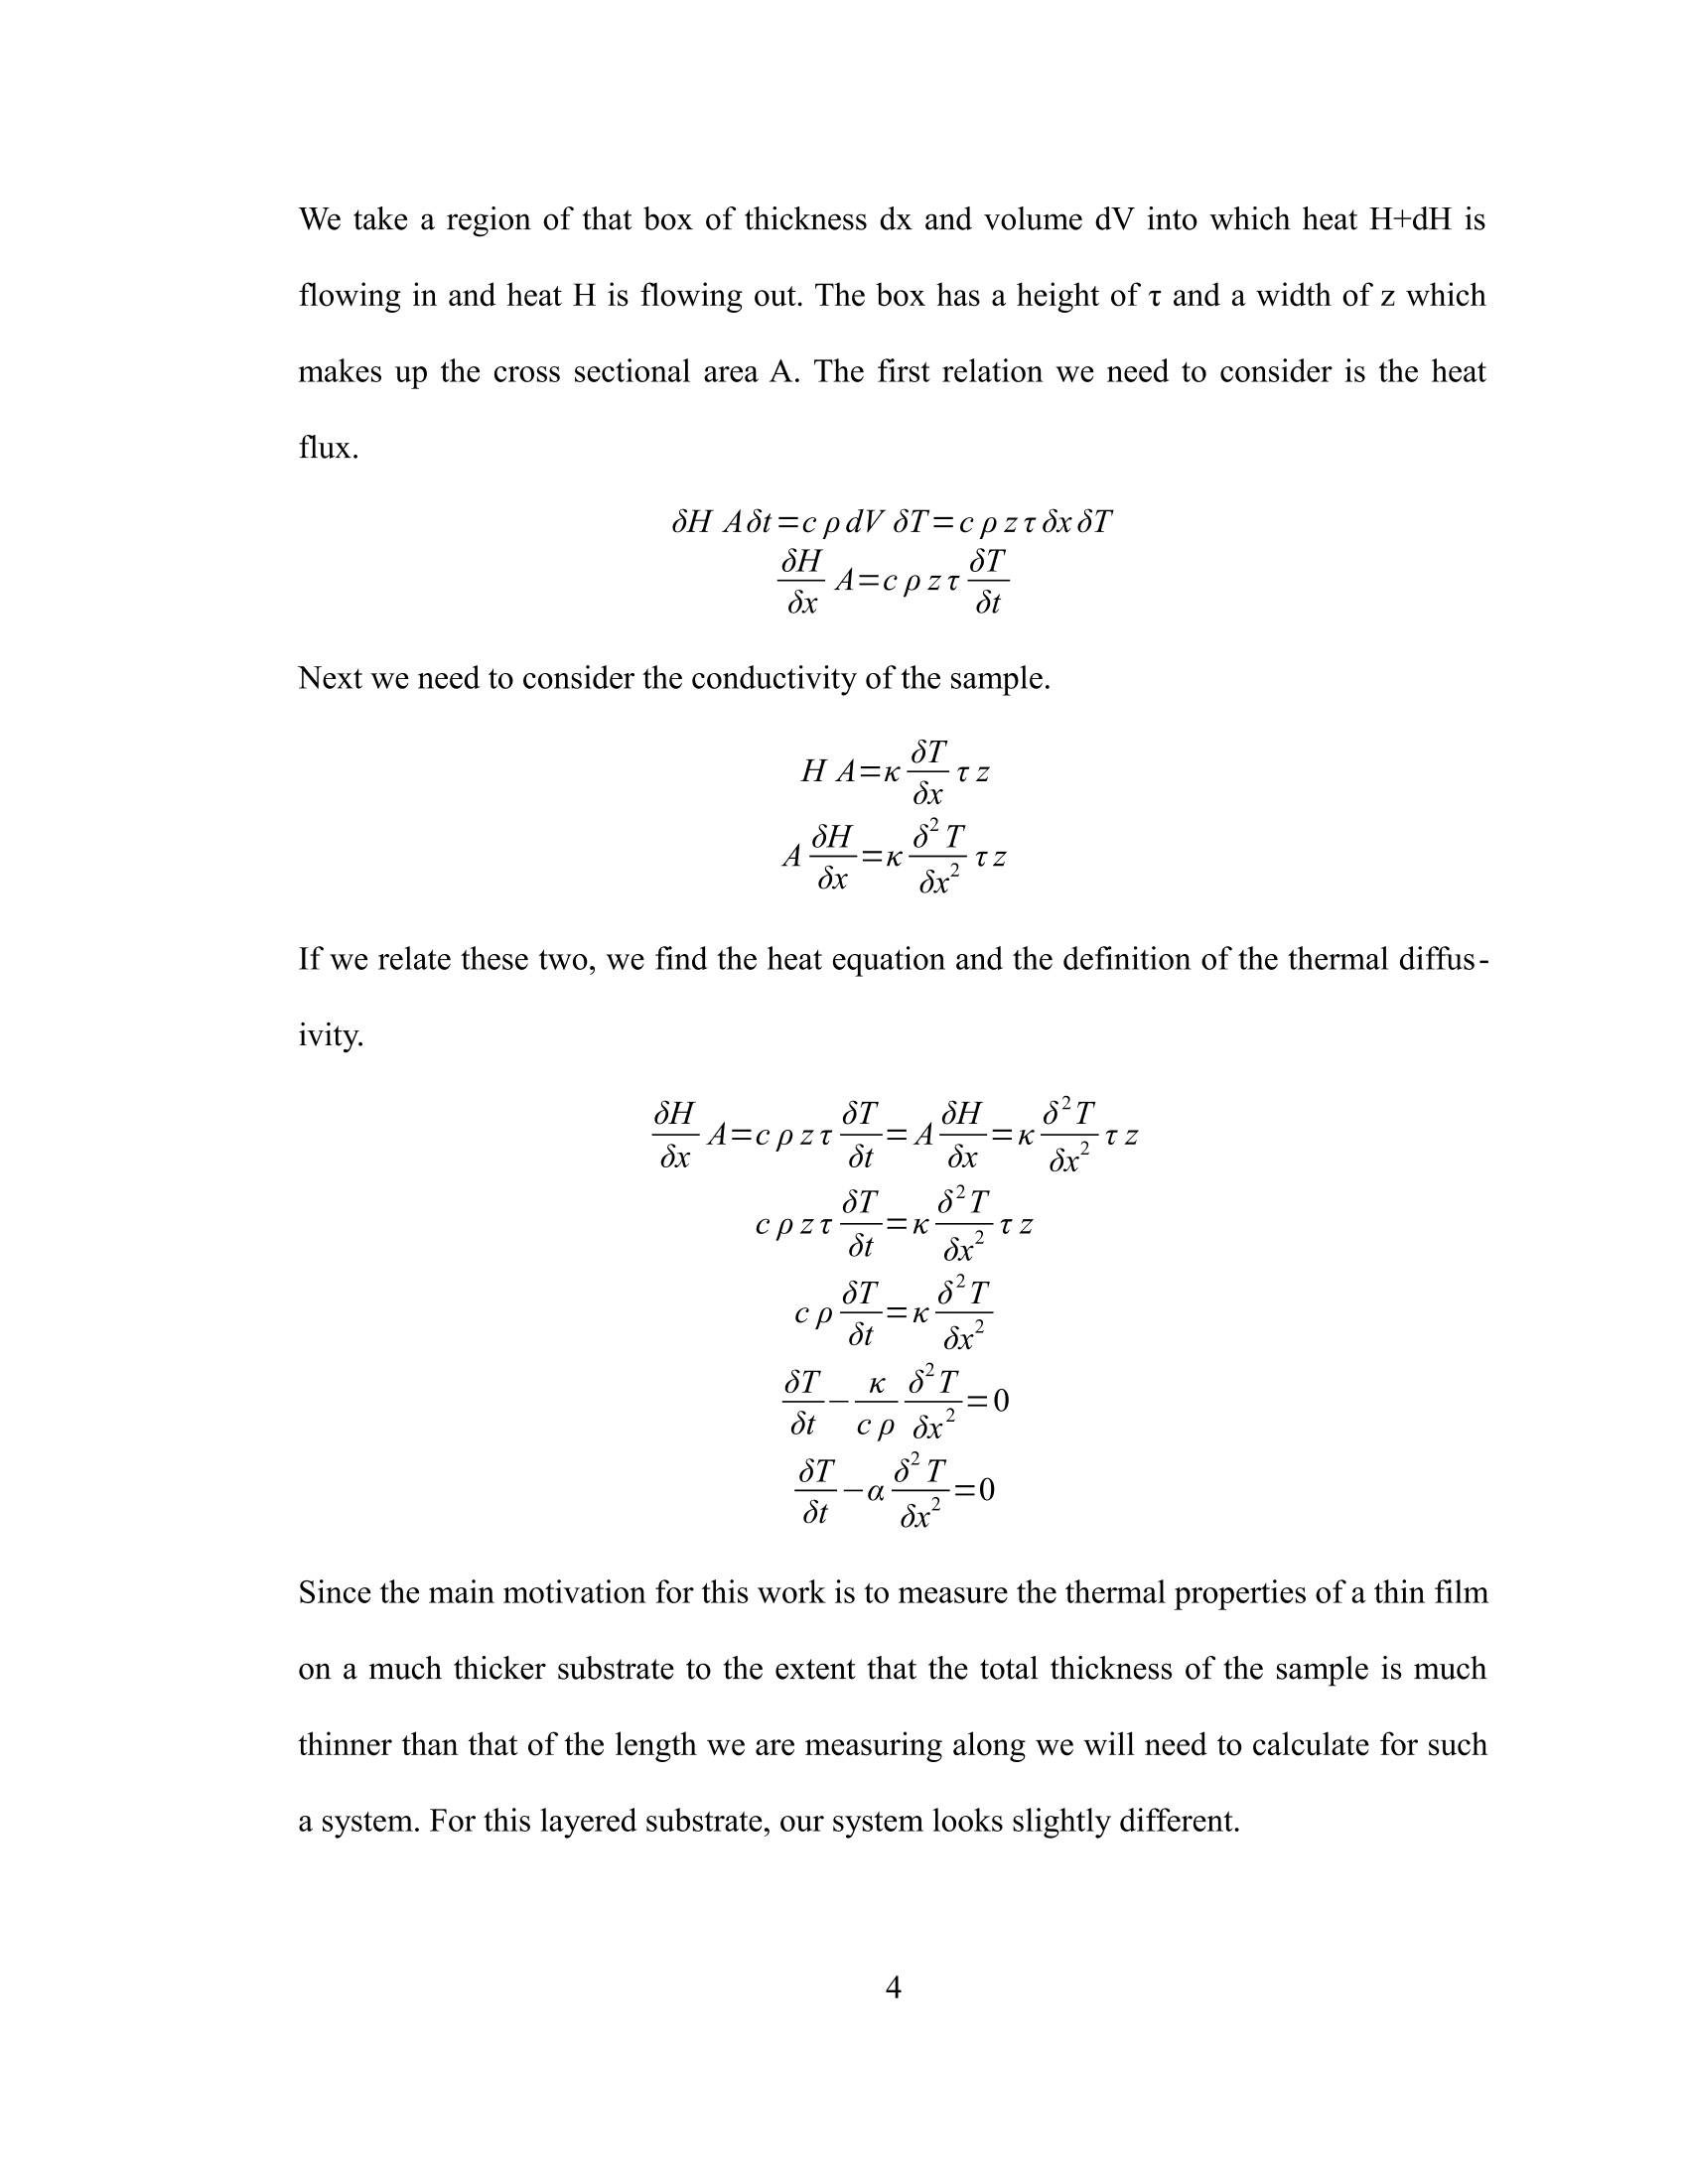
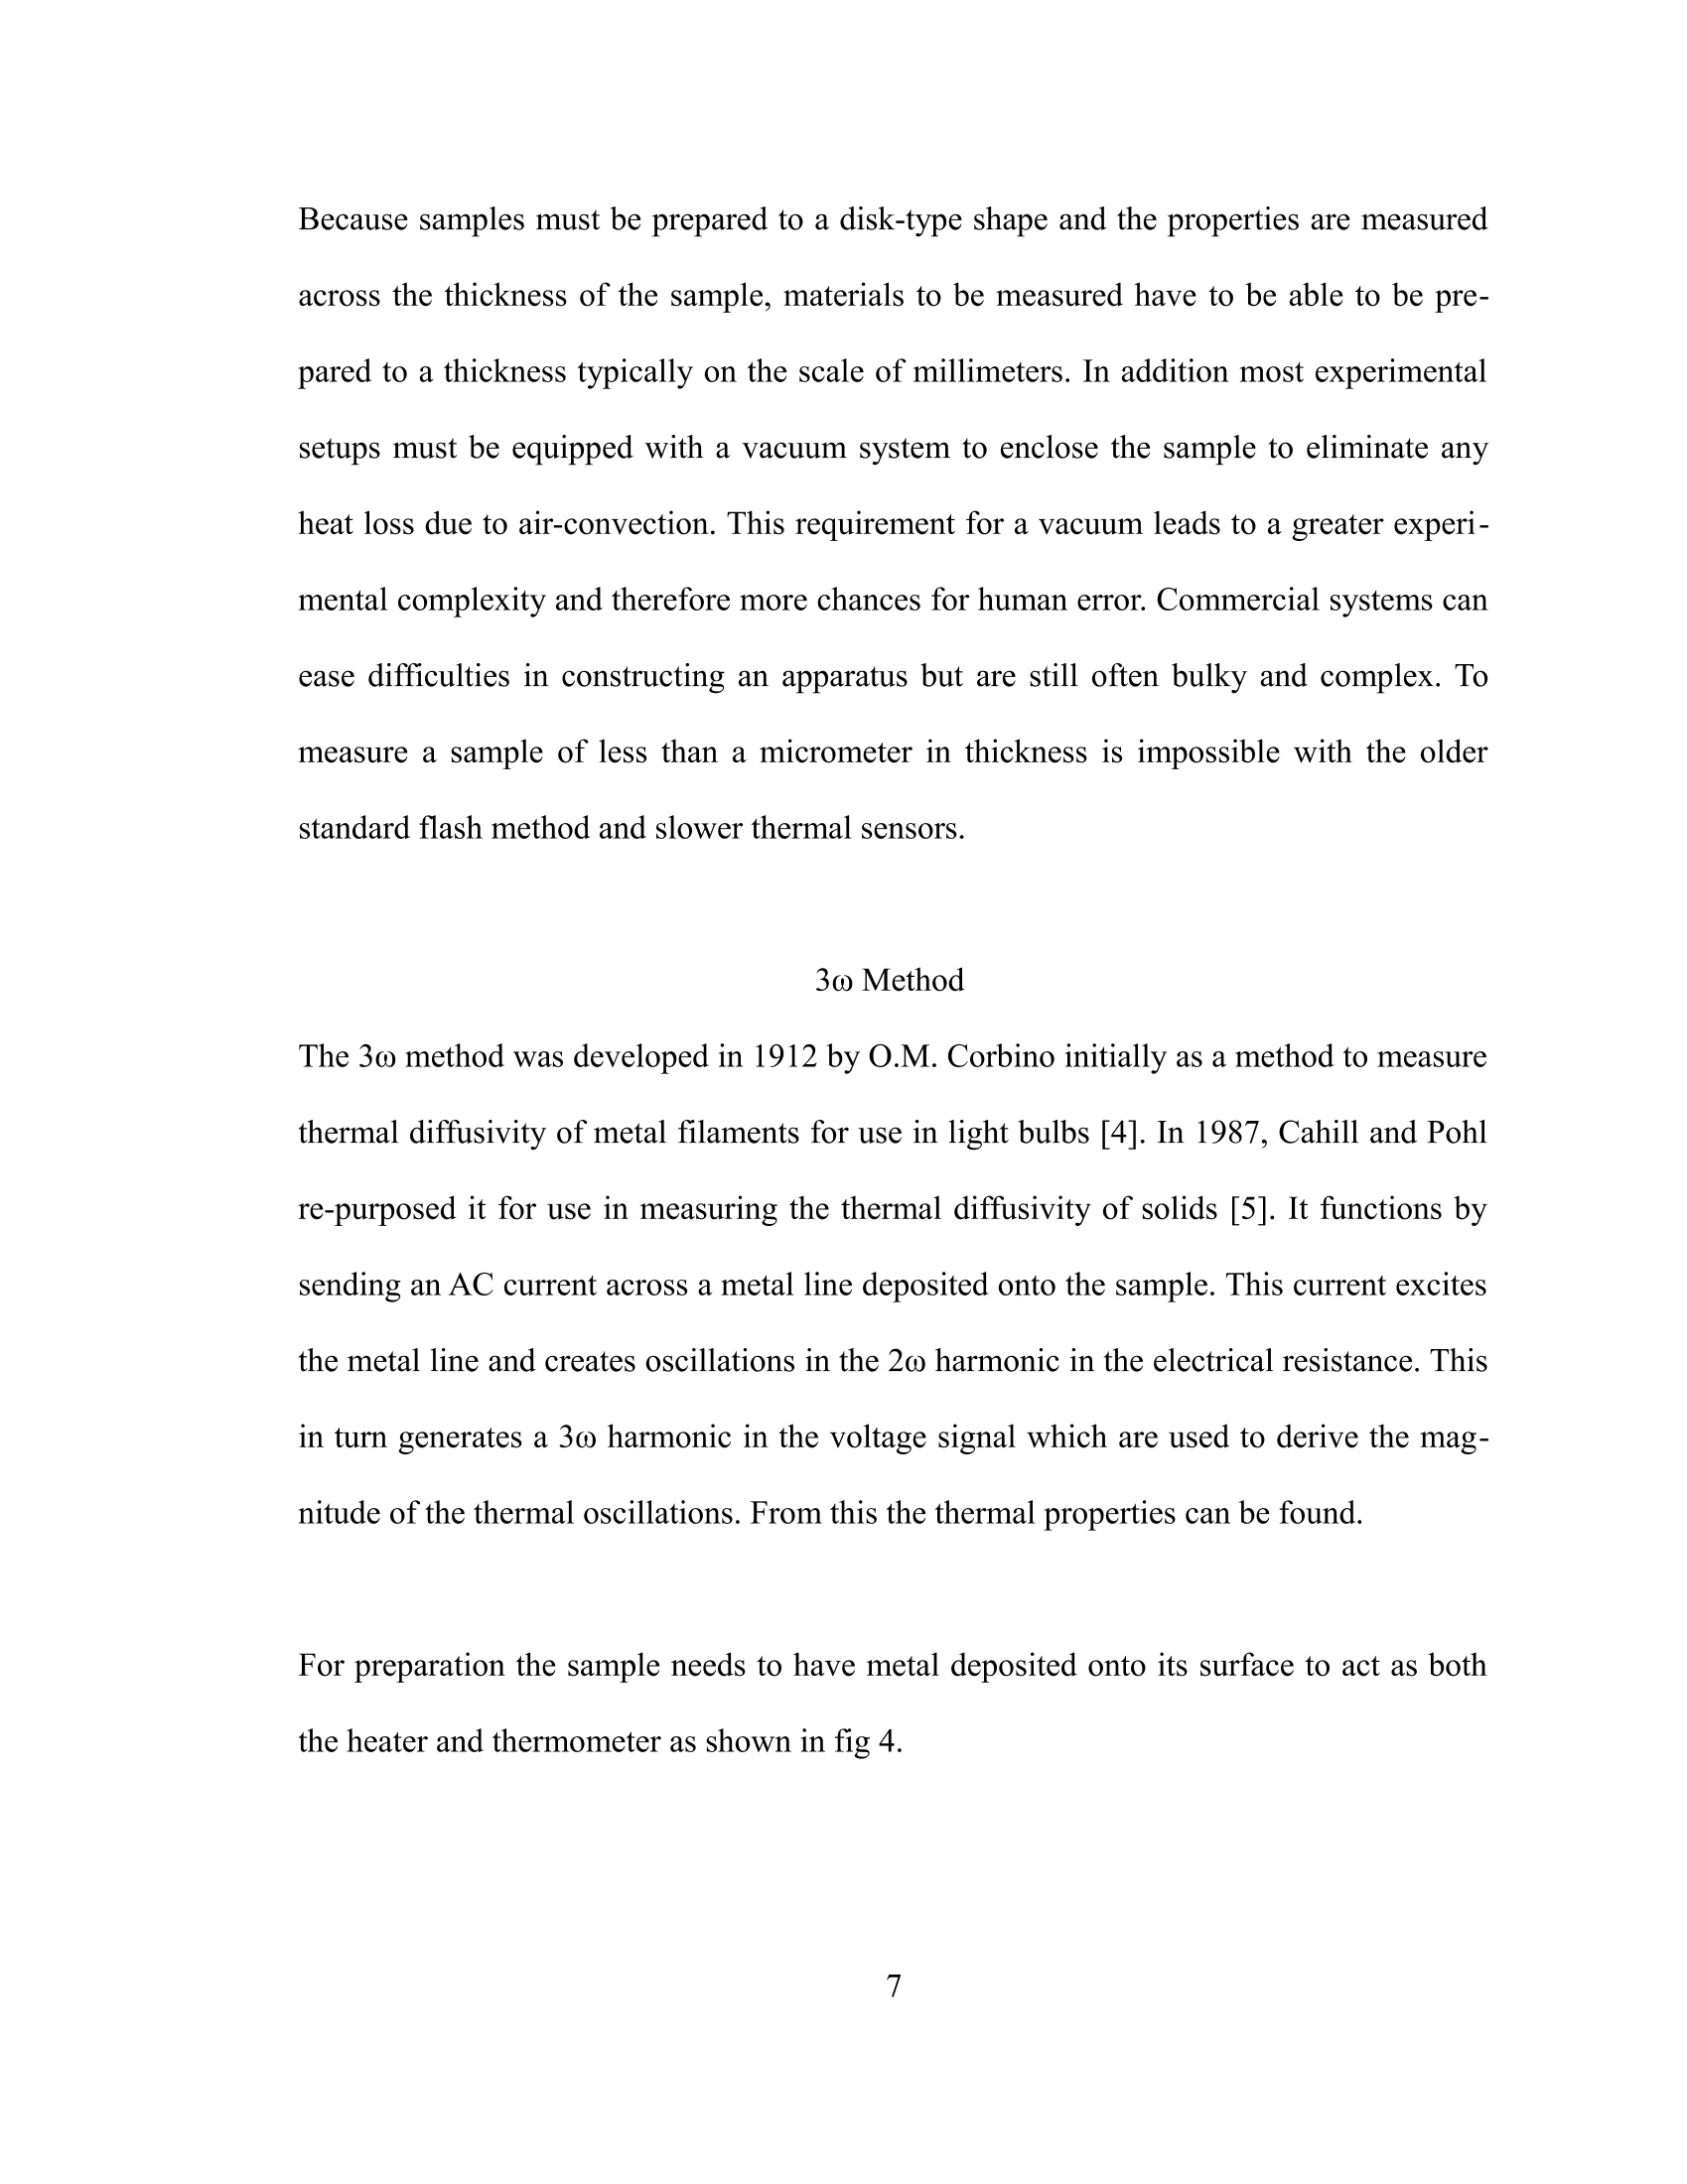
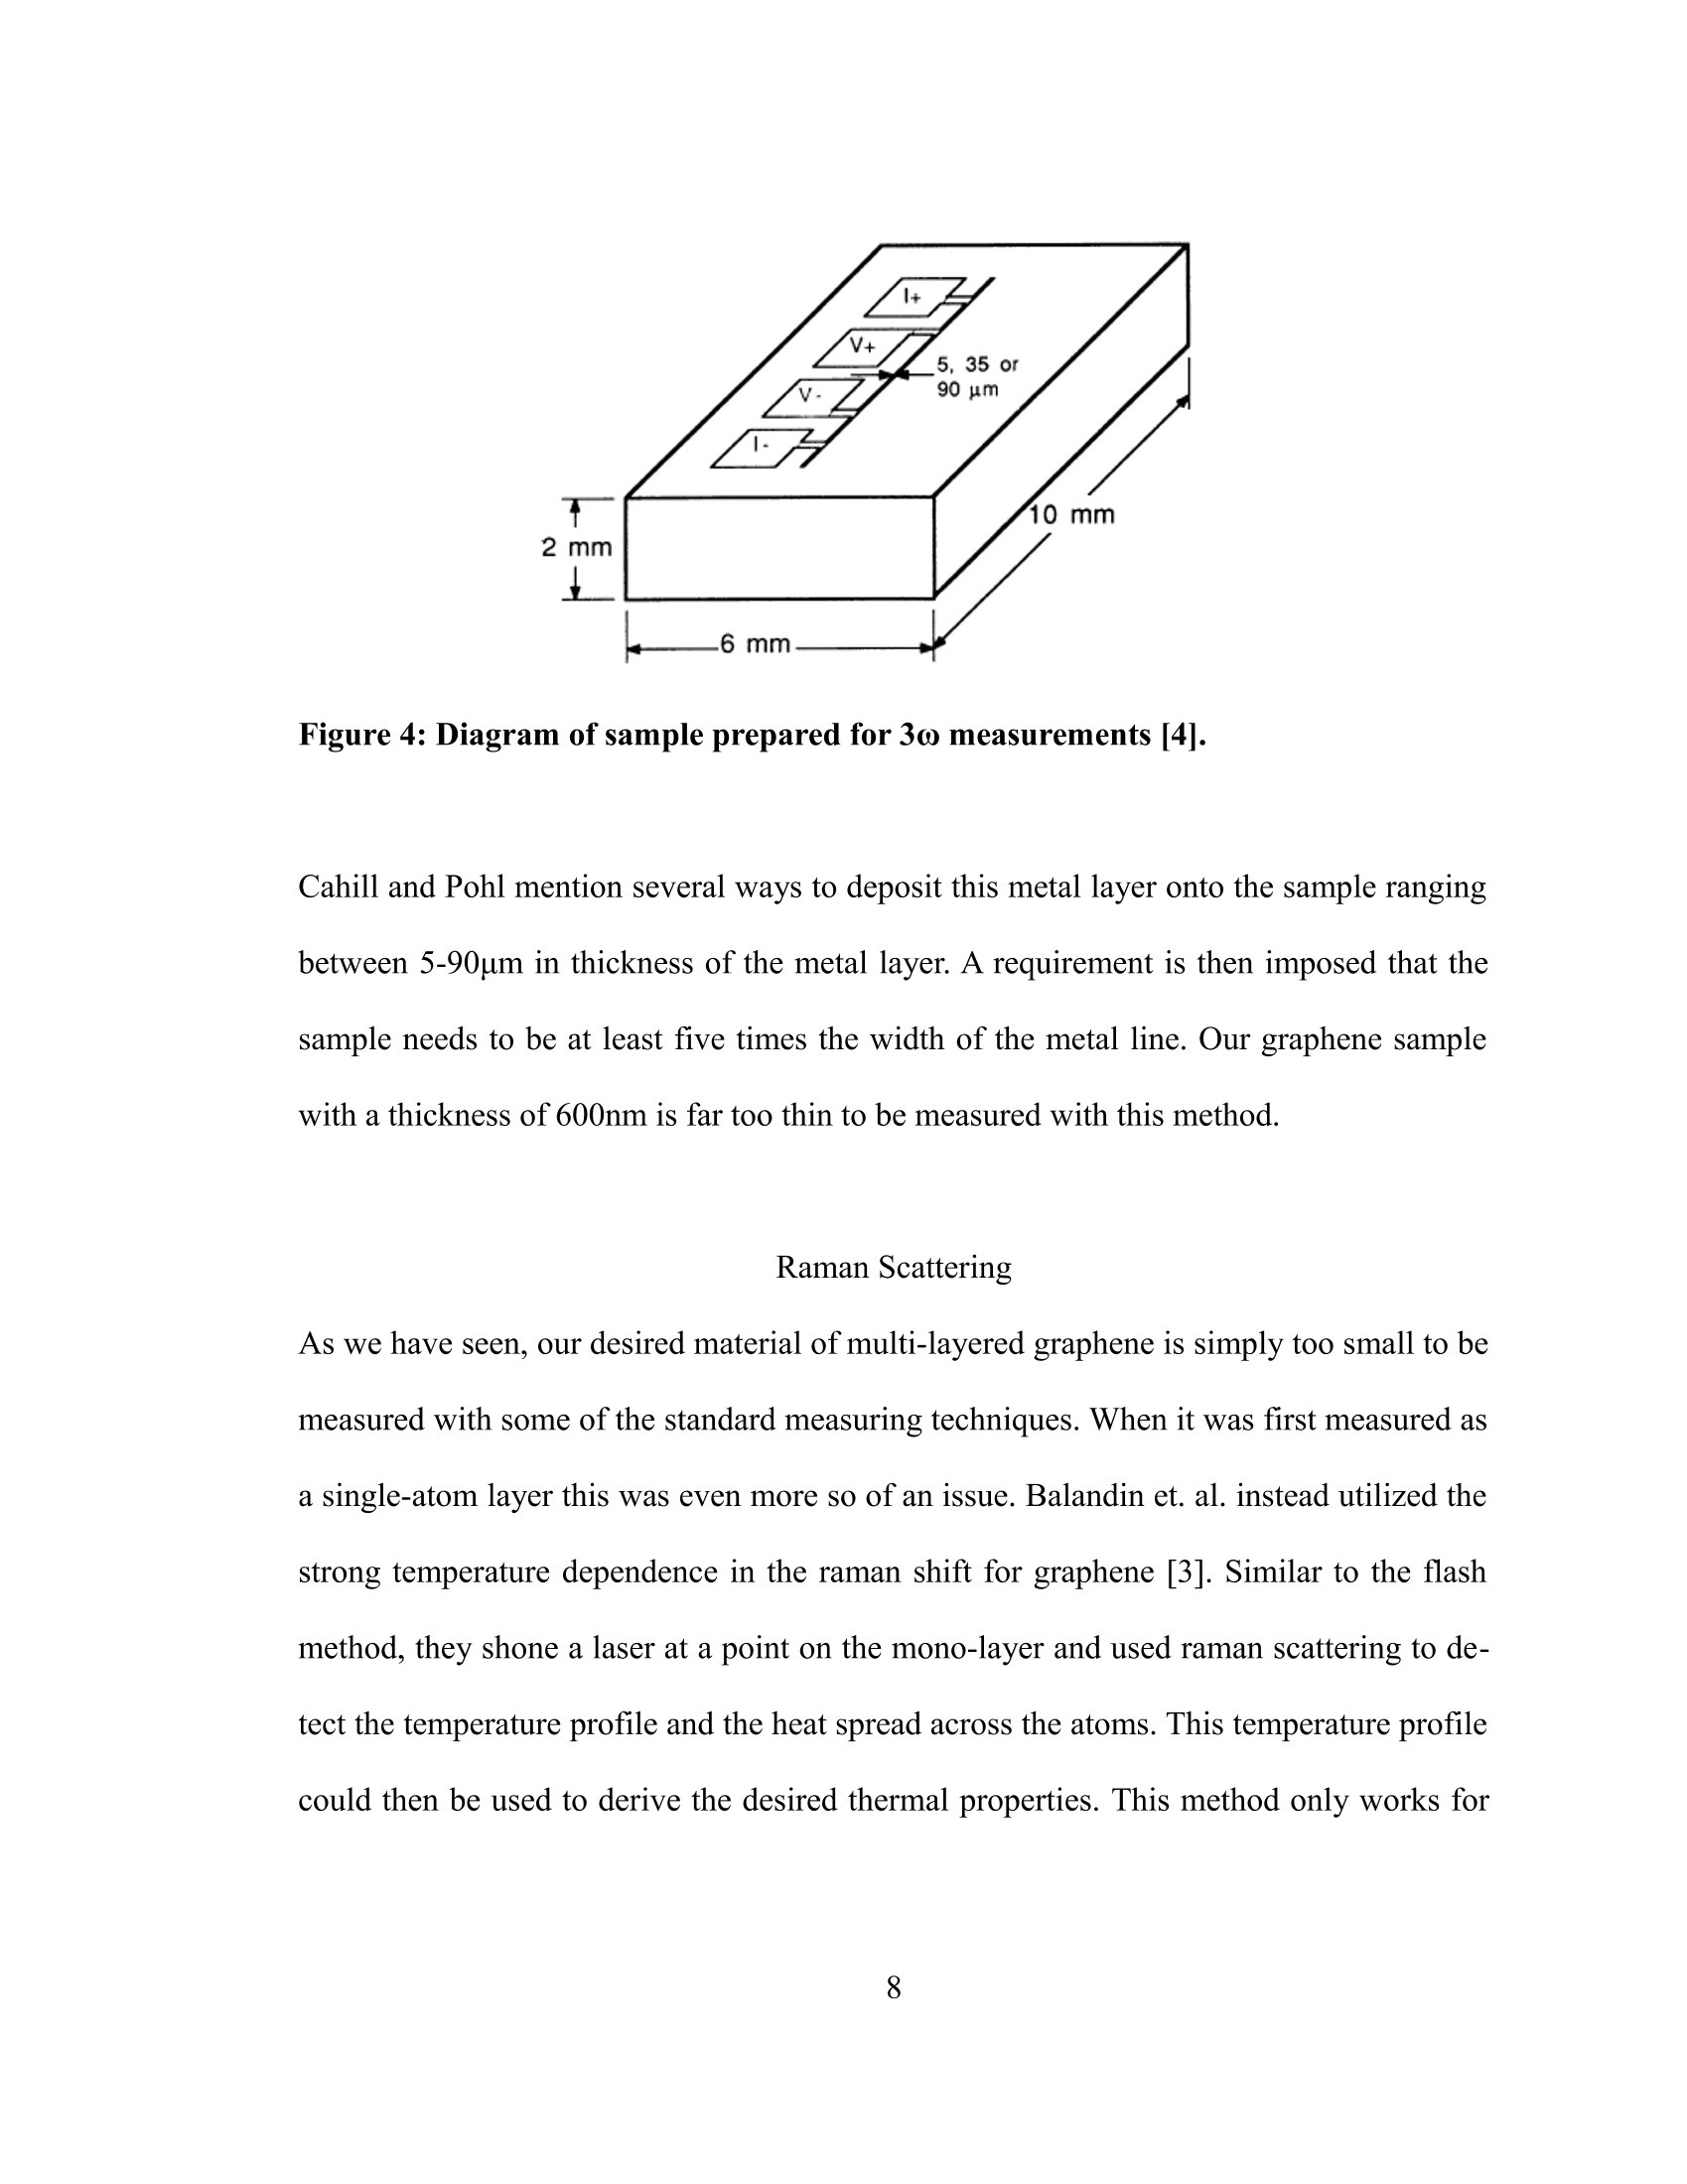
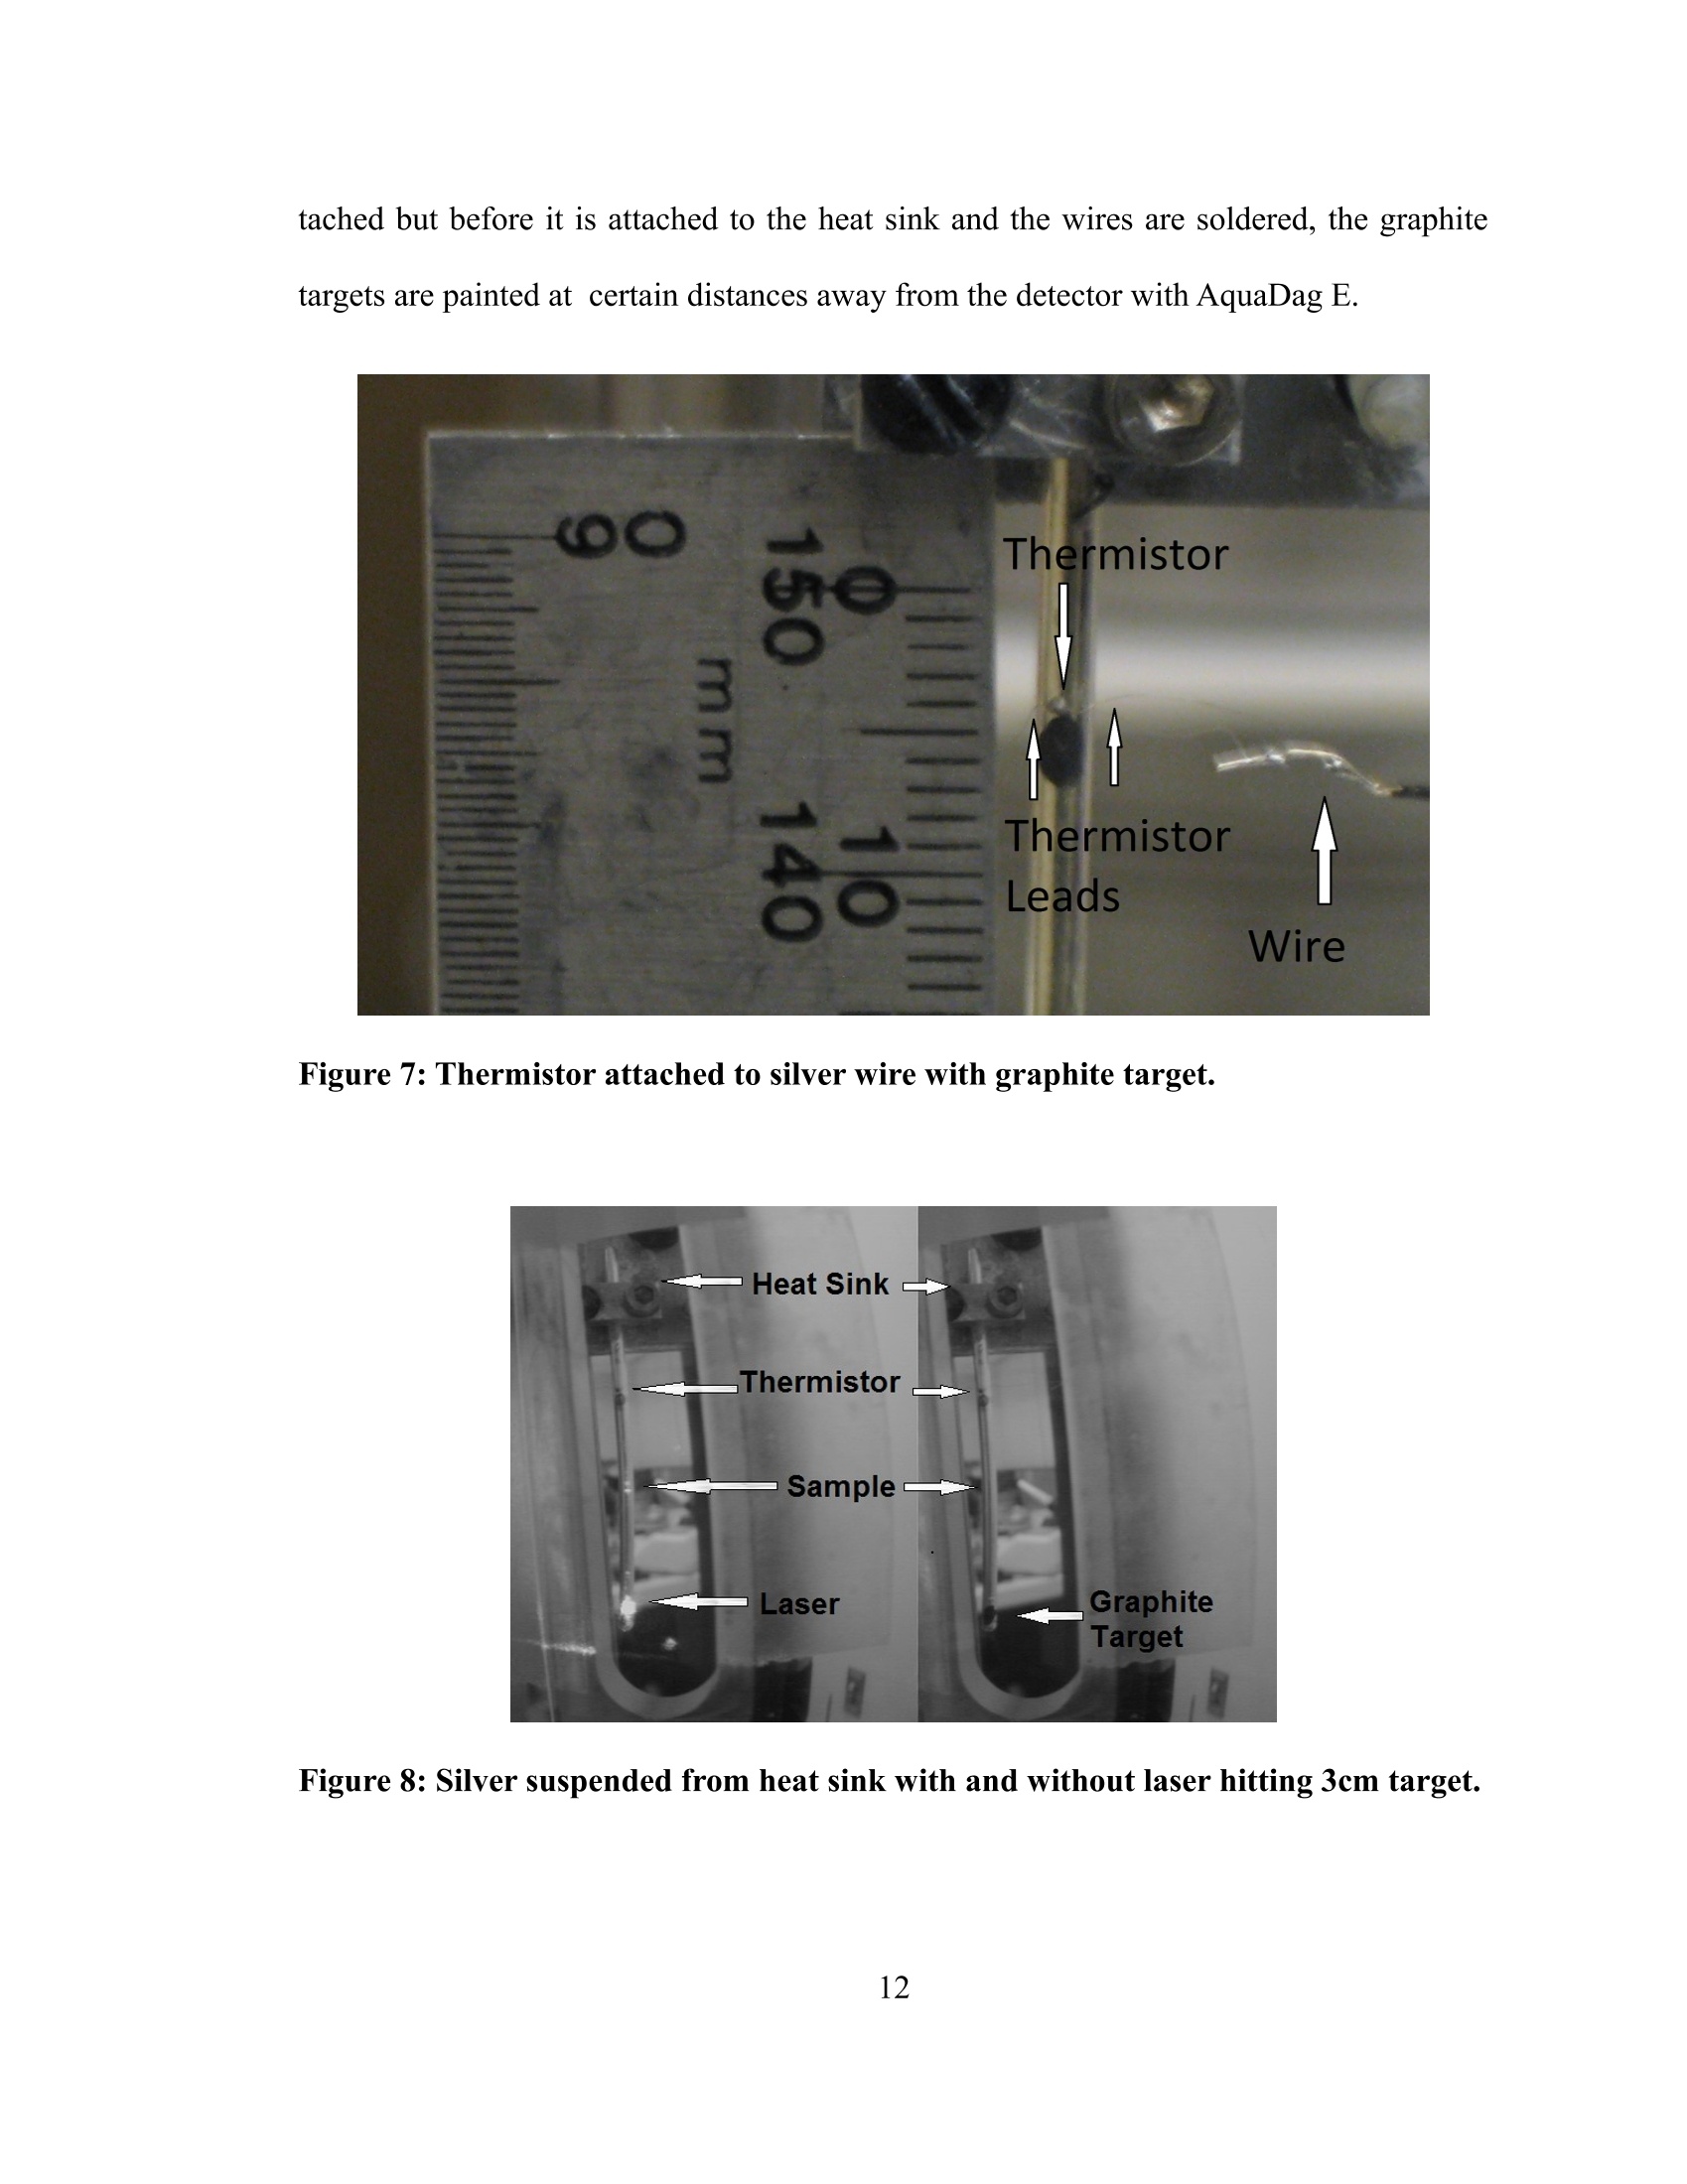
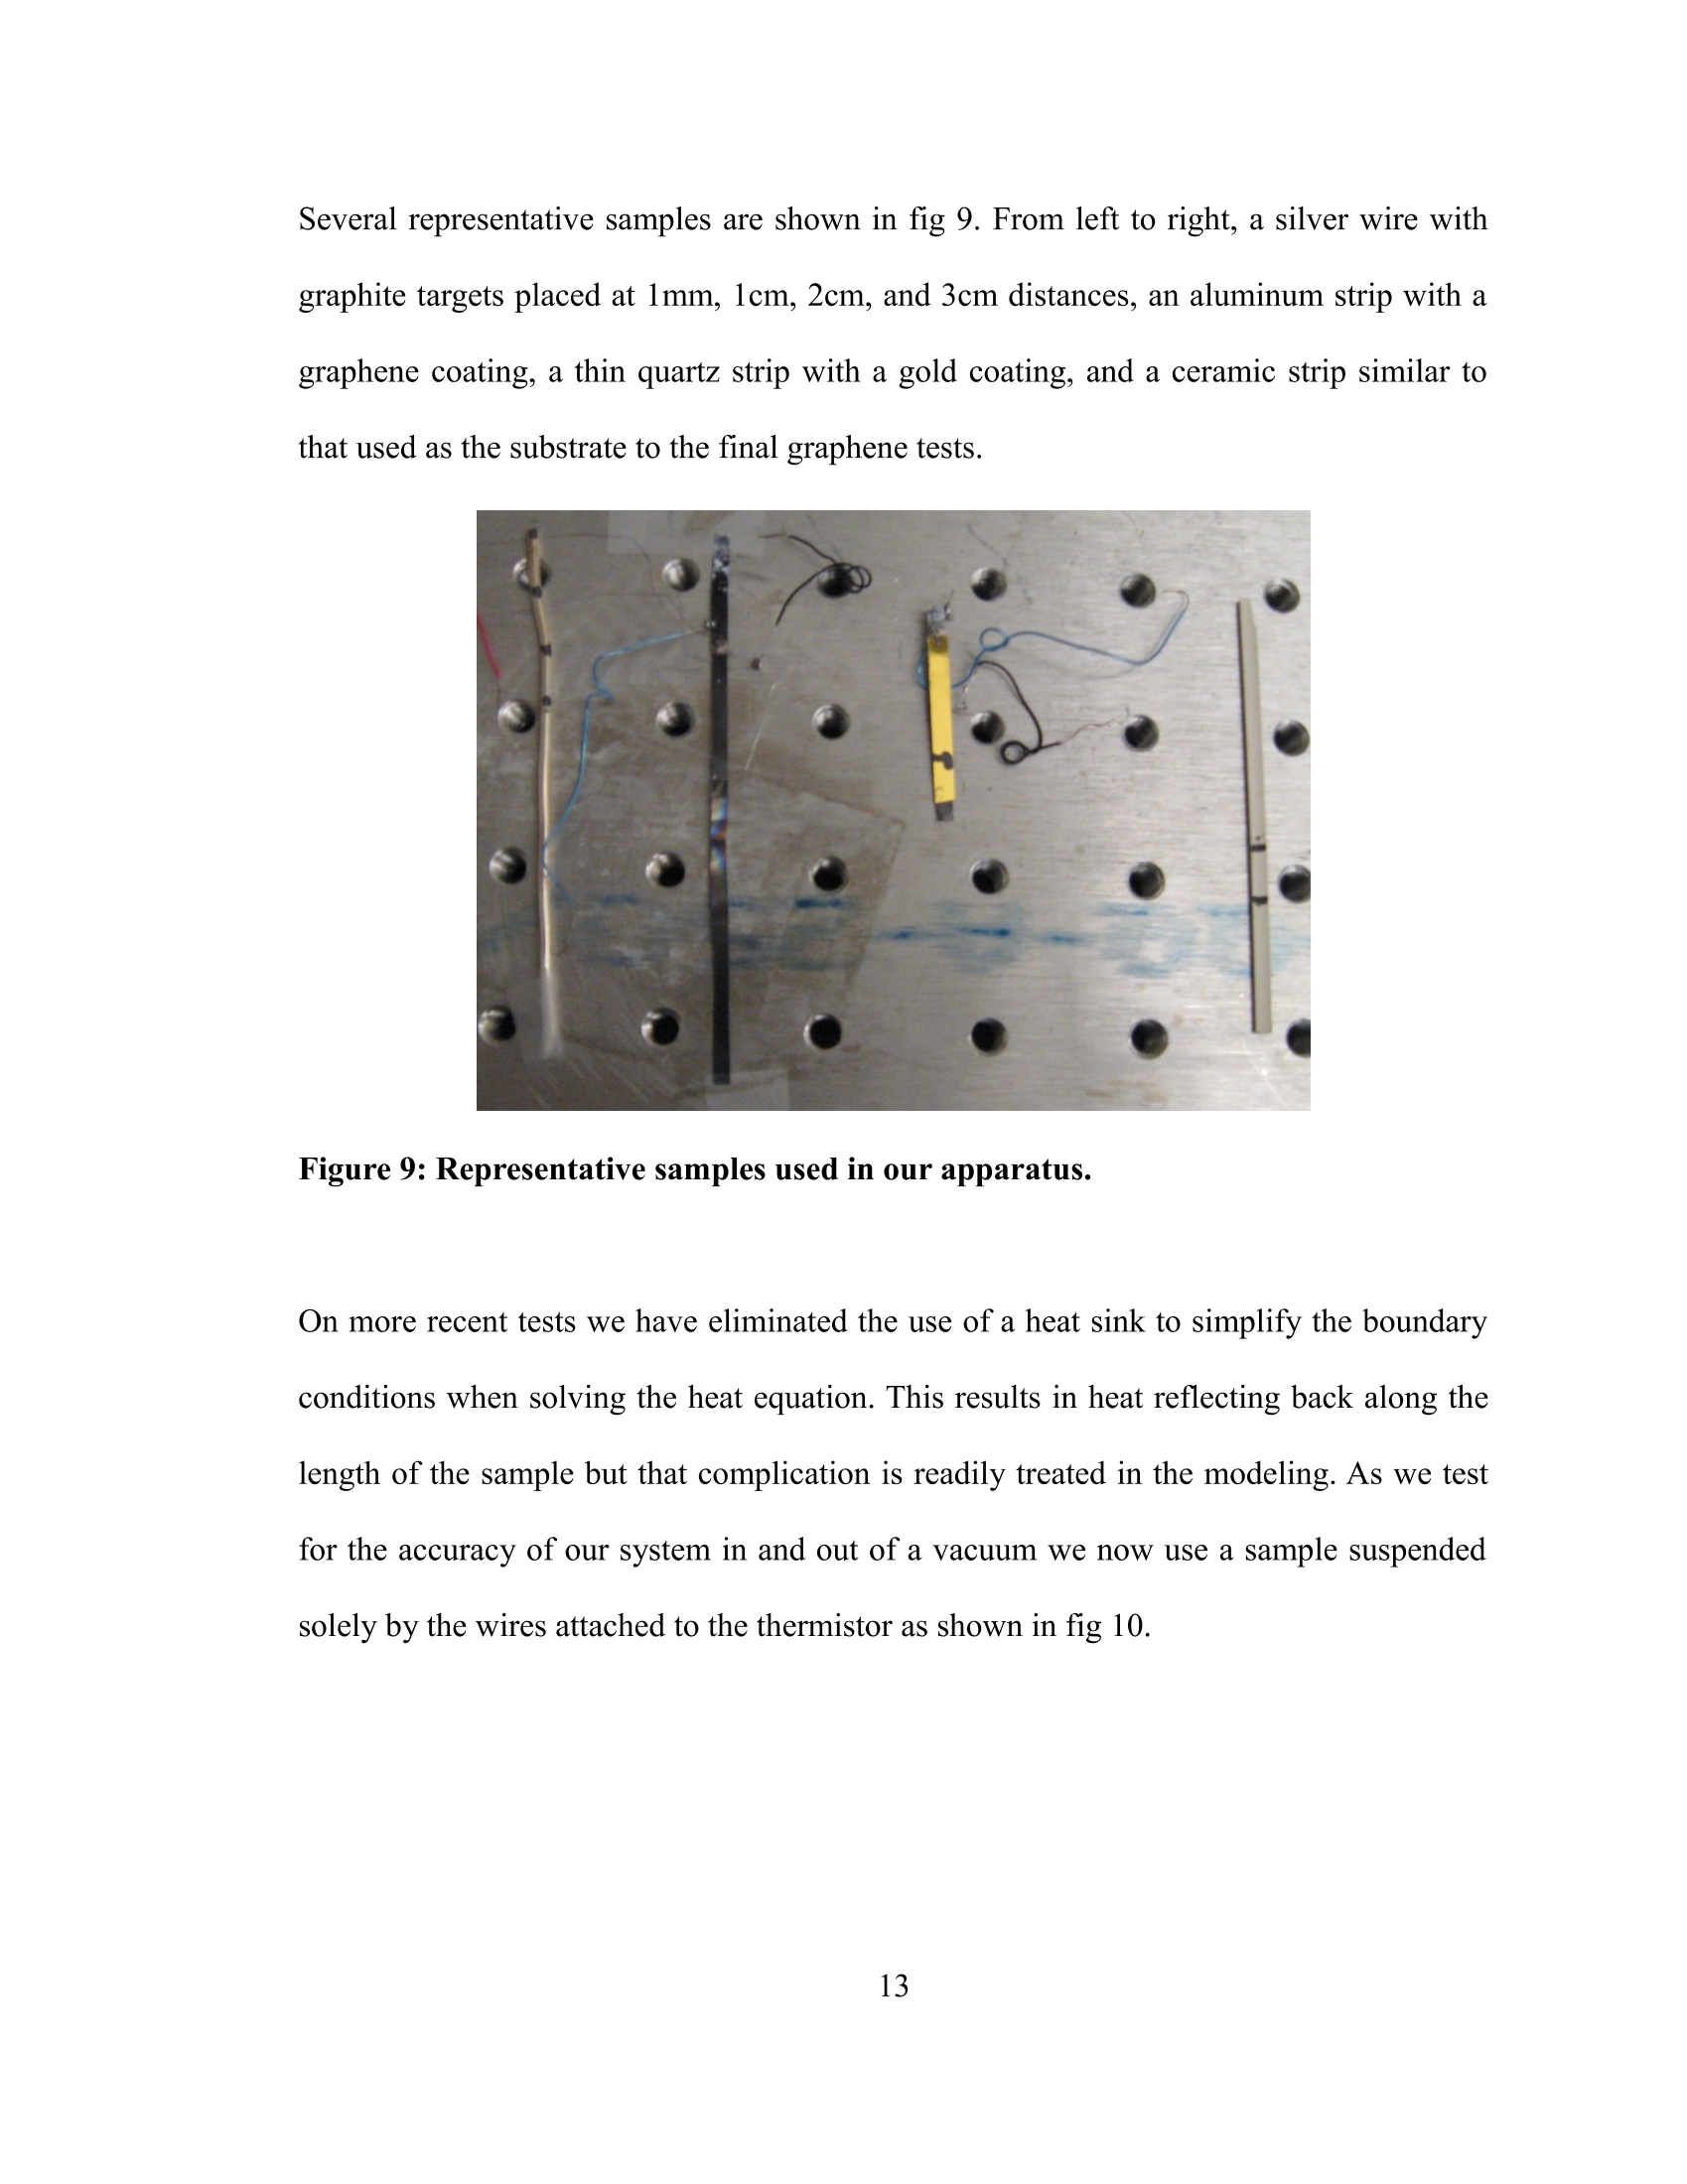
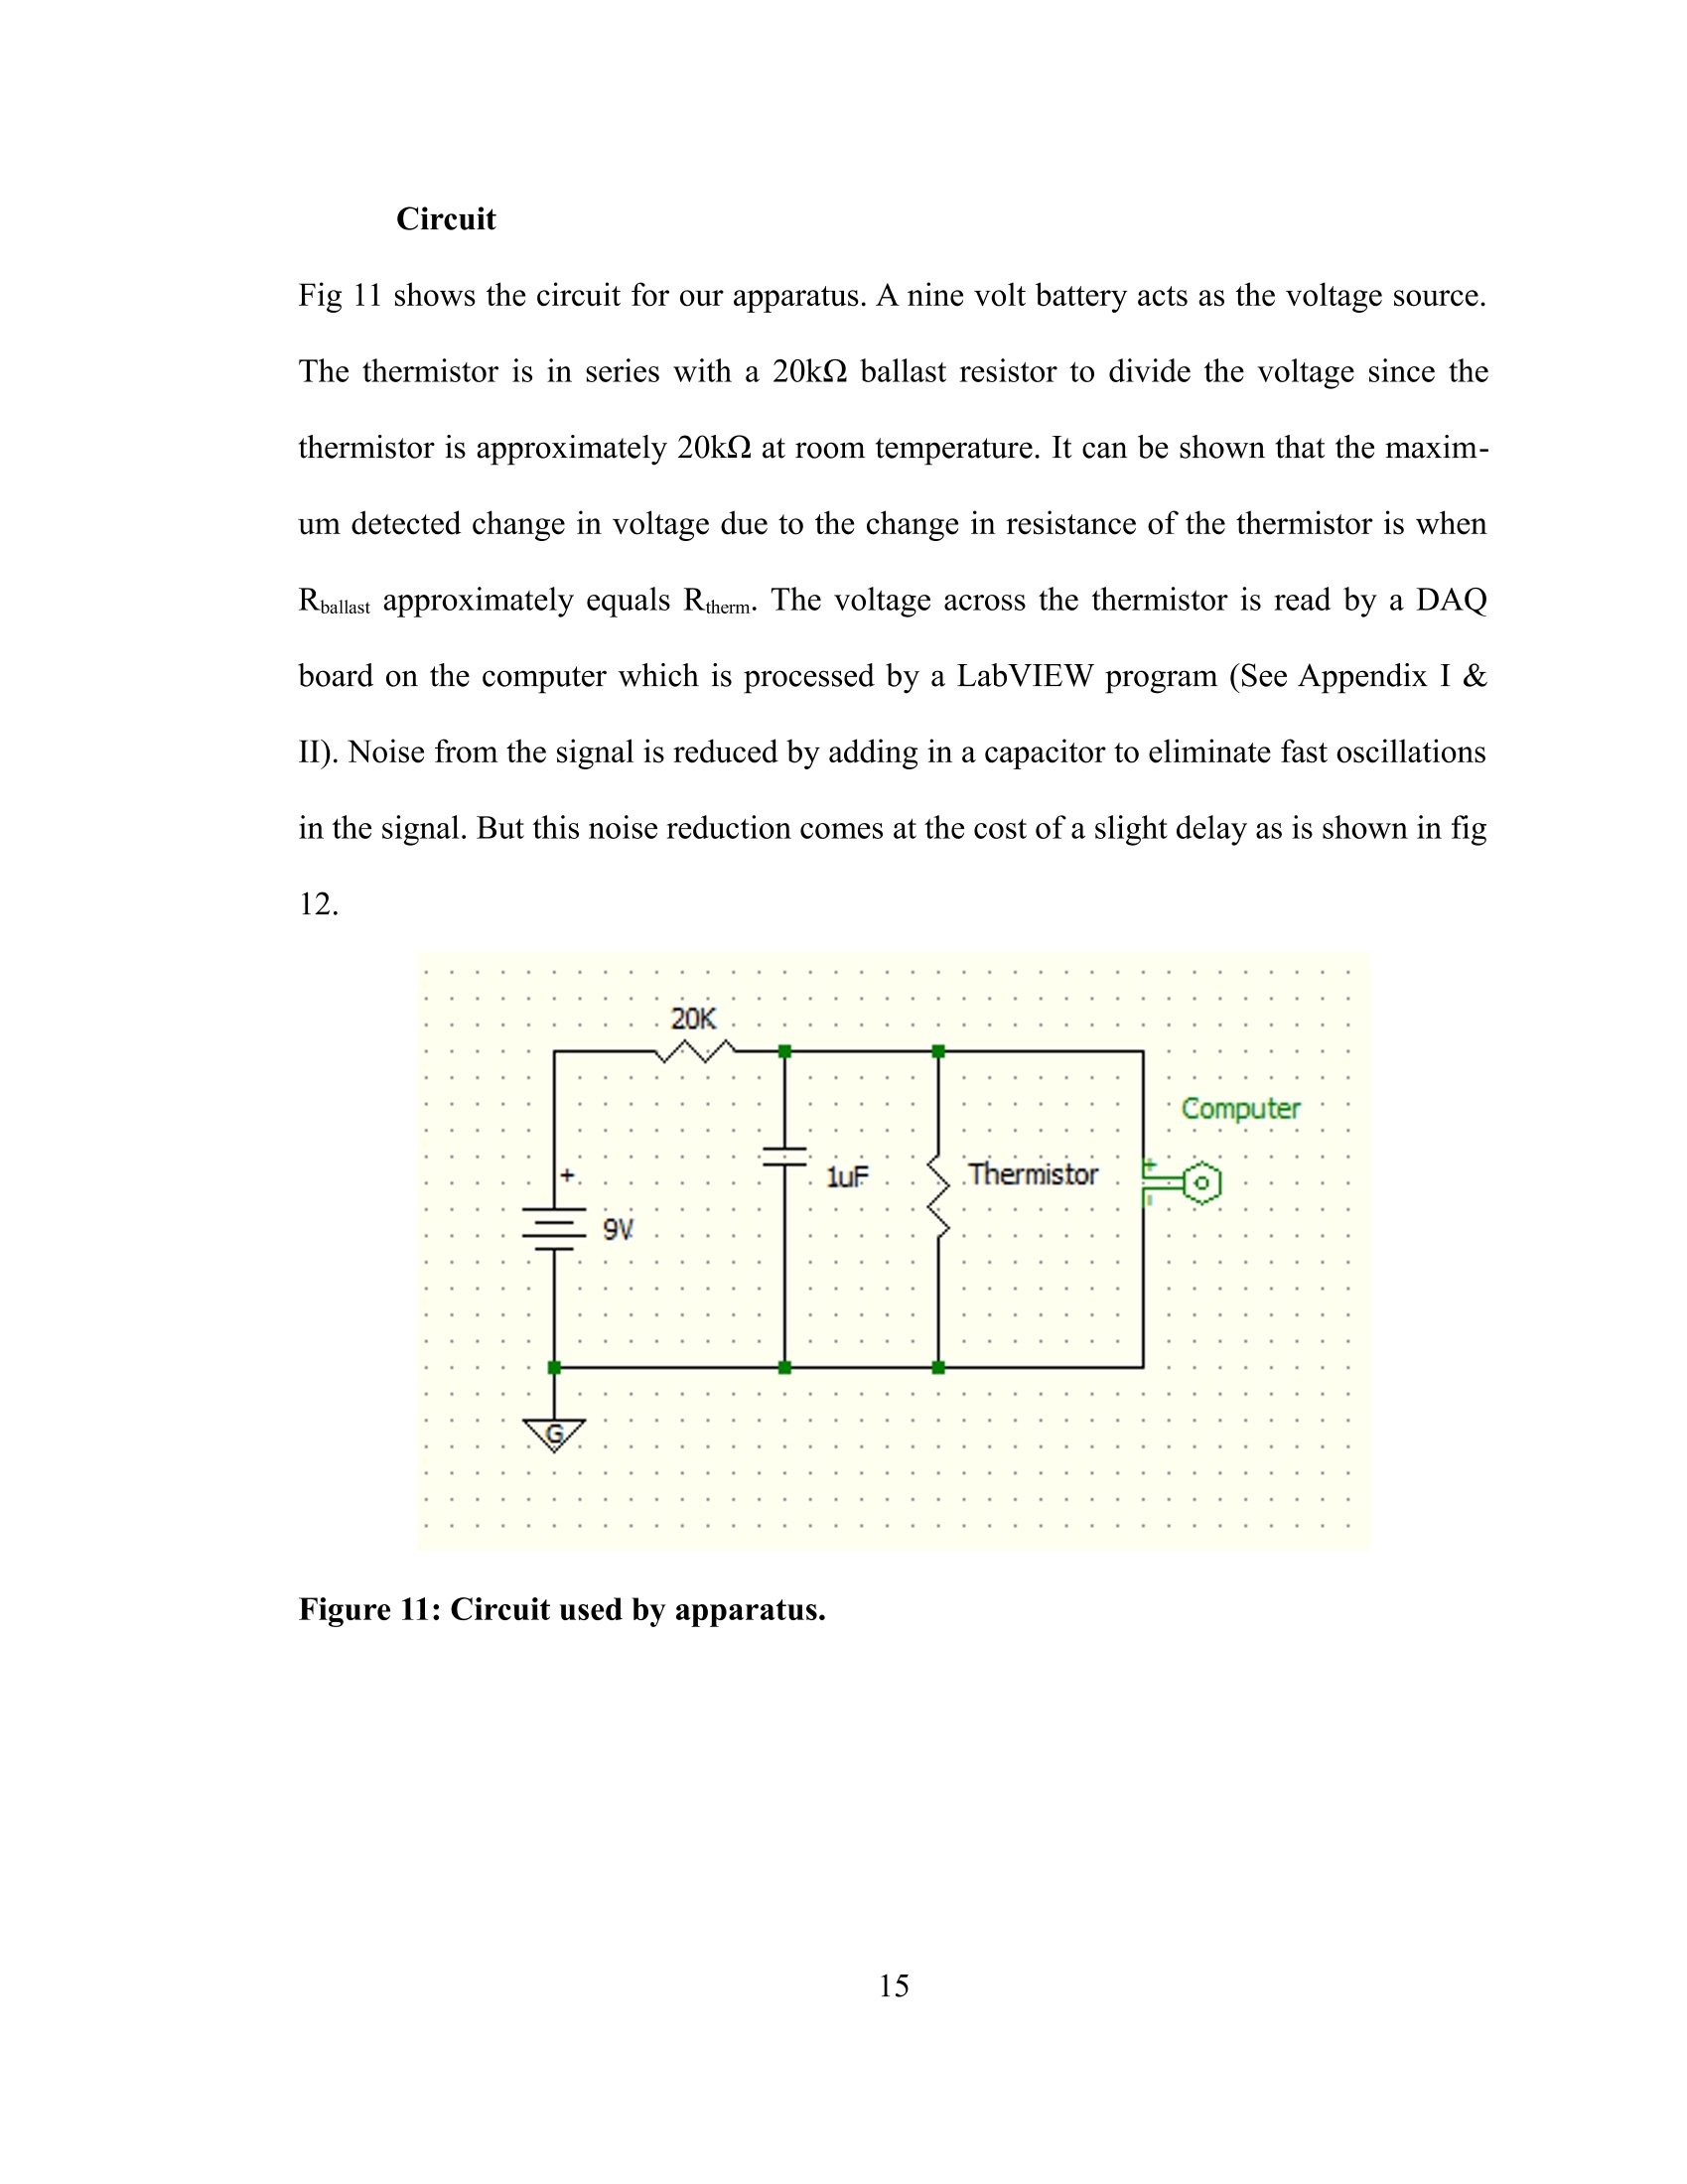
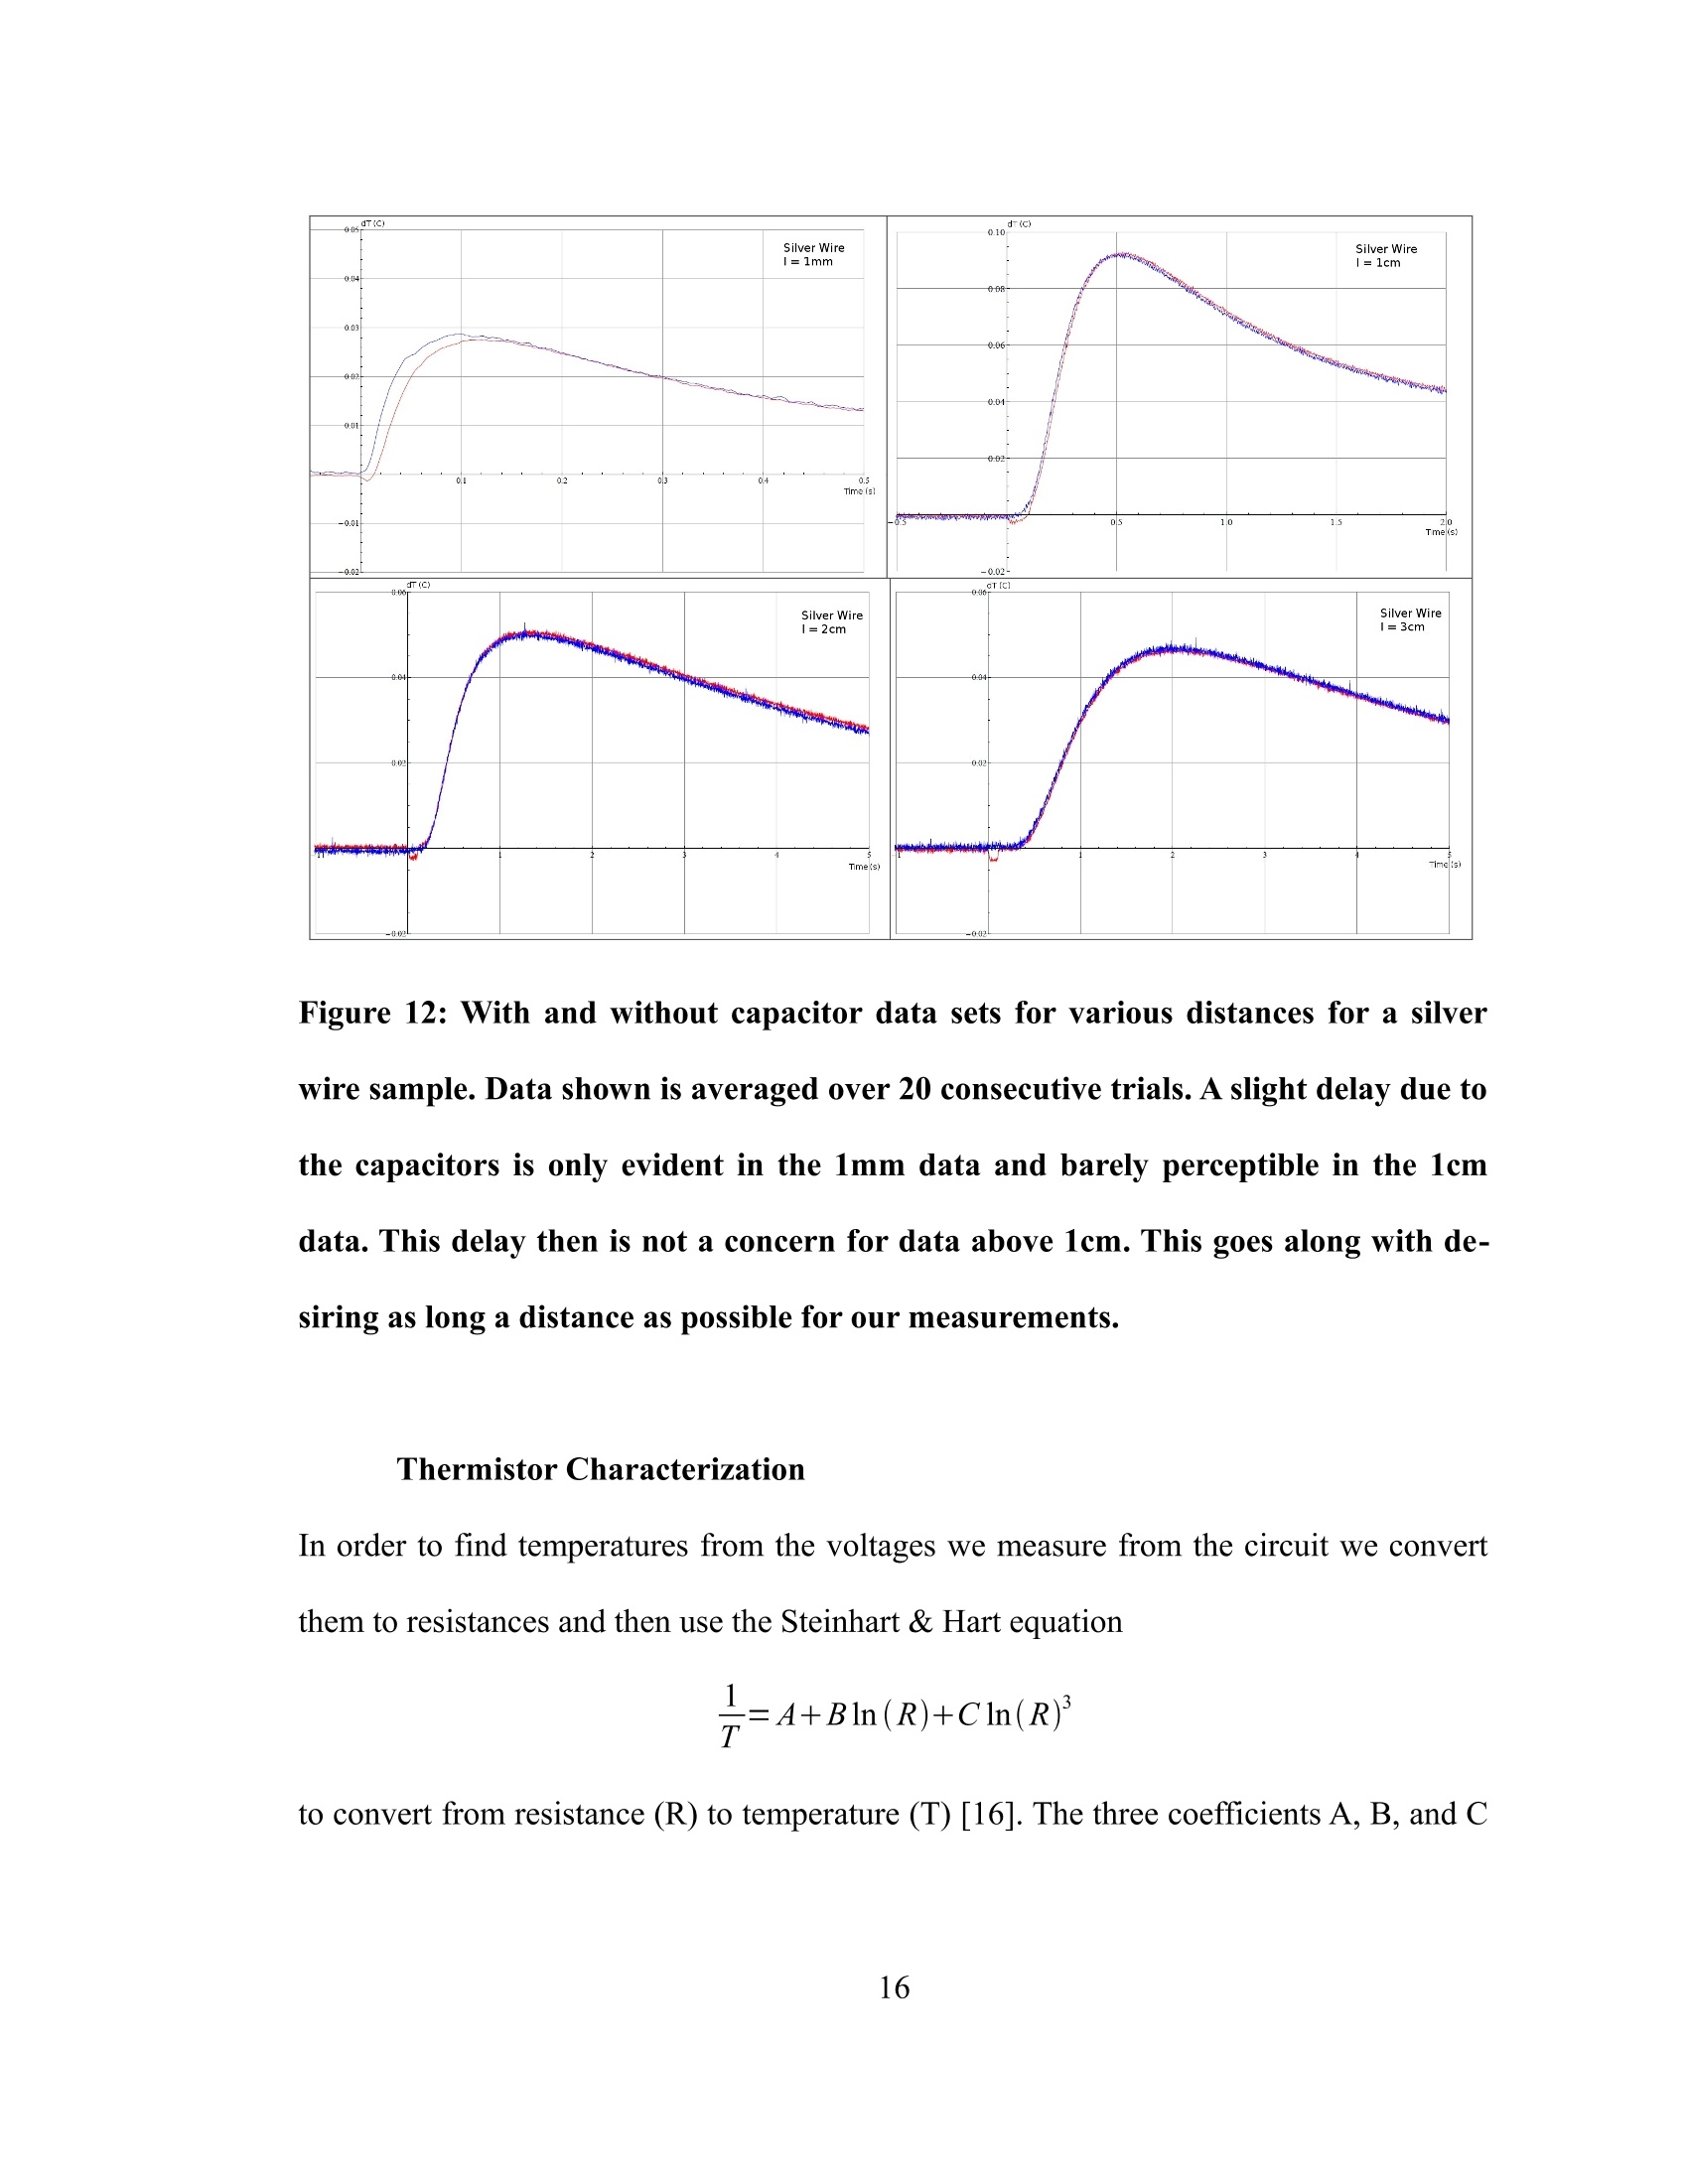
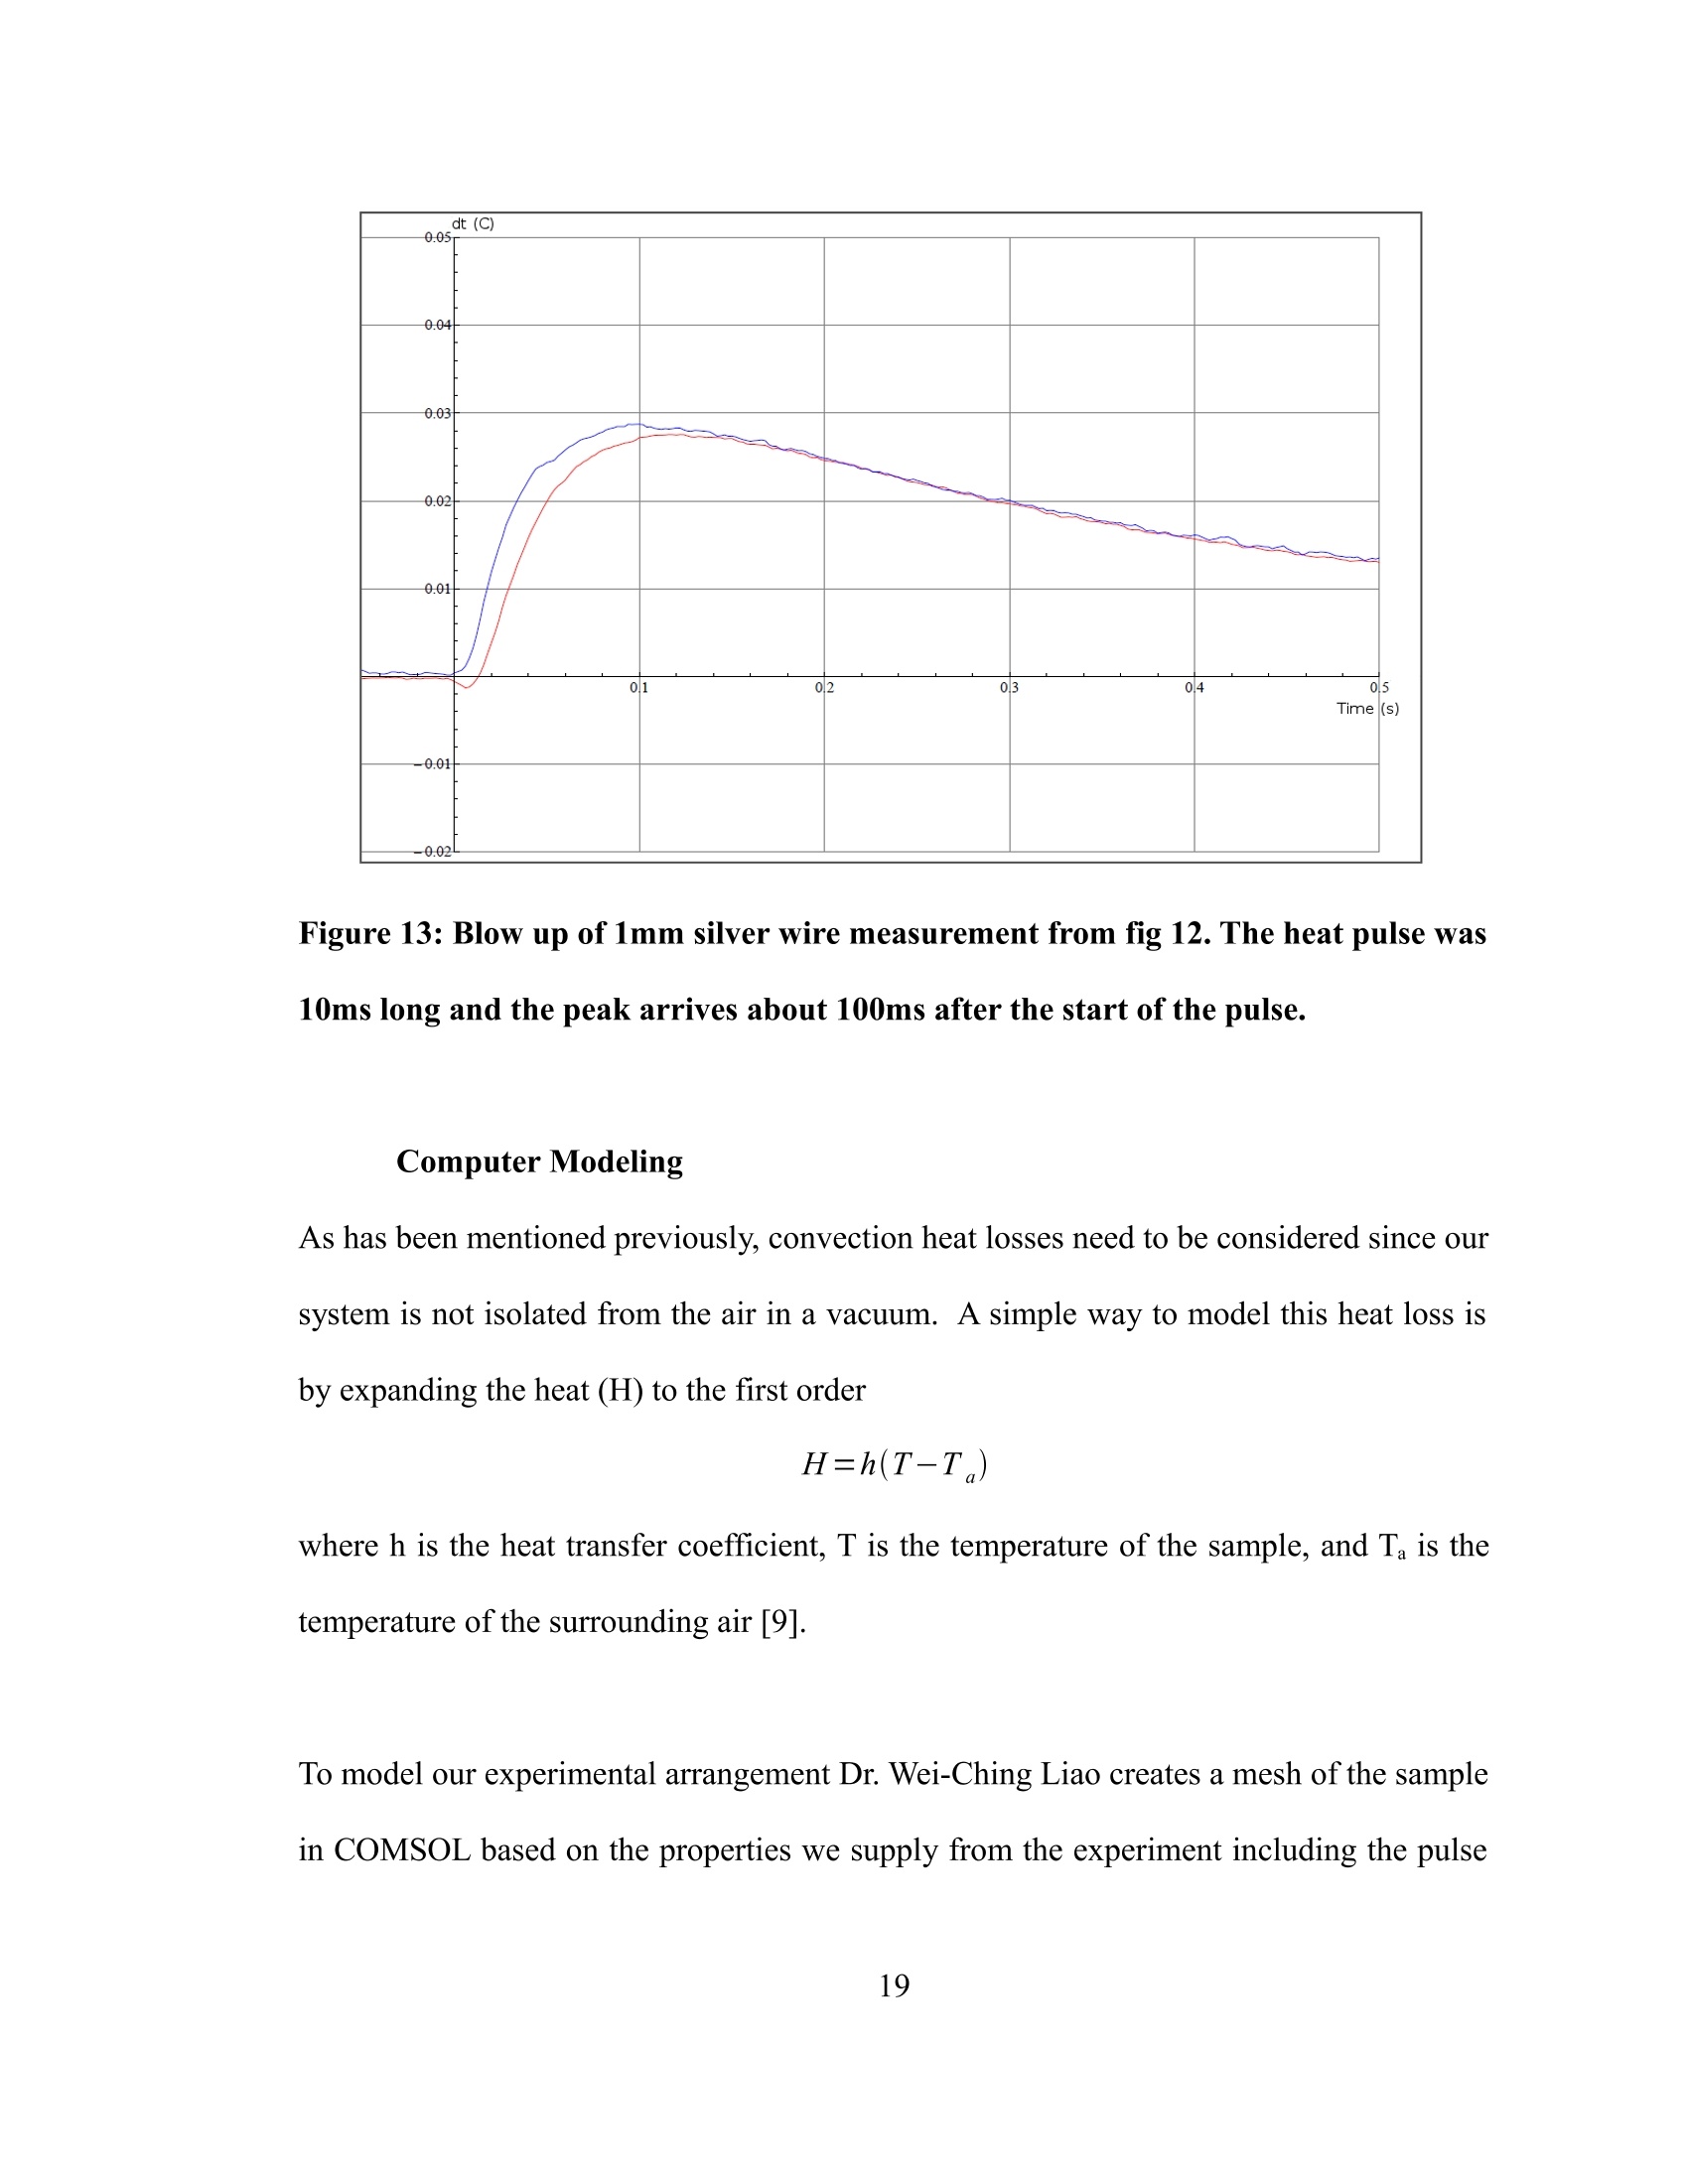
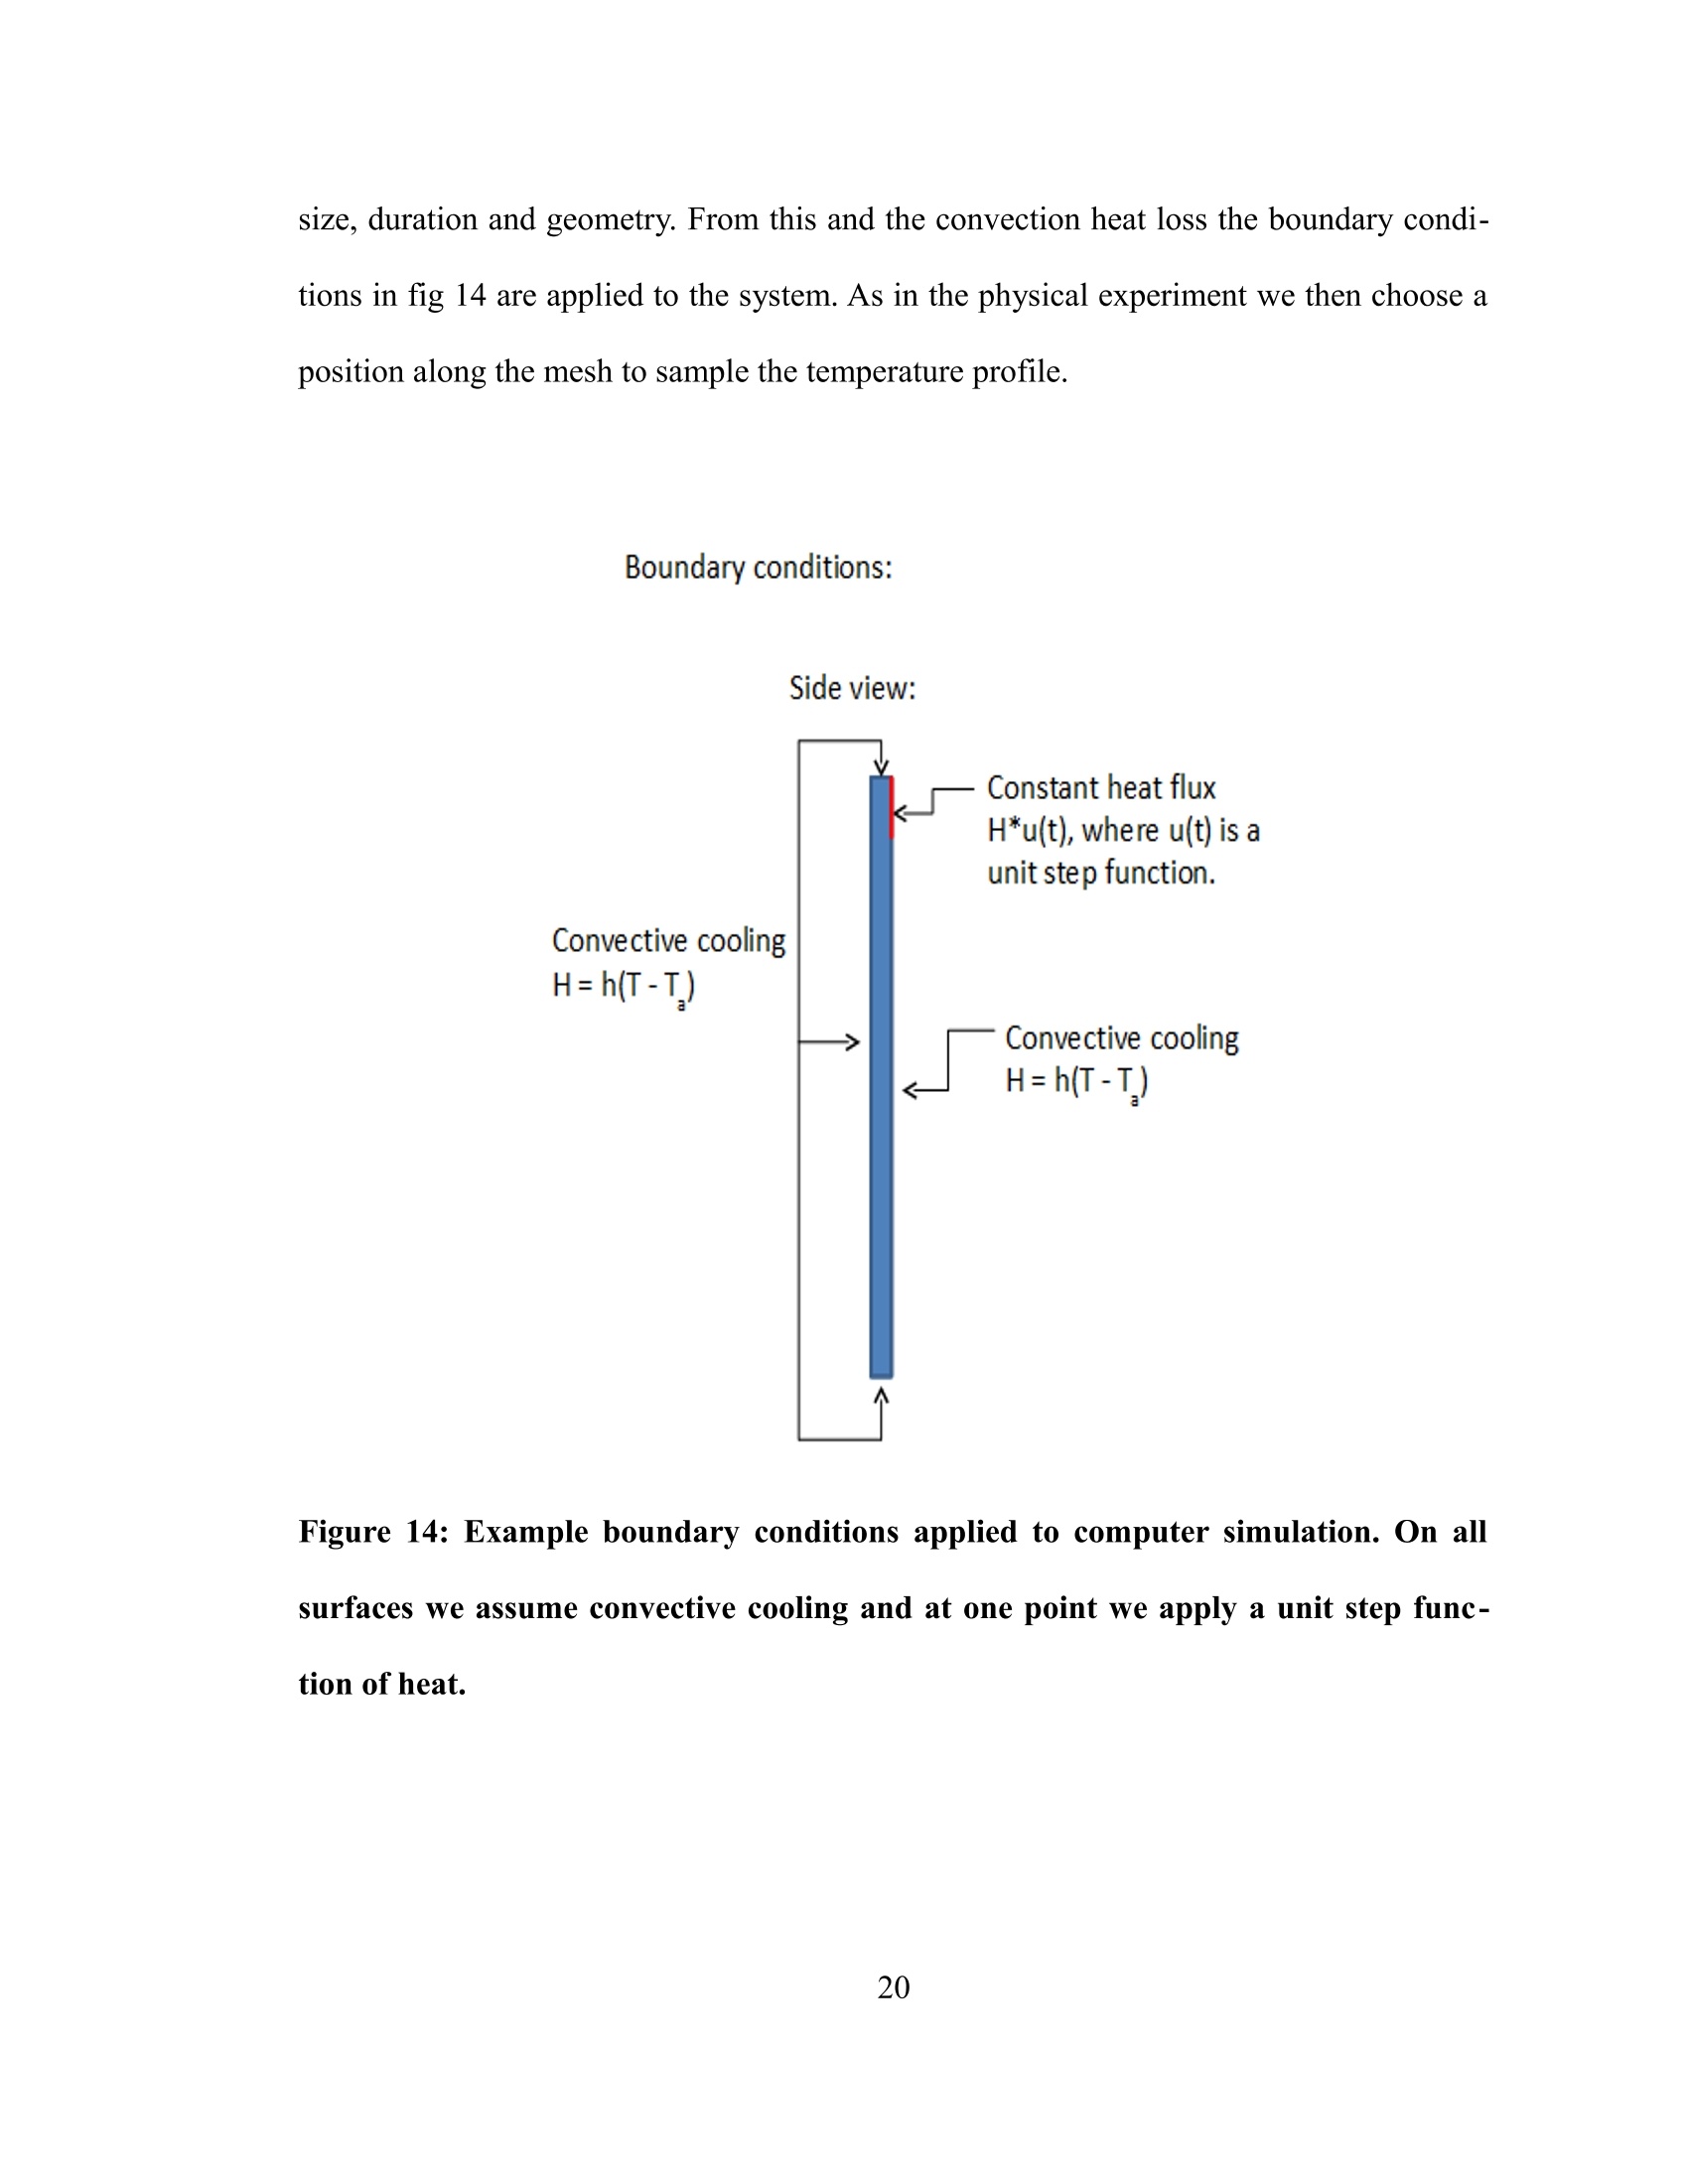
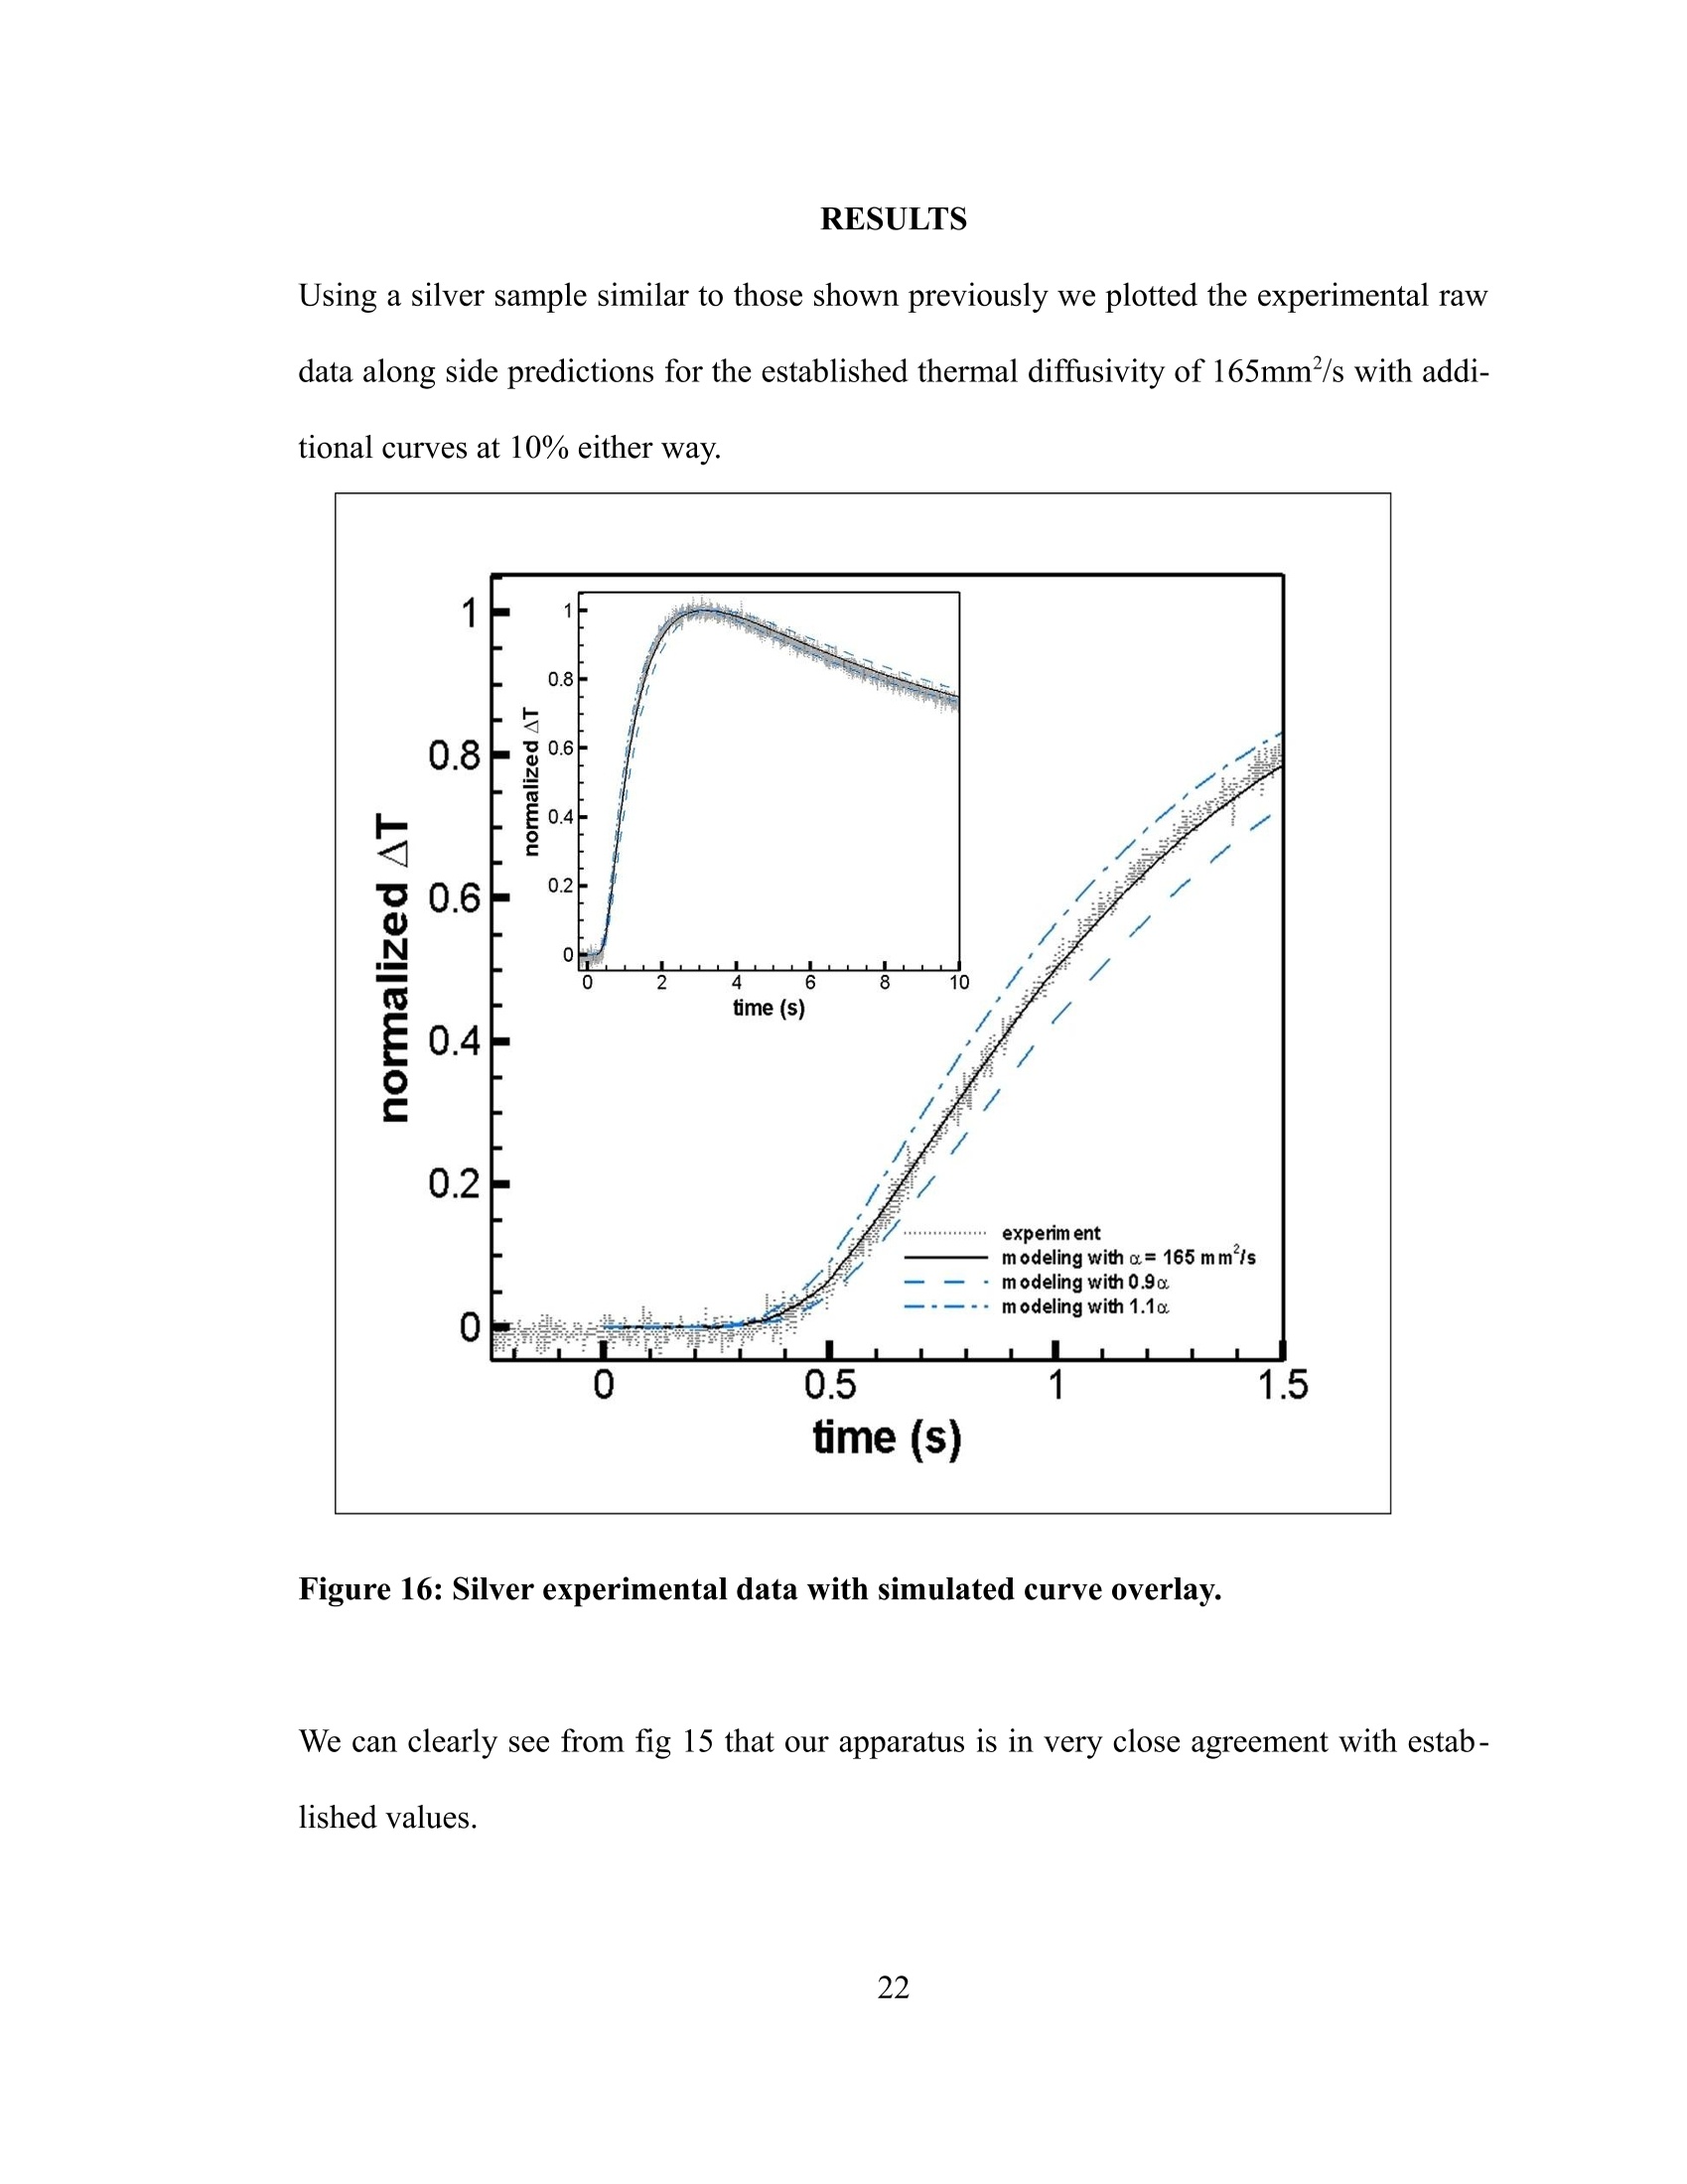
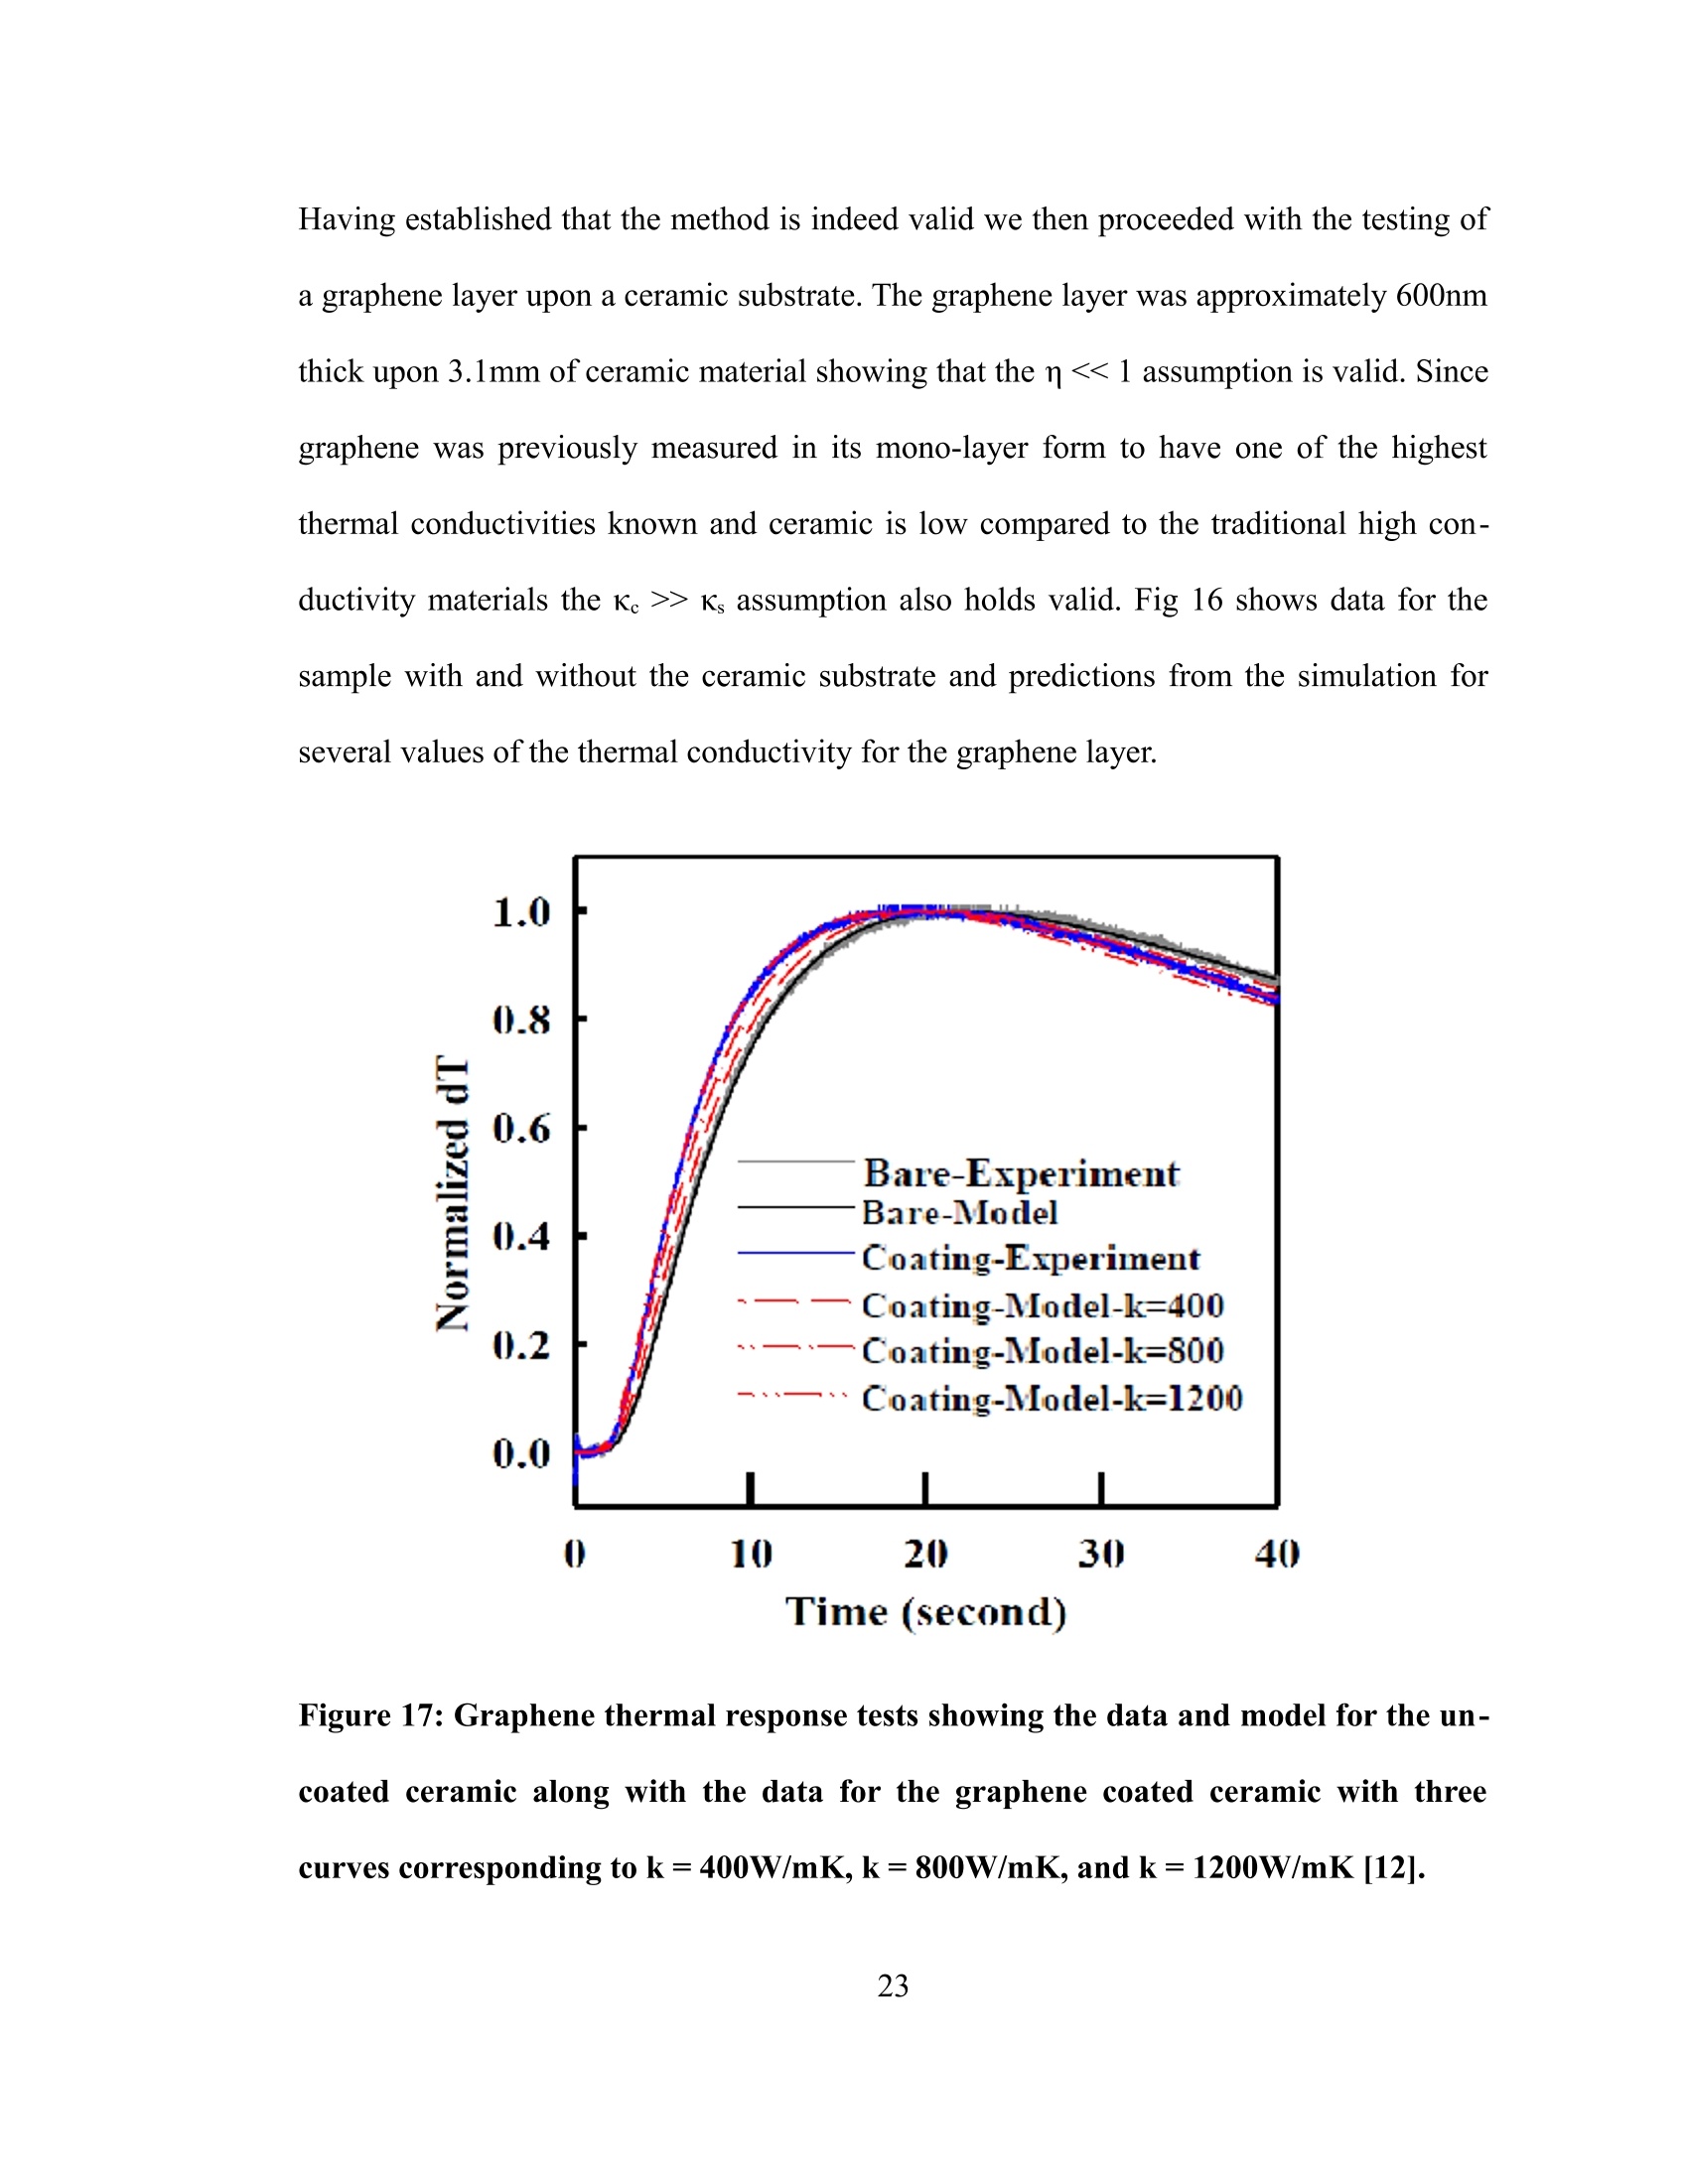
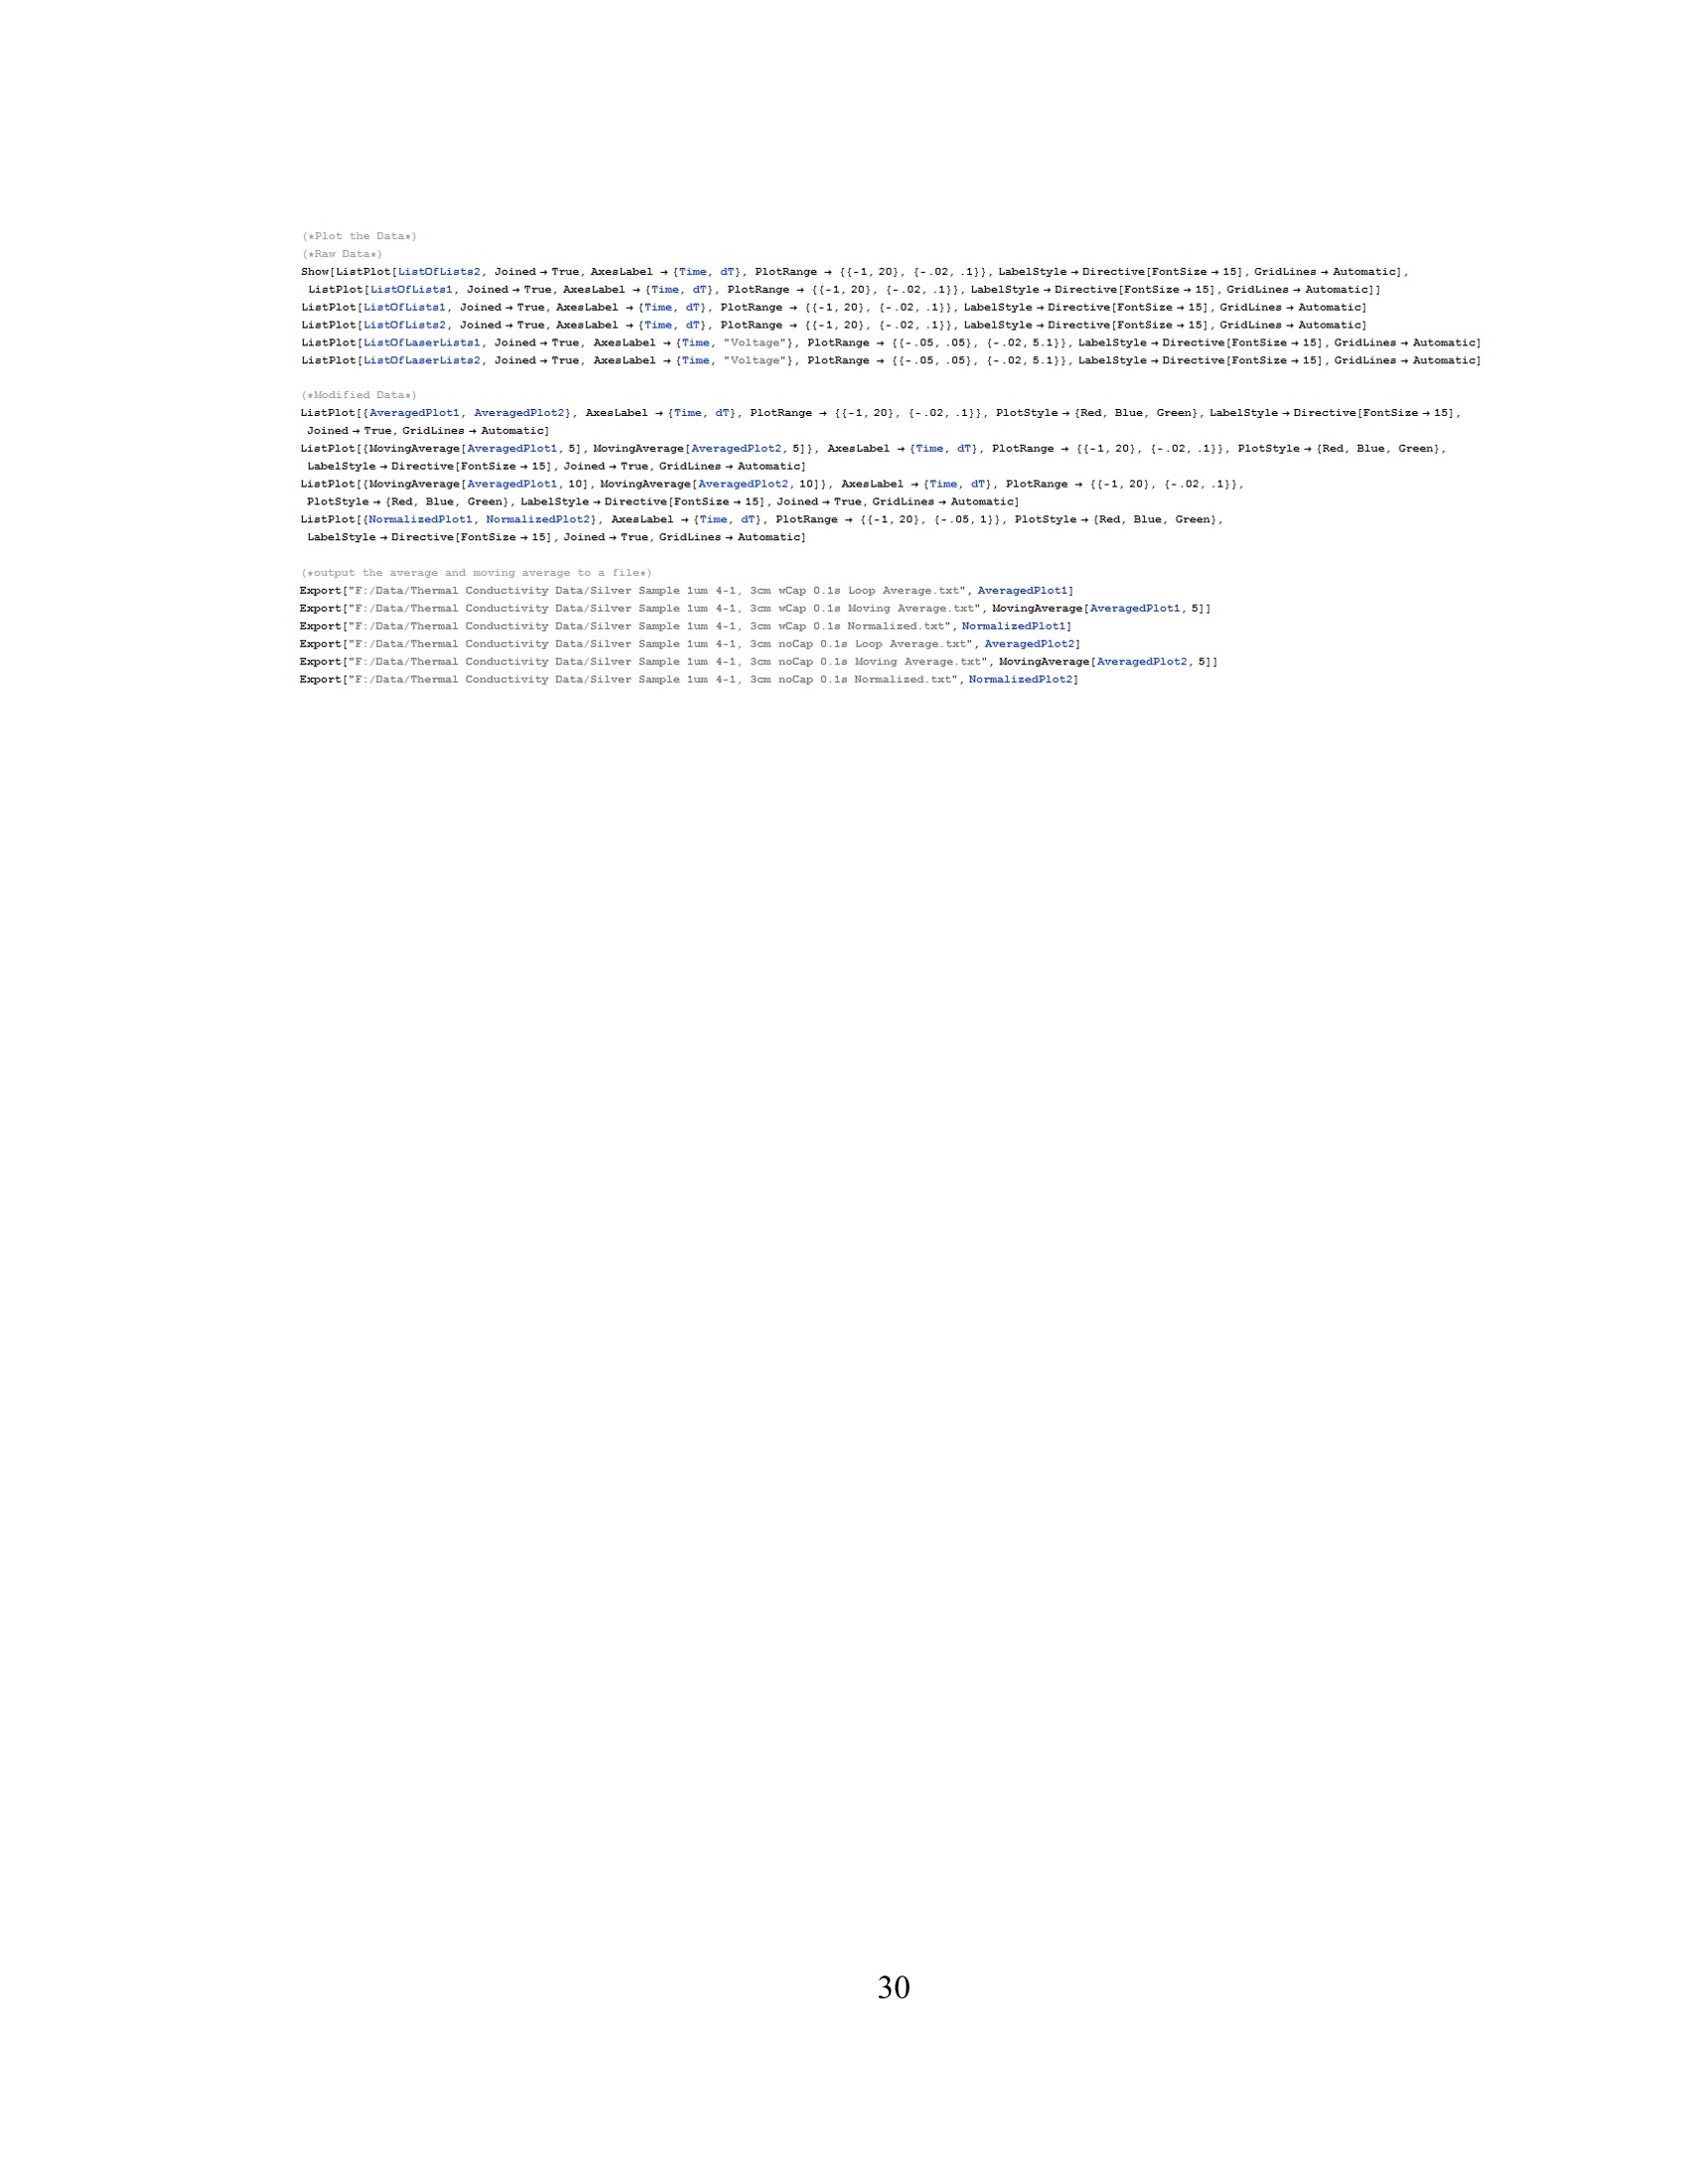
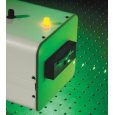
Improved Method for Measuring Thermal Diffusivity of Bulk Samples andFilms Honors Research Thesis Presented in Partial Fulfillment of the Requirements for graduation“with Honors Research Distinctionin Physics”in the undergraduate colleges of The Ohio State University By Tyler Heisler-Taylor. The Ohio State University 2013 Project Advisor: Professor Gregory Lafyatis, Department of Physics Copyright by Tyler Heisler-Taylor 2013 ABSTRACT We have developed a technique to measure the thermal diffusivity of bulk samples and films. It buildsoff of the widely used laser flash method. Basically, we measure the time interval between a lasercreated heat pulse and its arrival at a detector some distance away. In parallel with the laboratory set-upwe use computer modeling to simulate our detector’s response and account for losses due to airconvection. One advantage to our method is that we are able to accurately determine thermal diffusivitywithout needing to enclose the apparatus in a vacuum as is required with most other set-ups.Experimentally, we shine a laser pulse on a free-floating end of a long sample, the other end ofthesample is secured to a heat sink, and measure, via a thermistor, the heat pulse as it travels a welldefined distance. In our testing with a silver wire, we found our measurement to be in agreement withthe accepted value. As an important application, this method determines the thermal diffusivity for thinfilms that would otherwise be difficult to measure. As an example, we measured the thermal diffusivityof graphene films upon ceramic substrates. By combining computer modeling and a simpleexperimental procedure, we are able to efficiently and accurately determine thermal conductivities for awide variety of samples. ACKNOWLEDGEMENTS I would like to give special thanks to the L. James Lee group and NSEC for funding and providing theenvironment in which I could learn and work. I would also like to thank Dr. Kwang Kwak and Dr. Wei-Ching Liao for all their assistance and patience in this research project. Above all, I would like to thank Dr. Greg Lafyatis, my research adviser, for all his support in not onlythis and other research projects but for all the assistance he has given me in application to andpreparation for graduate school. VITA June 2008.. ...Edgerton High School, Edgerton, OHSeptember 2008 to present...... .B.S. Physics, The Ohio State University, Columbus,OH FIELDS OF STUDY Major Field: Physics and Astronomy Minor Field: Computer Information Science TABLE OF CONTENTS ABSTRACT iii ACKOWLEDGEMENTS .iv VITA ..V TABLE OF CONTENTS .V1 LIST OF FIGURES viii INTRODUCTION BACKGROUND INFORMATION: THERMAL DIFFUSIVITY.. 3 METHODS OF MEASURE .6 Flash Method .6 3ω Method .7 Raman Scattering .8 OUR METHOD:MODFIED FLASHMETHOD.. .9 Apparatus .9 Sample Preparation ..110 Circuit 15 Thermistor Characterization 16 Computer Modeling 19 RESULTS 22 CONCLUSIONS 24 REFERENCES 25 27APPENDIX 27I: LabVIEW Front Page 28II: LabVIEW Block Diagram 29III: Mathematica Program LIST OF FIGURES Figure 1: Simple model of 1-D heat flow... 3 Figure 2: Model for 1-D heat transfer on layered substrate... .5 Figure 3: Diagram of basic laser flash operation. Source: www.calce.umd.edu...... .6 Figure 4: Diagram of sample prepared for 3ω measurements. (Cahill and Pohl. 1987)... .8 Figure 5:Experimental apparatus... .110 Figure 6: Diagram of typical sample setup...... 11 Figure 7: Thermistor attached to silver wire with graphite target. 12 Figure 8: Silver suspended from heat sink with and without laser hitting 3cm target.... 12 Figure 9: Representative samples used in our apparatus... .13 Figure 10: Sample of a silver coating on a quartz substrate isolated from physical contact.. 14 Figure 11: Circuit used by apparatus.. 15 Figure 12: With and without capacitor data sets for various distances for a silver wire sample. Datashown is averaged over 20 consecutive trials. A slight delay due to the capacitors is only evident in the1mm data and barely perceptible in the 1cm data. This delay then is not a concern for data above 1cm.This goes along with desiring as long a distance as possible for our measurements.... ..16 Figure 13: Blow up of 1mm silver wire measurement from fig 12. The heat pulse was 10ms long and.the peak arrives about 100ms after the start of the pulse....... 19 Figure 14: Example boundary conditions applied to computer simulation. On all surfaces we assume.convective cooling and at one point we apply a unit step function of heat...... .20 Figure 15: Temperature curves for three different value of the heat transfer coefficient. Blue representsthe curve with no convection while the other two show two different values off by a factor of two......21 Figure 16: Silver experimental data with simulated curve overlay........ 22 Figure 17: Graphene thermal response tests showing the data and model for the uncoated ceramic alongwith the data for the graphene coated ceramic with three curves corresponding to k= 400W/mK, k=800W/mK,andk=1200W/mK.... ...223 INTRODUCTION Thermal diffusivity tells us how quickly a material will transmit or conduct heat across itsgeometry. Being able to measure this quantity accurately is then essential to find materi-als best suited for thermally sensitive technologies like heat sinks for CPUs or semi-con-ductors, blast furnace linings, or new thermal greases. Many methods to measure thermal conductivity exist and we shall cover three of thesetechniques [3][5][14].The most important for us is the flash method where an impulse ofheat is created within a sample and the temporal temperature profile is measured at anoth-er position. The thermal conductivity can then be derived. Another is the 3ω methodwhich uses AC current to generate a voltage signal in the third harmonic from whichthermal oscillations can be determined and from that the thermal properties. The thirdmethod was designed for a single atom layer of graphene and takes advantage of thestrong temperature dependence in the raman shift to measure the thermal profile. The method forming the basis of this thesis is a modification on the standard laser flashmethod. Our apparatus does not require a vacuum like most other instances of the flashmethod and greatly simplifies the experimental approach from those other techniques. Inour system we have a laser create a pulse of heat, typically 1W for 10-100ms or 0.01 to0.1 joules of energy. This pulse travels along the sample to a thermistor at an accuratelymeasured distance from the target location, which allows us to record the temperature profile over time. To allow for optimum absorption of the laser power, a spot of graphiteis painted onto the location we wish to send the flash. The thermistor's resistance dependson its temperature. We measure the resistance of the thermistor and convert that to tem-perature via LabVIEW with the DAQ computer instrument attachment. The temperaturedata is then compared to predictions from computer modeling designed for our systemfrom whence we can correct for the convection losses and find the thermal conductivity. An important experimental check on our method is to measure established values forknown materials. We measured the thermal conductivity of a silver sample with our sys-tem and found it to be in close agreement with the established value. Fig 16 shows theresults of this important check and is one of the principal results of this thesis. The theoryand the experiment for silver are shown to be in close agreement. The purpose behind developing this technique was to measure the thermal conductivity ofgraphene. Using the raman scattering method on a single atom layer of graphene, Baladinet. al. found an upper value of 5300 ± 480 W/mK which is the highest of all knownmaterials [3]. Silver, by comparison, is 429 W/mK [17]. It is then of great importance tosee if this extraordinary conductivity holds for multi-layered graphene since a single layeris inadequate to use for many purposes. Graphene tends to be difficult to layer in a suffi-cient thickness for use as a sample by itself. Instead our samples are created by the L.James Lee group using a novel technique developed by them. With a 600nm layer on a3.1mm ceramic strip we were able to measure a thermal conductivity of ~1200W/mK which is roughly that of in-plane graphite. Fig 17 shows the experimental data and therelated computer modeling [12]. This is the other principal experimental result of thisthesis. BACKGROUND INFORMATION: THERMAL DIFFUSIVITY To understand how a material transfers heat and the rate of that transfer, one must knowits thermal conductivity or thermal diffusivity. These quantities are closely linked and aredirectly proportional to each other. Their relation is defined as: where a= thermal diffusivity (m²/s), K= thermal conductivity (W/mK), c=heat capacity(J/K), and p= density (kg/m’) [2]. This relation is defined in terms of the fundamentalheat equation. To derive the heat equation, we shall consider a flux of heat traveling along a rectangularbox [6]. Figure 1: Simple model of 1-D heat flow. We take a region of that box of thickness dx and volume dV into which heat H+dH isflowing in and heat H is flowing out. The box has a height oft and a width of z whichmakes up the cross sectional area A. The first relation we need to consider is the heatflux. SH ASt=c pdV ST=cpztoxT Next we need to consider the conductivity of the sample. If we relate these two, we find the heat equation and the definition of the thermal diffus-ivity. ,tz Since the main motivation for this work is to measure the thermal properties of a thin filmon a much thicker substrate to the extent that the total thickness of the sample is muchthinner than that of the length we are measuring along we will need to calculate for sucha system. For this layered substrate, our system looks slightly different. Figure 2: Model for 1-D heat transfer on layered substrate. This will cause some differences in our heat flux equations. 8xX Where subscript c indicates values for the coating and subscript s indicates those for thesubstrate.For the conductivity relation: Combining these together to get our heat equation and our new effective diffusivity. 8T If we make the assumptions that the thickness of the coating is much less than the totalthickness (n <<1) and that the conductivity of the substrate is much less than that of the coating(K, <>Ks assumption also holds valid. Fig 16 shows data for thesample with and without the ceramic substrate and predictions from the simulation forseveral values of the thermal conductivity for the graphene layer. Figure 17: Graphene thermal response tests showing the data and model for the un-coated ceramic along with the data for the graphene coated ceramic with threecurves corresponding to k=400W/mK,k=800W/mK,andk=1200W/mK [12]. We can see that the 1200W/mK curve fits the closest to the experimental data allowing usto determine the graphene has a thermal conductivity of approximately 1200W/mK.Slightly higher than that of in-plane graphite which has a conductivity of approximately1000W/mK [1]. CONCLUSION We have shown that the laser method combined with computer modeling can accuratelymeasure thermal properties without the use of a vacuum or the cumbersome apparatii ofolder techniques. A final end-all test of the system with a sample measured inside andoutside a vacuum chamber is currently in progress. The graphene measurements appearto agree with other measurements done on few-layer graphene samples. Specifically themeasurement of~1300W/mKon a four layer sample by Ghosh et. Al [10]. There are ways in which the apparatus could be improved. For instance, we could replacethe physical contact detector with an IR sensor to measure the temperature profilewithout needing to account for the thermistor response. Without having to go through thedifficulty of attaching the thermistor to the sample, preparation would become signific-antly easier, but at the same time new complications would arise from the more complextool. In the end we present a viable method for measuring thermal properties that is easyto construct, simple to operate, and more economic than most alternatives. REFERENCES 1) Alofi, A., and G. P. Srivastava. "Thermal conductivity of graphene and graphite."Physical Review B. no.11 (2013). 2) Ash, J., J. Baldwin, J. Hirt, and A. Lance. "Heat Conductions." presentation, ViginiaTech University,http://www.math.vt.edu/people/gao/class _home/Presentations/heatconduction.ppt 3) Balandin, A. A., S. Ghosh, W. Bao, I. Calizo, D. Teweldebrhan, F. Miao, and C. N.Lau."Superior Thermal Conductivity of Single-Layer Graphene." Nano Letters.no.3 (2008): 902-907. 4) Corbino, O.M. "Measurement of specific heats of metals at high temperatures." Attidella Reale Accademia Nazionale dei Lincei. (1912): 181-188. 5) Cahill,D. G., and R. O. Pohl."Thermal conductivity of amorphous solids above theplateau." Physical Review B. no. 8 (1987): 4067-4073. 6) Cahill, David G. "Measurement of thermal conductivity." lecture. Univeristy of Illinoisat Urbana-Champaign, http://users.mrl.uiuc.edu/cahill/thermal_school09.pdf. 7) Center for Advanced Life Cycle Engineering,"Details about Property Measurements."http://www.calce.umd.edu/TSFA/laser_flash/details.htm. 8) de Koninck, David. Thermal conductivity measurements using the 3-omega technique:application to power harvesting microsystems. Masters thesis, McGill University,2008. 9) Engineers Edge, "Convection Review-Heat Transfer." http://www.engineersedge.-com/heat transfer/convection.htm. 10) Ghosh, S., et. al. "Extremely high thermal conductivity of graphene: Prospects forthermal management applications in nanoelectronic circuits al transport in few-layer graphene." Applied Physics Letters. no. 15 (2008). 11) Ghosh, S., W. Bao, D. L. Nika, S. Subrina, E. P. Pokatilov, C. N. Lau, and A. A. Bal-andin. "Dimensional crossover of thermal transport in few-layer graphene."Nature. (2010):555-558. 12) Huang, Wenyi, et al."Carbide-Bonded Graphene Coating." Sumitted for publication.. 13) Lasever, "LSR1064-NL 100~1200mW IR lasers." http://www.lasever.com/produc-title.asp-id=1381.htm. 14) Parker, W.J., R. J. Jenkins, C. P. Butler, and G. L. Abbott. "Flash method of determ-ining thermal diffusivity, heat capacity, and thermal conductivity." Journal ofAp-plied Physics. no. 9 (1961): 1679. 15) Personal Communication with Dr. Gregory Lafyatis. 16) Steinhart, J.S., and S. R. Hart. "Calibration curves for thermistors." Deep-Sea Re-search. no.4 (1968): 497-503. 17) Stewart,Dr. Doug. Chemicool,"Silver Element Facts." Last modified 2013.http://www.chemicool.com/elements/silver.html. 18) Vozar, L., and W. Hohenauer. "Flash method of measuring the thermal diffusivity. Areview." High Temperatures -High Pressures. no. 3 (2003/2007):253-264. APPENDIXⅡ: LabVIEW Block Diagram APPENDIX III: Mathematica Program (*Data Se 1* (* Get the all the information stored within the info file*] ifo=ReadList["F:/Data/Thermal Conductivity Data/Silver Sample 1um, 3cm with Cap .1s Pulae, 5V 4-1-13 info.txt", Word, RecordLists +True, WordSeparatora+{""}]; Reaistance= ToExpression[ininfo[[1]][[2]]];Current = ToExpression[ininfo[[1]][[4]]]; PulgeTime==ToExpresaion[ininfo[[1]][[7]1]; Voltagee:= ToExpreasion[ininfo[[1]][[9]]]; Rate= ToExpression[ininfo[[1]][[11]]];InitialWaitTime = ToExpreasion[ininfo[[1]][[15]]] a=ToExpression[ininfo[[1]][[17]]];b== ToExpression[ininfo[[1]][[19]]]; c=ToExpression[ininfo[[1]][[21]]]; MeasurementTime=ToExpreasion[ininfo[[1]][[24]]]; If[Length[ininfo[[1]]]> 24, Loops=ToExpression[ininfo[[1]][[26]]],Loops = 20];OneRunLength= Rate * (MeaaurementTime + InitialWaitTime + PulseTime); LaaerStartPosition= {Rate *InitialWaitTime}; (*Get the data from the data file for plotting manipulation* intablea1=ReadList["F:/Data/Thermal Conductivity Data/Silver Sample 1um, 3cm with Cap .1s Pulse, 5V 4-1-13.txt",Word, RecordLists+True, WordSeparators+{"\t"}]; Ttable1 = Transpose[intablea1]; AbaoluteTempLiat= ToExpreasion[Ttable1[[1]]]; TempDiffLiat= ToExpreasion[Ttable1[[2]]]; LaserOutLiat= ToExpression[Ttable1[[3]]]; TimeList= ToExpression[Ttable1[[4]]]; AbaoluteTempLiats= Partition[AbaoluteTempLiat, Length[AbaoluteTempLiat]/Loopa]; TempDiffLiata=Partition[TempDifEfList, Length[TempDiffLiat]/Loops];LaserOutLista= Partition[LaserOutList, Length[LaserOutList]/Loopa]; TimeLiats= Partition[TimeList, Length[TimeList]/Loops]; For[i= 1, ii Loopa,i++,AppendTo[LaserStartPosition, 1+Length[TakeWhile[LaserOutLista[[i]], # 24, Loopa =ToExpreasion[ininfo[[1]][[26]]1, Loops =20]; OneRunLength= Rate* (MeasurementTime + InitialWaitTime+ PulseTime);LaserStartPosition= {Rate w InitialWaitTime}; ( (*Get the data from the data file for plotting manipulationw ) intablea1=ReadList["E:/Data/Thermal Conductivity Data/Silver Sample 1um, 3cm no Cap .1s Pulse, 5V 4-1-13.txt", Word, RecordLists+True, WordSeparatora+{"\t"}]; Ttable1 = Tranapose[intablea1]; AbaoluteTempLiat=TToExpreasion[Ttable1[[1]]]; TempDiEfList=ToExpreasion[Ttable1[[2]]]; LaserOutList = ToExpression[Ttable1[[3]]]; TimeLiat = ToExpression[Ttable1[[4]]]; AbaoluteTempLiata=Partition[AbaoluteTempLiat, Length[AbaoluteTempList]/Loops]; TempDiffLiata=Partition[TempDiEEList, Length[TempDiEfLiat]/Loopa];LaserOutLiata=Partition[LaserOutList, Length[LaserOutLiat]/Loops]; TimeLiats = Partition[TimeLiat,Length[TimeList]/Loopa]; For[i= 1, i <=Loopa, i++, AppendTo[LaserStartPoaition,1 +Length[TakeWhile[LaserOutLista[[i]],#
确定


还剩36页未读,是否继续阅读?

产品配置单
上海依阳实业有限公司为您提供《采用改进型激光脉冲法测量块状和薄膜材料的热扩散率》,该方案主要用于薄膜材料中检测,参考标准--,《采用改进型激光脉冲法测量块状和薄膜材料的热扩散率》用到的仪器有超短脉冲闪光法薄膜热性能测定仪
相关方案
更多
该厂商其他方案
更多