


方案详情
文
在采用激光脉冲法进行测试时,如果被测试样太薄,测试得到的热扩散率数据会存在较大误差。在这种情况下,由激光触发脉冲所引起的不可避免的尖峰与试样背面温升之间会产生相互影响,数据采集会记录下这两种信号的重叠,采用系统的标准算法则会低估被测试样的热扩散率。因此,这种脉冲尖峰与背温响应叠加的不正确计算处理是目前研究的趋势。同时,本文介绍了如何采用一种计算方法转换和修正较薄试样相应的热扩散率测量值。
方案详情

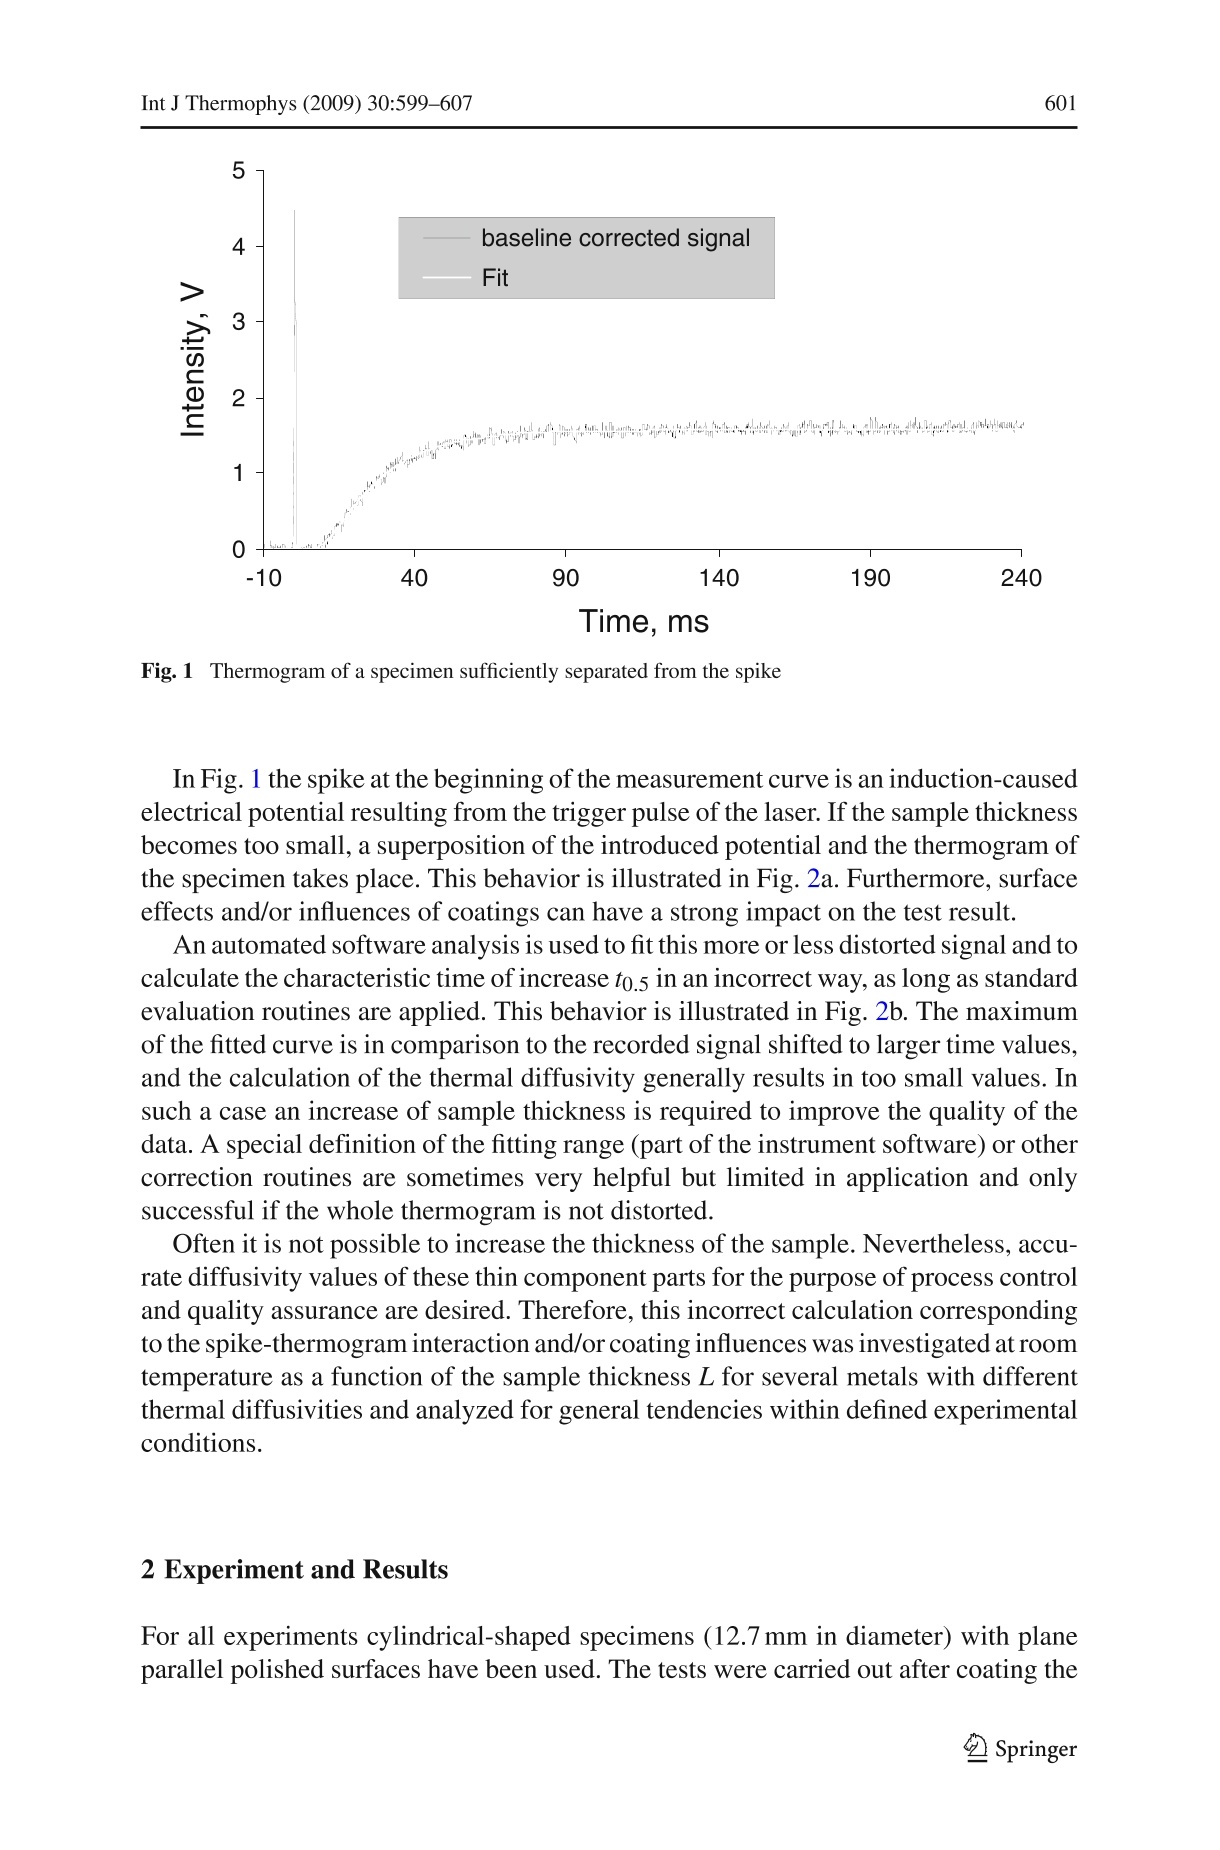
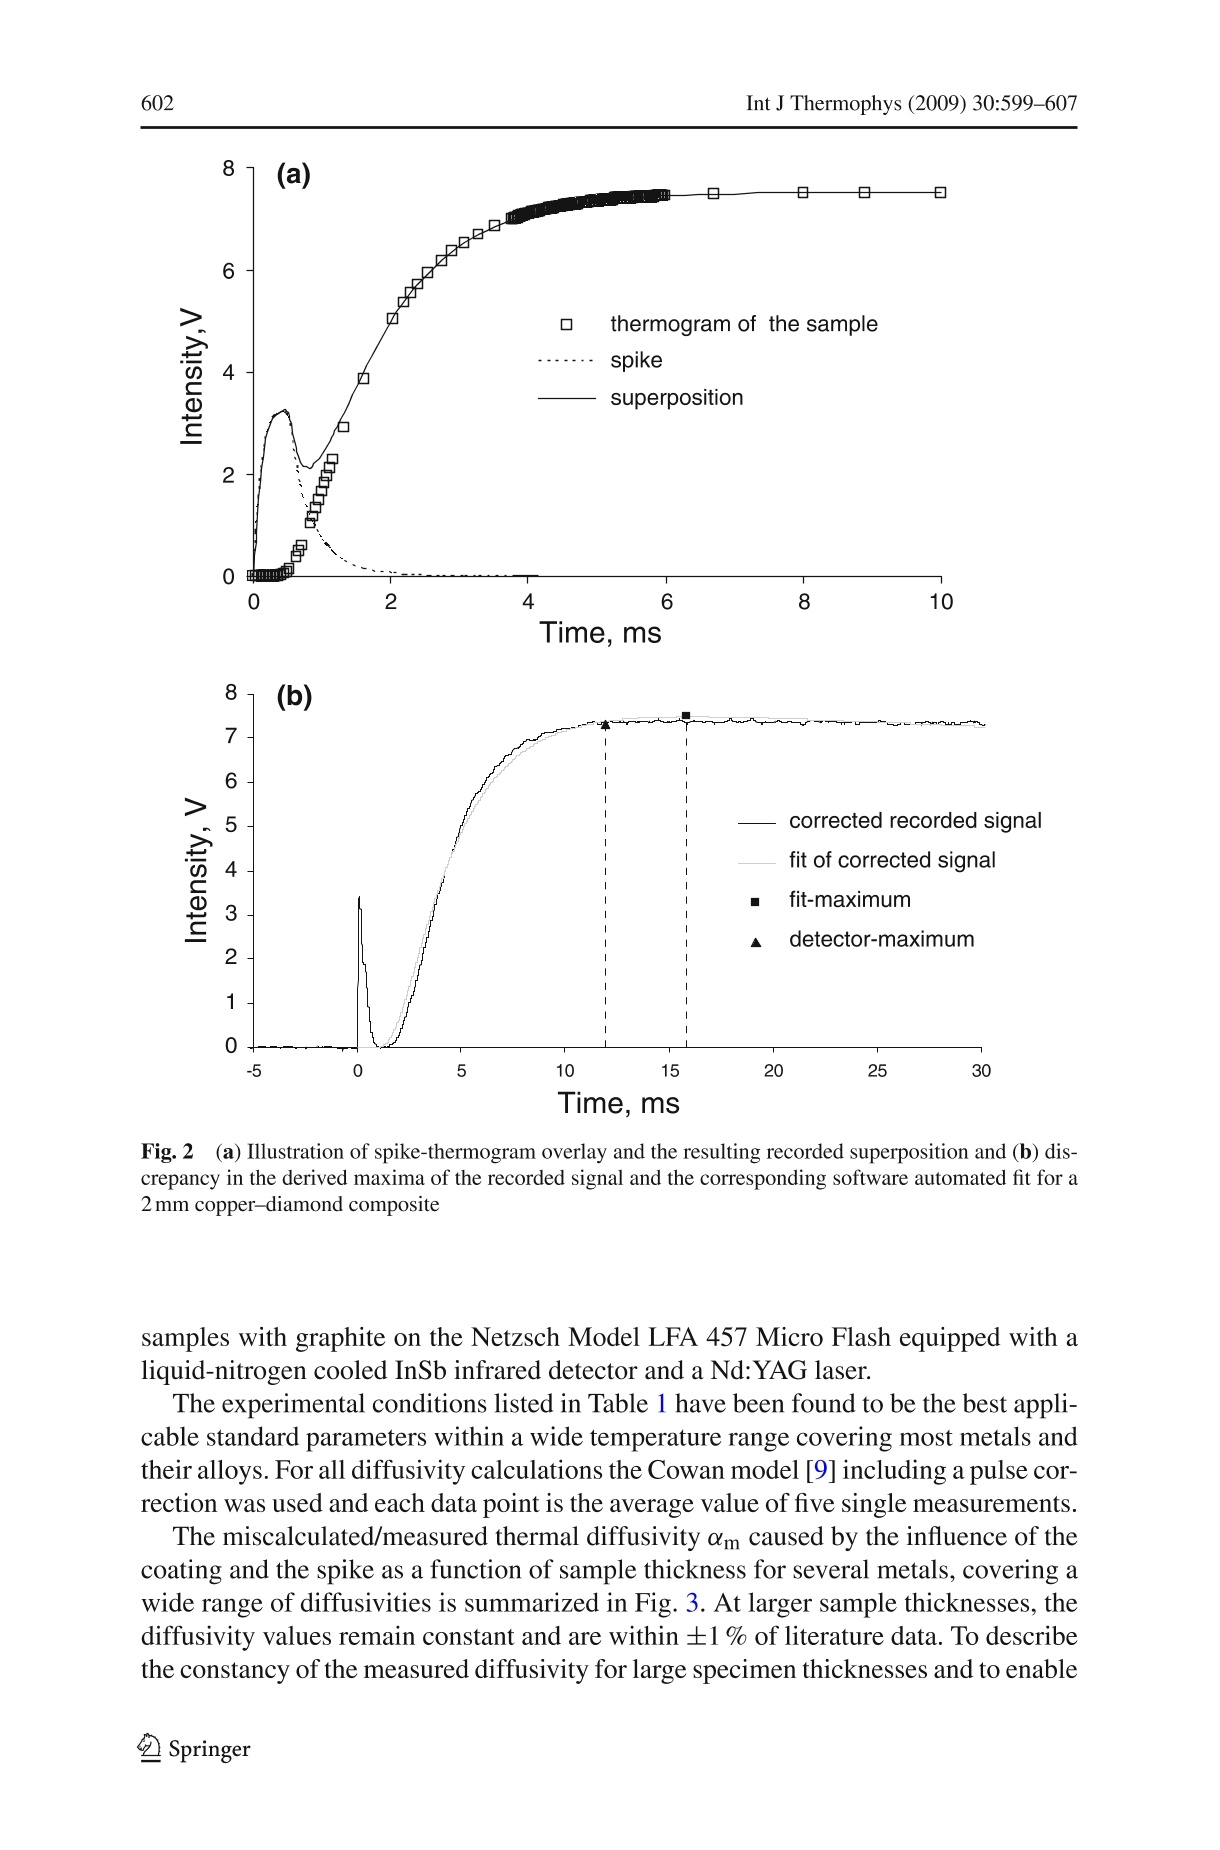
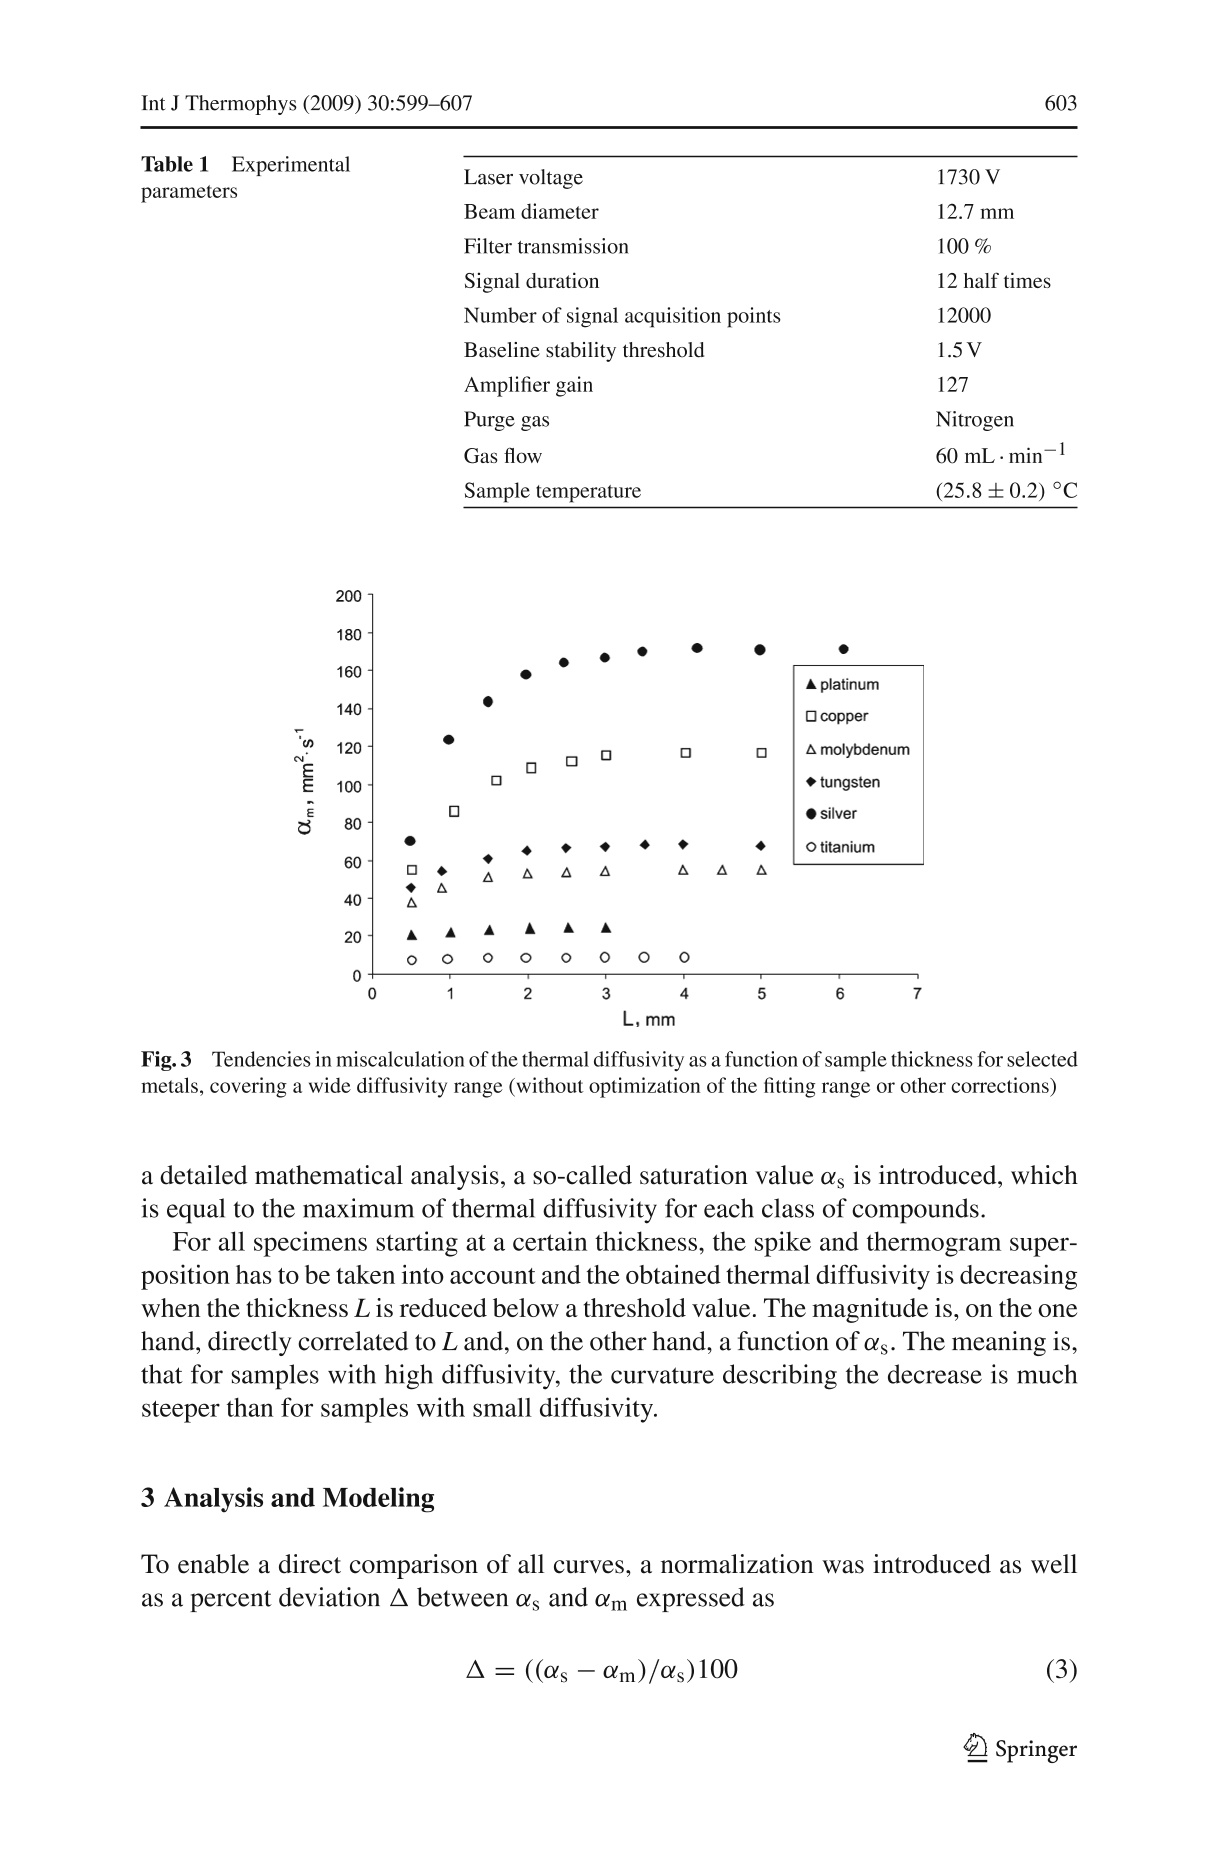
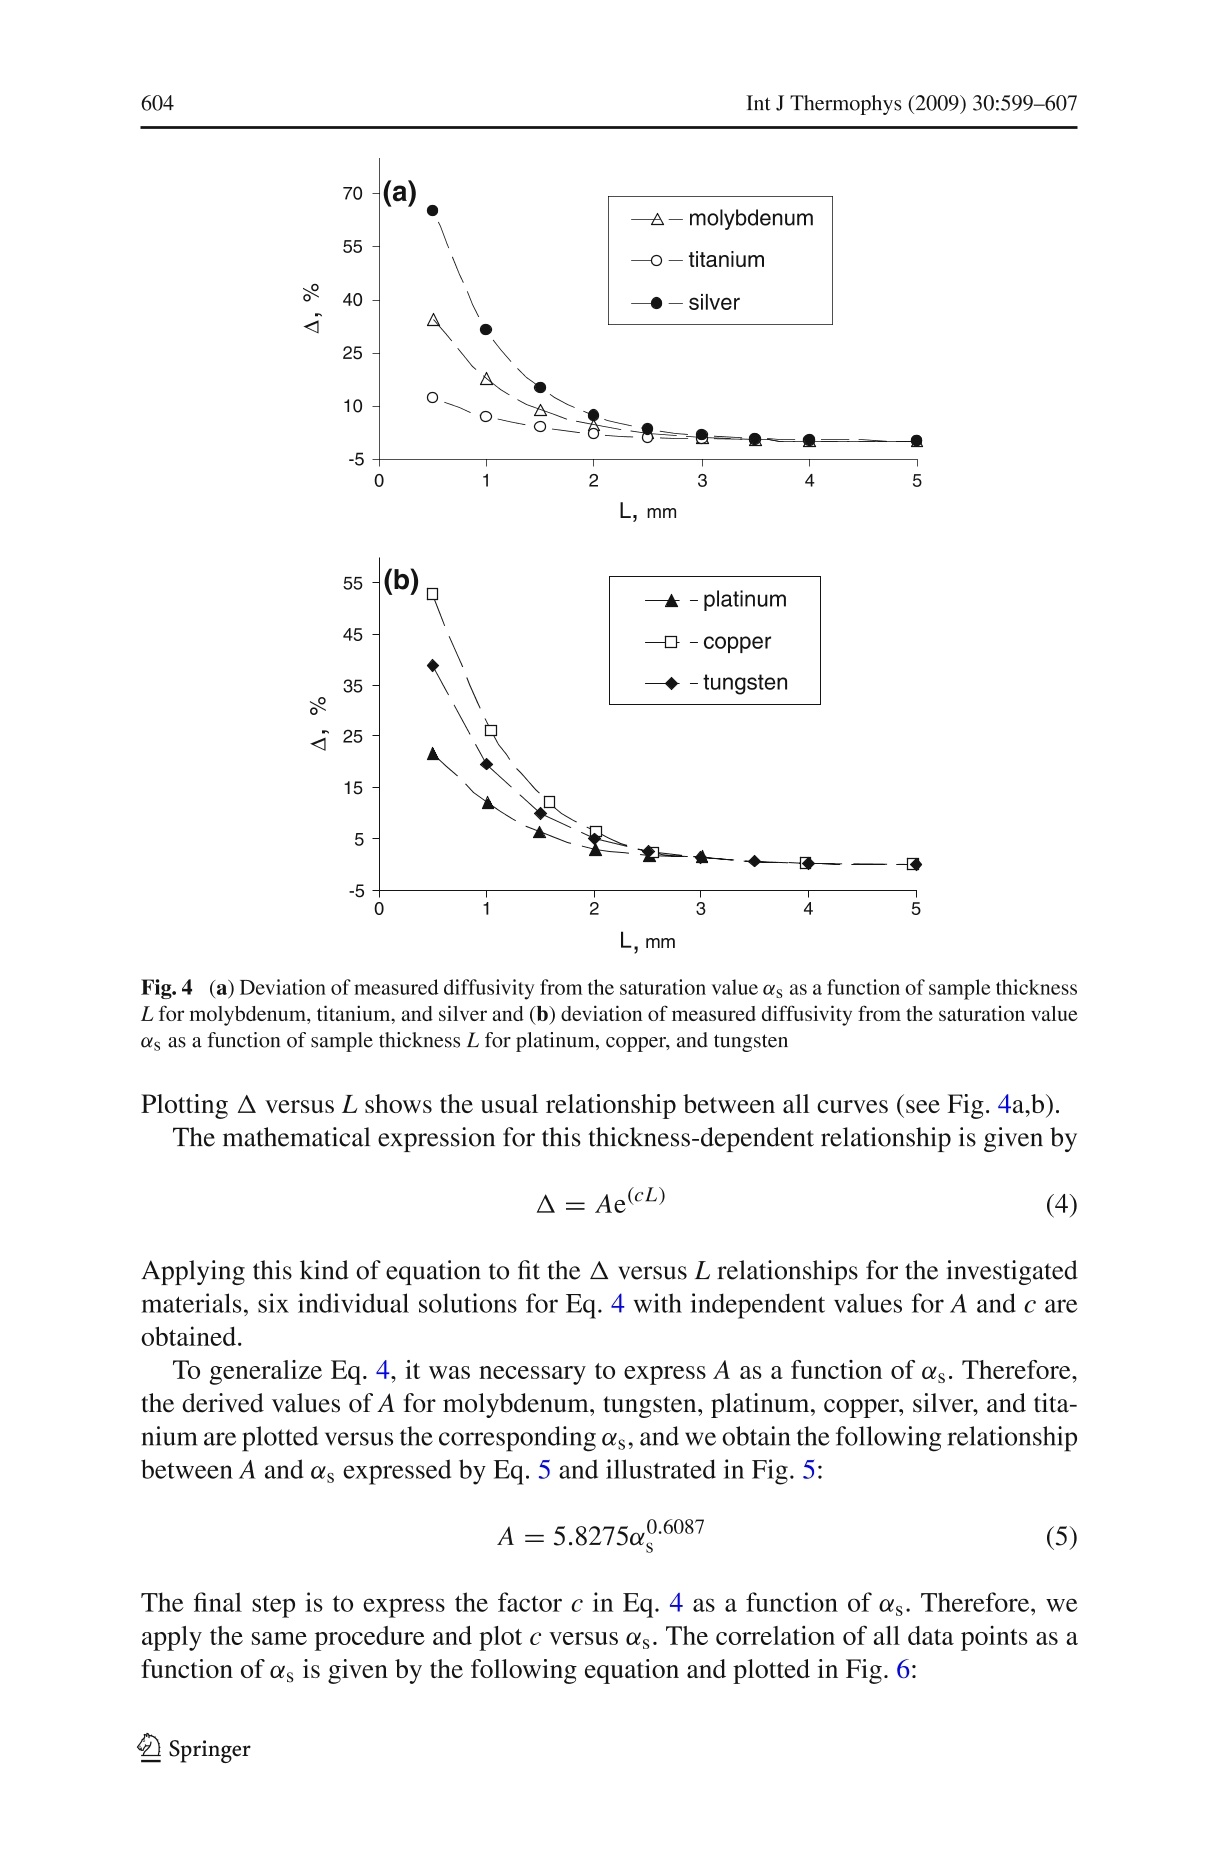
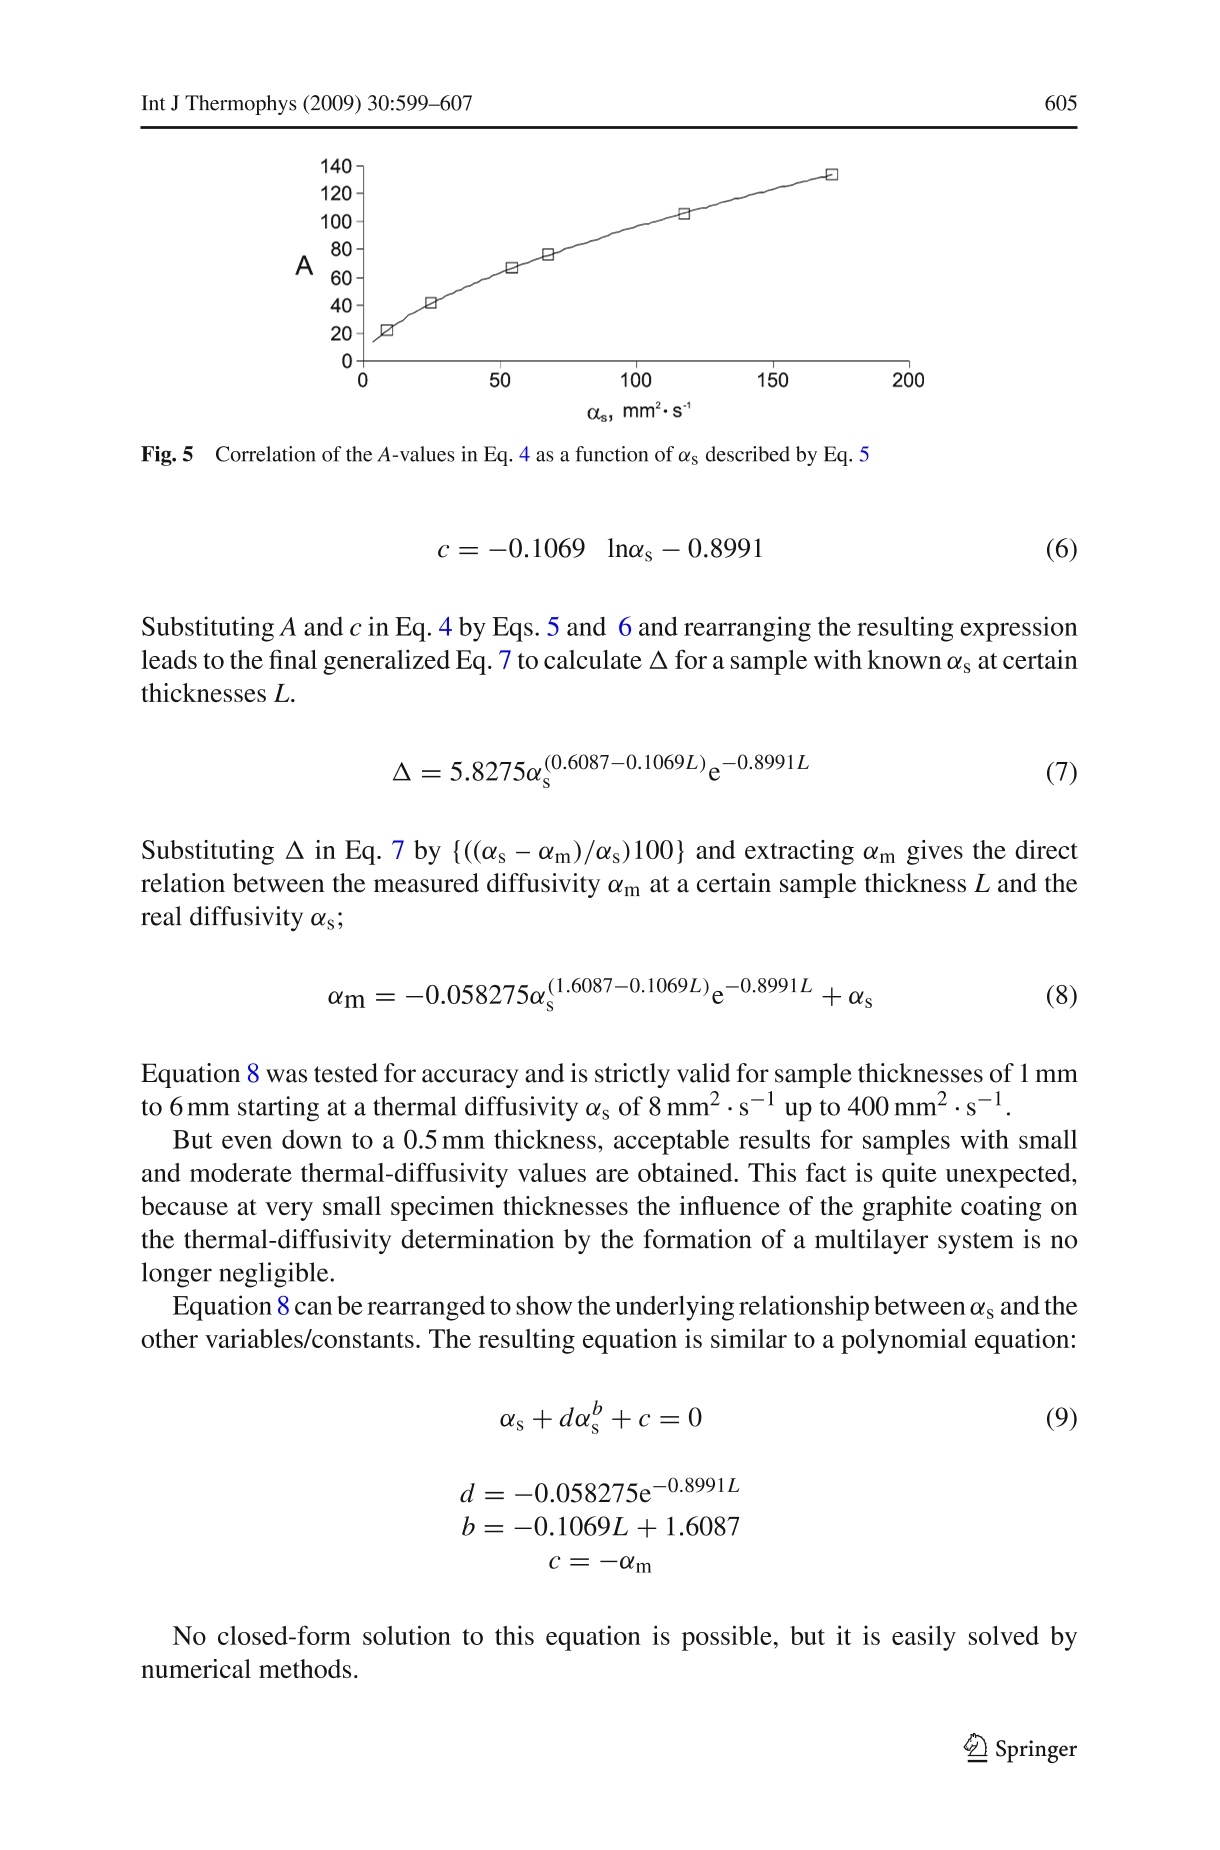
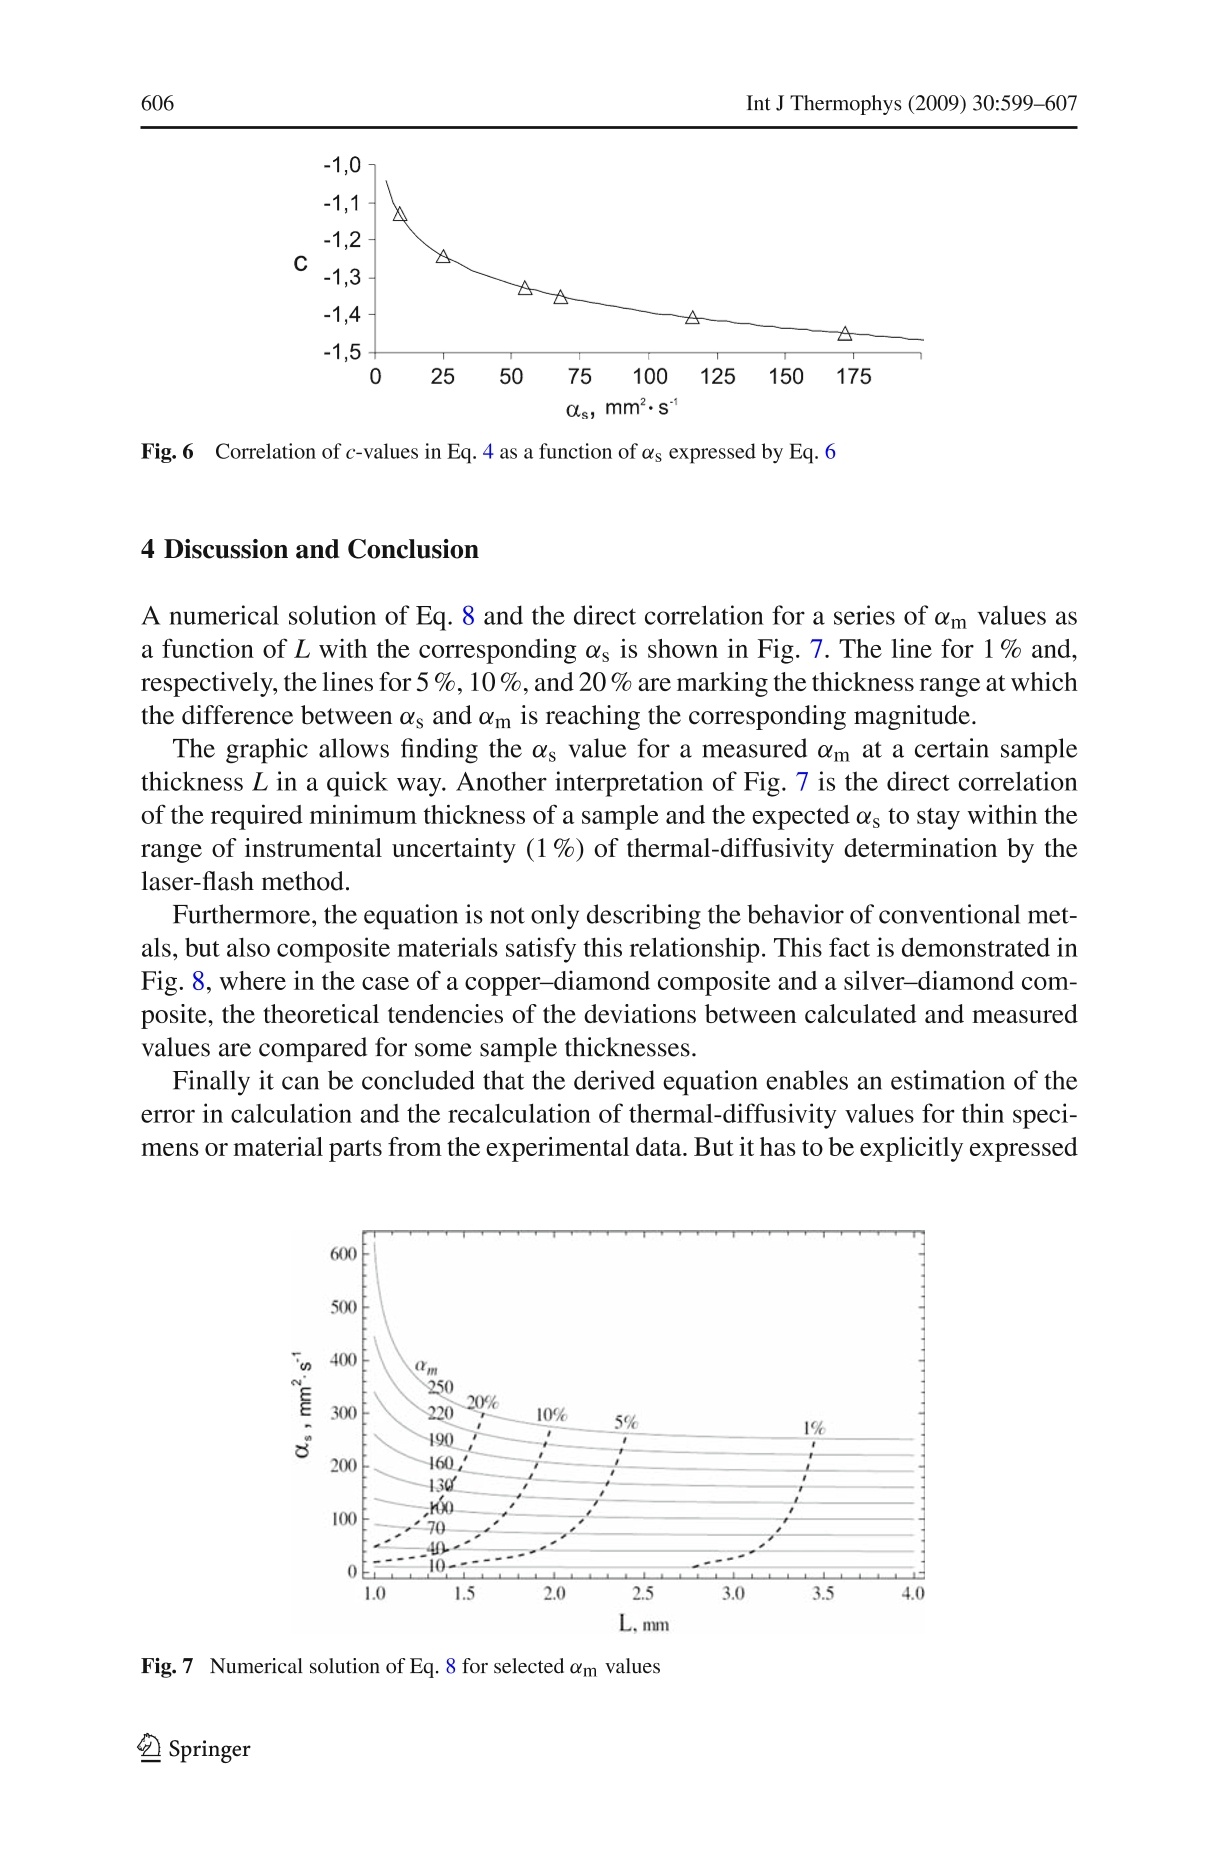
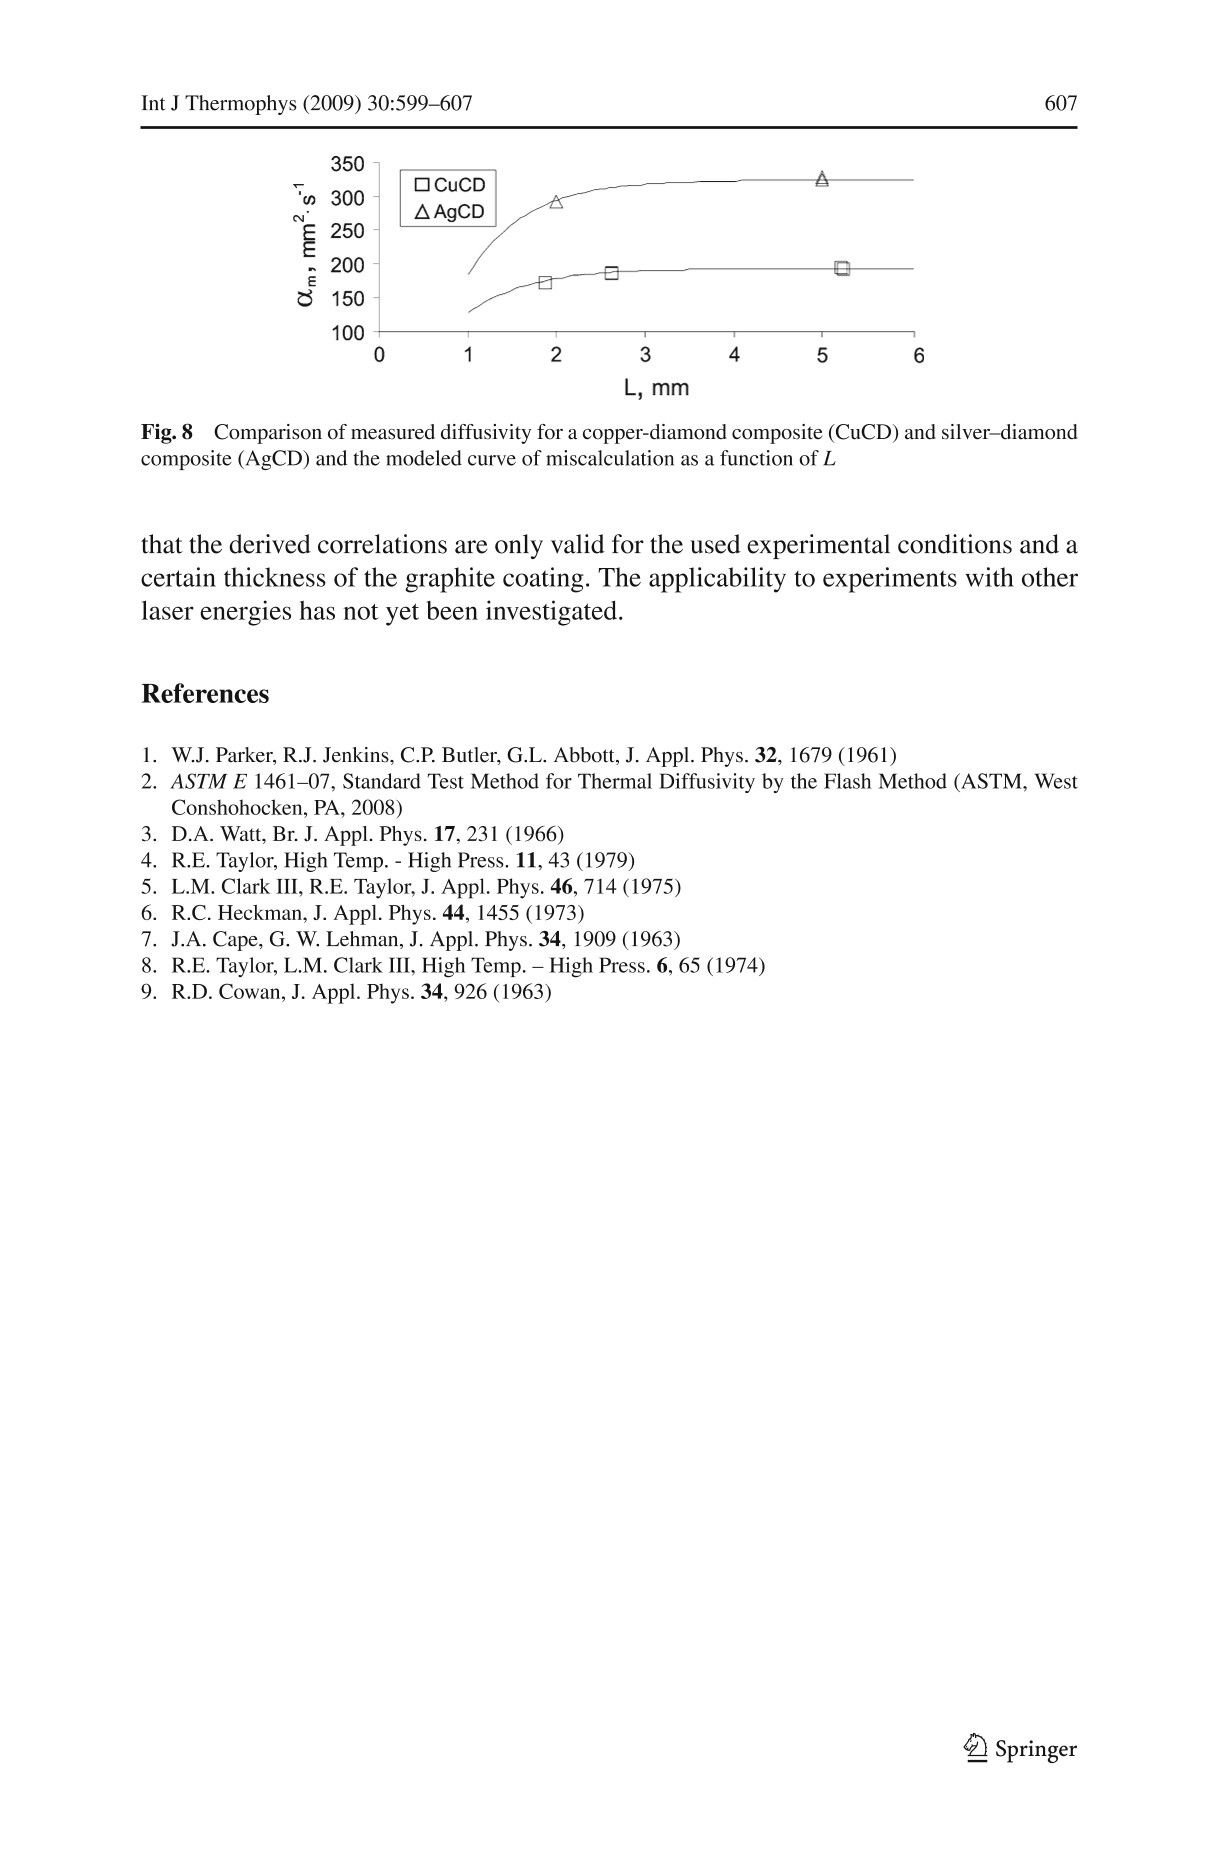
Int J Thermophys (2009) 30:599-607DOI 10.1007/s10765-009-0561-y Int J Thermophys (2009)30:599-607600 Evaluation of the Thermal Diffusivity of ThinSpecimens from Laser Flash Data Peter Schoderbock.Hermann Klocker .Lorenz S. Sigl·Gernot Seeber Received: 25 July 2008 / Accepted: 14 January 2009/Published online: 31 January 2009O Springer Science+Business Media, LLC 2009 Abstract Thermal-diffusivity data obtained by a pulse technique are substantially inerror if the sample thickness becomes too small. In this case the inevitable spike causedby the trigger pulse for the laser and the thermogram of the specimen are interacting,and a superposition of both signals is recorded, whose evaluation with standard algo-rithms systematically underestimates the thermal diffusivity of materials. Therefore,this incorrect calculation corresponding to the spike-thermogram overlay was investi-gated for general tendencies, and a calculation method transferring the experimentaldata obtained for small thicknesses into representative thermal diffusivity values forthe investigated material will be introduced. Keywords Laser flash· Pulse technique· Sample thickness· Spike-thermogramoverlay . Thermal diffusivity Nomenclature to.5 Characteristic time of increase, ms s Saturation value of thermal diffusivity in mm²s-1 == the maximum ofmeasured/calculated diffusivity for each class of compounds0lm Measured/calculated diffusivity at given L, mm2s-1Deviation of om from αs,%L Sample thickness,mmTInitial sample temperature,CTmax Maximum of temperature rise on the backside of the sample, C ( P. Schoderbock (区)· H. K locker· L. S . Sigl ·G . Seeber ) ( Plansee SE, I nnovation Services, 6600 Reutte, Austria ) ( e-mail: peter.schoderboeck@plansee.com ) 1 Introduction The flash method [1] has been established as the standard test method for the determi-nation of the thermal diffusivity and is used to measure values of the thermal diffusivityof a variety of solid materials [2] over a large temperature range [3,4]. The method canbe considered as an absolute method of measurement, since no reference standardsare required. In the laser-flash method, alaser pulse is used as a heating source to introduce a high-intensity short duration energy pulse on the front side of a small disc-shaped specimen.The introduced heat spreads over the whole sample, and an infrared detector or anyother device, which provides a linear electrical signal proportional to the temperaturerise, detects the increase of temperature on the backside. The signal is recorded as afunction of time starting at the initial temperature T. Competing with thermal diffusionthrough the material heat loss by radiation [5], convection and surface effects occur,causing the measured temperature to pass typically through a maximum(Tmax). Thismaximum is used for the determination of the characteristic time of increase to.5 [1],at which the intensity of the signal has reached half of its maximum value. where to.s is the characteristic time of increase. The thermal diffusivity a for a samplethickness L is calculated as follows: Exact algorithms are used to fit the derived signal and to correct for a finite pulse widthand loss of heat. Various procedures of correction are given in [6-8]. These algorithmsare used to solve very complex numerical equations and result in the final formula forthe time of increase to.5, which is valid when the detector signal has reached theprescribed relative height of the maximum. Modern flash equipment such as the LFA 457 Micro Flash, equipped with a Nd: YAGlaser and a liquid-nitrogen cooled InSb infrared detector provided by Netzsch Gerate-bau GmbH, fulfil all technical requirements. The obtained thermograms are fitted automatically and solved for to.5 by the deter-mination of the maximum and minimum in relation to the baseline implementing pulsecorrection, different heat transfer models, and radial heat loss corrections. Nevertheless, the thermal-diffusivity data obtained by this laser-flash method aresubstantially in error if the sample thickness becomes too small and/or significantcoating thicknesses are applied. The optimum specimen thickness depends on themagnitude of the estimated thermal diffusivity and should be chosen so that the timeto reach the maximum temperature is in the range between 20 ms and 200 ms [2] (seeFig.1). This means that specimens should always be thick enough to be a representativefor the test material and that too small sample thicknesses can be a source of errorespecially in the measurement of highly conducting materials. Fig. 1 Thermogram of a specimen sufficiently separated from the spike In Fig. 1 the spike at the beginning of the measurement curve is an induction-causedelectrical potential resulting from the trigger pulse of the laser. If the sample thicknessbecomes too small, a superposition of the introduced potential and the thermogram ofthe specimen takes place. This behavior is illustrated in Fig. 2a. Furthermore, surfaceeffects and/or influences of coatings can have a strong impact on the test result. An automated software analysis is used to fit this more or less distorted signal and tocalculate the characteristic time of increase to.5 in an incorrect way, as long as standardevaluation routines are applied. This behavior is illustrated in Fig. 2b. The maximumof the fitted curve is in comparison to the recorded signal shifted to larger time values,and the calculation of the thermal diffusivity generally results in too small values. Insuch a case an increase of sample thickness is required to improve the quality of thedata. A special definition of the fitting range (part of the instrument software) or othercorrection routines are sometimes very helpful but limited in application and onlysuccessful if the whole thermogram is not distorted. Often it is not possible to increase the thickness of the sample. Nevertheless, accu-rate diffusivity values of these thin component parts for the purpose of process controland quality assurance are desired. Therefore, this incorrect calculation correspondingto the spike-thermogram interaction and/or coating influences was investigated at roomtemperature as a function of the sample thickness L for several metals with differentthermal diffusivities and analyzed for general tendencies within defined experimentalconditions. 2 Experiment and Results For all experiments cylindrical-shaped specimens (12.7 mm in diameter) with planeparallel polished surfaces have been used. The tests were carried out after coating the 8 (a) -日- - 8 (b) Fig.2 (a) Illustration of spike-thermogram overlay and the resulting recorded superposition and (b) dis-crepancy in the derived maxima of the recorded signal and the corresponding software automated fit for a2 mm copper-diamond composite samples with graphite on the Netzsch Model LFA 457 Micro Flash equipped with aliquid-nitrogen cooled InSb infrared detector and a Nd: YAG laser. The experimental conditions listed in Table 1 have been found to be the best appli-cable standard parameters within a wide temperature range covering most metals andtheir alloys. For all diffusivity calculations the Cowan model [9] including a pulse cor-rection was used and each data point is the average value of five single measurements. The miscalculated/measured thermal diffusivity &m caused by the influence of thecoating and the spike as a function of sample thickness for several metals, covering awide range of diffusivities is summarized in Fig. 3. At larger sample thicknesses, thediffusivity values remain constant and are within ±1 % of literature data. To describethe constancy of the measured diffusivity for large specimen thicknesses and to enable Table 1 Experimentalparameters Laser voltage 1730 V Beam diameter 12.7 mm Filter transmission 100% Signal duration 12 half times Number of signal acquisition points 12000 Baseline stability threshold 1.5V Amplifier gain 127 Purge gas Nitrogen Gas flow 60 mL·min- Sample temperature (25.8±0.2) °C Fig. 33Tendencies in miscalculation of the thermal diffusivity as a function of sample thickness for selectedmetals, covering a wide diffusivity range (without optimization of the fitting range or other corrections) a detailed mathematical analysis, a so-called saturation value as is introduced, whichis equal to the maximum of thermal diffusivity for each class of compounds. For all specimens starting at a certain thickness, the spike and thermogram super-position has to be taken into account and the obtained thermal diffusivity is decreasingwhen the thickness L is reduced below a threshold value. The magnitude is, on the onehand, directly correlated to L and, on the other hand, a function of os. The meaning is,that for samples with high diffusivity, the curvature describing the decrease is muchsteeper than for samples with small diffusivity. 3 Analysis and Modeling To enable a direct comparison of all curves, a normalization was introduced as wellas a percent deviation ▲ between os and om expressed as Fig.44(a) Deviation of measured diffusivity from the saturation value ds as a function of sample thicknessL for molybdenum, titanium, and silver and (b) deviation of measured diffusivity from the saturation valueas as a function of sample thickness L for platinum, copper, and tungsten Plotting A versus L shows the usual relationship between all curves (see Fig. 4a,b).The mathematical expression for this thickness-dependent relationship is given by Applying this kind of equation to fit the A versus L relationships for the investigatedmaterials, six individual solutions for Eq. 4 with independent values for A and c areObtained. To generalize Eq. 4, it was necessary to express A as a function of as. Therefore,the derived values of A for molybdenum, tungsten, platinum, copper, silver, and tita-nium are plotted versus the corresponding as, and we obtain the following relationshipbetween A and as expressed by Eq. 5 and illustrated in Fig.5: The final step is to express the factor c in Eq. 4 as a function of as. Therefore, weapply the same procedure and plot c versus as. The correlation of all data points as afunction of os is given by the following equation and plotted in Fig. 6: 200 Fig.5 Correlation of the A-values in Eq. 4 as a function of os described by Eq. 5 Substituting A and c in Eq. 4 by Eqs. 5 and 6 and rearranging the resulting expressionleads to the final generalized Eq. 7 to calculate ▲ for a sample with known os at certainthicknesses L. Substituting A in Eq. 7 by {((ds -一m)/s)100} and extracting m gives the directrelation between the measured diffusivity om at a certain sample thickness L and thereal diffusivity ds, Equation 8 was tested for accuracy and is strictly valid for sample thicknesses of 1 mmto 6mm starting at a thermal diffusivity as of 8 mm².s-l up to 400 mm²s-1. But even down to a 0.5 mm thickness, acceptable results for samples with smalland moderate thermal-diffusivity values are obtained. This fact is quite unexpected,because at very small specimen thicknesses the influence of the graphite coating onthe thermal-diffusivity determination by the formation ofa multilayer system is nolonger negligible. Equation 8 can be rearranged to show the underlying relationship between os and theother variables/constants. The resulting equation is similar to a polynomial equation: No closed-form solution to this equation is possible, but it is easily solved bynumerical methods. Fig.6 Correlation of c-values in Eq. 4 as a function of os expressed by Eq.6 4 Discussion and Conclusion A numerical solution of Eq. 8 and the direct correlation for a series ofam values asa function ofL with the corresponding as is shown in Fig. 7. The line for 1% and,respectively, the lines for 5 %, 10 %, and 20 % are marking the thickness range at whichthe difference between as and om is reaching the corresponding magnitude. The graphic allows finding the as value for a measured &m at a certain samplethickness L in a quick way. Another interpretation of Fig.7 is the direct correlationof the required minimum thickness of a sample and the expected as to stay within therange of instrumental uncertainty (1%) of thermal-diffusivity determination by thelaser-flash method. Furthermore, the equation is not only describing the behavior of conventional met-als, but also composite materials satisfy this relationship. This fact is demonstrated inFig. 8, where in the case of a copper-diamond composite and a silver-diamond com-posite, the theoretical tendencies of the deviations between calculated and measuredvalues are compared for some sample thicknesses. Finally it can be concluded that the derived equation enables an estimation of theerror in calculation and the recalculation of thermal-diffusivity values for thin speci-mens or material parts from the experimental data. But it has to be explicitly expressed L.mm Fig. 7 Numerical solution of Eq. 8 for selected om values Fig.8CComparison of measured diffusivity for a copper-diamond composite (CuCD) and silver-diamondcomposite (AgCD) and the modeled curve of miscalculation as a function of L that the derived correlations are only valid for the used experimental conditions and acertain thickness of the graphite coating. The applicability to experiments with otherlaser energies has not yet been investigated. References ( 1. .V W.J. P arker, R .J. Jenkins, C .P. B utler, G.L. Abbott, J. Appl. Phys. 32, 1679 (1961) ) ( 2. ASTM E 1 4 61-07, Standard Test Method for Thermal D iffusivity by the Flash Method (ASTM, West Conshohocken, PA, 2008) ) ( 3. D L .A. Watt, Br. J. Appl. P hys. 17, 231 ( 1 966) ) ( 4. R .E. Taylor, H igh Temp.- High Press. 11, 43 (1979) ) ( 5. L .M. C l ark III, R.E. Taylor, J. A ppl. Phys. 46,714 (1975) ) ( 6. R.C. Heckman,J. Appl. Phys. 44, 1 455 (1973) ) ( 7. J .A. Cape, G. W. Lehman,J. Appl. Phys.34,1909 (1963) ) ( 8. R .E. T aylor, L.M. Clark III, High Temp. - High Press. 6, 65 (1974) ) ( 9. R .D. C owan, J. Appl. Phys.34,926 (1963) ) Springer
确定
还剩7页未读,是否继续阅读?

产品配置单

上海依阳实业有限公司为您提供《依据激光脉冲法测试数据评价薄膜试样的热扩散率》,该方案主要用于薄膜材料中检测,参考标准--,《依据激光脉冲法测试数据评价薄膜试样的热扩散率》用到的仪器有超短脉冲闪光法薄膜热性能测定仪
相关方案
更多
该厂商其他方案
更多