方案详情
文
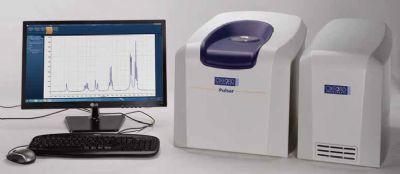
用最新研发的台式高分辨核磁共振谱仪测定植物油中不饱和脂肪含量。仪器有如下优点:运行费用低、操作简单,测试精度高等。
方案详情

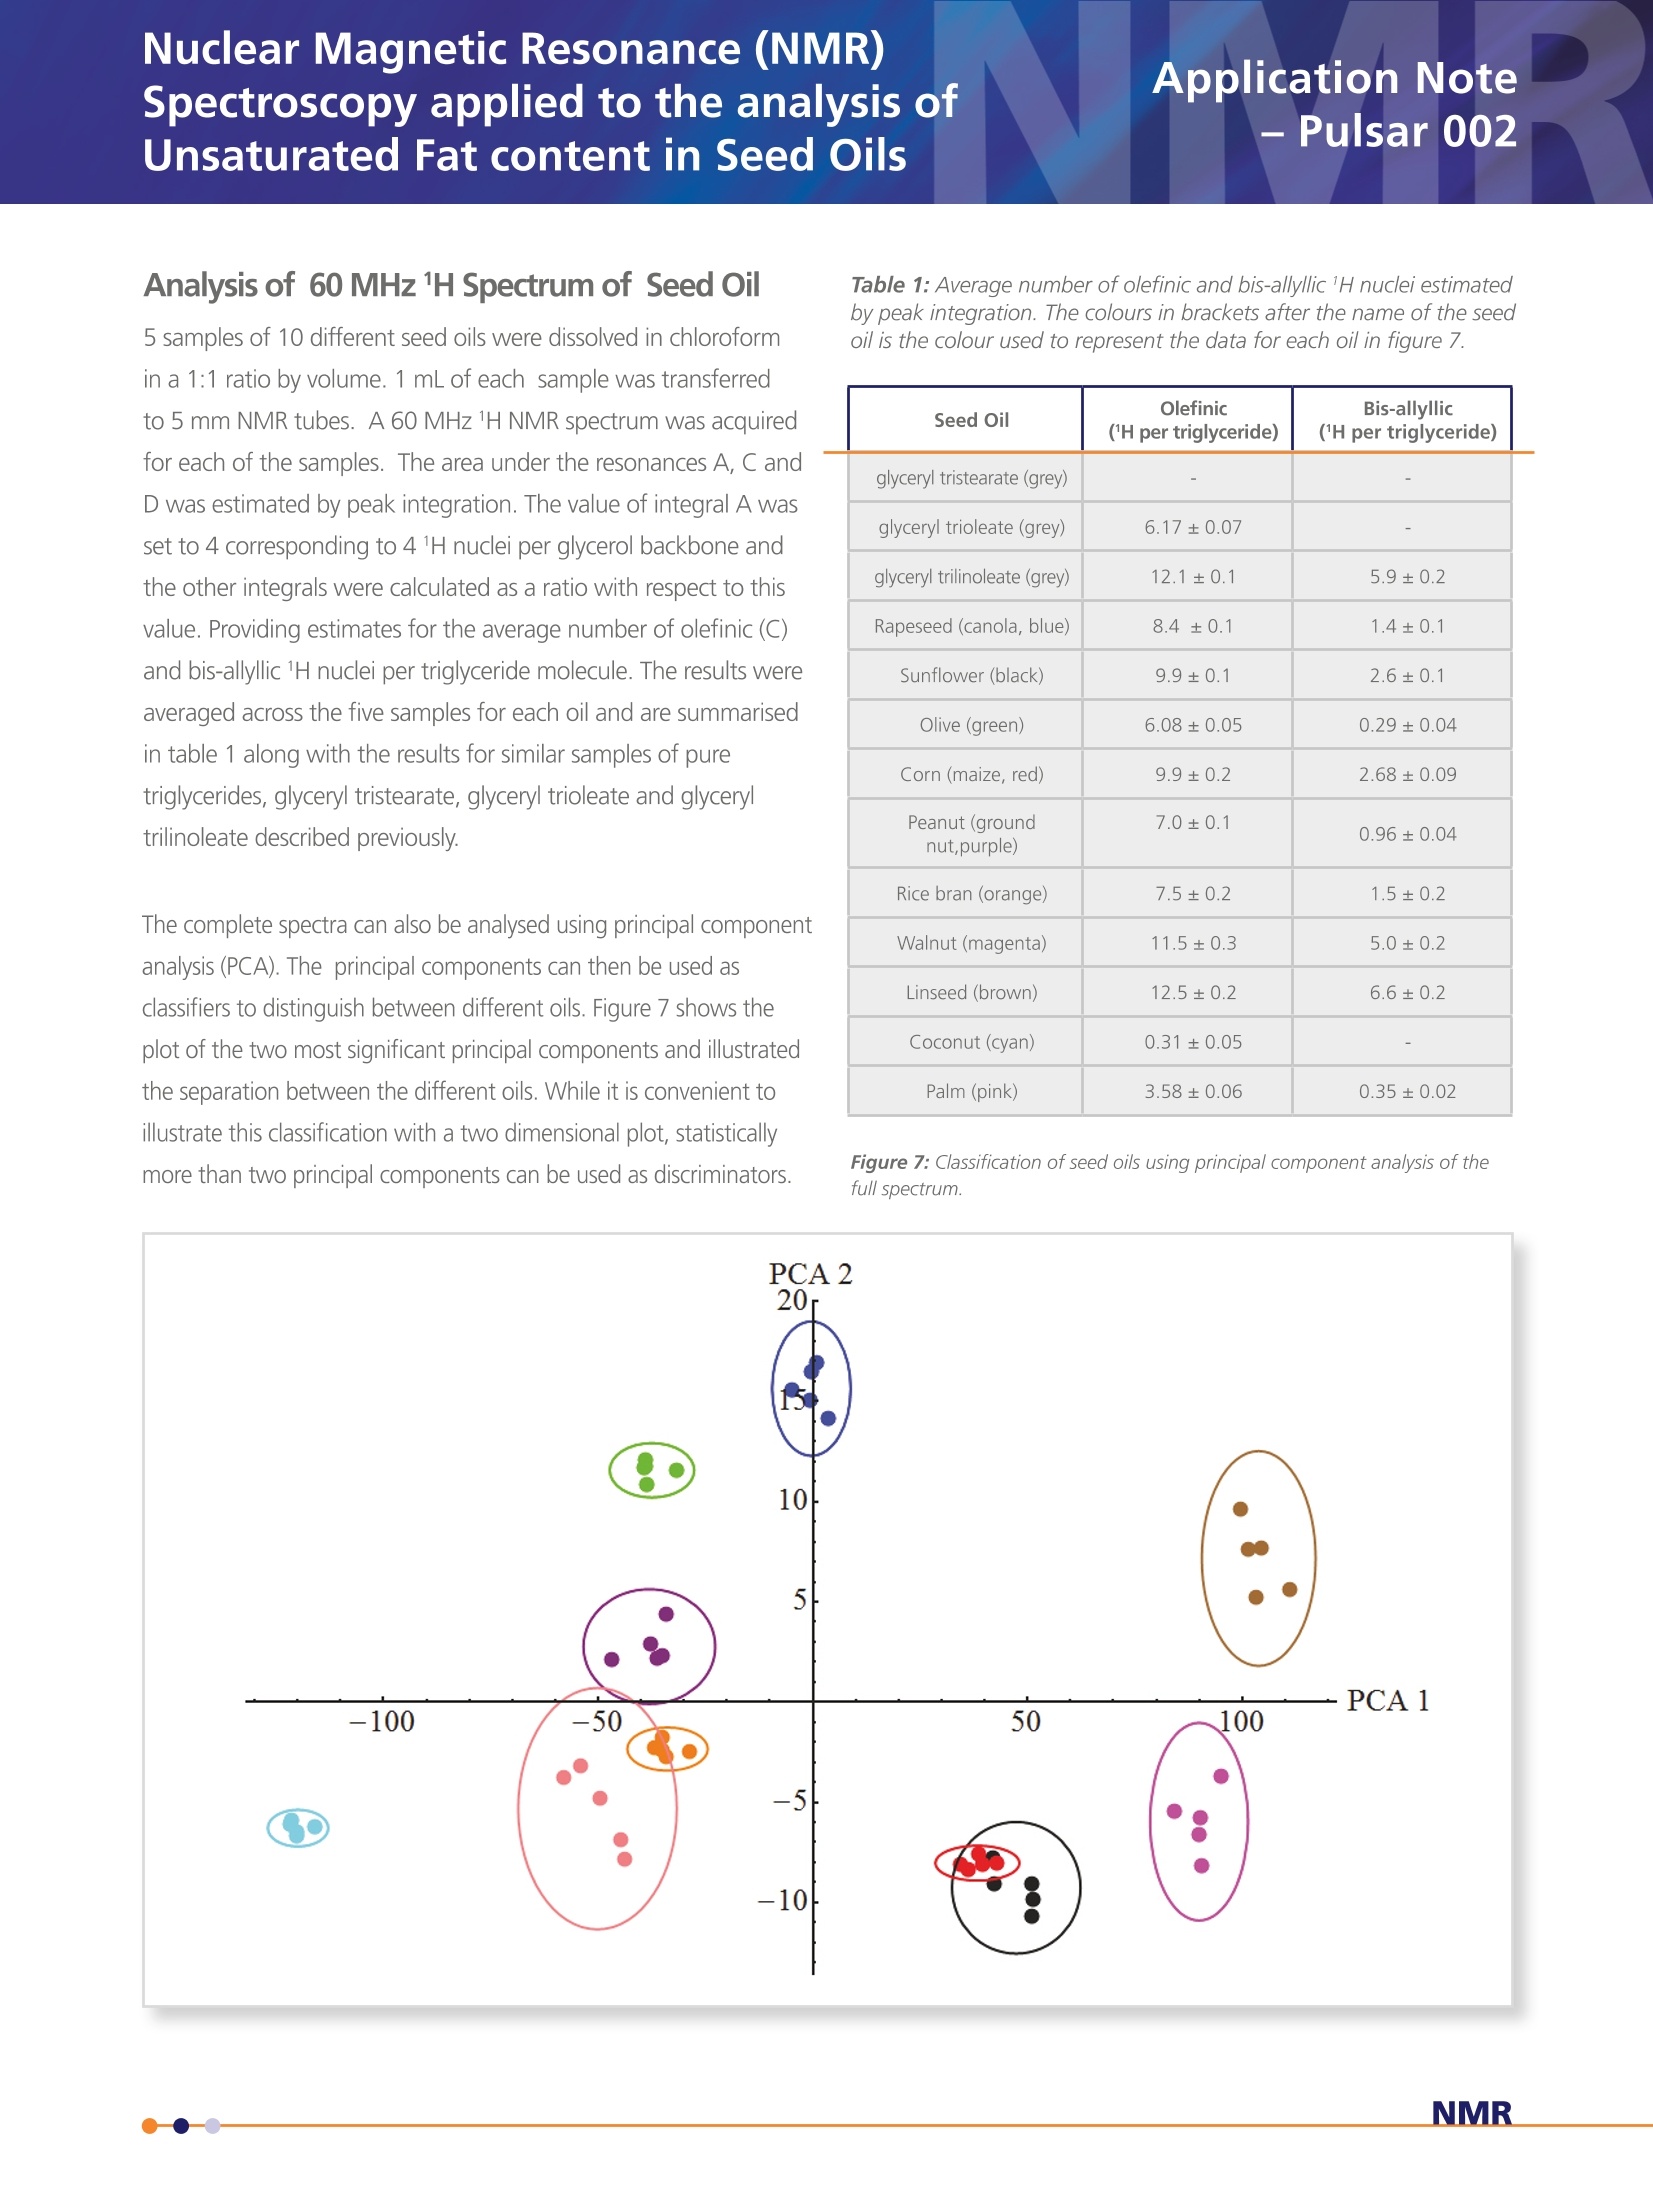
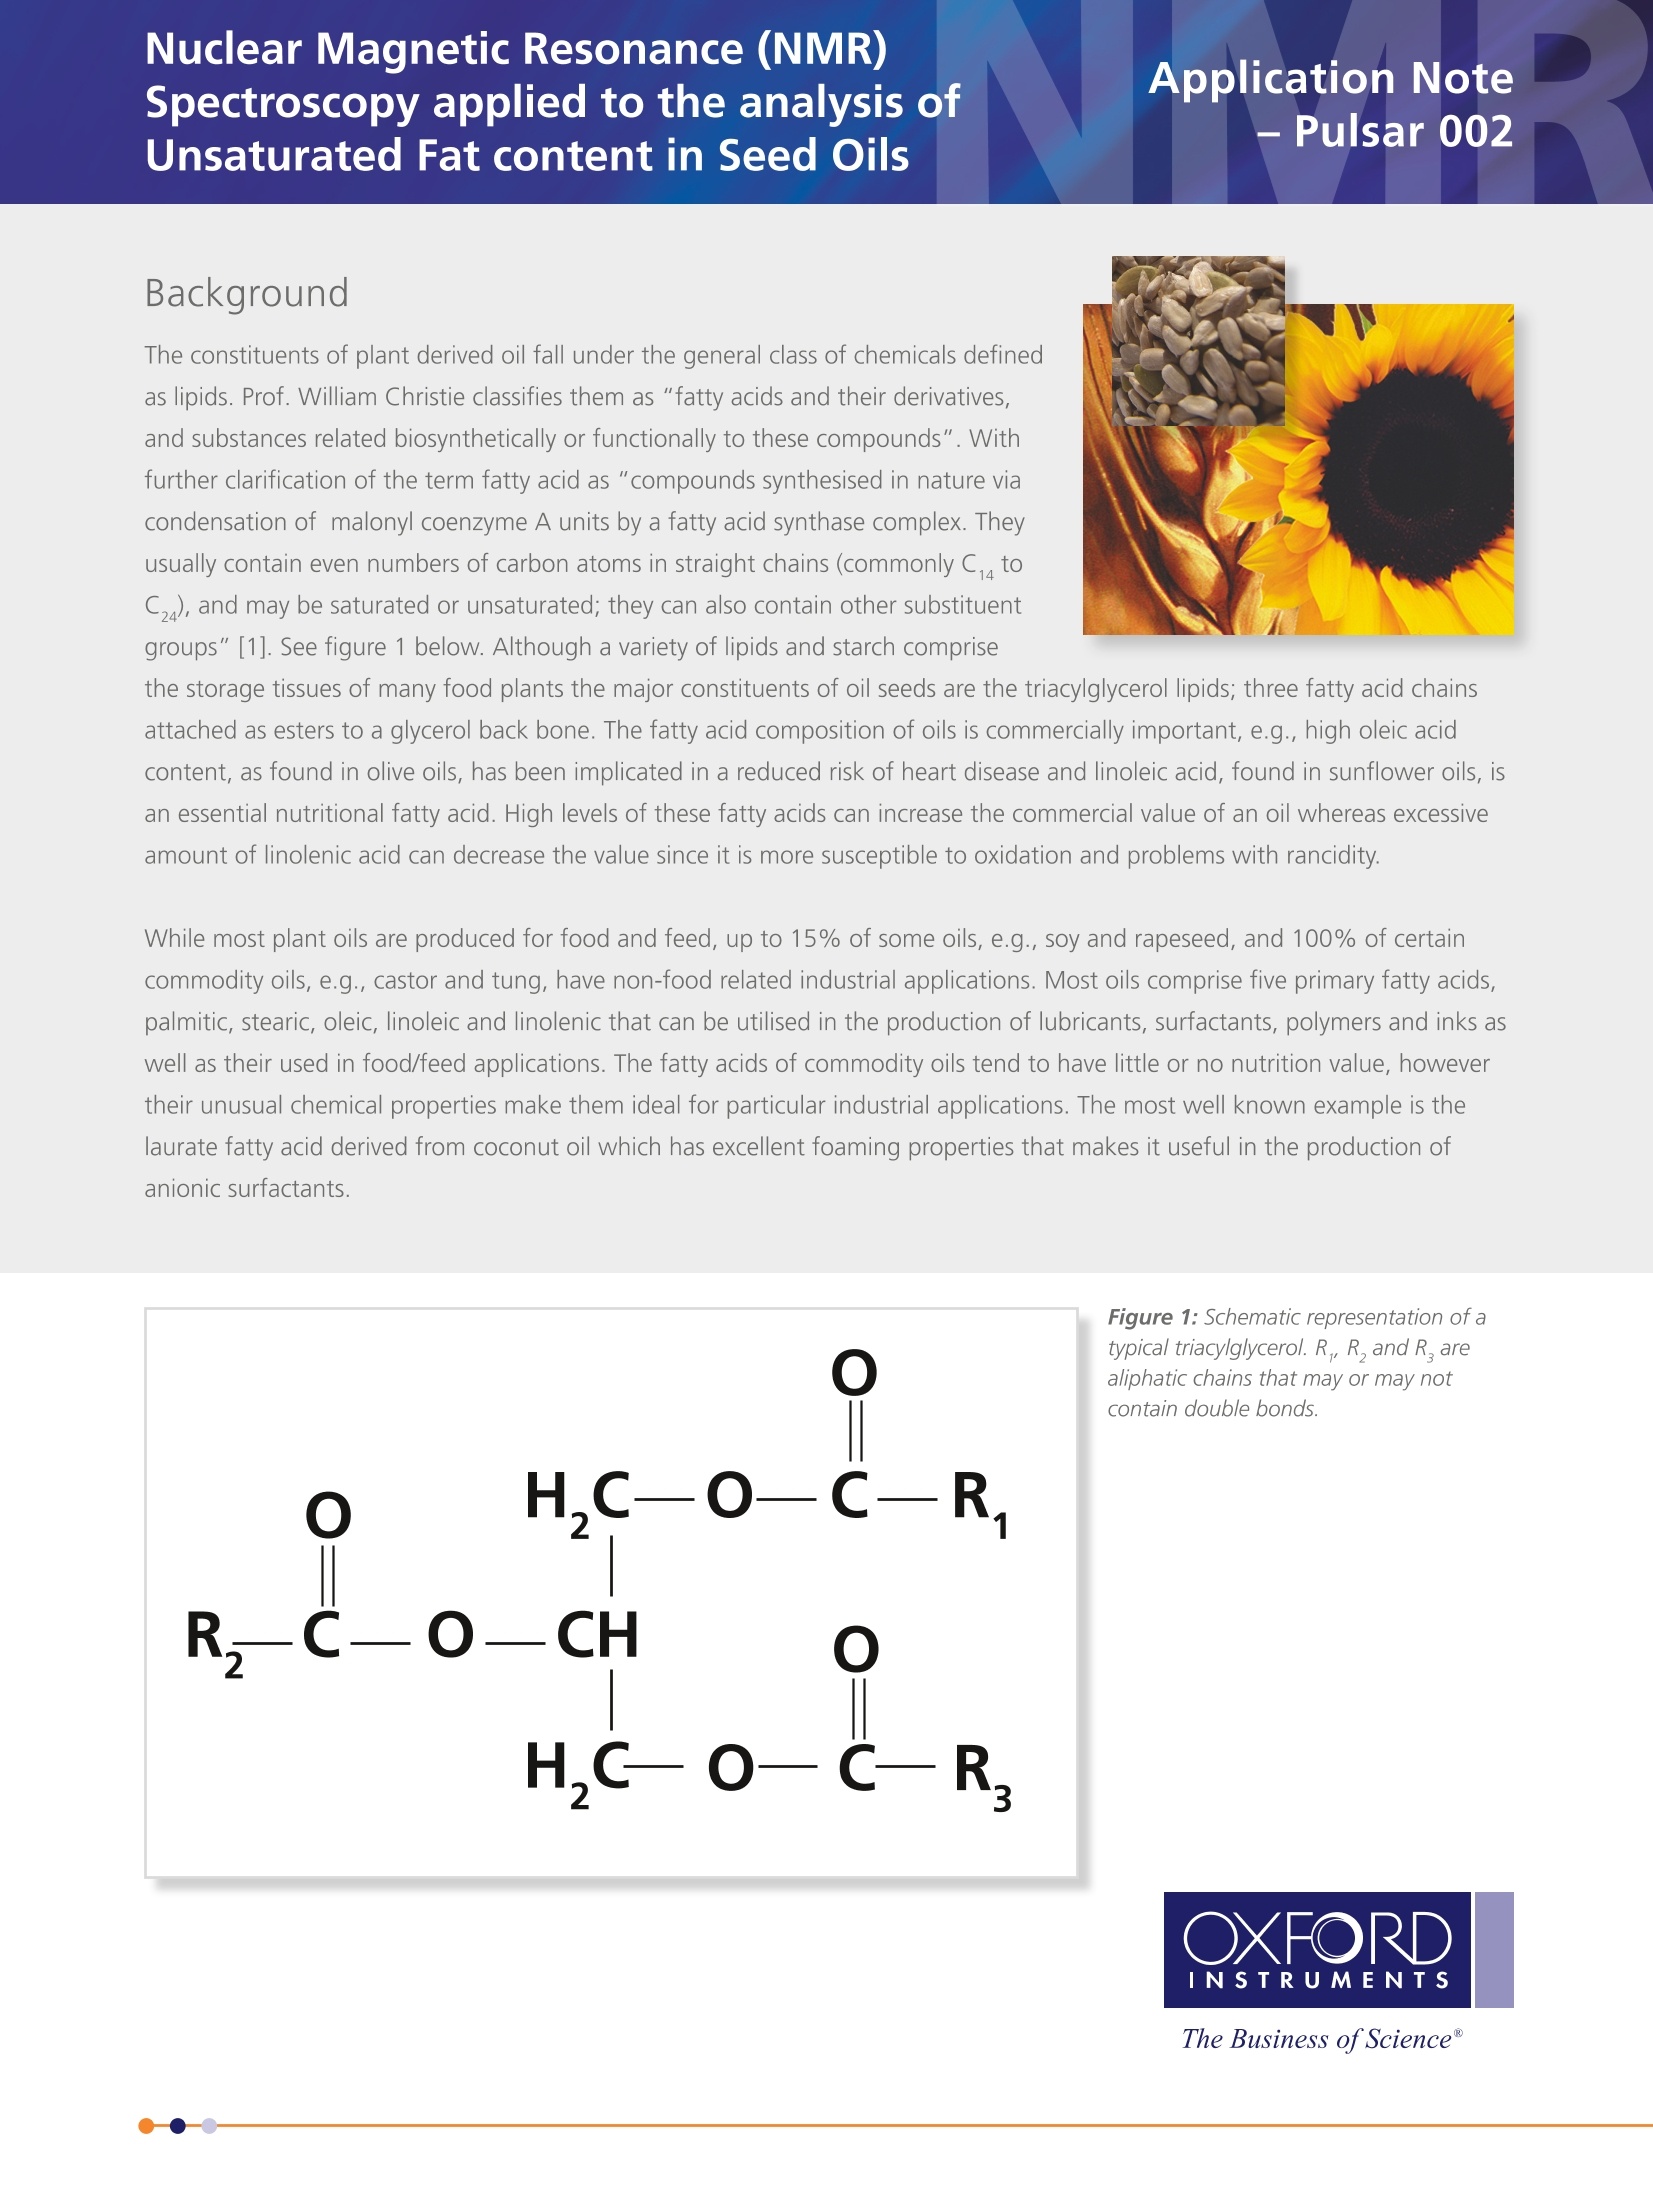
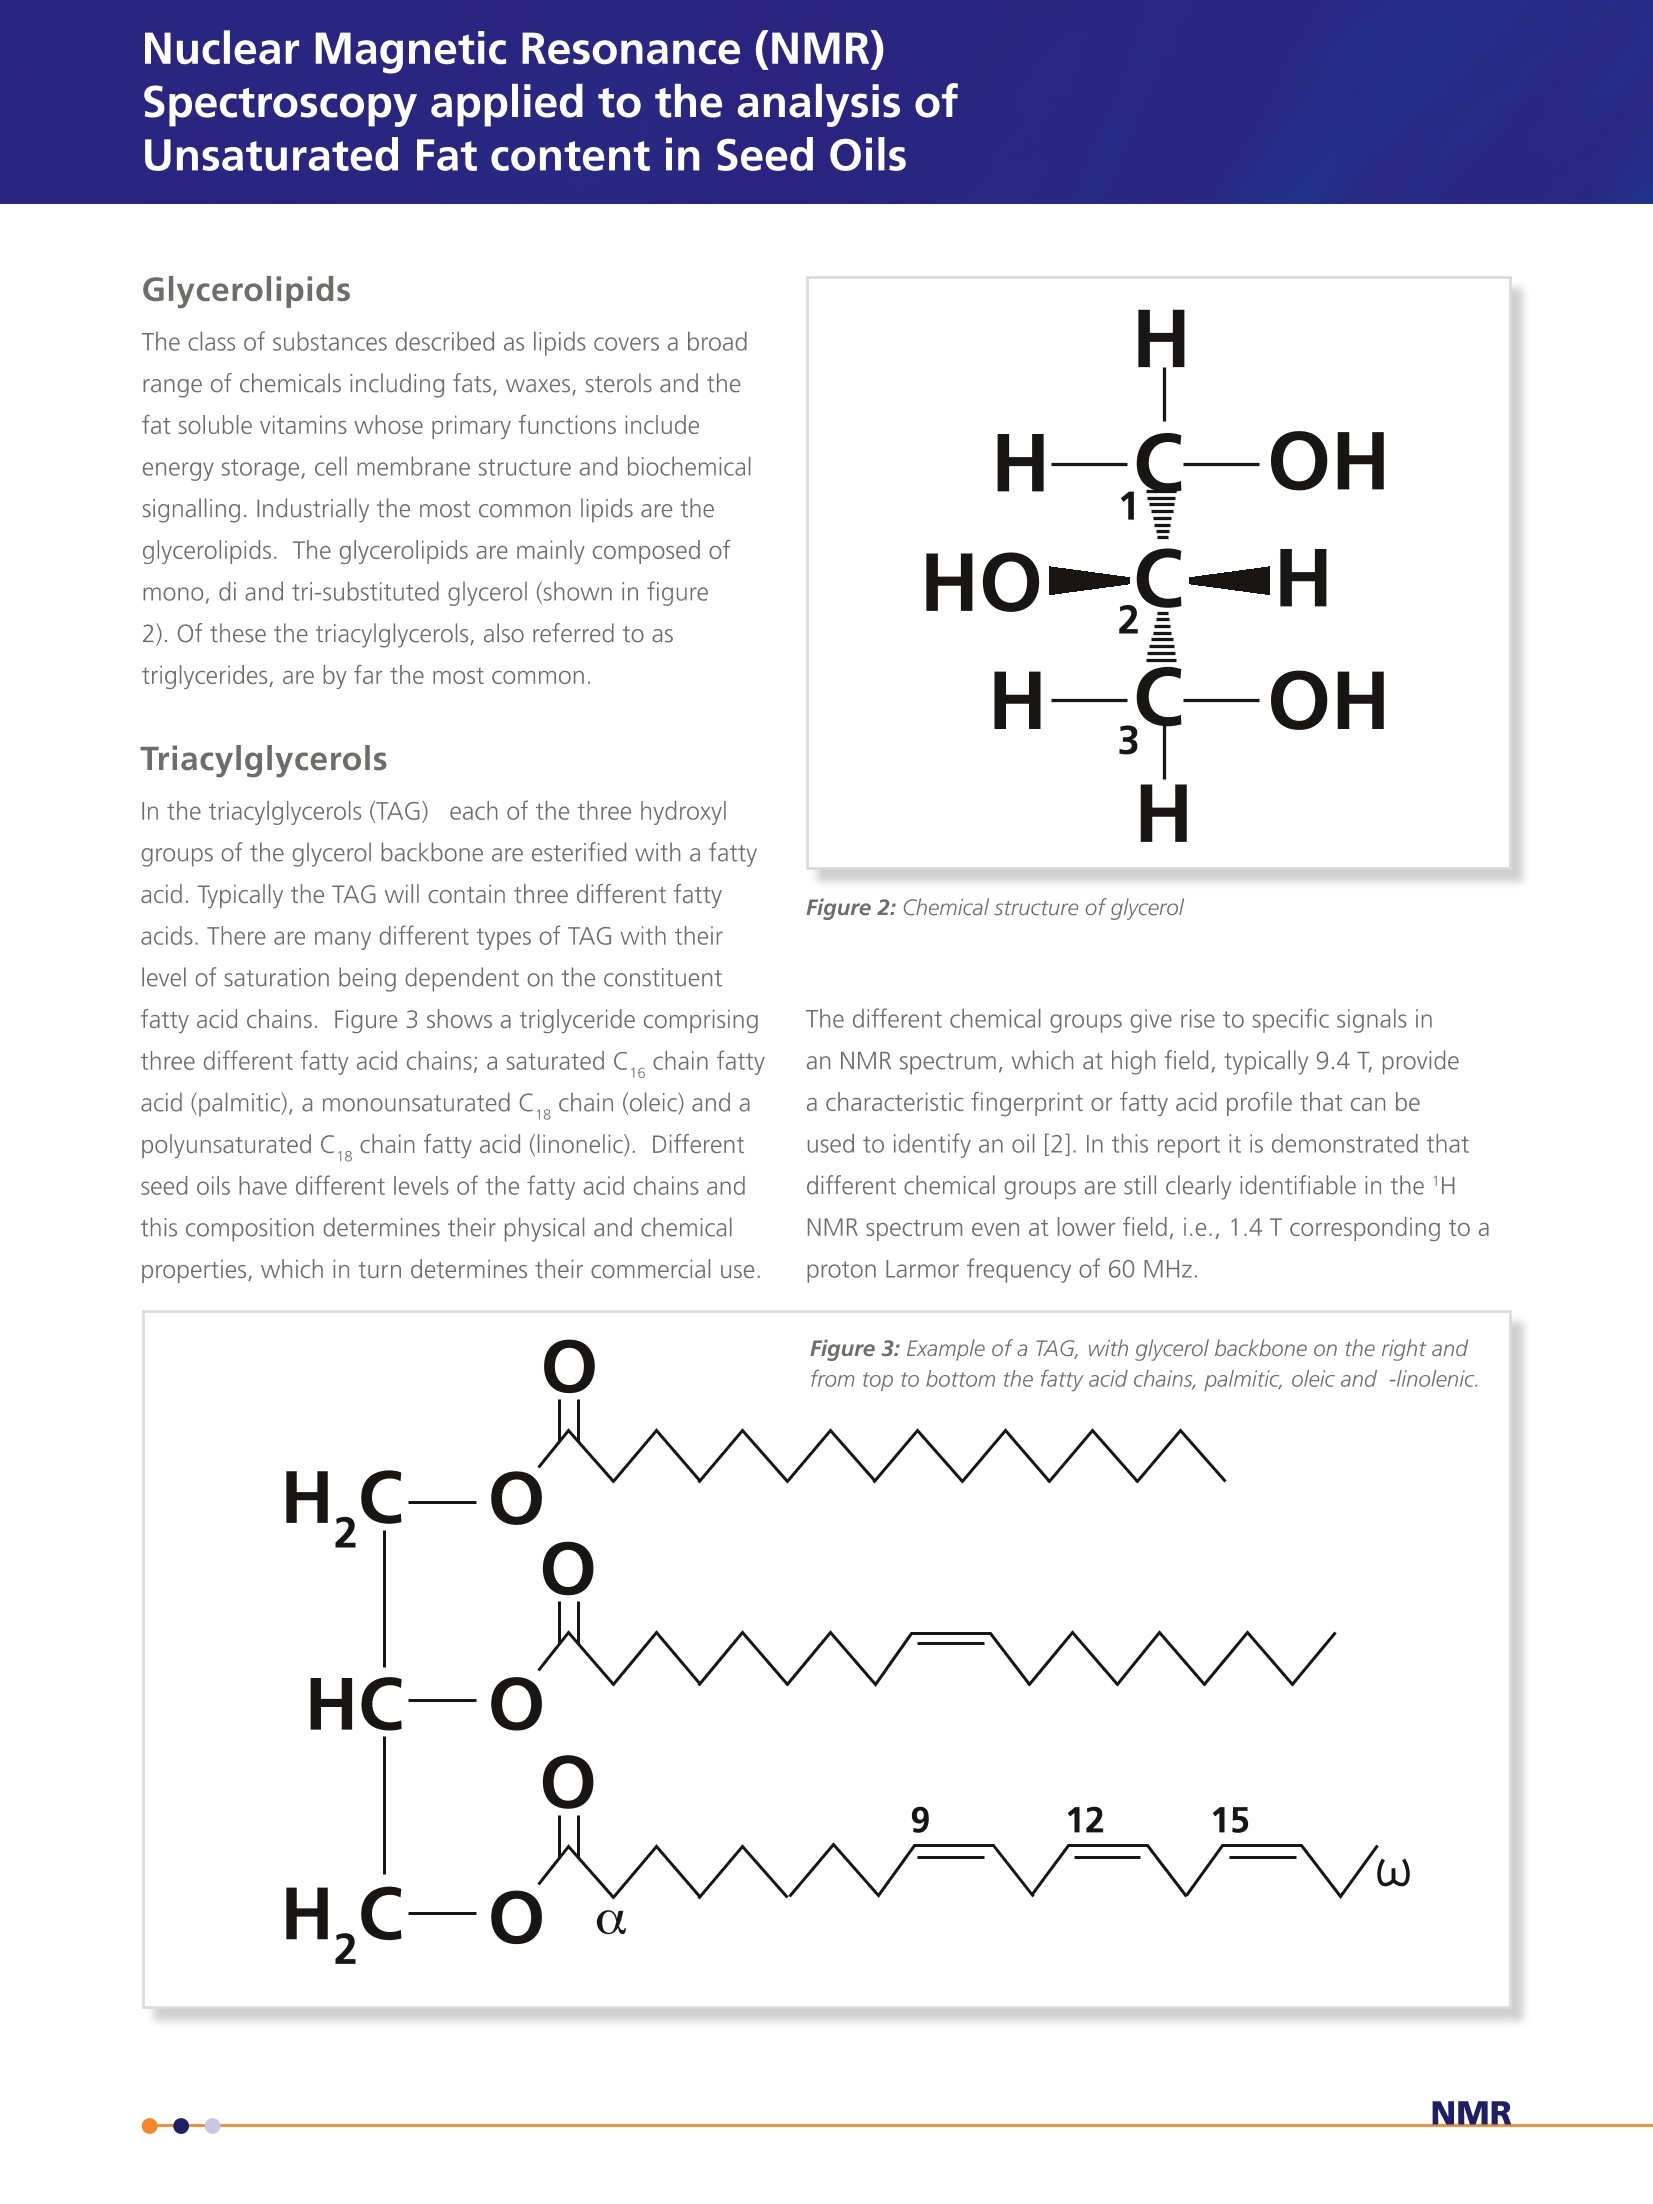
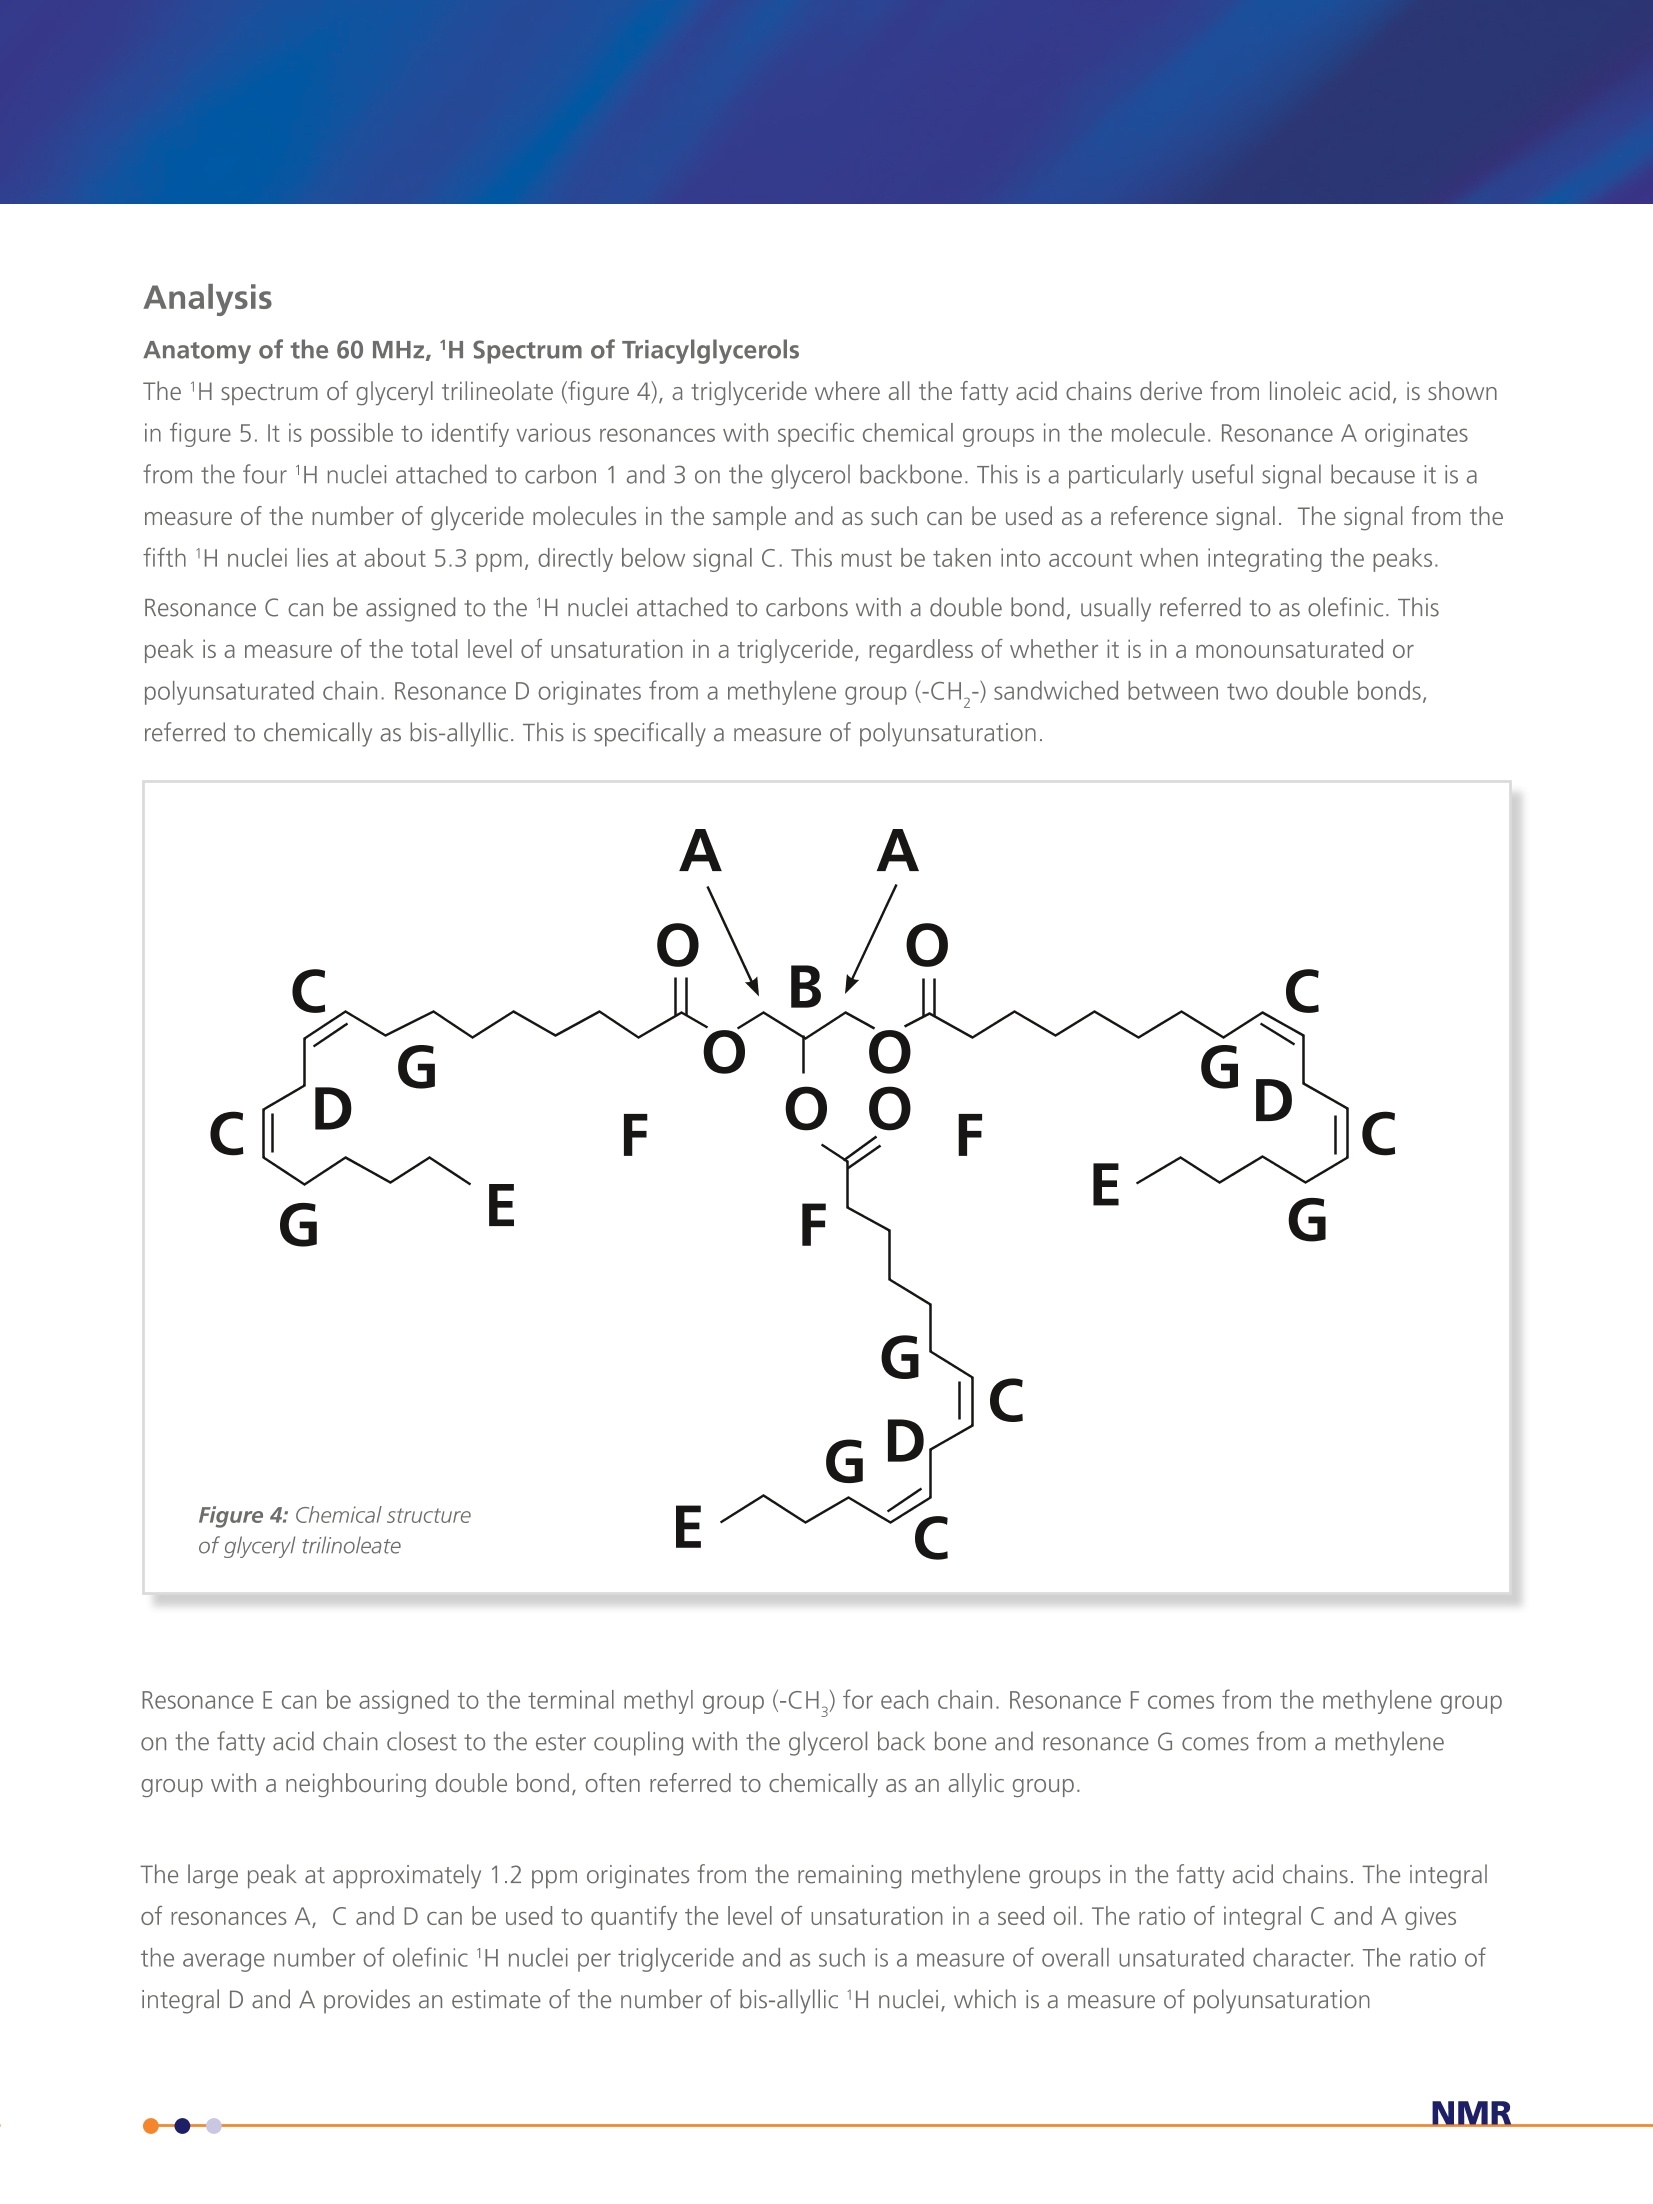
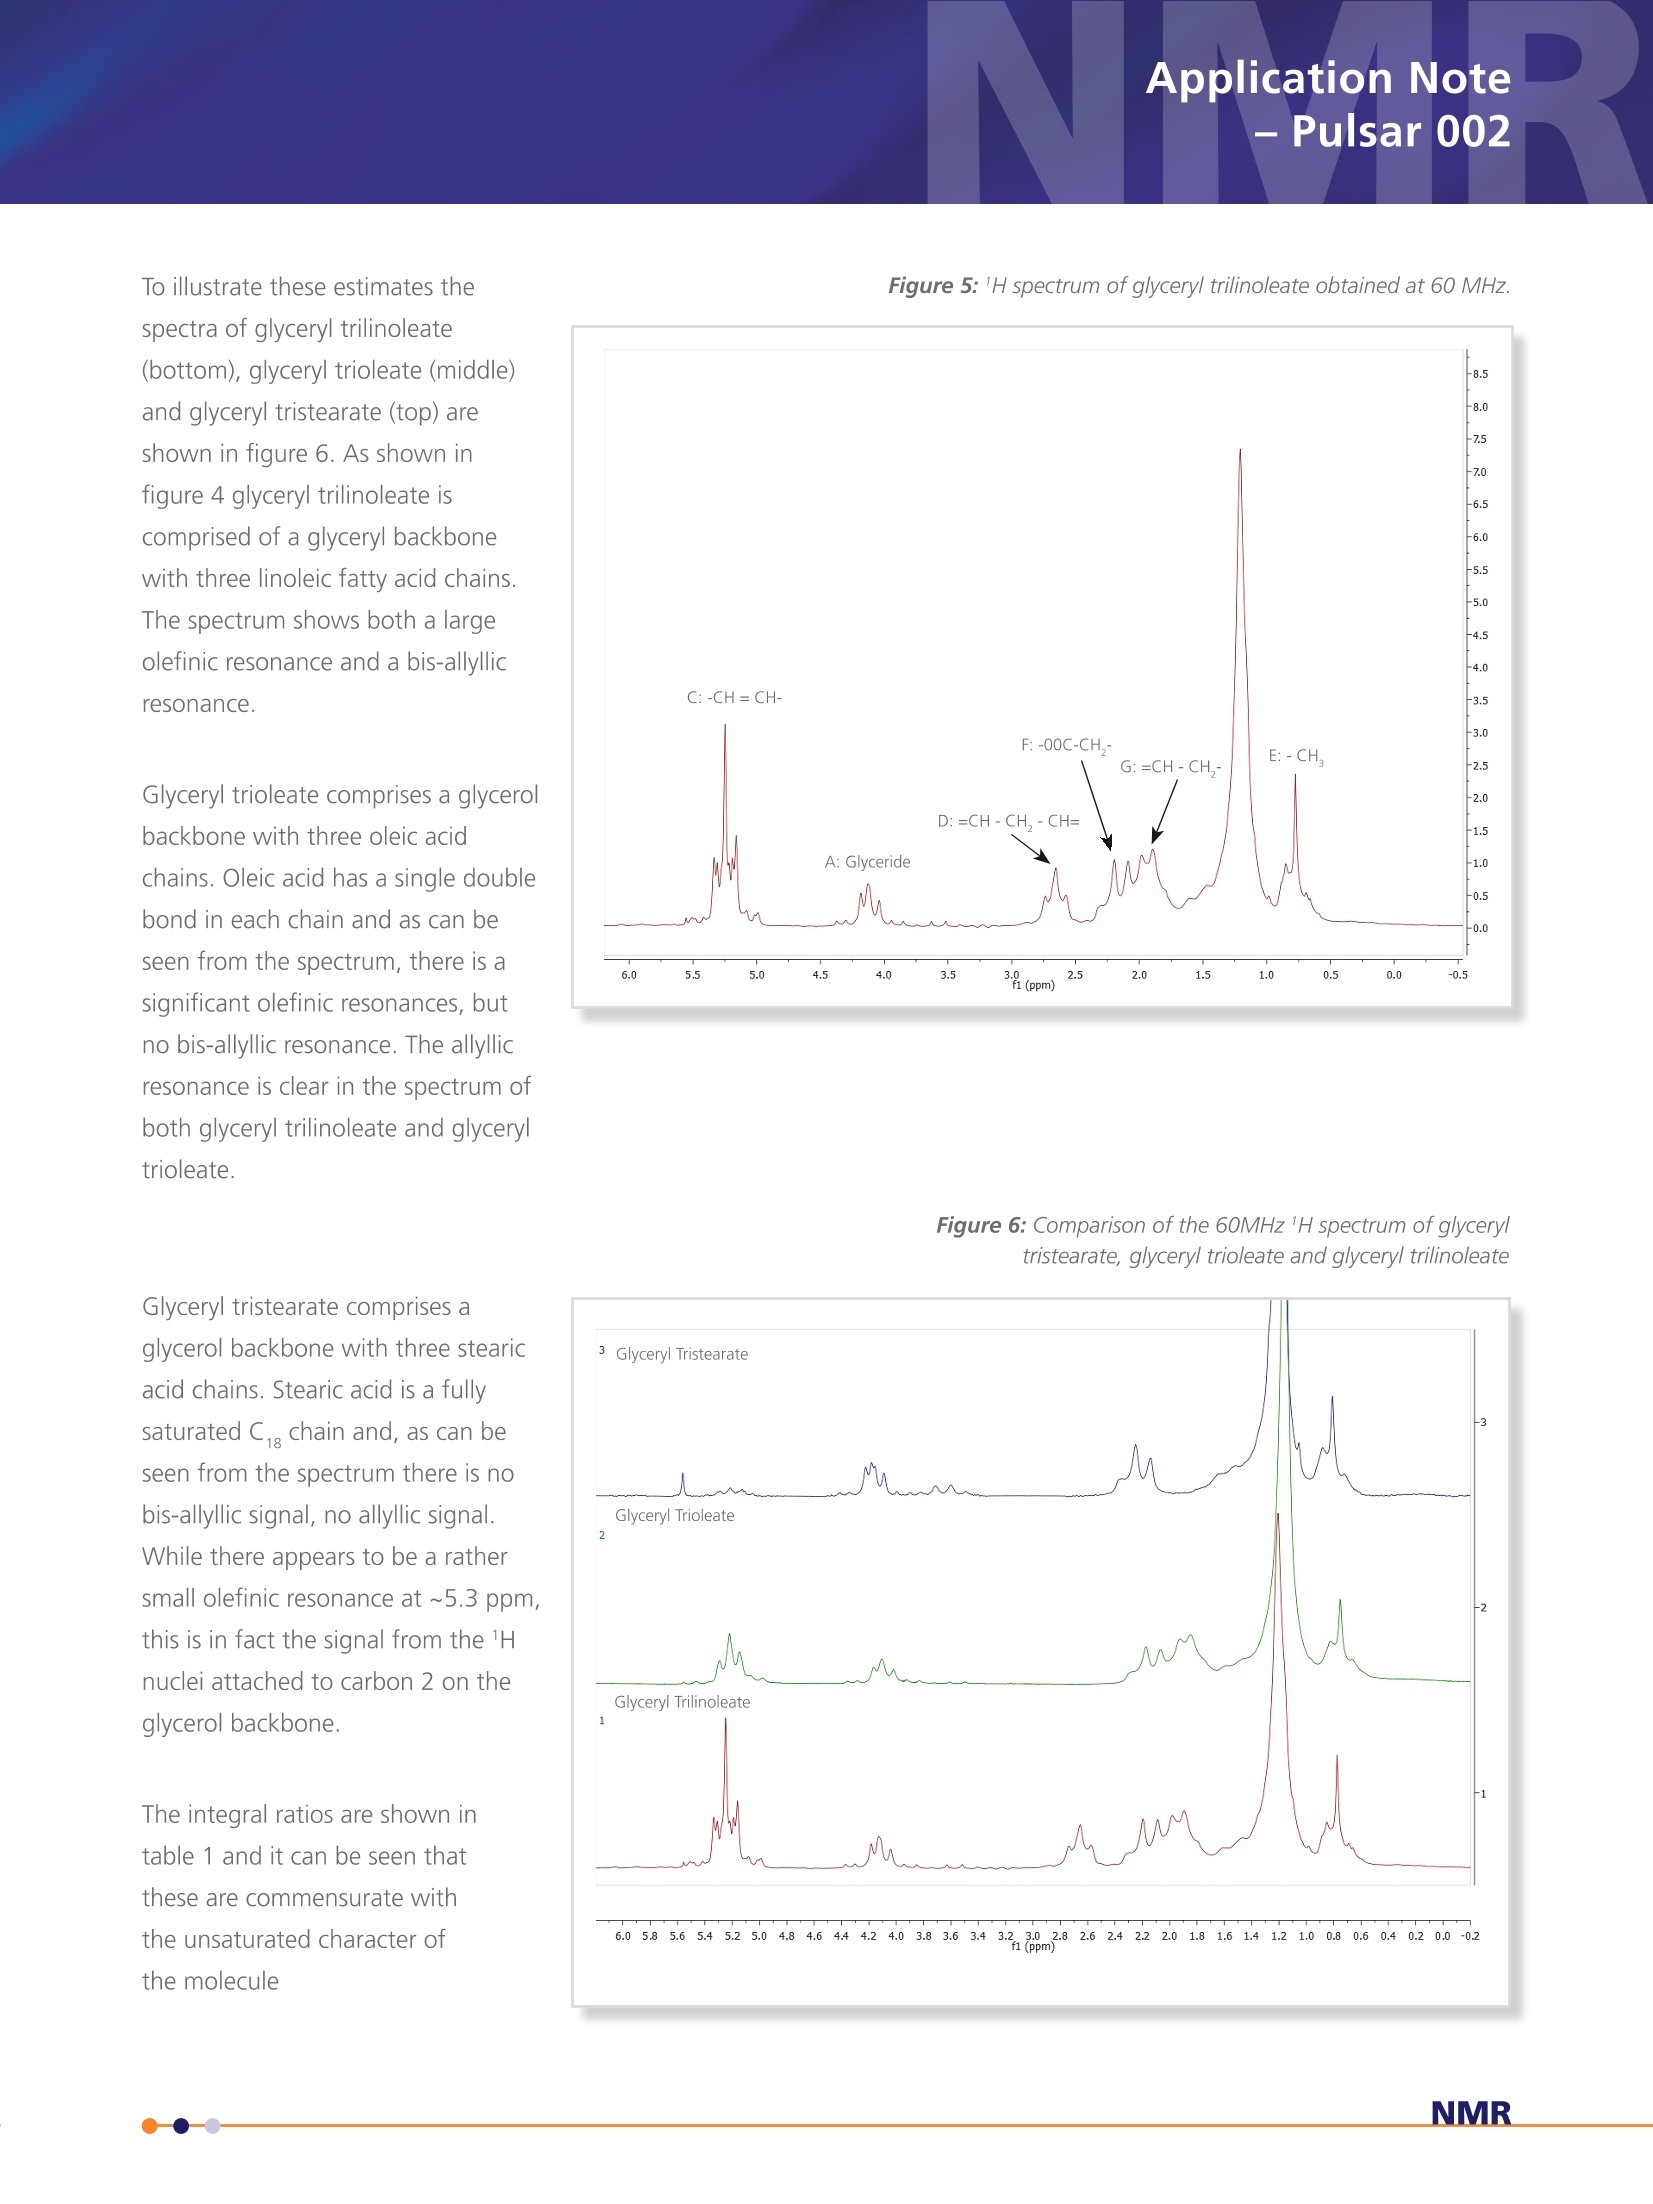
Application Note- Pulsar 002 Spectroscopy applied to the analysis ofUnsaturated Fat content in Seed Oils Nuclear Magnetic Resonance (NMR) Analysis of 60 MHz 1H Spectrum of Seed Oil 5 samples of 10 different seed oils were dissolved in chloroformin a 1:1 ratio by volume. 1 mL of each sample was transferredto 5 mm NMR tubes. A 60 MHz 1H NMR spectrum was acquiredfor each of the samples. The area under the resonances A, C andD was estimated by peak integration. The value of integral A wasset to 4 corresponding to 4 1H nuclei per glycerol backbone andthe other integrals were calculated as a ratio with respect to thisvalue. Providing estimates for the average number of olefinic (C)and bis-allyllic 1H nuclei per triglyceride molecule. The results wereaveraged across the five samples for each oil and are summarisedin table 1 along with the results for similar samples of puretriglycerides, glyceryl tristearate, glyceryl trioleate and glyceryltrilinoleate described previously. The complete spectra can also be analysed using principal componentanalysis (PCA). The principal components can then be used asclassifiers to distinguish between different oils. Figure 7 shows theplot of the two most significant principal components and illustratedthe separation between the different oils. While it is convenient toillustrate this classification with a two dimensional plot, statisticallymore than two principal components can be used as discriminators. Table 1: Average number of olefinic and bis-allyllic 'H nuclei estimatedby peak integration. The colours in brackets after the name of the seedoil is the colour used to represent the data for each oil in figure 7. Seed Oil Olefinic ('H per triglyceride) Bis-allyllic (1H per triglyceride) glyceryl tristearate (grey) glyceryl trioleate (grey) 6.17±0.07 - glyceryl trilinoleate (grey) 12.1±0.1 5.9±0.2 Rapeseed (canola, blue) 8.4±0.1 1.4±0.1 Sunflower (black) 9.9±0.1 2.6±0.1 Olive (green) 6.08±0.05 0.29±0.04 Corn (maize, red) 9.9±0.2 2.68±0.09 Peanut (groundnut,purple) 7.0±0.1 0.96±0.04 Rice bran (orange) 7.5±0.2 1.5±0.2 Walnut (magenta) 11.5±0.3 5.0±0.2 Linseed (brown) 12.5±0.2 6.6±0.2 Coconut (cyan) 0.31±0.05 Palm (pink) 3.58±0.06 0.35±0.02 Figure 7: Classification of seed oils using principal component analysis of thefull spectrum. Nuclear Magnetic Resonance (NMR)Spectroscopy applied to the analysis ofUnsaturated Fat content in Seed Oils Application Note -Pulsar 002 Background The constituents of plant derived oil fall under the general class of chemicals definedas lipids. Prof. William Christie classifies them as "fatty acids and their derivatives,and substances related biosynthetically or functionally to these compounds". Withfurther clarification of the term fatty acid as "compounds synthesised in nature viacondensation of malonylcoenzyme A units by a fatty acid synthase complex. Theyusually contain even numbers of carbon atoms in straight chains (commonly CtoC,a), and may be saturated or unsaturated; they can also contain other substituentgroups"[1]. See figure 1 below. Although a variety of lipids and starch comprise the storage tissues of many food plants the major constituents of oil seeds are the triacylglycerol lipids; three fatty acid chainsattached as esters to a glycerol back bone. The fatty acid composition of oils is commercially important, e.g., high oleic acidcontent, as found in olive oils, has been implicated in a reduced risk of heart disease and linoleic acid, found in sunflower oils, isan essential nutritional fatty acid. High levels of these fatty acids can increase the commercial value of an oil whereas excessiveamount of linolenic acid can decrease the value since it is more susceptible to oxidation and problems with rancidity. While most plant oils are produced for food and feed, up to 15% of some oils, e.g., soy and rapeseed, and 100% of certaincommodity oils, e.g., castor and tung, have non-food related industrial applications. Most oils comprise five primary fatty acids,palmitic, stearic, oleic, linoleic and linolenic that can be utilised in the production of lubricants, surfactants, polymers and inks aswell as their used in food/feed applications. The fatty acids of commodity oils tend to have little or no nutrition value, howevertheir unusual chemical properties make them ideal for particular industrial applications. The most well known example is thelaurate fatty acid derived from coconut oil which has excellent foaming properties that makes it useful in the production ofanionic surfactants. Nuclear Magnetic Resonance (NMR) Spectroscopy applied to the analysis of Unsaturated Fat content in Seed Oils The class of substances described as lipids covers a broadrange of chemicals including fats, waxes, sterols and thefat soluble vitamins whose primary functions includeenergy storage, cell membrane structure and biochemicalsignalling. Industrially the most common lipids are theglycerolipids. The glycerolipids are mainly composed ofmono, di and tri-substituted glycerol (shown in figure2). Of these the triacylglycerols, also referred to as triglycerides, are by far the most common. Triacylglycerols In the triacylglycerols (TAG) each of the three hydroxylgroups of the glycerol backbone are esterified with a fattyacid. Typically the TAG will contain three different fattyacids. There are many different types of TAG with theirlevel of saturation being dependent on the constituentfatty acid chains. Figure 3 shows a triglyceride comprisingthree different fatty acid chains; a saturated C chain fattyacid (palmitic), a monounsaturated C,,chain (oleic) and apolyunsaturated C chain fatty acid (linonelic). Differentseed oils have different levels of the fatty acid chains andthis composition determines their physical and chemicalproperties, which in turn determines their commercial use. Figure 2: Chemical structure of glycero/ The different chemical groups give rise to specific signals inan NMR spectrum, which at high field, typically 9.4 T, providea characteristic fingerprint or fatty acid profile that can beused to identify an oil [2]. In this report it is demonstrated thatdifferent chemical groups are still clearly identifiable in the 1HNMR spectrum even at lower field, i.e., 1.4 T corresponding to aproton Larmor frequency of 60 MHz. Analysis Anatomy of the 60 MHz, 1H Spectrum of Triacylglycerols The 1H spectrum of glyceryl trilineolate (figure 4), a triglyceride where all the fatty acid chains derive from linoleic acid, is shownin figure 5. It is possible to identify various resonances with specific chemical groups in the molecule. Resonance A originatesfrom the four 1H nuclei attached to carbon 1 and 3 on the glycerol backbone. This is a particularly useful signal because it is ameasure of the number of glyceride molecules in the sample and as such can be used as a reference signal. The signal from thefifth 1H nuclei lies at about 5.3 ppm, directly below signal C. This must be taken into account when integrating the peaks.Resonance C can be assigned to the 1H nuclei attached to carbons with a double bond, usually referred to as olefinic. Thispeak is a measure of the total level of unsaturation in a triglyceride, regardless of whether it is in a monounsaturated orpolyunsaturated chain. Resonance D originates from a methylene group (-CH,-) sandwiched between two double bonds,referred to chemically as bis-allyllic. This is specifically a measure of polyunsaturation. Resonance E can be assigned to the terminal methyl group (-CH,) for each chain.Resonance F comes from the methylene groupon the fatty acid chain closest to the ester coupling with the glycerol back bone and resonance G comes from a methylenegroup with a neighbouring double bond, often referred to chemically as an allylic group. The large peak at approximately 1.2 ppm originates from the remaining methylene groups in the fatty acid chains. The integralof resonances A, C and D can be used to quantify the level of unsaturation in a seed oil. The ratio of integral C and A givesthe average number of olefinic 1H nuclei per triglyceride and as such is a measure of overall unsaturated character. The ratio ofintegral D and A provides an estimate of the number of bis-allyllic 1H nuclei, which is a measure of polyunsaturation To illustrate these estimates thespectra of glyceryl trilinoleate(bottom), glyceryl trioleate (middle)and glyceryl tristearate (top) areshown in figure 6. As shown infigure 4 glyceryl trilinoleate iscomprised of a glyceryl backbonewith three linoleic fatty acid chains.The spectrum shows both a largeolefinic resonance and a bis-allyllicresonance. Glyceryl trioleate comprises a glycerolbackbone with three oleic acidchains. Oleic acid has a single doublebond in each chain and as can beseen from the spectrum, there is asignificant olefinic resonances, butno bis-allyllic resonance. The allyllicresonance is clear in the spectrum ofboth glyceryl trilinoleate and glyceryltrioleate. Glyceryl tristearate comprises aglycerol backbone with three stearicacid chains. Stearic acid is a fullysaturated C, chain and, as can beseen from the spectrum there is nobis-allyllic signal, no allyllic signal.While there appears to be a rathersmall olefinic resonance at ~5.3 ppm,this is in fact the signal from the 1Hnuclei attached to carbon 2 on theglycerol backbone. The integral ratios are shown intable 1 and it can be seen thatthese are commensurate withthe unsaturated character ofthe molecule Figure 6: Comparison of the 60MHz 1H spectrum of glyceryltristearate, glycery/ trioleate and glycery/trilinoleate Summarv In conclusion, 60MHz NMR spectroscopy provides a suitable tool forthe study of seed oils. The chemical specificity of the spectral peakscan be used as markers to estimate the levels different types of thefatty acid chains. The analysis of the spectra could be extendedusing a line fitting package. This could be used to estimate signalamplitudes from overlapping resonances, especially those associatedwith the methylene and methyl groups. The integral of this region ofthe spectrum provides information about the average fatty acid chainlength. The analysis of the whole spectrum using chemometric methodssuch as principal component analysis provides a suitable frameworkfor classification of different types of oil. This work could be extendedbeyond simple classification to provide a method for the detection ofadulterants or monitoring seasonal changes in oil crops. [1] http://lipidlibrary.aocs.org/Lipids/whatlip/index.htm [2] Guillen M. D. and Ruiz A. Eur. J. Lipid Sci Technol.105 (2003)501-507 visit www.oxford-instruments.com for more information All rights reserved. Ref.TG-AN-02-13 Oxford InstrumentsIndustrial Analysis For more informationplease email: industrial@oxinst.com UK Tubney Woods, Abingdon,Oxfordshire, OX13 5QX, UK Tel: +44 1865 393 200 ChinaRoom 1/E, Building 1,Xiangzhang Garden,No. 248 Donglan Road,Shanghai 201102, ChinaTel: +86 21 6073 2925 India 11, Marwah's Complex,Andheri East, Mumbai,400072, India Tel.: +91 22 42535100 Japan Haseman Bldg, Tokyo, 135-0047, Japan Tel: +81 3 5245 3251 Singapore 10 Ubi Crescent. Singapore,408564, Singapore Tel: +65 6337 6848 USA 300 Baker Avenue, Suite 150, Concord, Mass 01742, USA NMR
确定

还剩4页未读,是否继续阅读?
麟文仪器有限公司为您提供《植物油中不饱和脂肪酸检测方案 》,该方案主要用于食用植物油中营养成分检测,参考标准--,《植物油中不饱和脂肪酸检测方案 》用到的仪器有牛津新品:台式高分辨核磁共振(NMR)、牛津台式高分辨NMR——PULSAR
相关方案
更多


