


方案详情
文
颜色的定义及测量方法
方案详情

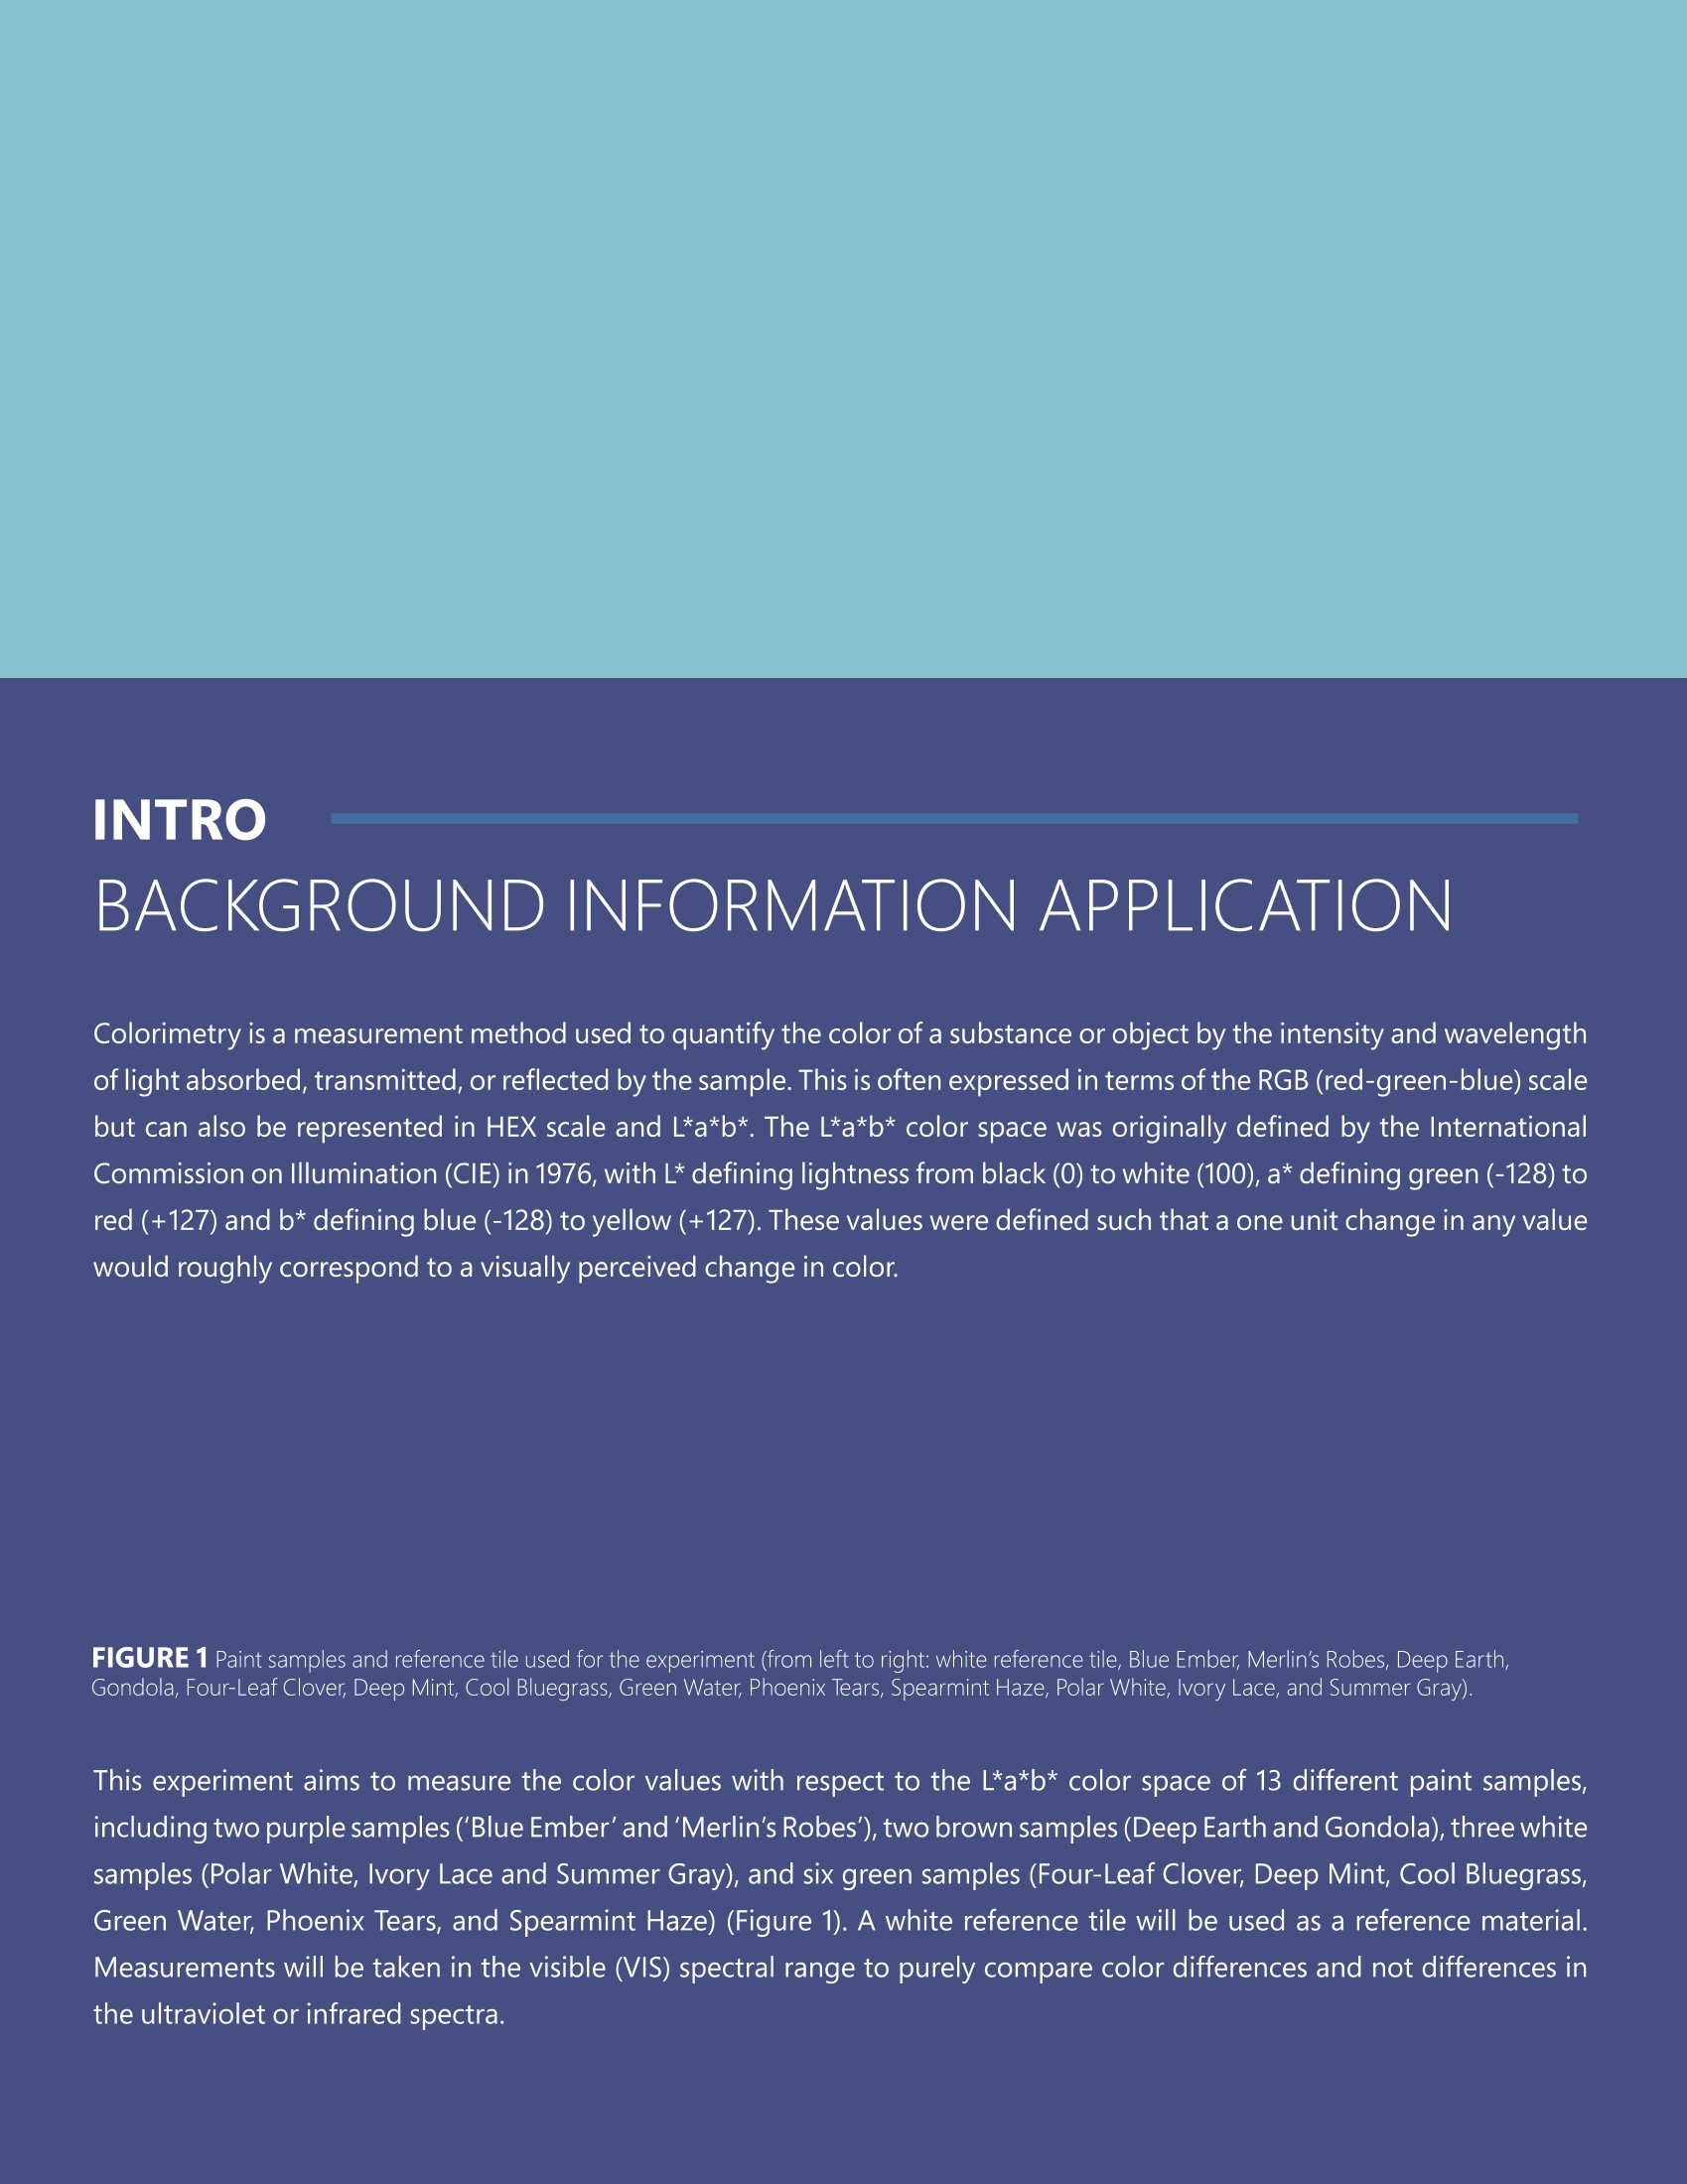
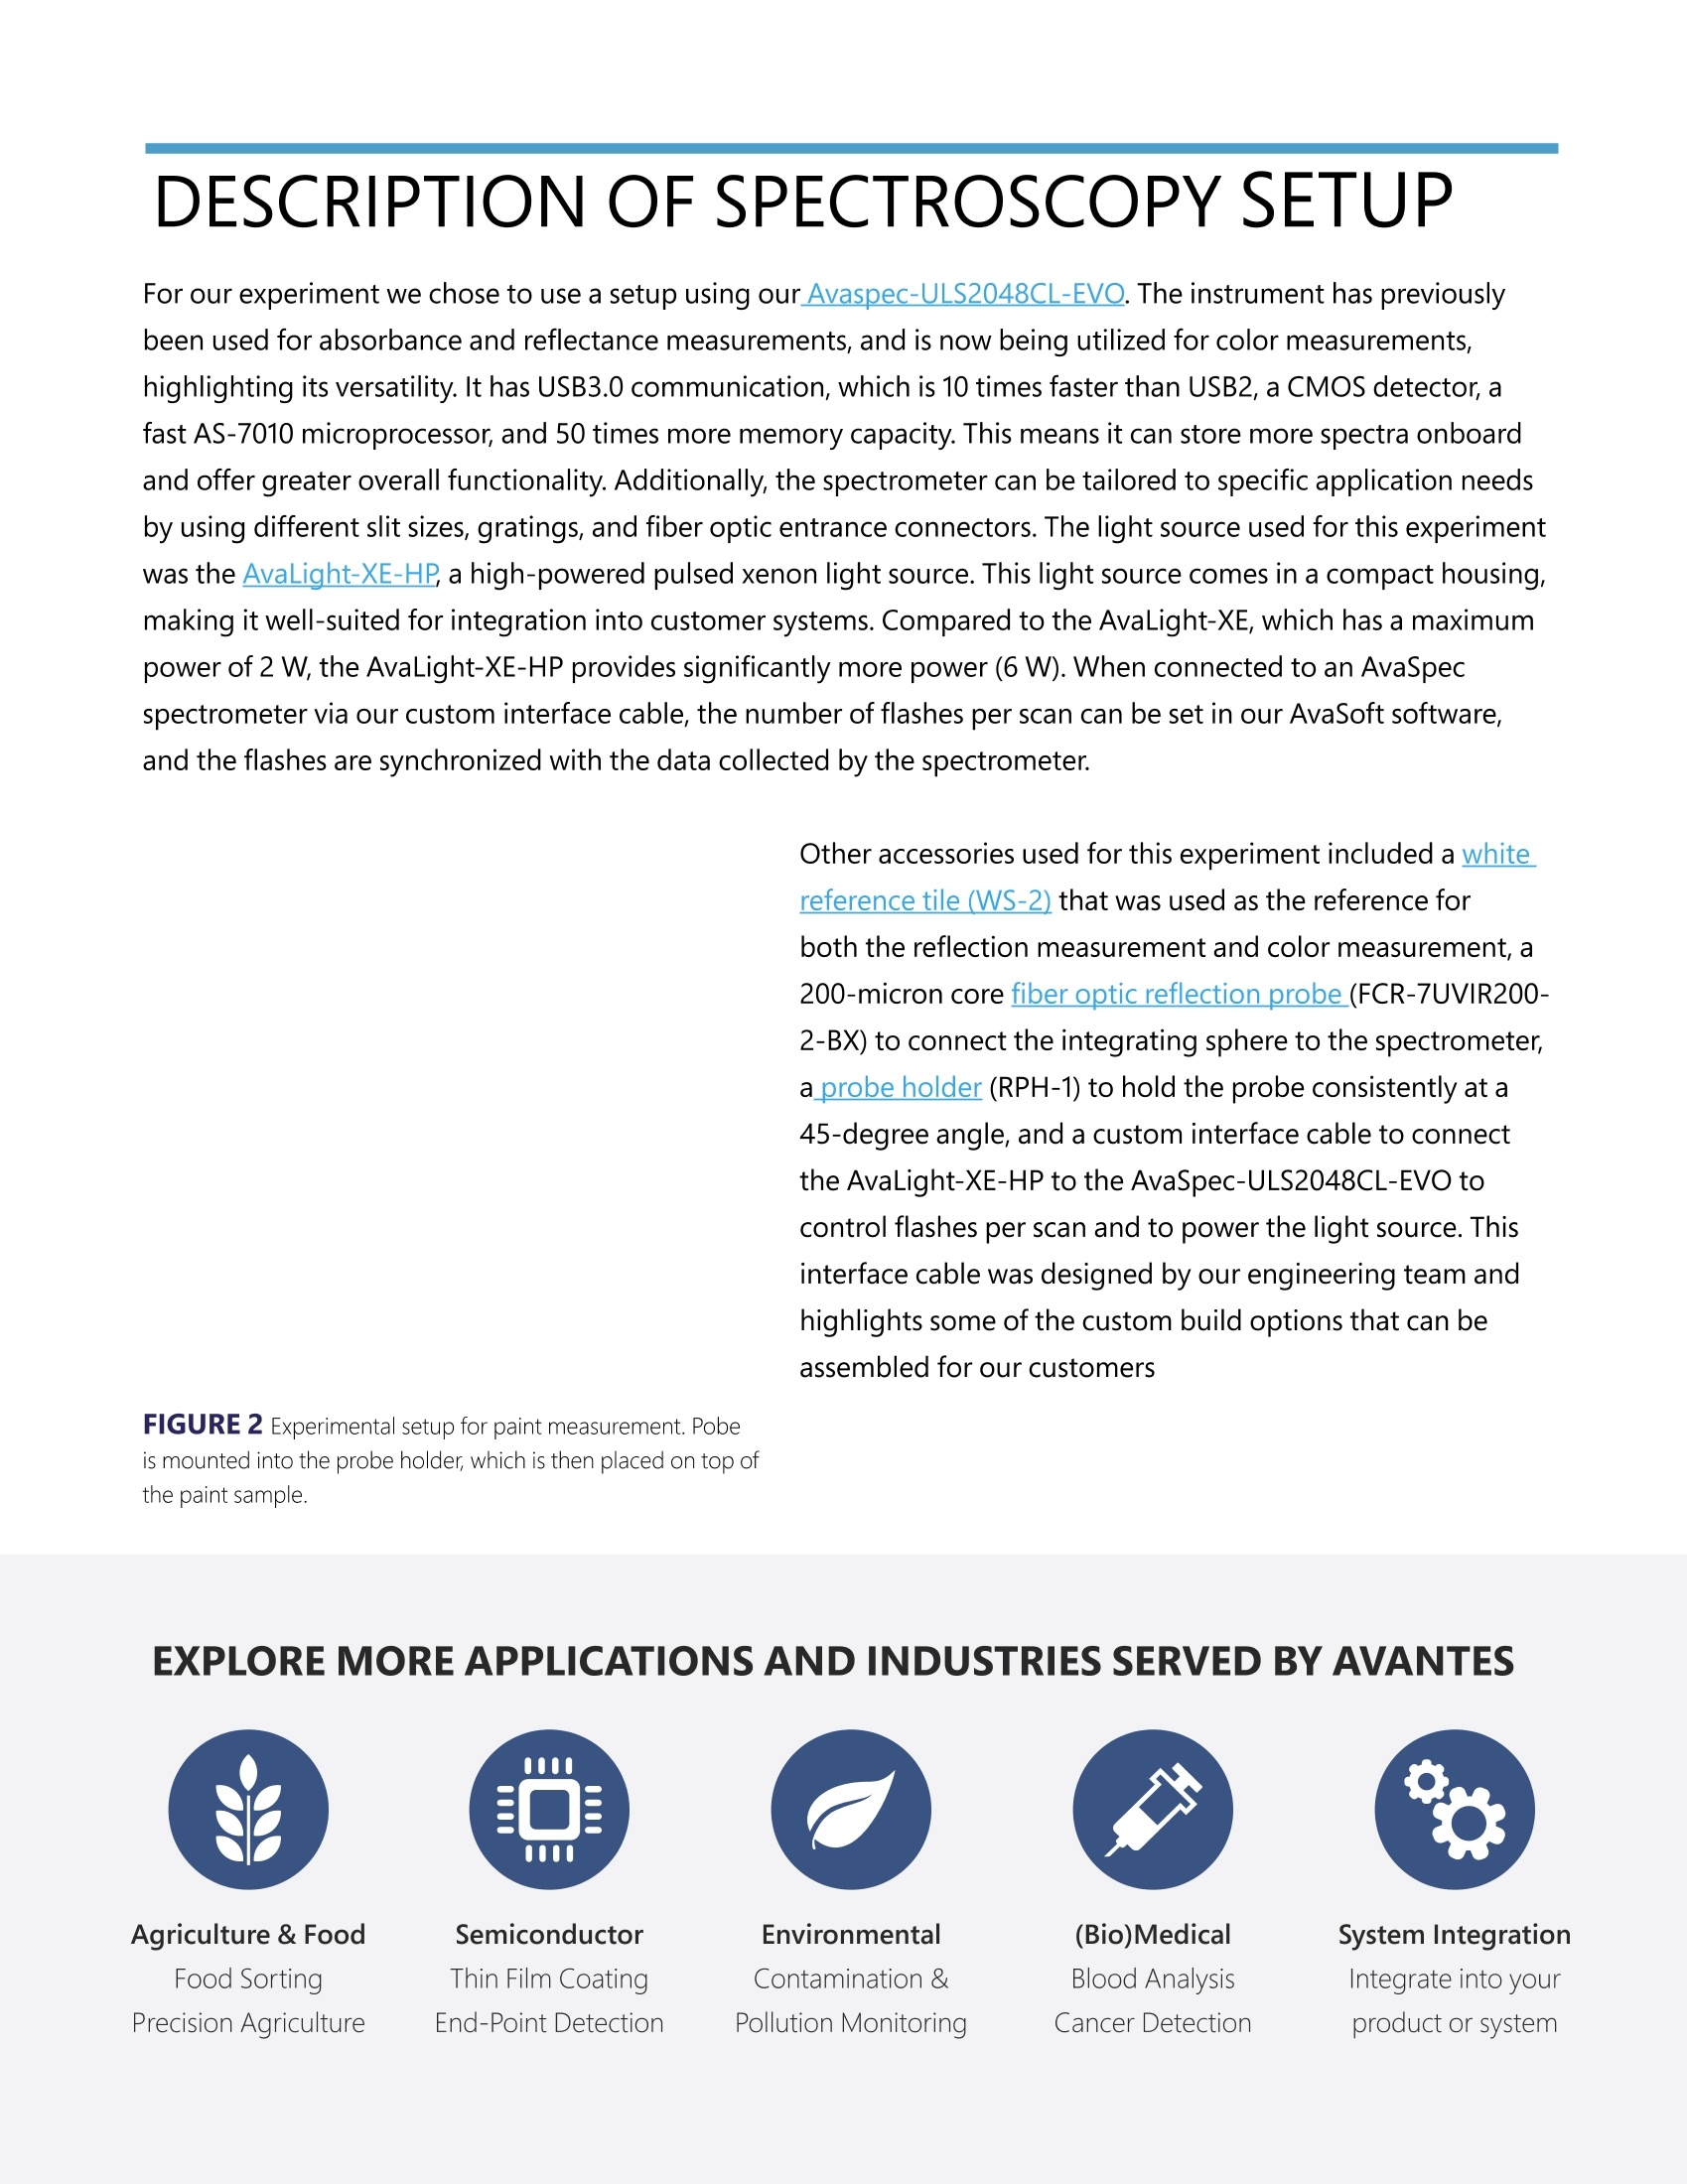
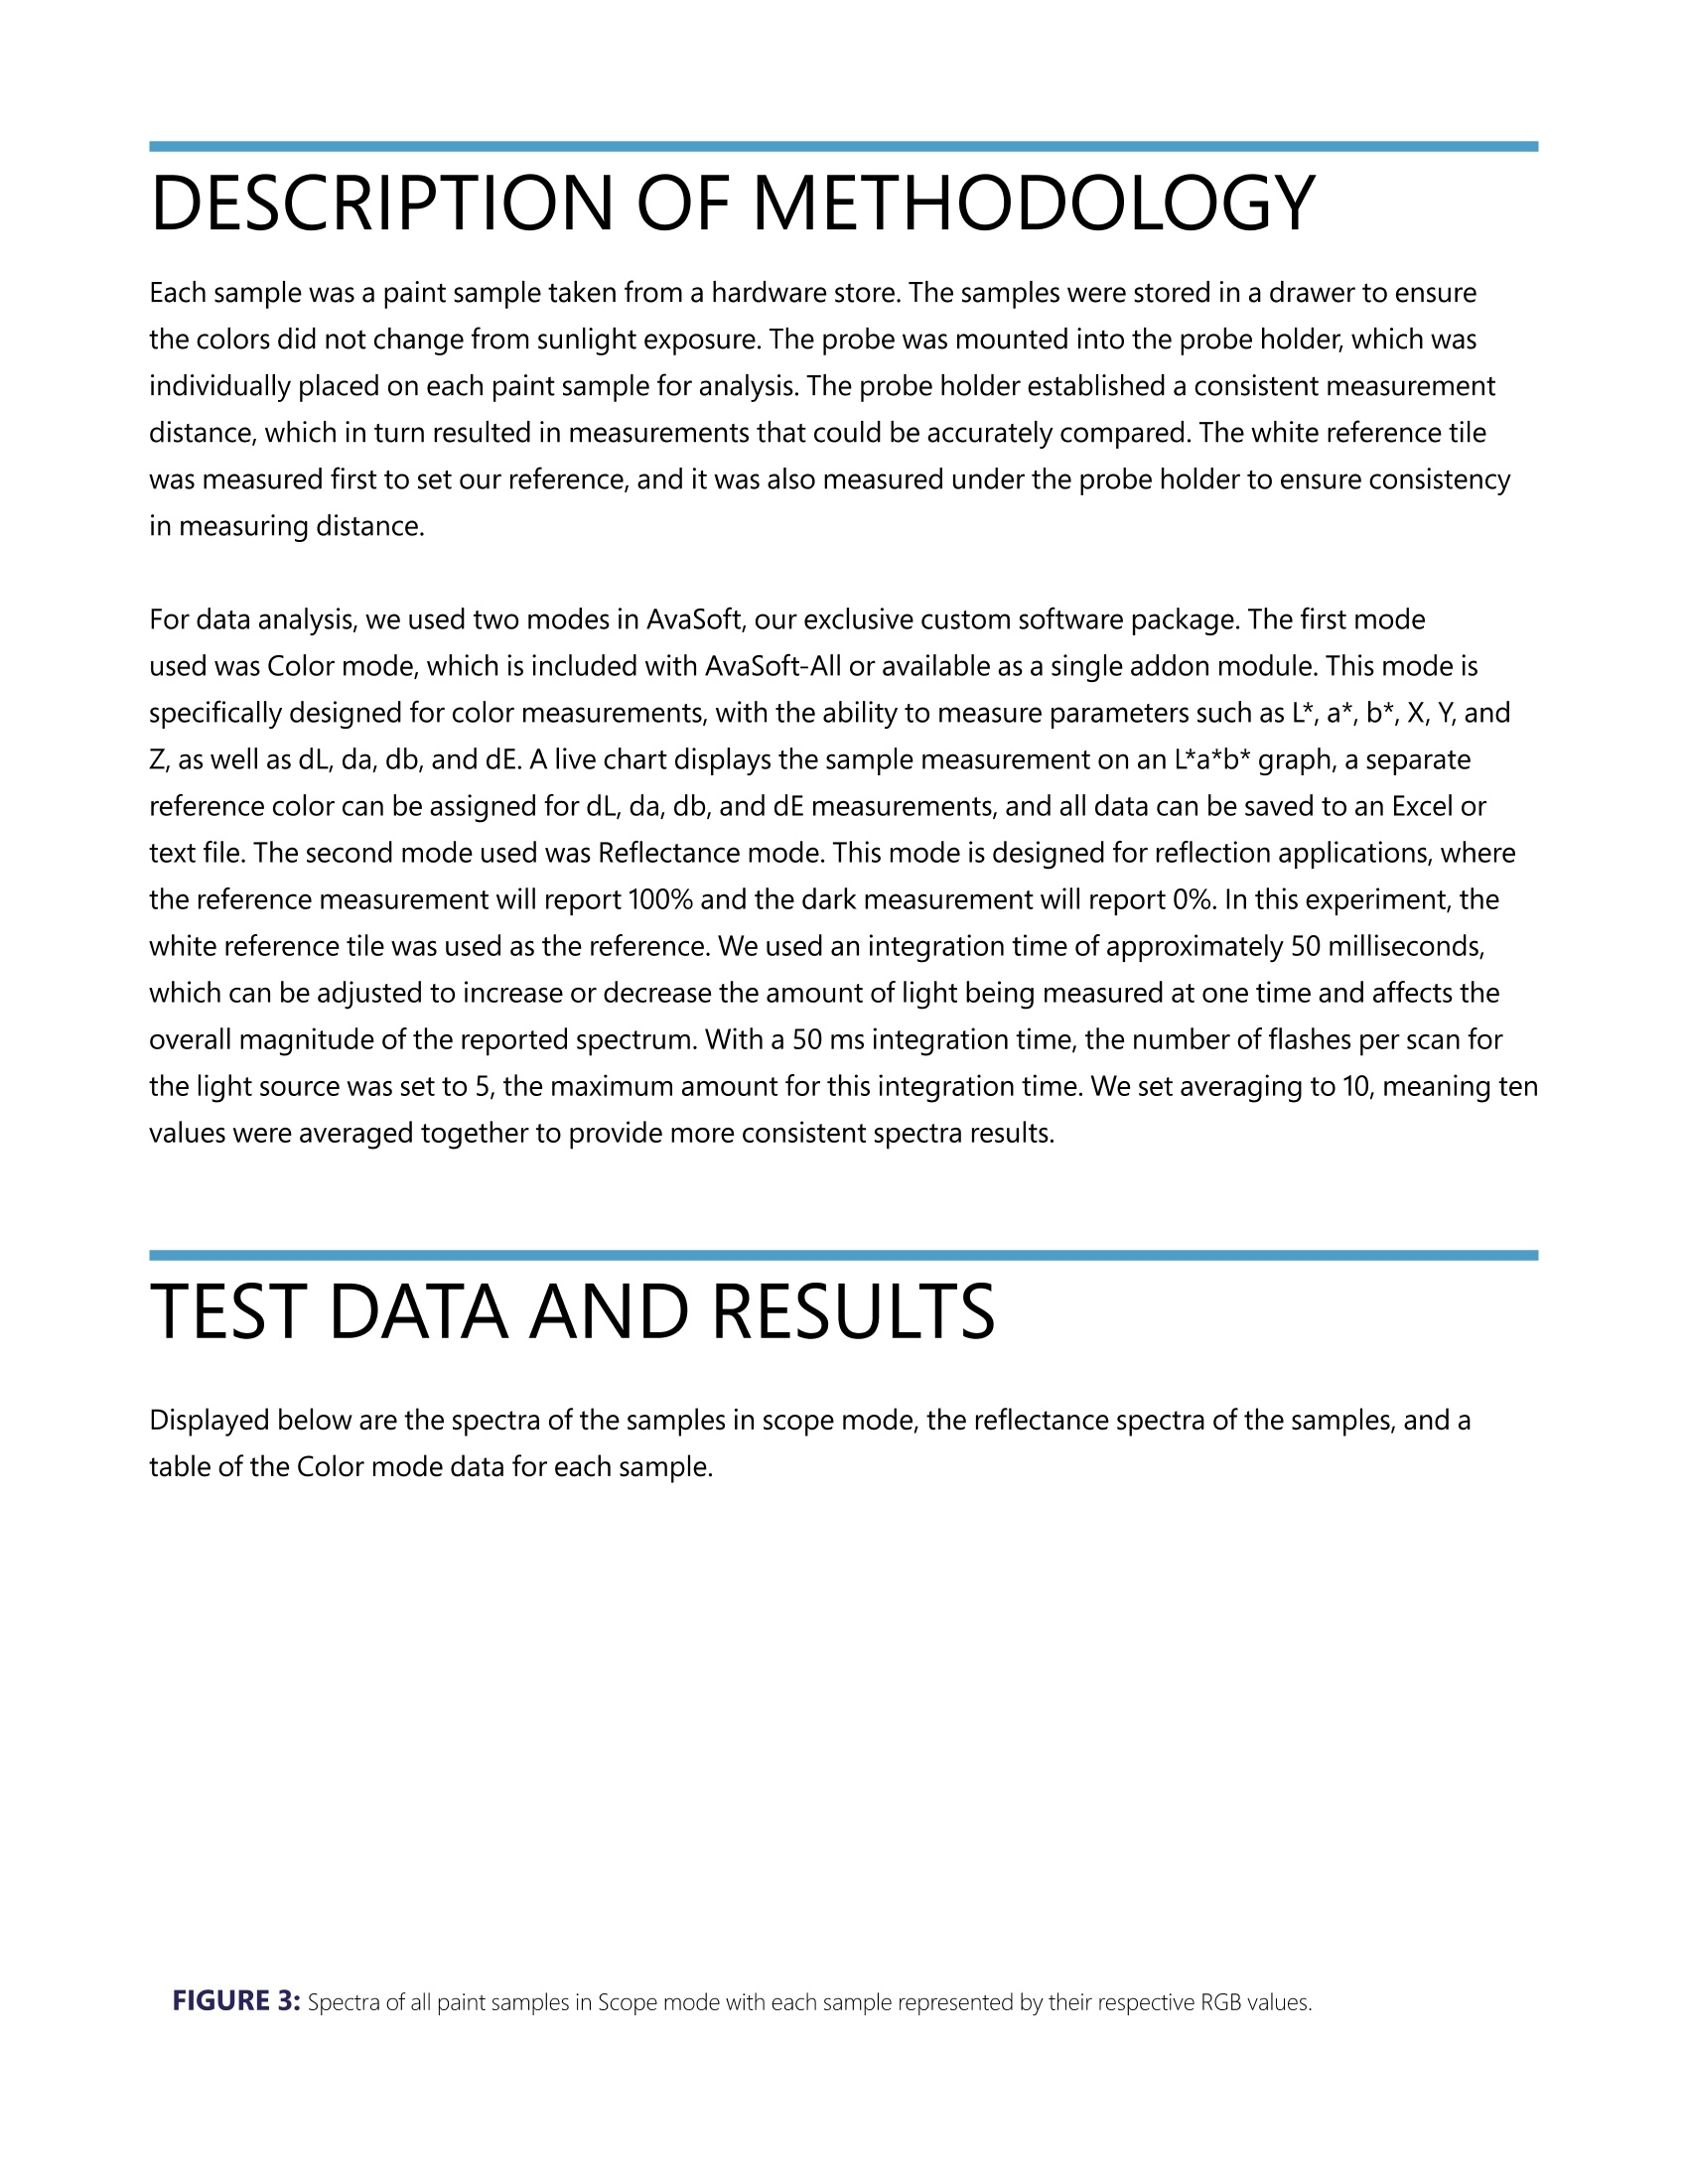
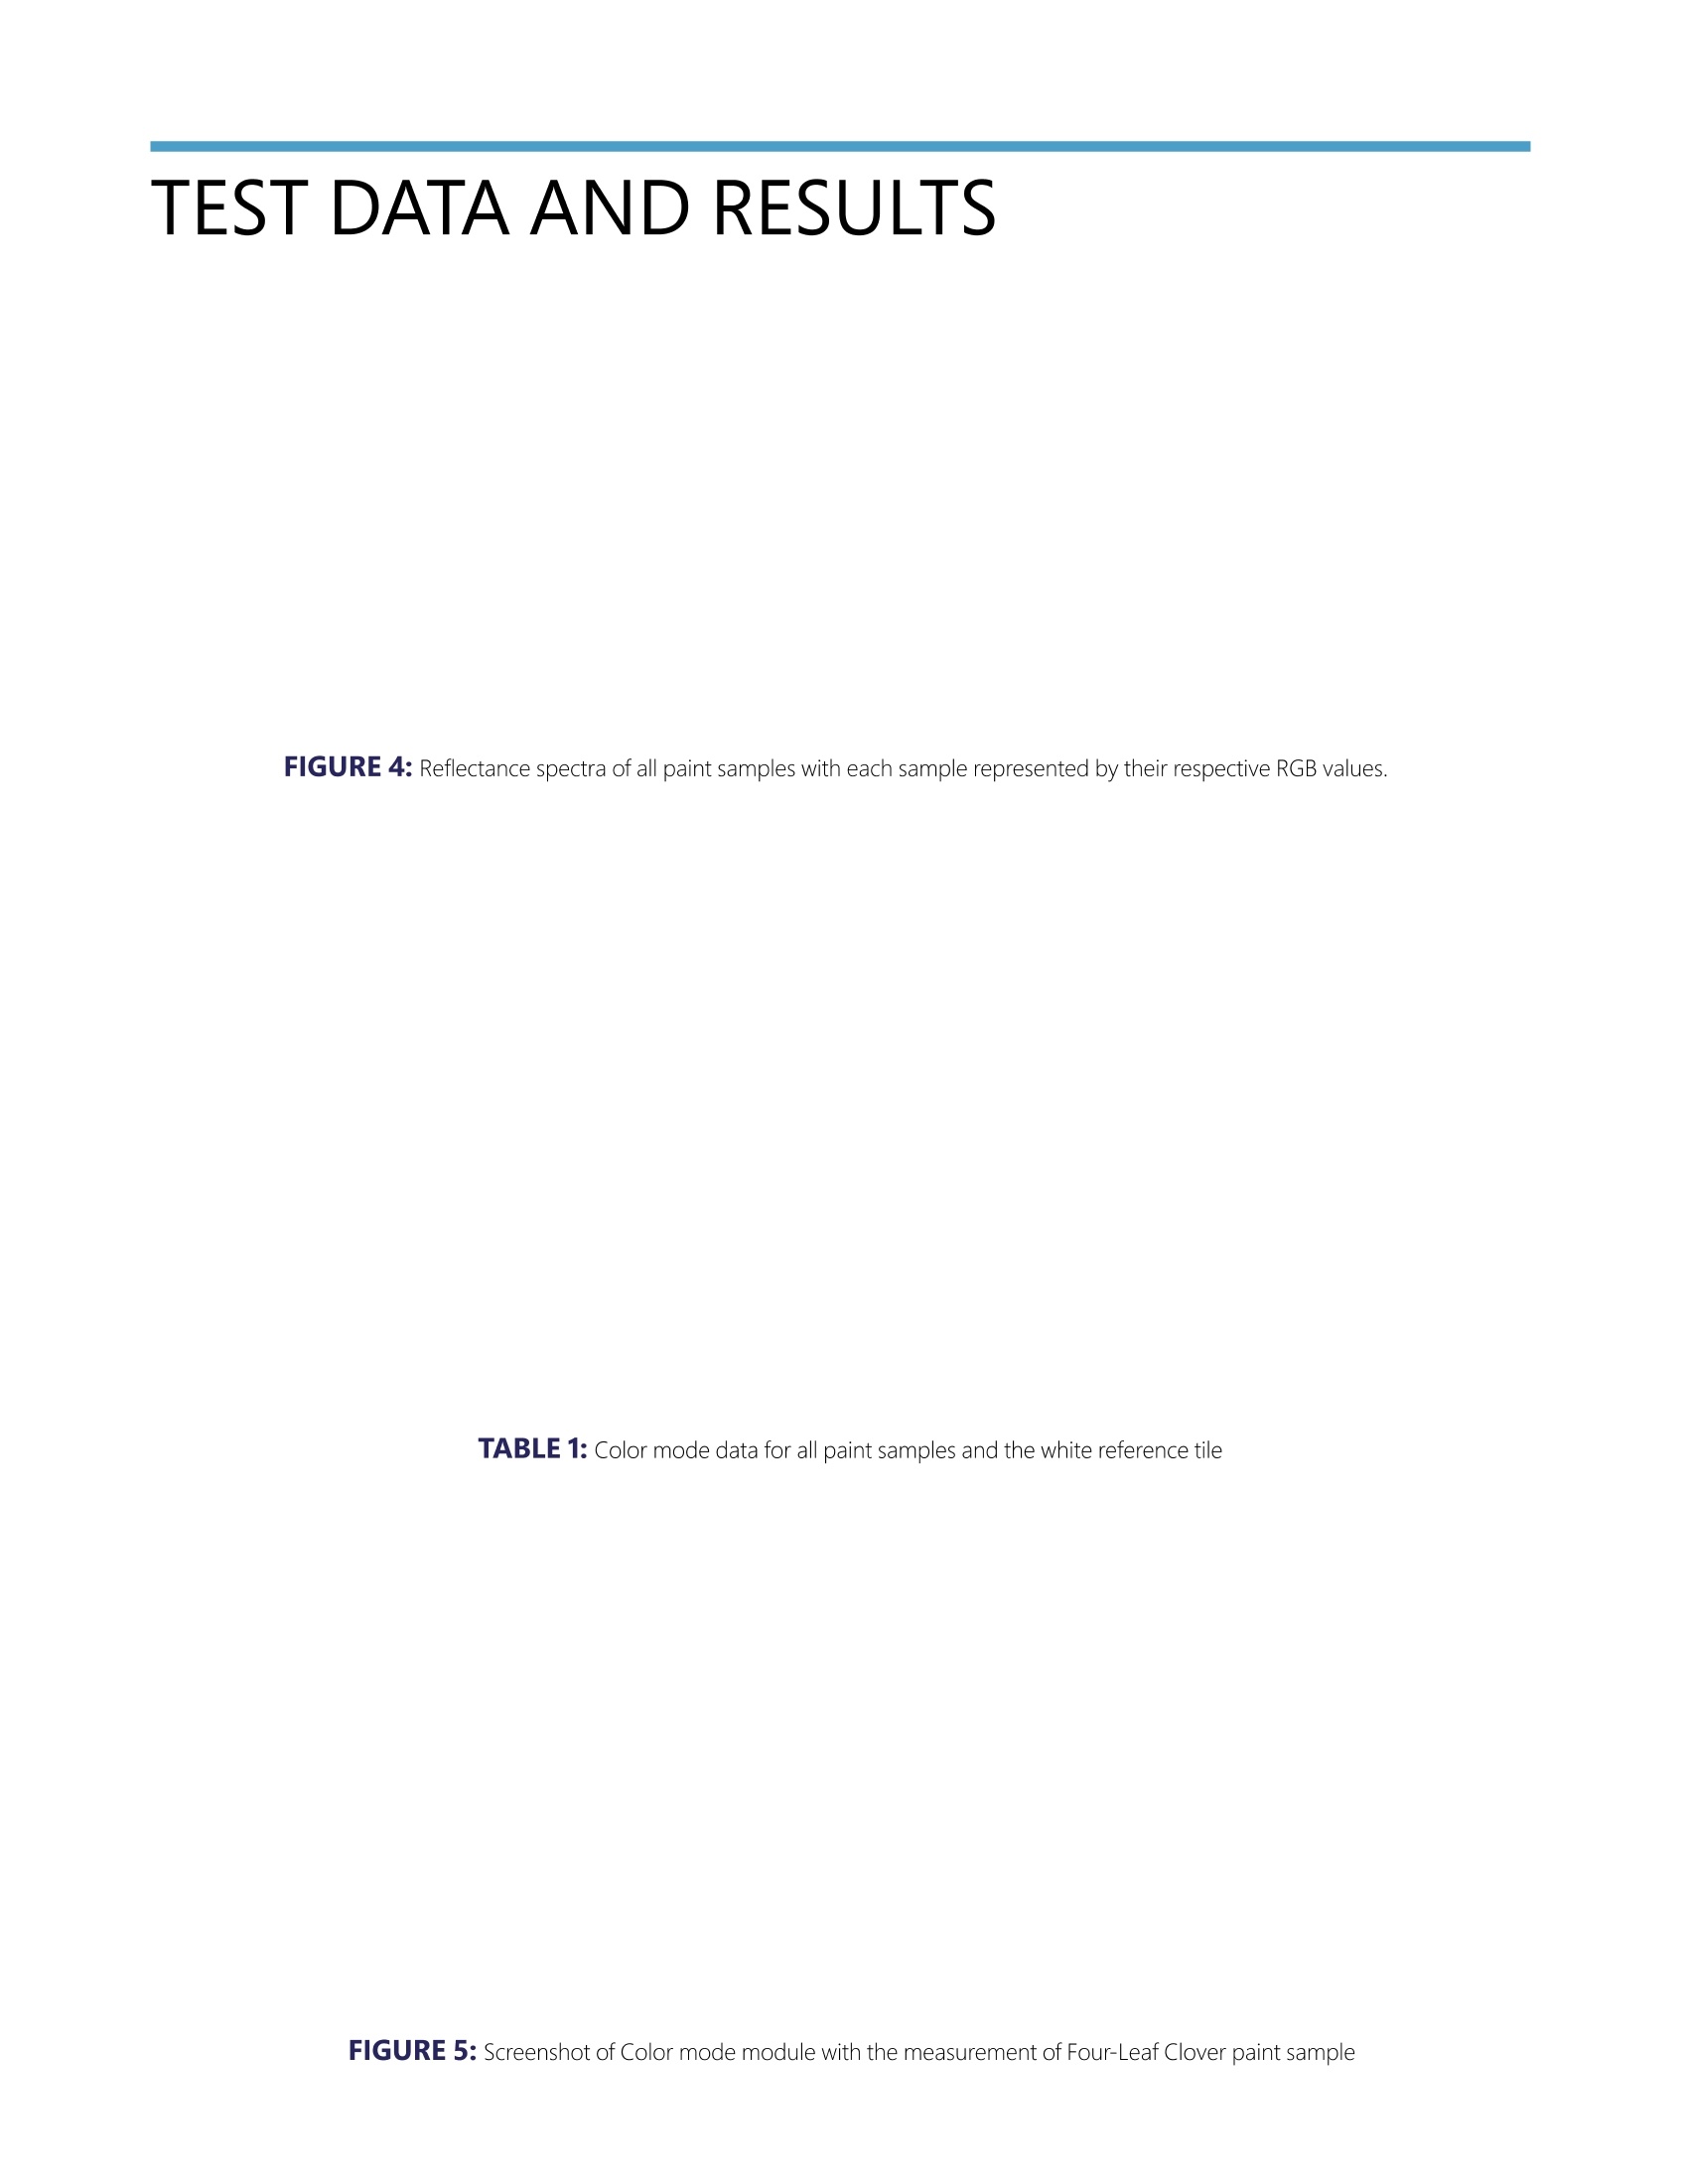
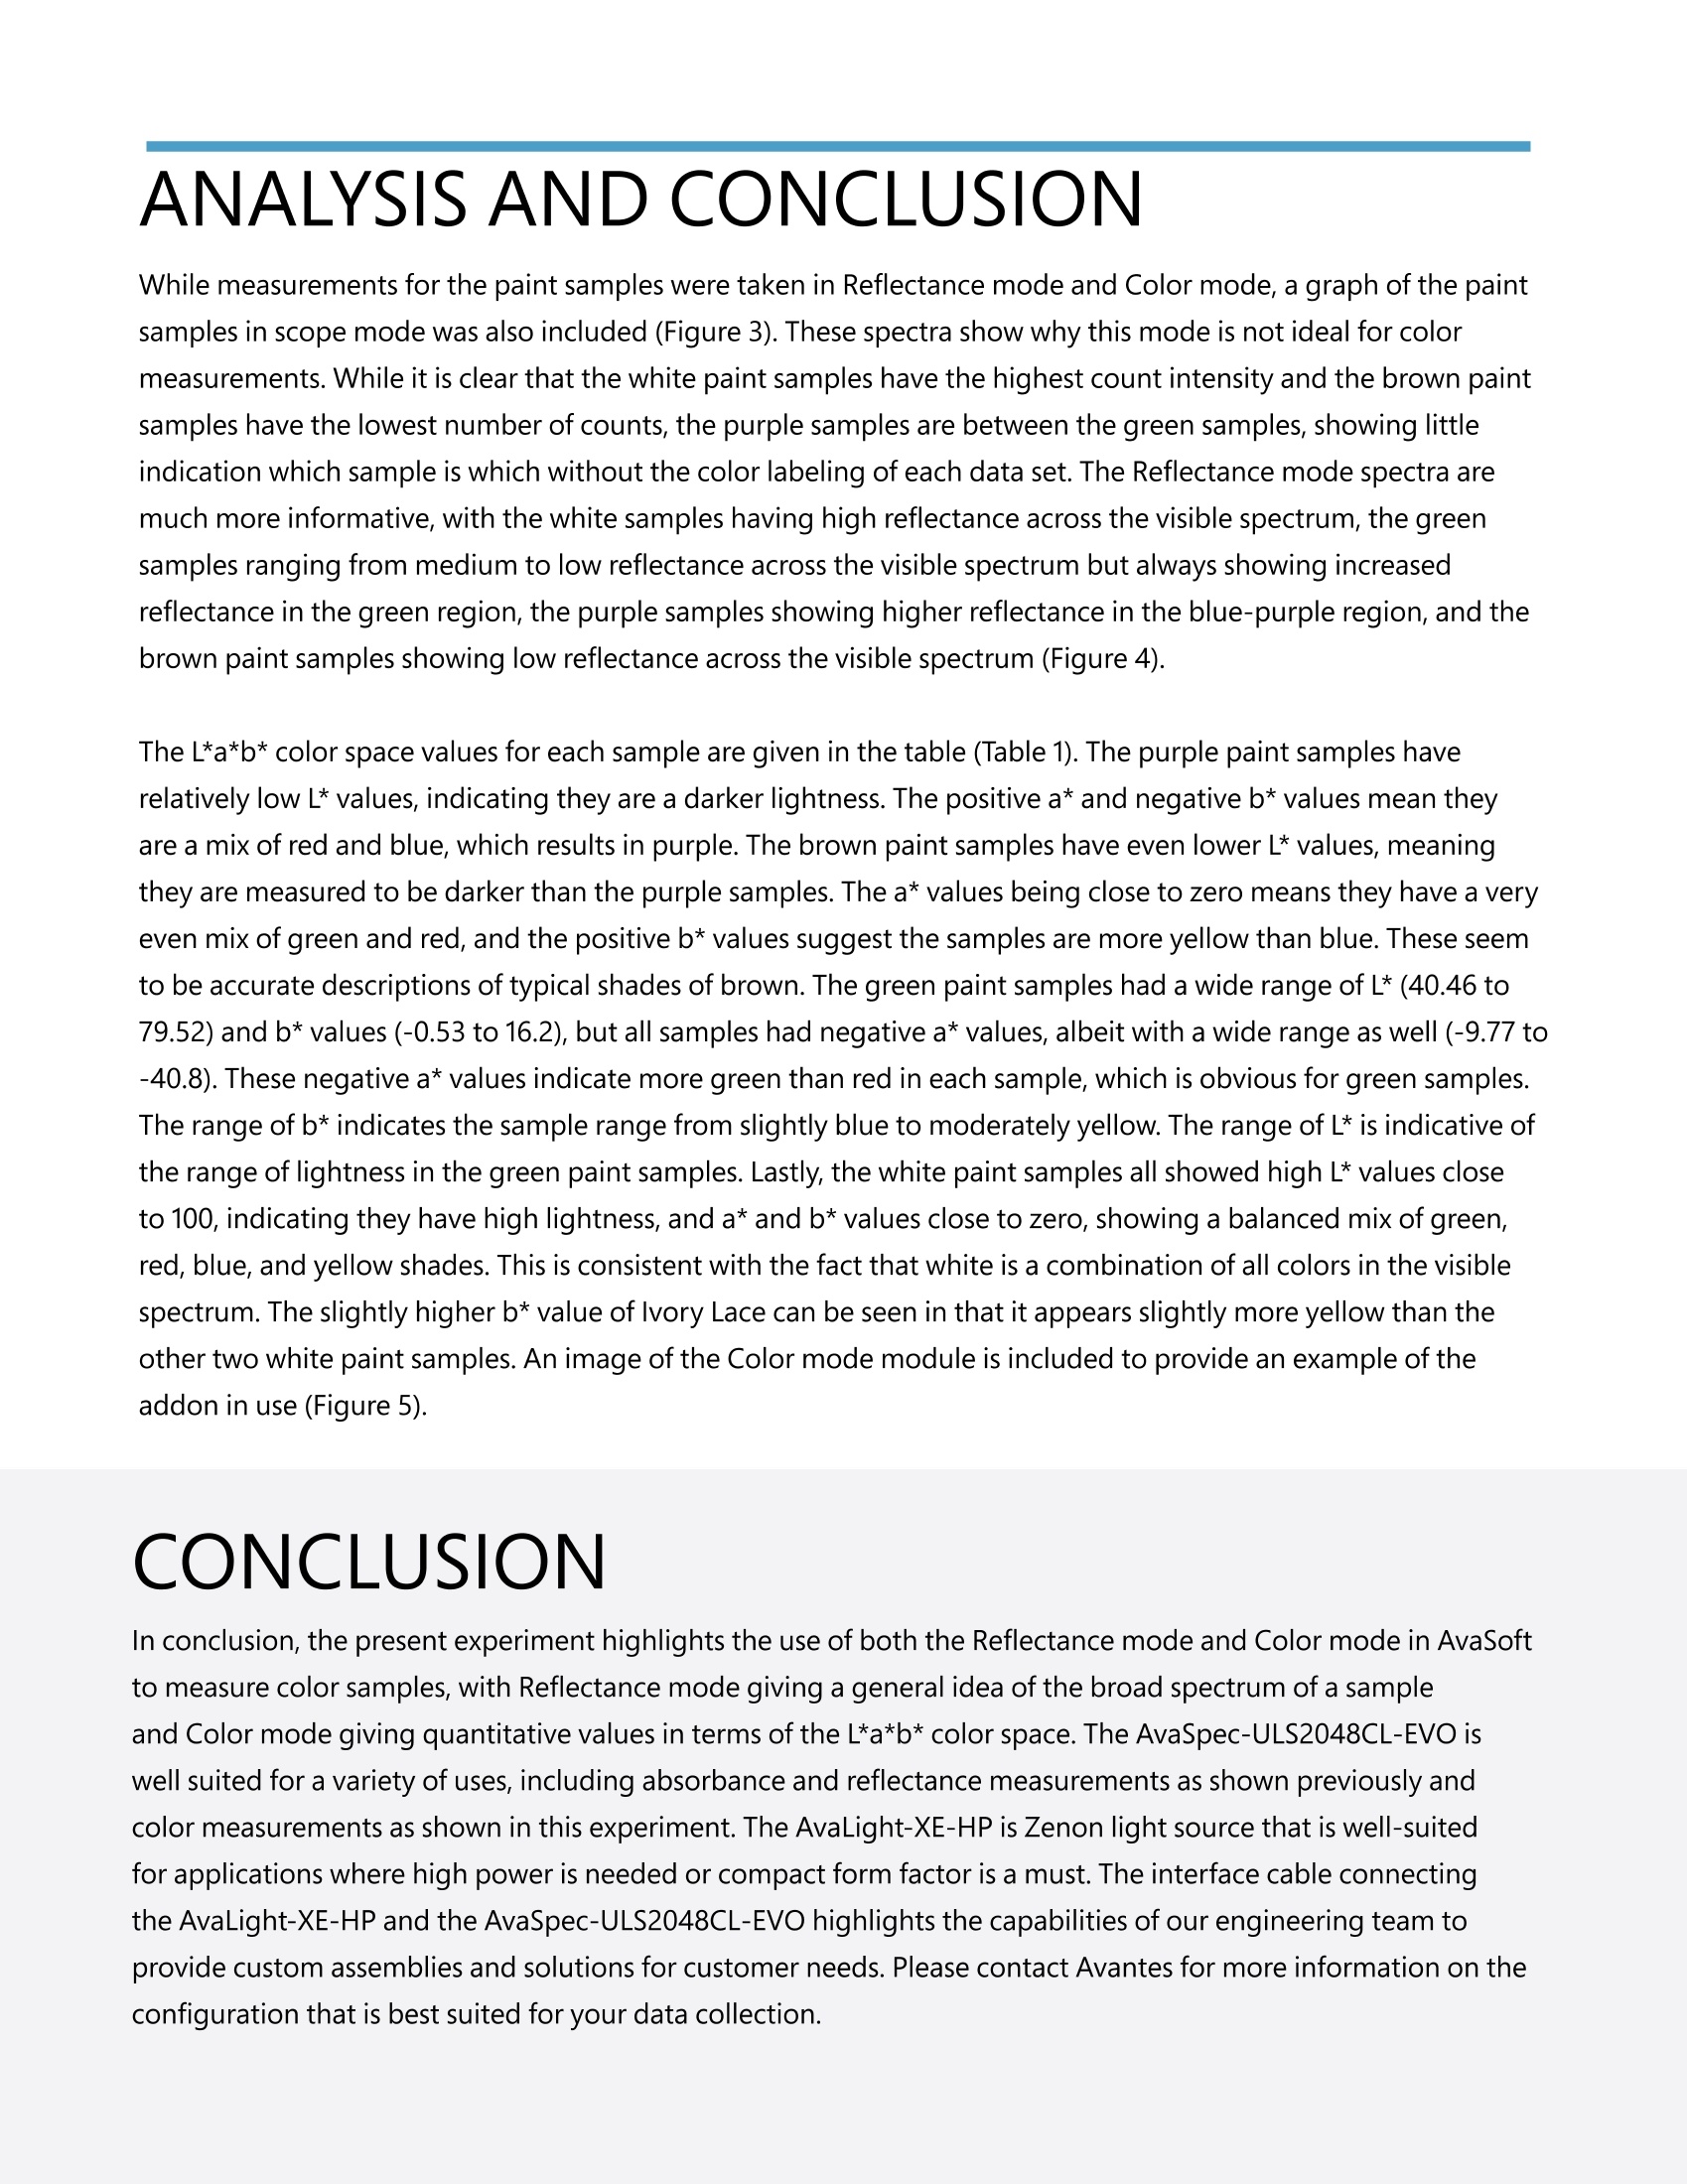
实验背景比色法是一种通过样品吸收、透射或反射光的强度和波长来量化物体颜色的测量方法。通常用RGB(红-绿-蓝)表示,也可以用HEX和L*a*b*表示。L*a*b*色彩空间最初为国际照明委员会(CIE)定义的,其中L*定义了从黑色(0)到白色(100)的亮度,a*定义了绿色(-128)到红色(+127)的亮度,b*定义了蓝色(-128)到黄色(+127)的亮度。L*a*b*任何值的一个单位变化都对应视觉上感知的颜色变化。AVANTES实验目的图1:用于实验的白色参考瓦和油漆样品从左到右为:白色参考瓦,蓝灰烬色,梅林长袍色,土壤深处色,贡多拉色,四叶草色,薄荷色,冷蓝草色,绿水色,凤凰泪色,薄荷雾色,极地白色,牙白色和夏灰色本实验旨在测量13种不同油漆样品的L*a*b*色彩空间值,包括两个紫色类样品(“蓝灰烬色”和“梅林长袍色”),两个棕色类样品(“土壤深处色”和“贡多拉色”),三个白色类样品(“极地白色”,“牙白色”和“夏灰色”)和六个绿色类样品(“四叶草色”,“薄荷色”,“冷蓝草色”,“绿水色”,“凤凰泪色”和“薄荷雾色”)。白色参考瓦将被用作白参考材料,测量将在可见(VIS)光谱范围内进行。AVANTES实验仪器实验中使用的光谱仪为Avaspec-ULS2048CL-EVO,作为一款通用光谱仪,它不仅可以用于吸光度测量,反射率测量,也可以用于颜色测量。它采用了我们功能强大的 AS-7010 电路板,提供 USB3.0 通信接口,数据传输速度比 USB2.0 快 10 倍。实验使用的光源为AvaLight-XE-HP,一种大功率的脉冲氙灯光源,功率为6w。这种光源尺寸迷你,非常适合集成到系统中使用。图2:实验测量仪器本实验使用的其他附件:白色参考瓦(WS-2),作为反射测量和颜色测量的白参考;200微米纤芯的反射探头(FCR-7UVIR200-2-BX),用于连接积分球和光谱仪;探头支架(RPH-1),使探头保持45度角;以及一根特制接口电缆,可以将AvaLight-XE-HP连接到AvaSpec-ULS2048CL-EVO,以控制扫描闪烁并为光源供电。AVANTES实验方法所有样品皆为五金店中售卖的油漆样品,它们被存放在一个抽屉里,避免颜色因阳光的照射而改变。反射探头被安装在支架上,单独放置在每个油漆样品上方并与样品保持一定的测量距离,我们在测量白色参考瓦时保持了同样的距离以确保实验的一致性。图3:四叶草色的油漆样品在颜色测量模式下的截图数据分析模块使用了AVANTES的定制软件包AvaSoft中的两种模式。第一种模式为颜色测量模式,它包含在AvaSoft-All中或作为单个模块。该模式专为颜色测量而设计,能够测量L*, a*, b*, X,Y,Z等参数,以及dL, da, db和dE。测量图表实时显示样品L*a*b*,还可以为dL, da, db和dE测量配置单独的参考颜色,所有数据都可以保存到Excel或文本文档中。第二种模式为反射率测量模式。此模式专为反射应用而设计。本实验选用白色参考瓦作为白参考。我们将积分时间设置为50ms,平均次数设为10,光源每次扫描的闪烁次数设为5次(积分时间可以调整以增加或减少一次测量的光量,并影响结果光谱的总体大小。平均次数为10表示得到的光谱值为10个值平均在一起后的结果,可以使光谱结果值更一致。)AVANTES实验结果下文列出的是样品在Scope模式下的光谱,样品的反射光谱,以及每个样品在颜色测量模式下的数据。图4:所有油漆样品在Scope模式下的光谱,谱线颜色对应油漆样品颜色很显然,单一的Scope模式并不适合测量颜色。尽管白色类油漆样品的Scope模式强度高,棕色类油漆样品的强度低,但紫色类油漆样品的强度介于绿色类油漆样品之间,如果每个样品的光谱线没有标出颜色便难以区分。图5:所有油漆样品在反射率模式下的光谱,谱线颜色对应样品颜色反射率模式提供的光谱信息要丰富得多,白色样品在可见光谱上具有高反射率,绿色样品在可见光谱上的反射率从中到低不等,但在绿色区域反射率升高,紫色样品在蓝紫色区域反射率较高,棕色样品在可见光谱上具有低反射率(图5)。表1:所有油漆样品和白色参考瓦在颜色测量模式下的L*a*b*数据每个样品的L*a*b*色彩空间值如表1所示。紫色类油漆样品的L*值相对较低,说明其亮度较暗。a*值为正b*值为负,说明它们是红色和蓝色的混合为紫色。棕色类油漆样品的L*值更低,说明它们比紫色样品更暗。a*值接近于零表明绿色和红色的混合非常均匀,而正b*值表明样品的黄色多于蓝色,这些都是对典型棕色的准确描述。绿色类油漆样品的L*值(40.46~ 79.52)和b*值(-0.53 ~16.3)的范围很广,但所有样品的a*值都为负 (-9.77 ~-40.8)。这些负a*值表示每个样品中的绿色多于红色。最后,白色类油漆样品都显示出接近100的高L*值,表明它具有高亮度,a*和b*值接近于零,表明绿色,红色,蓝色和黄色混合均匀,这与白色是可见光谱中所有颜色的组合这一事实是一致的。牙白色的b*值略高,表明相对其他两种白色油漆样品来说,它略偏黄色。AVANTES实验结论本实验使用AvaSoft反射率测量模式和颜色测量模式,反射率测量模式给出了样品的广谱概念,颜色测量模式给出了L*a*b*色彩空间的定量值。实验中使用的光谱仪为AvaSpec-ULS2048CL-EVO,它的应用领域广泛,适用于吸光度和反射率测量以及本实验中所示的颜色测量。实验中光源为AvaLight-XE-HP,适合需要高功率或集成应用。 IN-HOUSE EXPERIMENT EXAMINING ACCURACY AND RELIABILITY OF SPEC -TROSCOPY & COLORIMETRY FOR COLOR ANALYSI S CONDUCTED BY KURT AMEKU INTR O BACKGROUND INFORMATION APPLICATION Colorimetry is a measurement method used to quantify the color of a substance or object by the intensity and wavelength of light absorbed, transmitted, or reflected by the sample. This is often expressed in terms of the RGB (red-green-blue) scale but can also be represented in HEX scale and L*a*b*. The L*a*b* color space was originally defined by the International Commission on I llumination (CIE) in 1976, with L* defining lightness from black (0) to white (100), a* defining green (-128) to red (+127) and b* defining blue (-128) to yellow (+127). These values were defined such that a one unit change in any value would roughly correspond to a visually perceived change in color. FIGURE 1 Paint samples and reference tile used for the experiment (from l eft to right: white reference tile, Blue Ember, Merlin's Robes, Deep Earth,Gondola, Four-Leaf Clover, Deep Mint, Cool Bluegrass, Green Water, Phoenix Tears, Spearmint Haze, Polar White, Ivory Lace, and Summer Gray). This experiment aims to measure the color values with respect to the L*a*b* color space of 13 different paint samples,including two purple samples ('Blue Ember and'Merlin's Robes'), two brown samples (Deep Earth and Gondola), three white samples (Polar White, Ivory Lace and Summer Gray), and six green samples (Four-Leaf Clover, Deep Mint, Cool Bluegrass,Green Water, Phoenix Tears, and Spearmint Haze) (Figure 1). A white reference tile will be used as a reference material.Measurements will be taken in the visible (VIS) spectral range to purely compare color differences and not differences in the ultraviolet or infrared spectra. DESCRIPTION OF SPECTROSCOPY SETUP For our experiment we chose to use a setup using our Avas p ec-ULS2048CL-EVO . The instrument has previously been used for absorbance and reflectance measurements, and is now being utilized for color measurements,highlighting i ts versatility. It has USB3.0 communication, which is 10 times faster than USB2, a CMOS detector, a fast AS-7010 microprocessor, and 50 times more memory capacity. This means it can store more spectra onboard and offer greater overall functionality. Additionally, the spectrometer can be tailored to specific application needs by using different slit sizes, gratings, and fiber optic entrance connectors. The l ight source used for this experiment was the Ava L ight-XE-HP a high-powered pulsed xenon light source. This light source comes in a compact housing,making i t well-suited for integration i nto customer systems. Compared to the AvaLight-XE, which has a maximum power of 2 W, the AvaLight-XE-HP provides significantly more power (6W). When connected to an AvaSpec spectrometer via our custom interface cable, the number of flashes per scan can be set in our AvaSoft software,and the flashes are synchronized with the data collected by the spectrometer. FIGUR E 2 Experimental setup f or pain t measurement. P obe i s mou n ted into the probe h ol d er , w hi ch is t h en placed on t op of t h e paint sample. Other accessories used for this experiment i ncluded a white reference t il e (WS -2) that was used as the reference for both the reflection measurement and color measurement, a 200-micron core fi b er optic r eflection probe (FCR-7UVIR200-2-BX) to connect the integrating sphere to the spectrometer,a_probe holder (RPH-1) to hold the probe consistently at a 45-degree angle, and a custom interface cable to connect the AvaLight-XE-HP to the AvaSpec-ULS2048CL-EVO to control flashes per scan and to power the light source. This interface cable was designed by our engineering team and highlights some of the custom build options that can be assembled for our customers EXPLORE MORE APPLICATIONS AND INDUSTRIES SERVED BY AVANTES Agriculture & Food F ood So r t in g Semiconductor Th in Film Coa t ing E n d-Point Detect i on Environmental P rec i sio n Agr i c ul t ur e Co n tami n at i on &Pollutio n Monito rin a (Bio)Medical Blood Analysis Ca n c er Detect i on System Integration In t egra t e into y our p rodu ct or sys t em DESCRIPTION OF METHODOLOGY Each sample was a paint sample taken from a hardware store. The samples were stored in a drawer to ensure the colors did not change from sunlight exposure. The probe was mounted into the probe holder, which was individually placed on each paint sample for analysis. The probe holder established a consistent measurement distance, which i n turn resulted in measurements that could be accurately compared. The white reference tile was measured first to set our reference, and it was also measured under the probe holder to ensure consistency in measuring distance. For data analysis , we used two modes in AvaSoft, our exclusive custom software package. The f irst mode used was Color mode, which is included with AvaSoft-All or available as a single addon module. This mode is specifically designed for color measurements, with the ability to measure parameters such as L*, a*, b*,X, Y,and Z, as well as dL, da,db, and dE. A live chart displays the sample measurement on an L*a*b* graph, a separate reference color can be assigned for dL, da, db, and dE measurements, and all data can be saved to an Excel or text file. The second mode used was Reflectance mode. This mode i s designed for reflection applications , where the reference measurement wil l report 100% and the dark measurement will report 0%. In this experiment, the white reference tile was used as the reference. We used an integration time of approximately 50 milliseconds,which can be adjusted to increase or decrease the amount of light being measured at one time and affects the overall magnitude of the reported spectrum. With a 50 ms integration time, the number of flashes per scan for the light source was set to 5, the maximum amount for this i ntegration time. We set averaging to 10, meaning ten values were averaged together to provide more consistent spectra results. TEST DATA AND RESULTS Displayed below are the spectra of the samples in scope mode, the reflectance spectra of the samples, and a table of the Color mode data for each sample. 65000 Wavel e ngth [nm) FI GURE 3: Spectra of all paint samples in Scope m ode wit h each sample represented by t h eir r espective RGB values. TEST DATA AND RESULTS Wavele n g th [nm) FIGURE 4: Ref l ec t ance spec t r a of a l l p aint sample s wit h each sam p le represented by t h eir r espec t ive RGB values. Blue Ember 40.1 23.74 -41.95 Merlin's Robes 32.22 26.03 -42.83 Deep Earth 28.15 3.68 12.37 Gondola 29.24 1.5 11.77 Four-leaf Clover 40.46 -40.8 16.3 Deep Mint 46.28 -37.2 12.32 Cool Bluegrass 61.26 -19.58 4.78 Green Water 71.43 -9.77 -0.53 Phoenix Tears 73.76 -13.34 2.2 Spearmint Haze 79.52 -15.96 4.32 Polar White 101.78 -1.03 4.17 Ivory Lace 99.33 -0.72 9.15 Summer Gray 99.68 -0.59 1.49 WS-2 100.57 -0.03 -0.09 TABLE 1: Co l or m ode dat a f or all pa int sa m ples and the white r e f erence t ile Date 3/22/2023 Time 3:06:29PM Comments Four Leaf Cover L 40.4G a -40.80 b 16.30 158.23 H CX 43.94 6.32 Y 11.53 Z 7.24 Reference ID WS-2 LRef 100.57 aRef -0.03 bRef 0.09 dI 60.11 da 40.77 db 16.39 dC 74.462 Channel 2005162U1 Illuminant DG5 2 degrees FIGU R E 5: Sc r ee n shot of Color mode module with the measurement of F our-L eaf Clover pain t sa m ple ANALYSIS AND CONCLUSION While measurements for the paint samples were taken in Reflectance mode and Color mode, a graph of the paint samples in scope mode was also included (Figure 3). These spectra show why this mode is not ideal for color measurements. While it is clear that the white paint samples have the highest count intensity and the brown paint samples have the lowest number of counts, the purple samples are between the green samples, showing little indication which sample is which without the color labeling of each data set. The Reflectance mode spectra are much more i nformative, with the white samples having high reflectance across the visible spectrum, the green samples ranging from medium to low reflectance across the visible spectrum but always showing increased reflectance in the green region, the purple samples showing higher reflectance i n the blue-purple region, and the brown paint samples showing low reflectance across the visible spectrum (Figure 4). The L*a*b* color space values for each sample are given in the table (Table 1). The purple paint samples have relatively low L* values, indicat i ng they are a darker lightness. The positive a* and negative b* values mean they are a mix of red and blue, which results in purple. The brown paint samples have even lower L* values, meaning they are measured to be darker than the purple samples. The a* values being close to zero means they have a very even mix of green and red, and t he positive b* values suggest the samples are more yellow than blue. These seem to be accurate descriptions of typical shades of brown. The green paint samples had a wide range of L* (40.46 to 79.52) and b* values (-0.53 to 16.2), but al l samples had negative a* values , albeit with a wide range as well (-9.77 to -40.8). These negative a* values i ndicate more green than red i n each sample, which is obvious for green samples.The range of b* indicates the sample range from slightly blue to moderately yellow. The range of L* is i ndicative of the range of lightness in the green paint samples. Lastly, the white paint samples all showed high L* values close to 100, indicat i ng they have high lightness, and a* and b* values close to zero, showing a balanced mix of green,red, blue, and yellow shades. This is consistent with the fact that white is a combination of al l colors in the visible spectrum. The slightly higher b* value of Ivory Lace can be seen in that it appears slightly more yellow than the other two white paint samples. An image of the Color mode module is included to provide an example of the addon in use (Figure 5). CONCLUSION In conclusion, the present experiment highlights the use of both the Reflectance mode and Color mode in AvaSoft to measure color samples, with Reflectance mode giving a general idea of the broad spectrum of a sample and Color mode giving quantitative values in terms of the L*a*b* color space. The AvaSpec-ULS2048CL-EVO i s well suited for a variety of uses, including absorbance and reflectance measurements as shown previously and color measurements as shown i n this experiment. The AvaLight-XE-HP is Zenon light source that is well-suited for applications where high power is needed or compact form factor is a must. The interface cable connecting the AvaLight-XE-HP and the AvaSpec-ULS2048CL-EVO highlights the capabilities of our engineering team to provide custom assemblies and solutions for customer needs. Please contact Avantes for more information on the configuration that is best suited for your data collection. CONTAC T WE'RE HAPPY TO HELP Curious how spectroscopy can help you reveal answers by measuring all kinds of material in-line, at your production facility, in a lab, or even in the field? Visit our website or contact one of our technical experts. We are happy to help you. Avantes Headquarters Phone: +31 (0) 313 670 170 Email: info@avantes.com Website: www.avantes.com Avantes Inc. Phone: +1(303) 410 866 8 Avantes China Phone: +86 (0) 108 457 404 5 Email: info@avantes.com.cn Website: www.avantes.cn Follow us on socia l media: i n f
确定

还剩5页未读,是否继续阅读?

产品配置单

北京爱万提斯科技有限公司为您提供《如何利用光谱法测量颜色?》,该方案主要用于染料中理化分析检测,参考标准--,《如何利用光谱法测量颜色?》用到的仪器有爱万提斯2048CL-EVO光纤光谱仪、AvaLight-XE-HP高功率脉冲氙灯光源