


方案详情
文
根据欧盟饮用水指令 (EU 2020/2184) 使用在线SPE、弱阴离子交换吸附剂(DIN38407-42)结合LCMS/MS的自动化方法测定全氟碳酸和全氟磺酸。此方法在0.2– 2.0 ng/L的校准范围内确定的定量限 (LOQ)都低于1 ng/L,符合欧盟饮用水指令中对20种PFAS总量低于0.1 µg/L的要求。通过对不同来源的加标水样进行分析,证明了该方法的准确性。相对标准偏差低于10%,正确度在80% -110% 之间。
方案详情

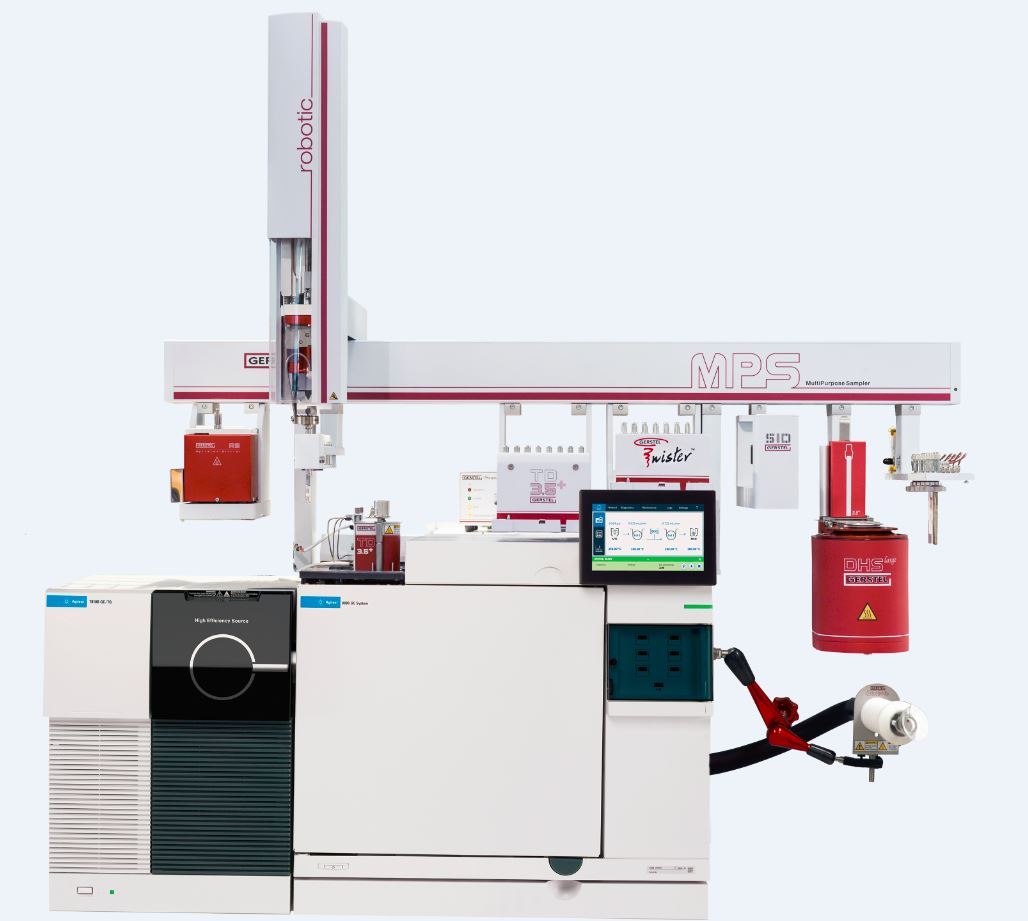
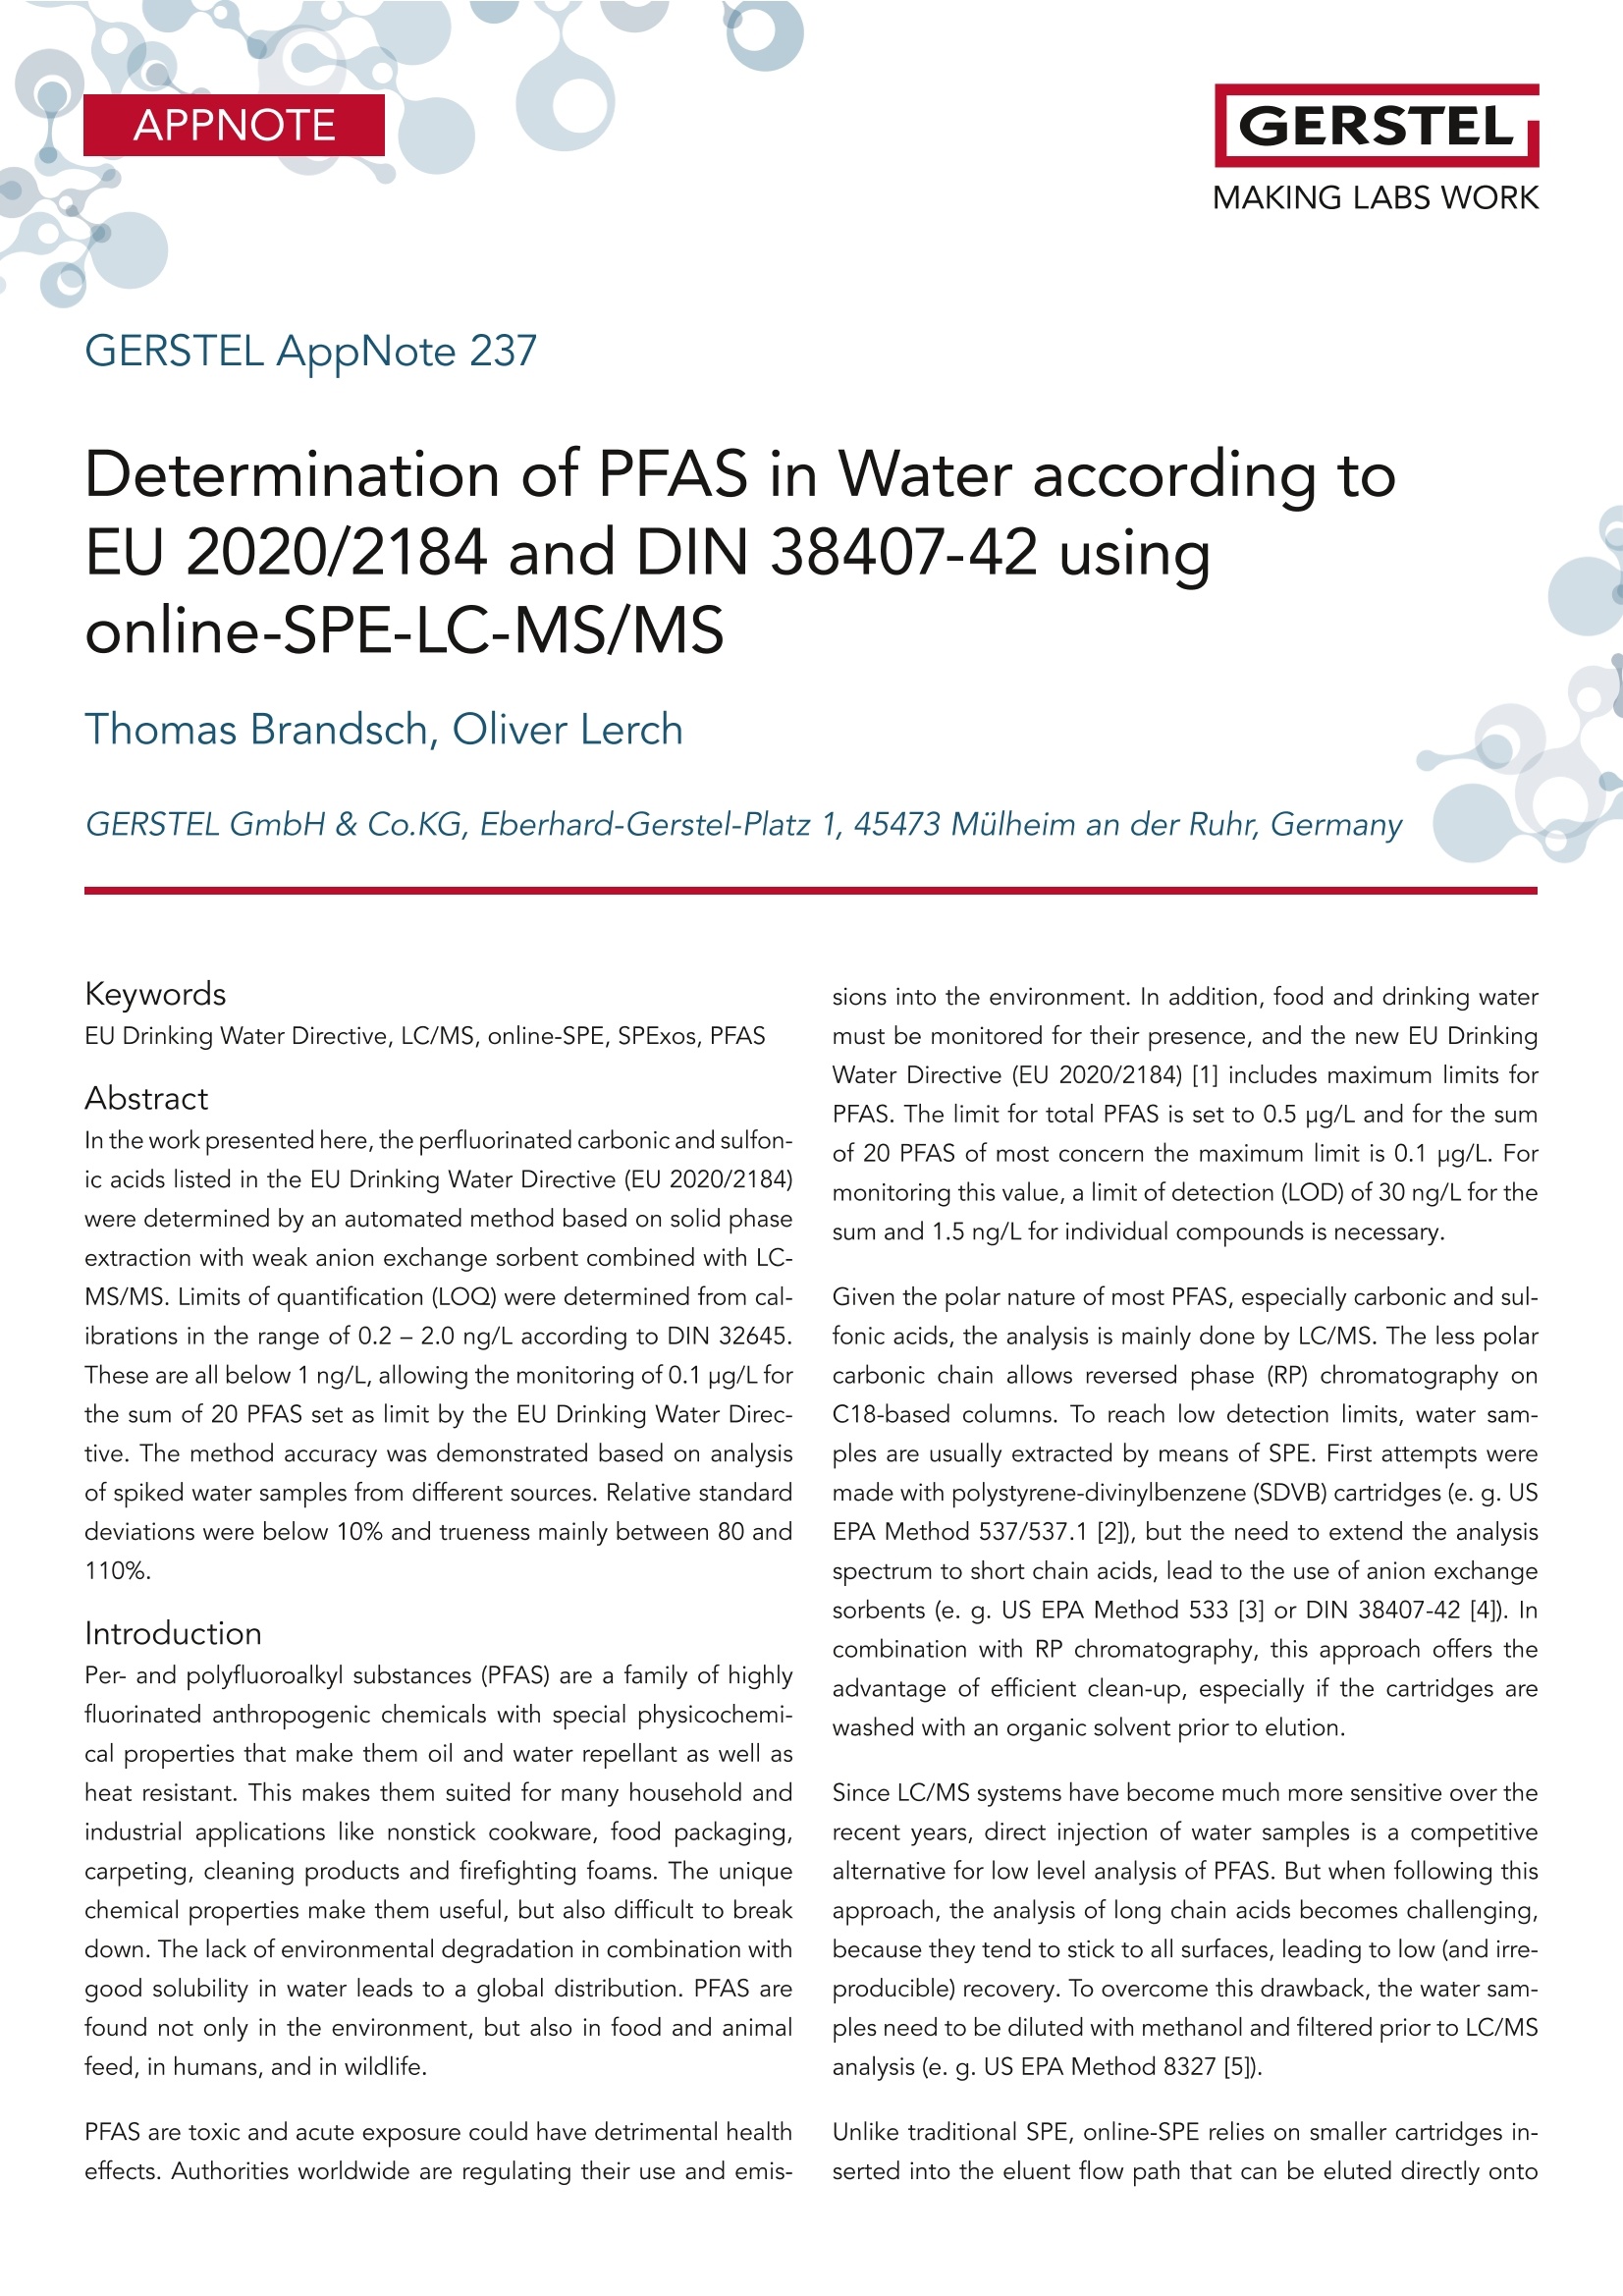
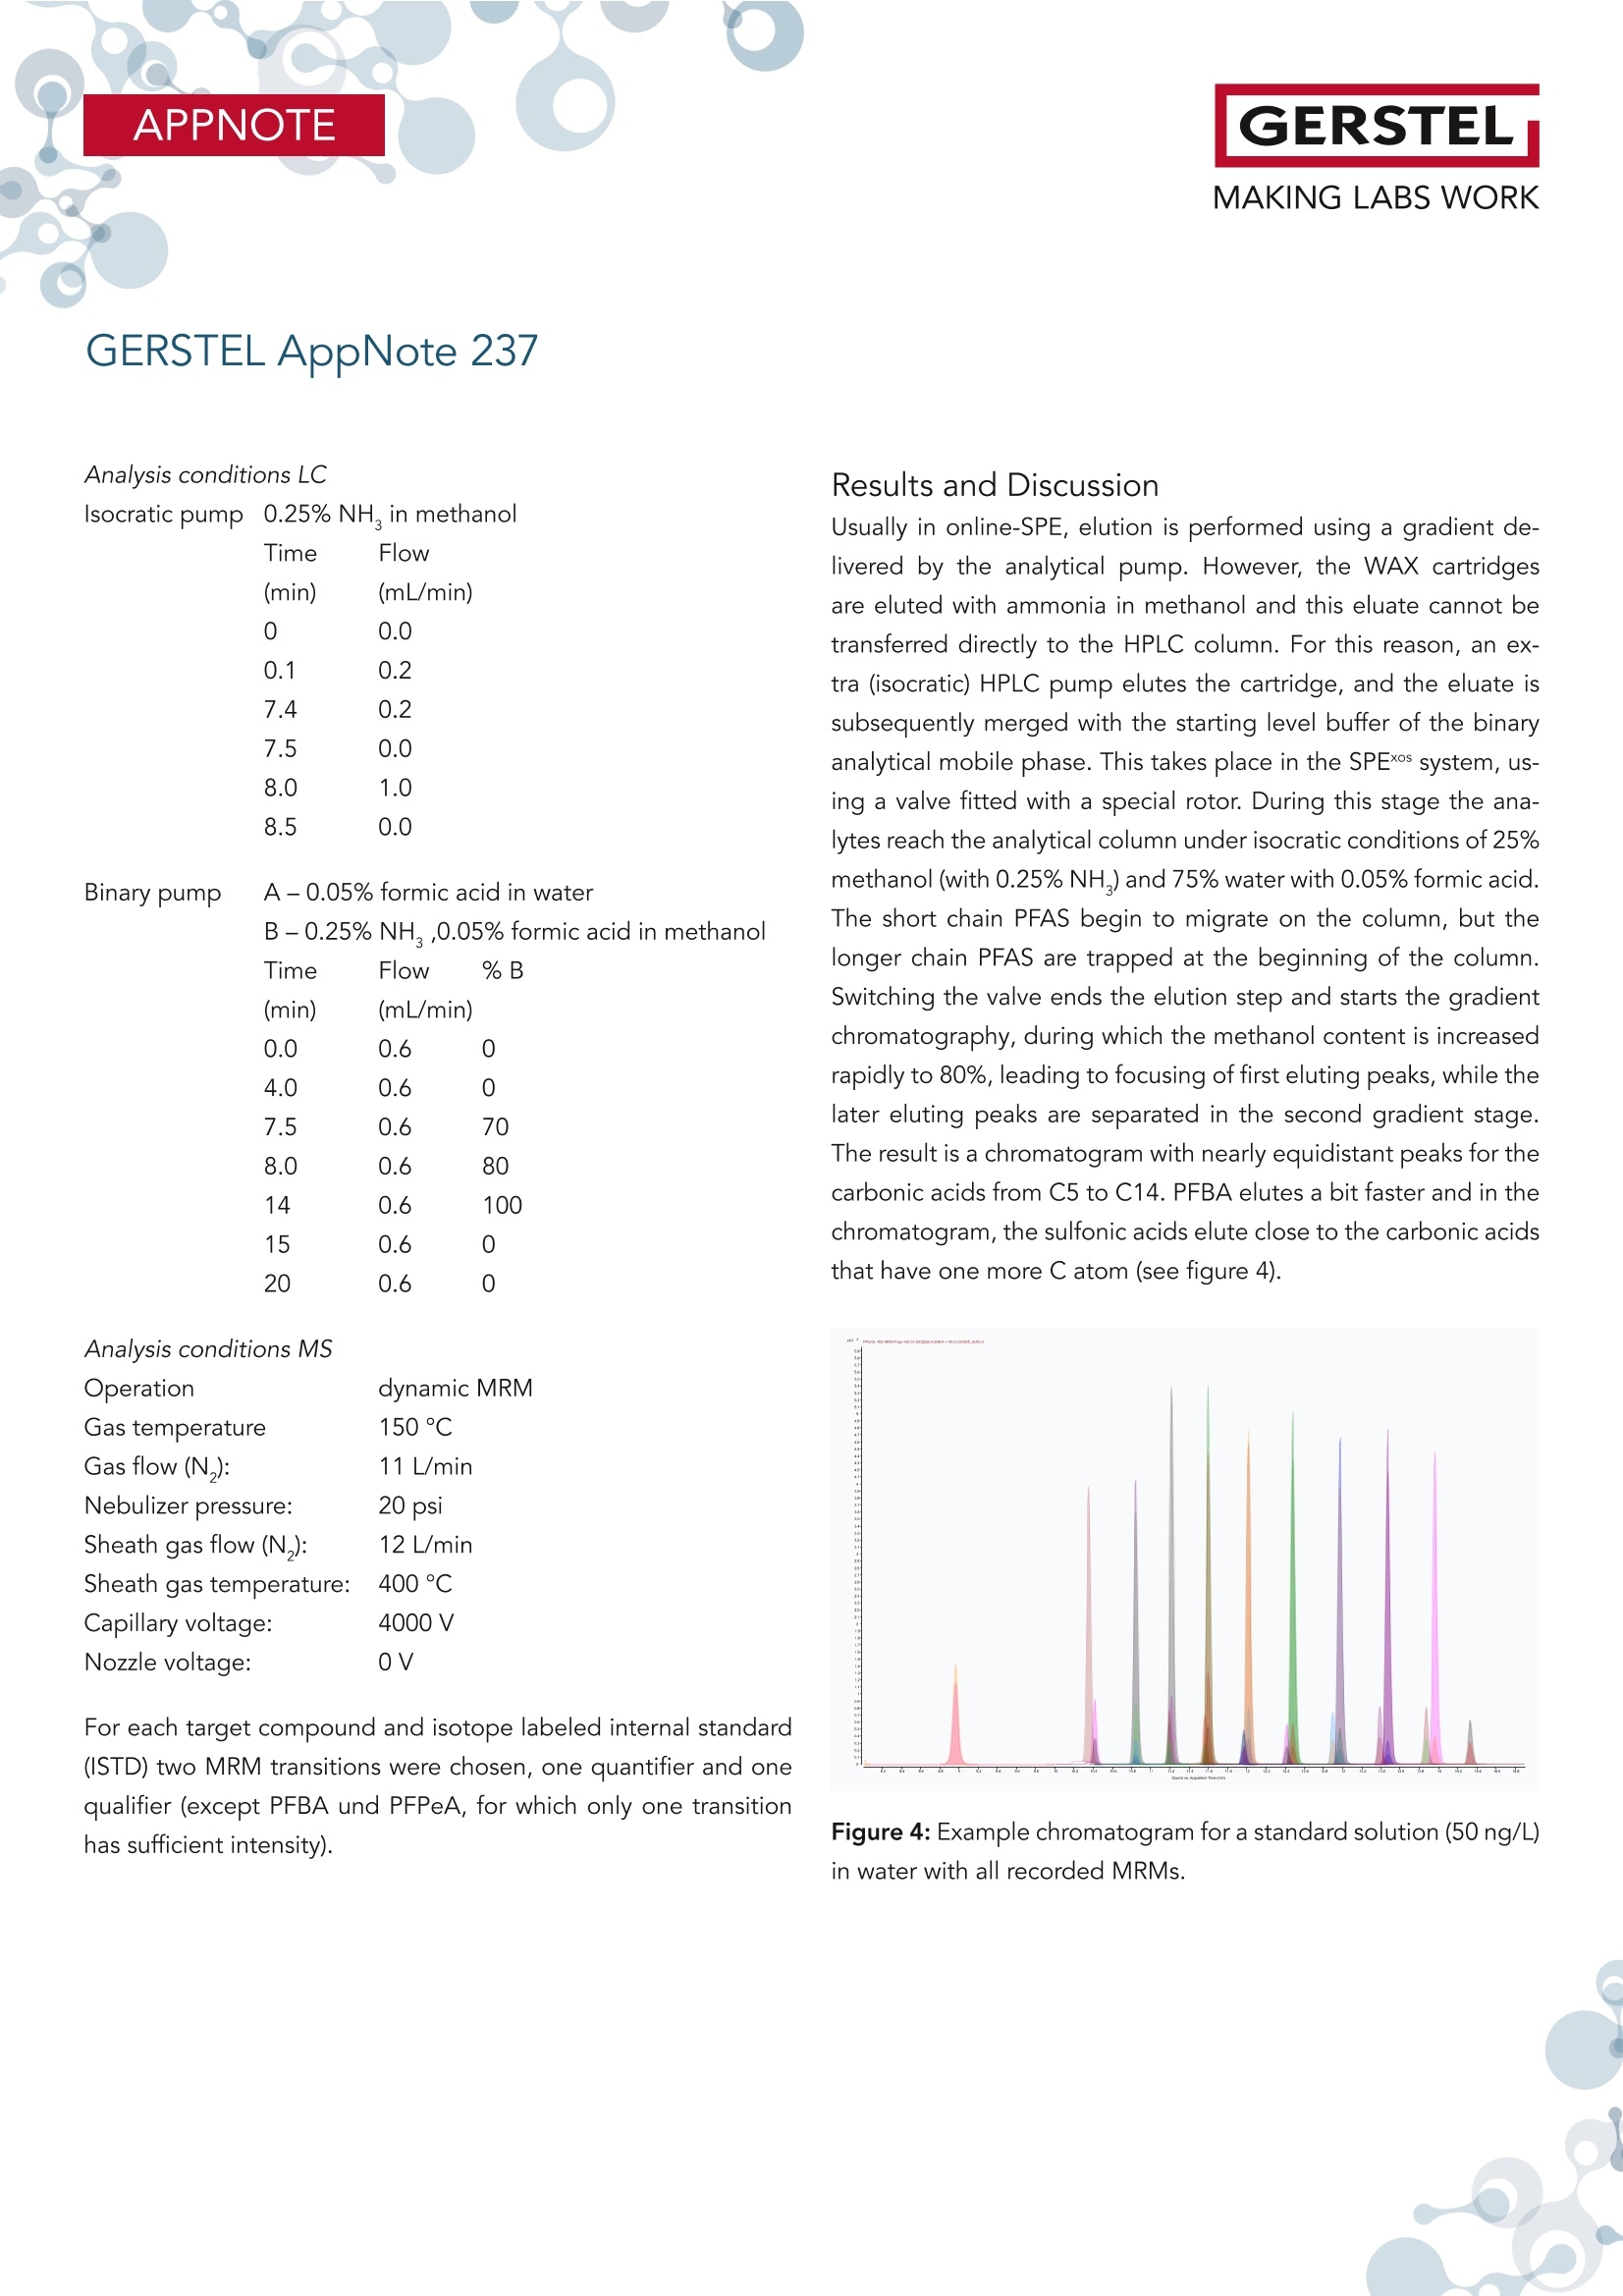
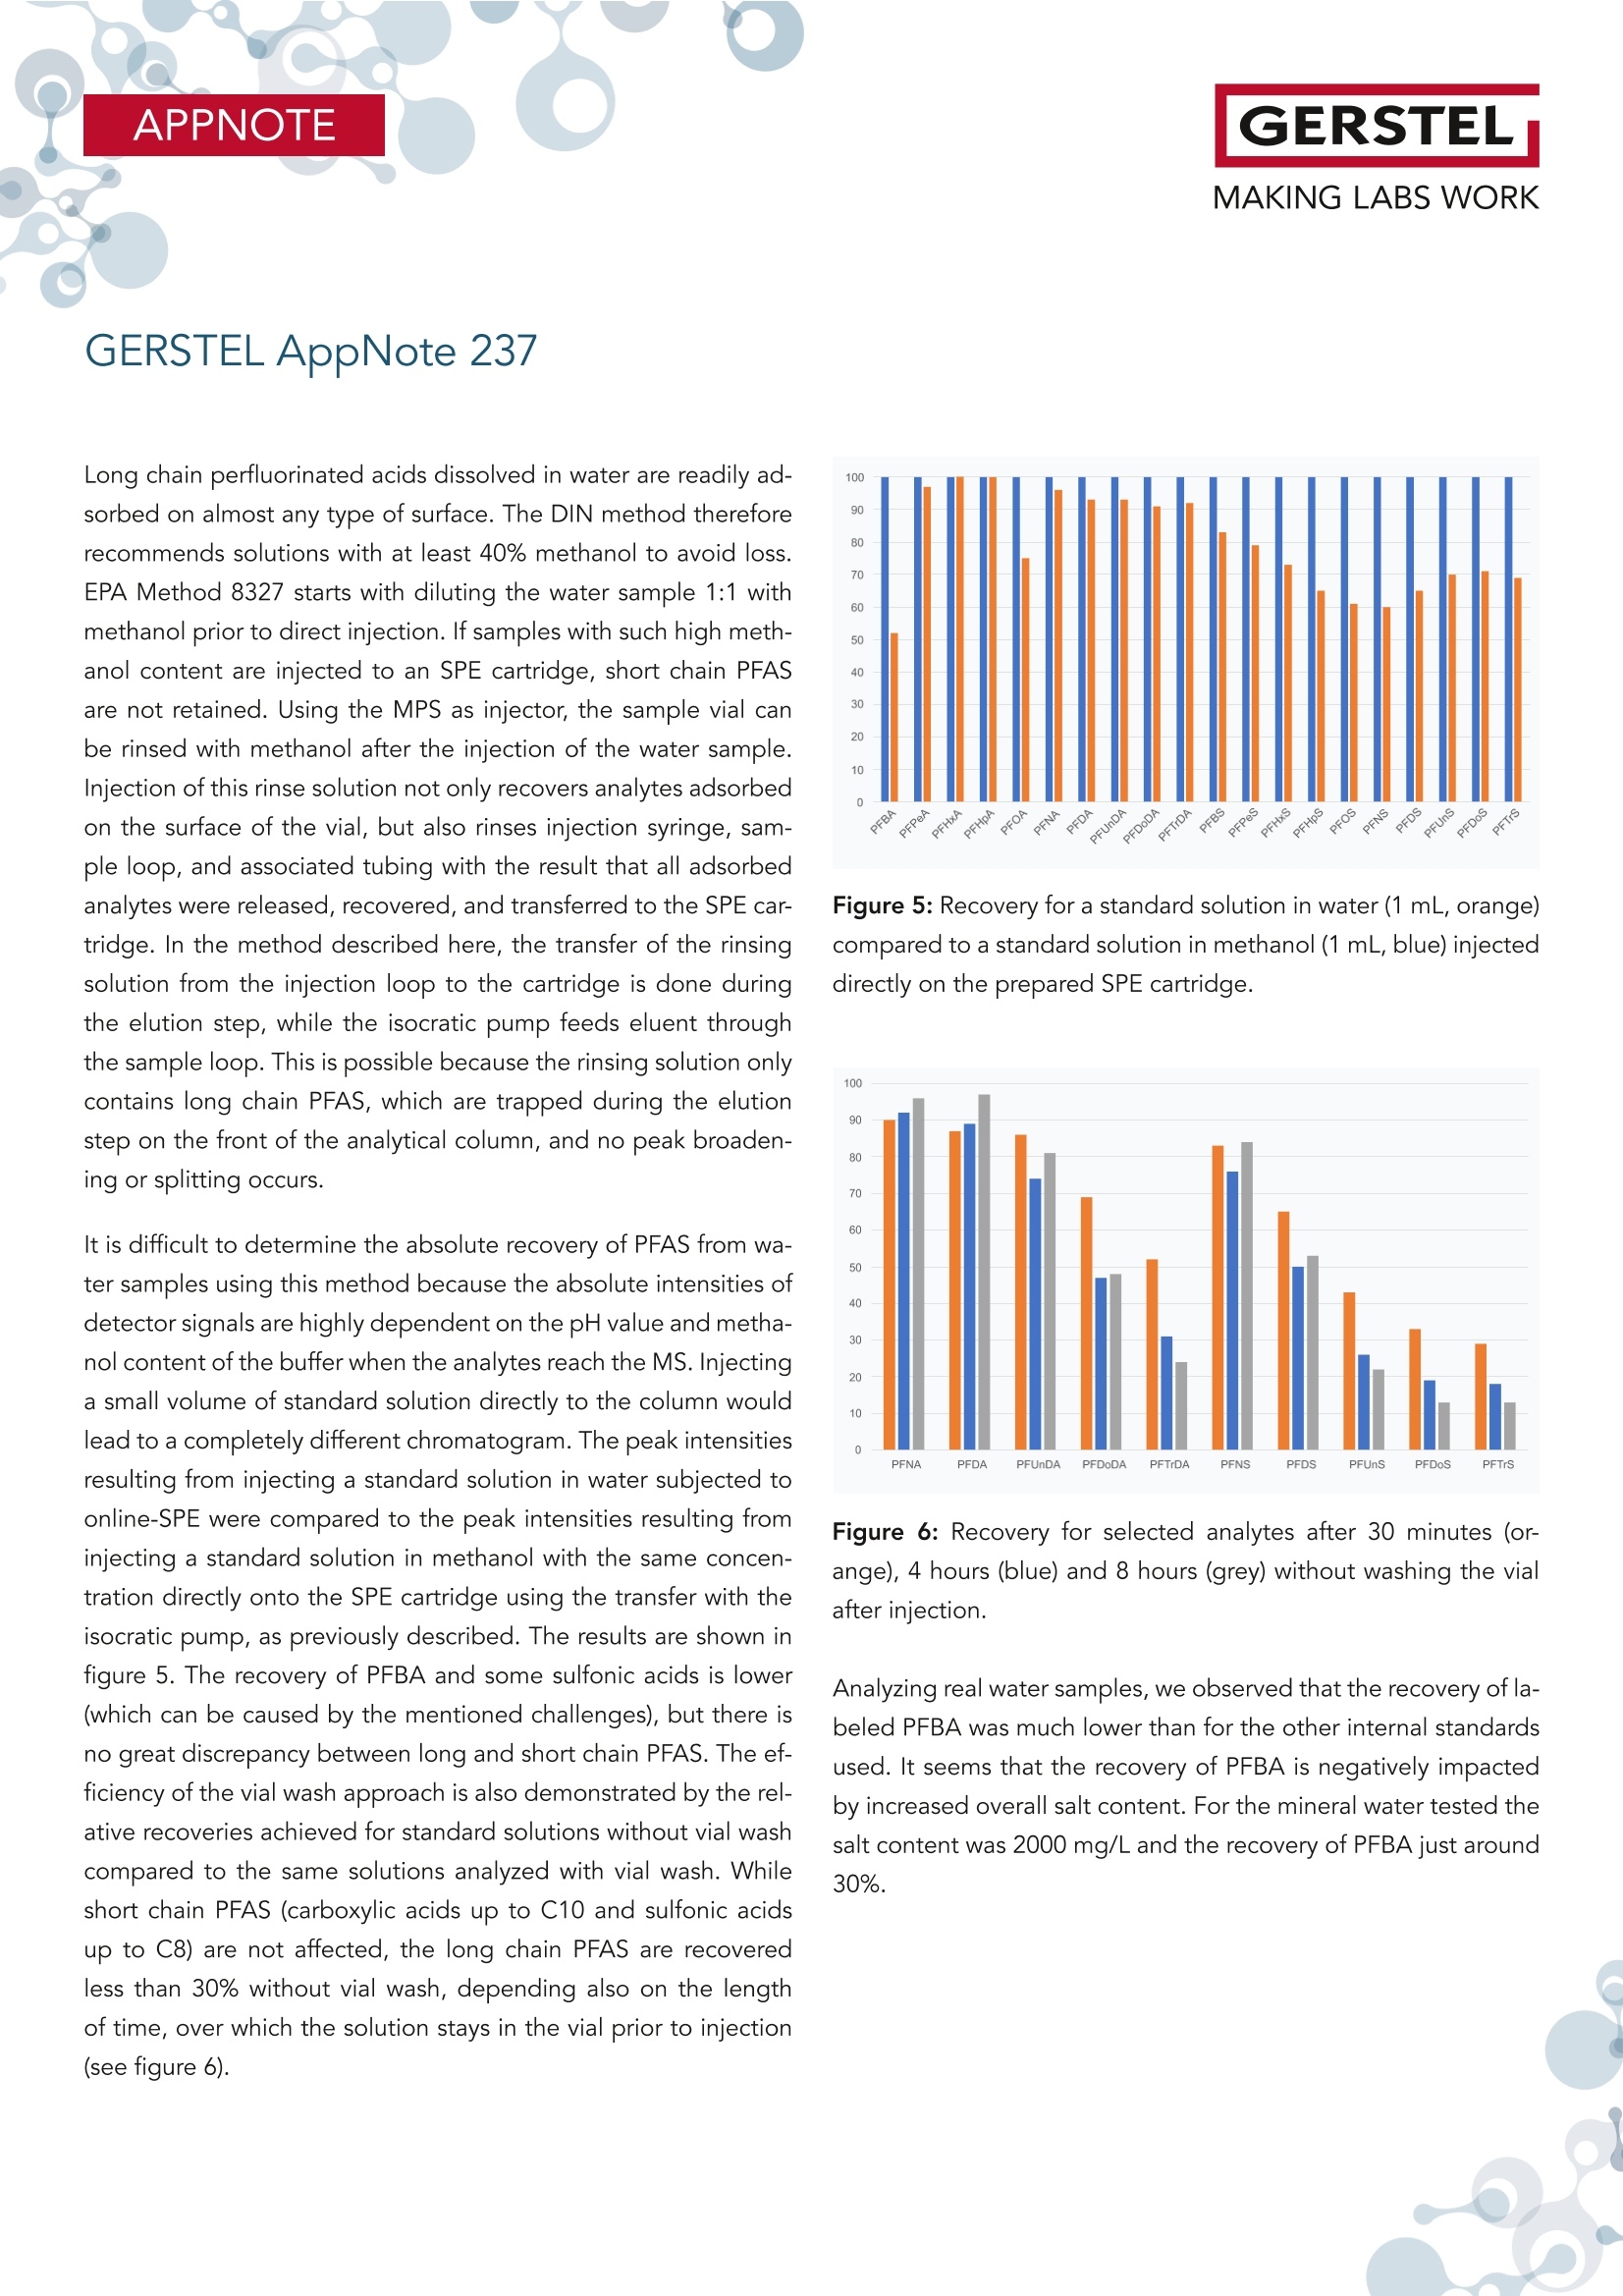
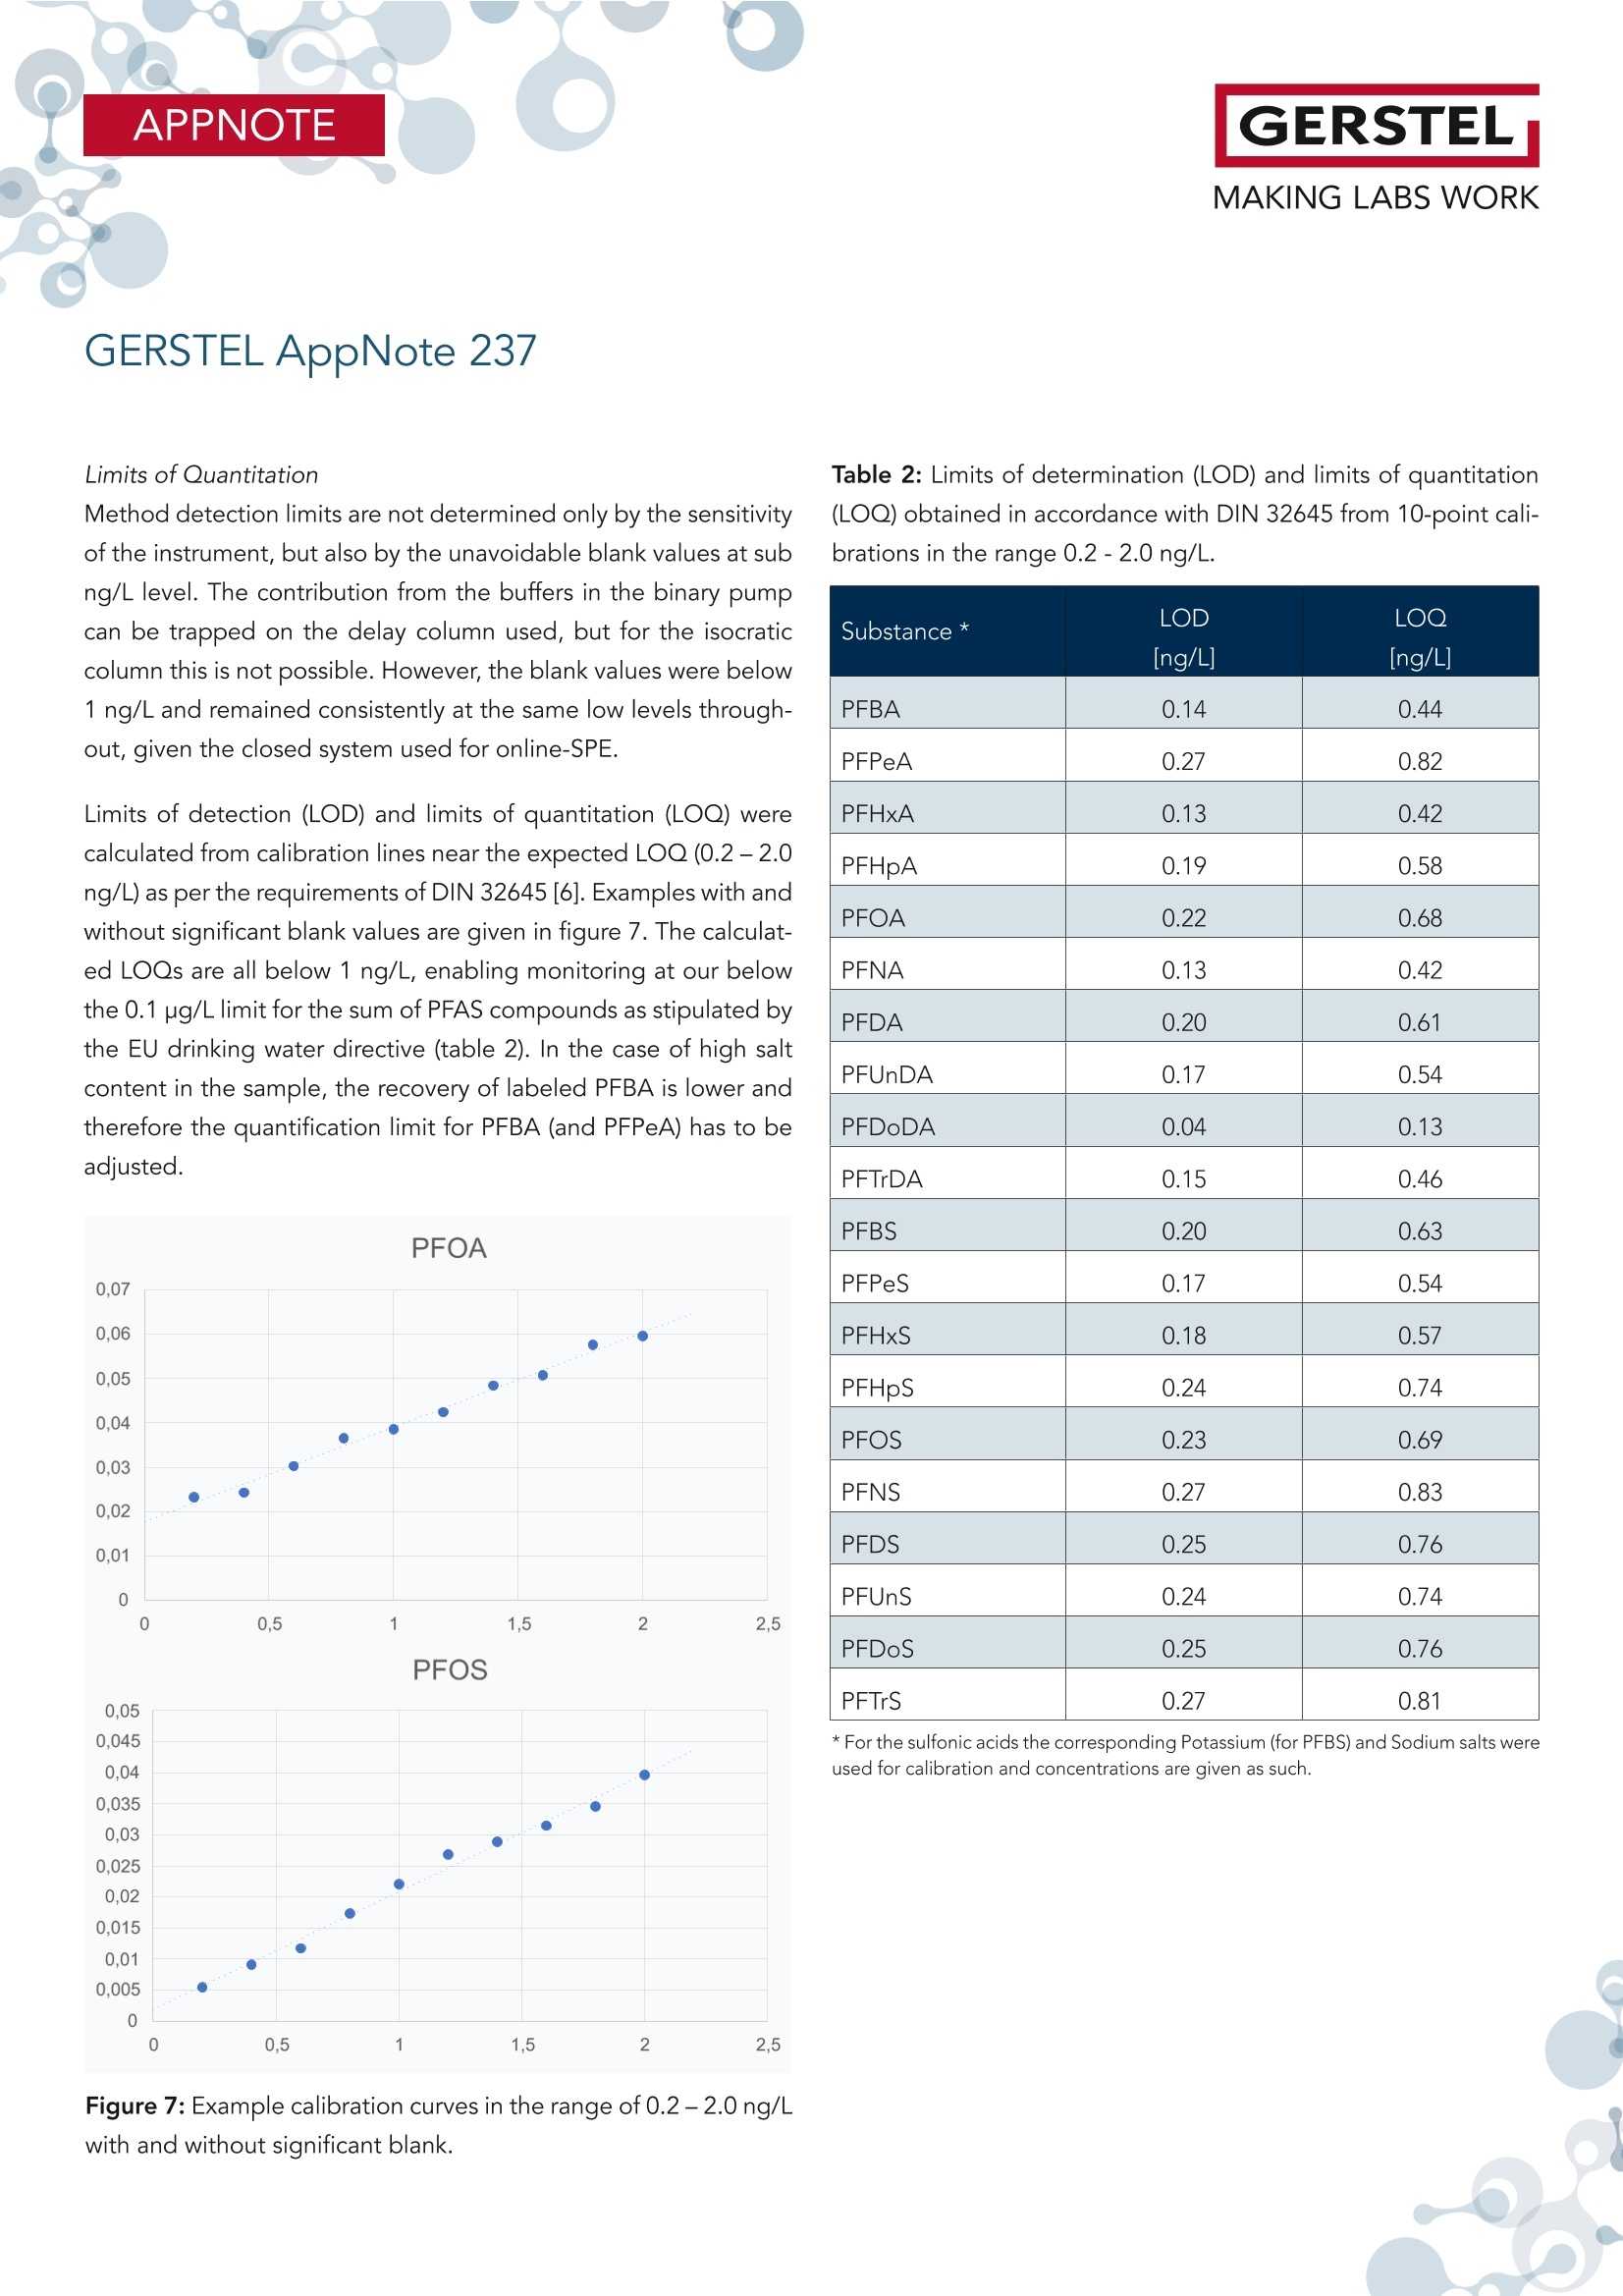
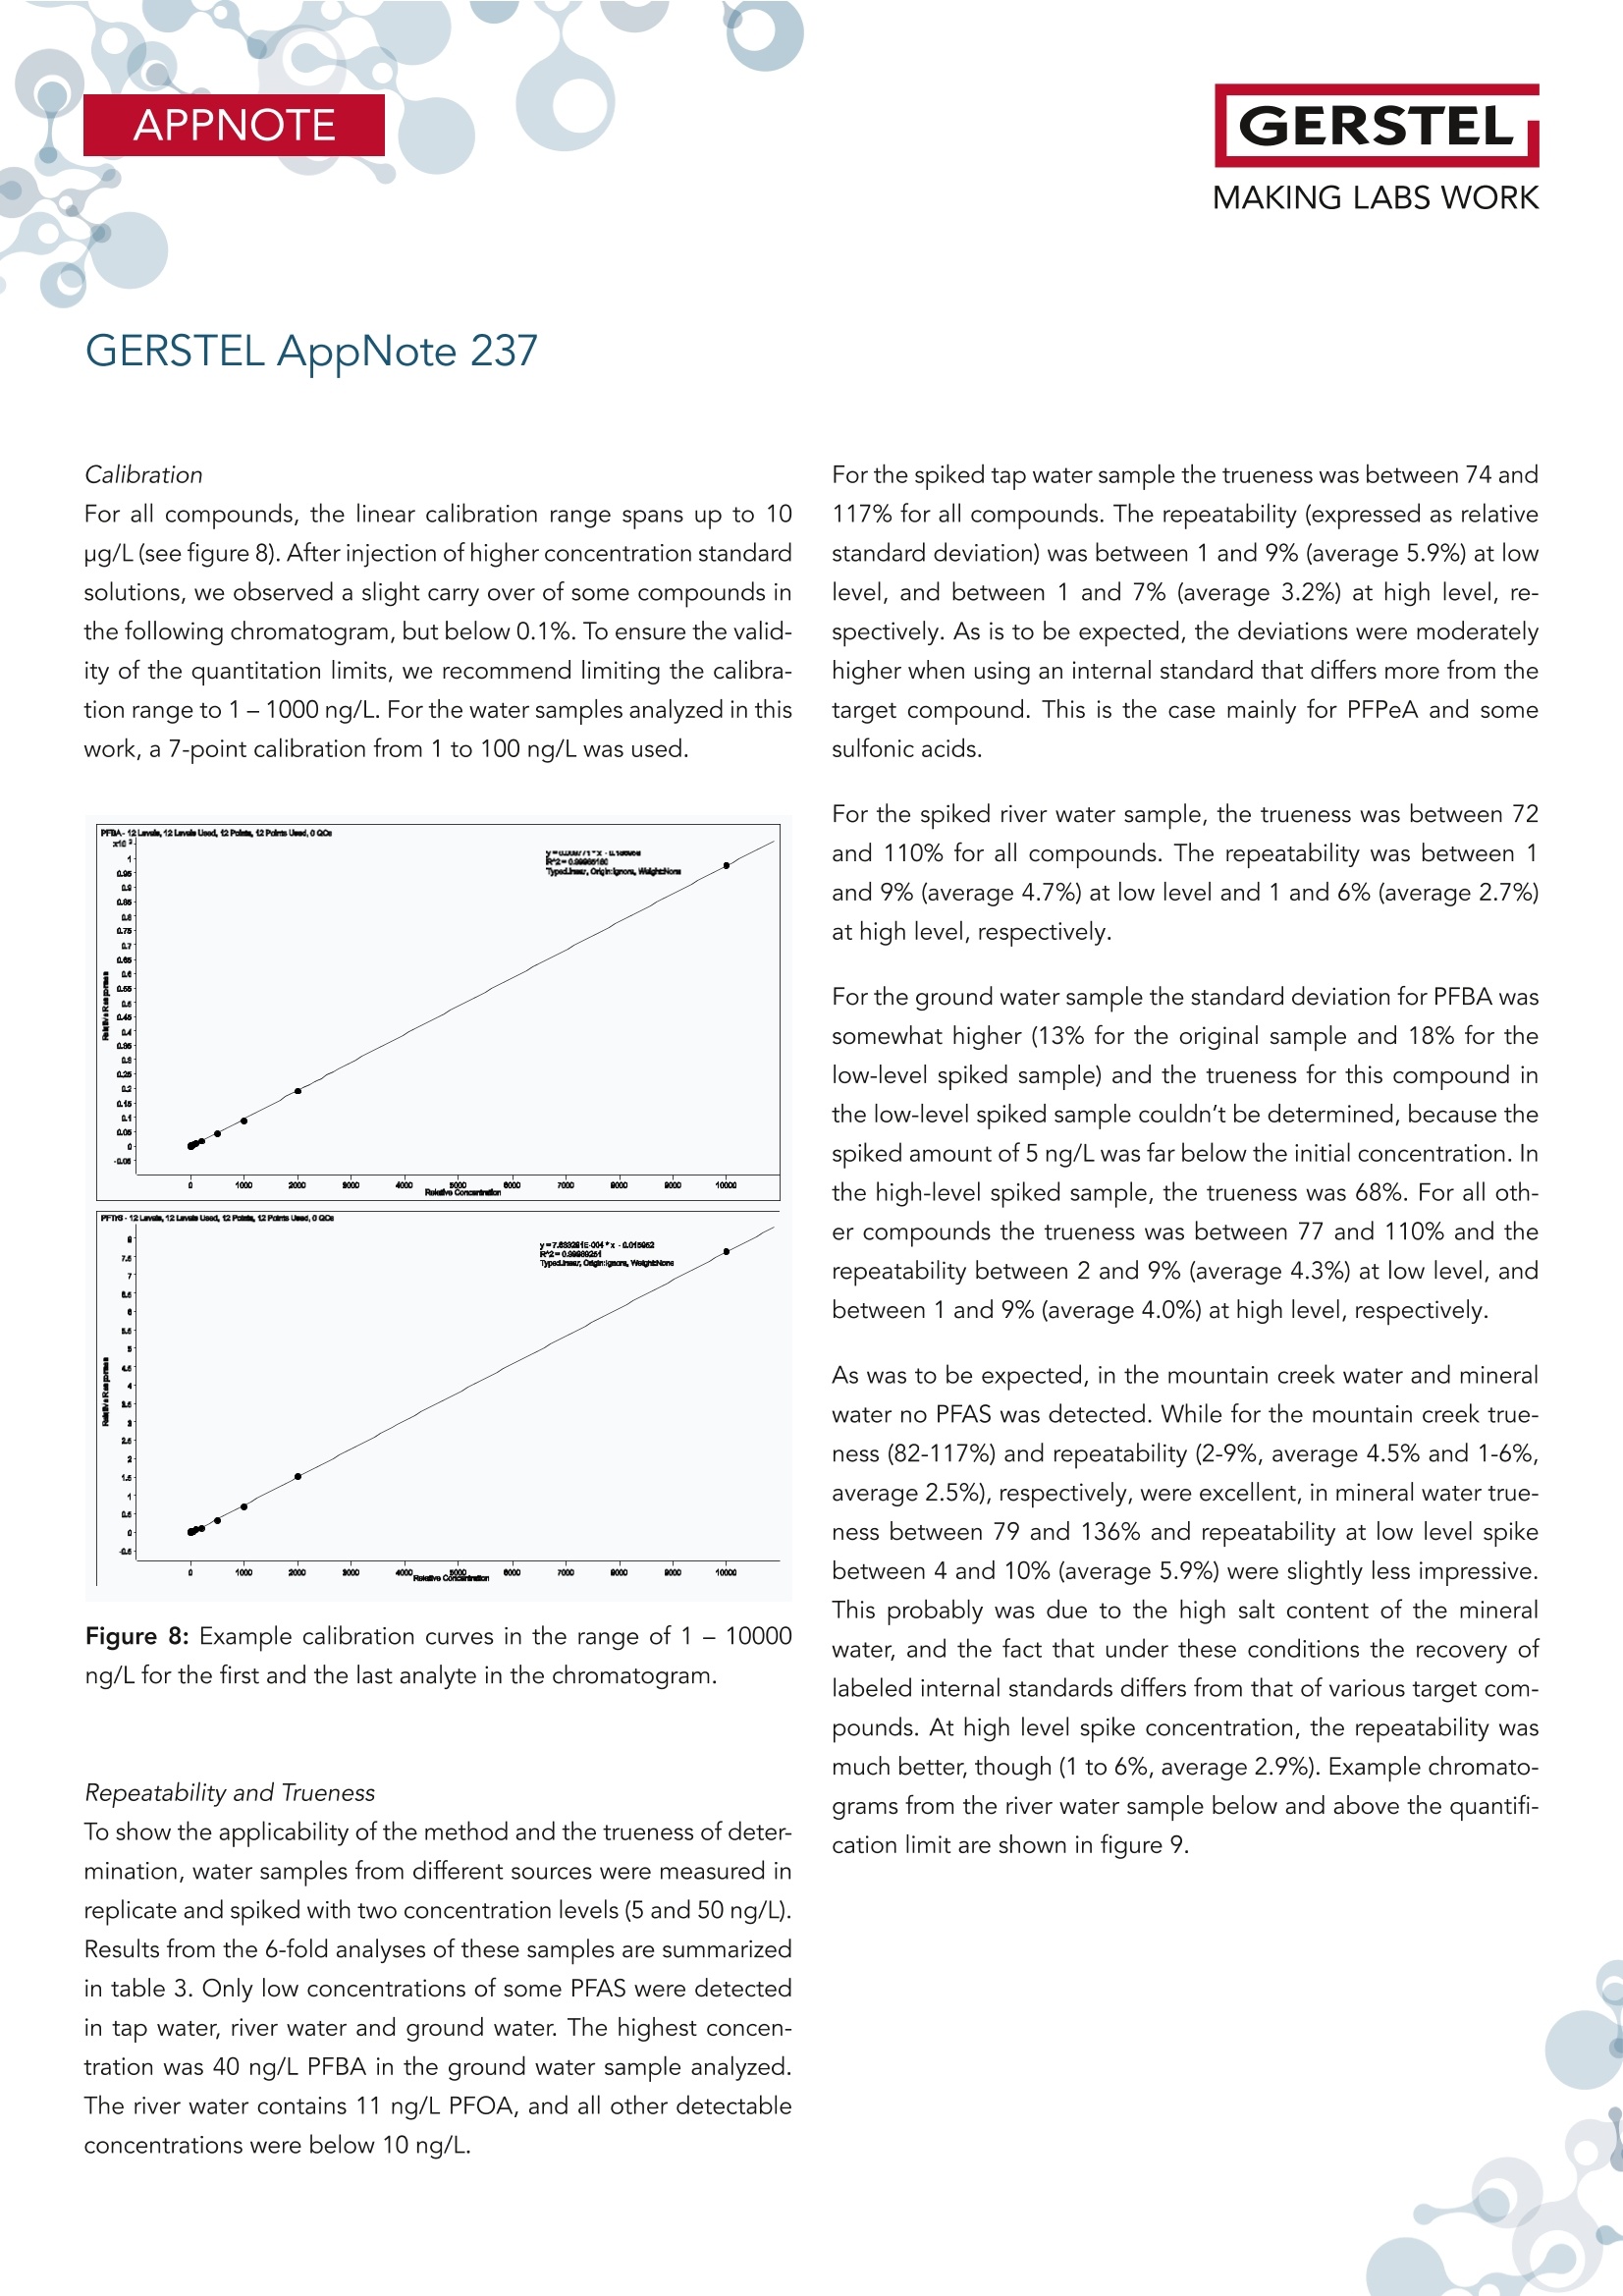
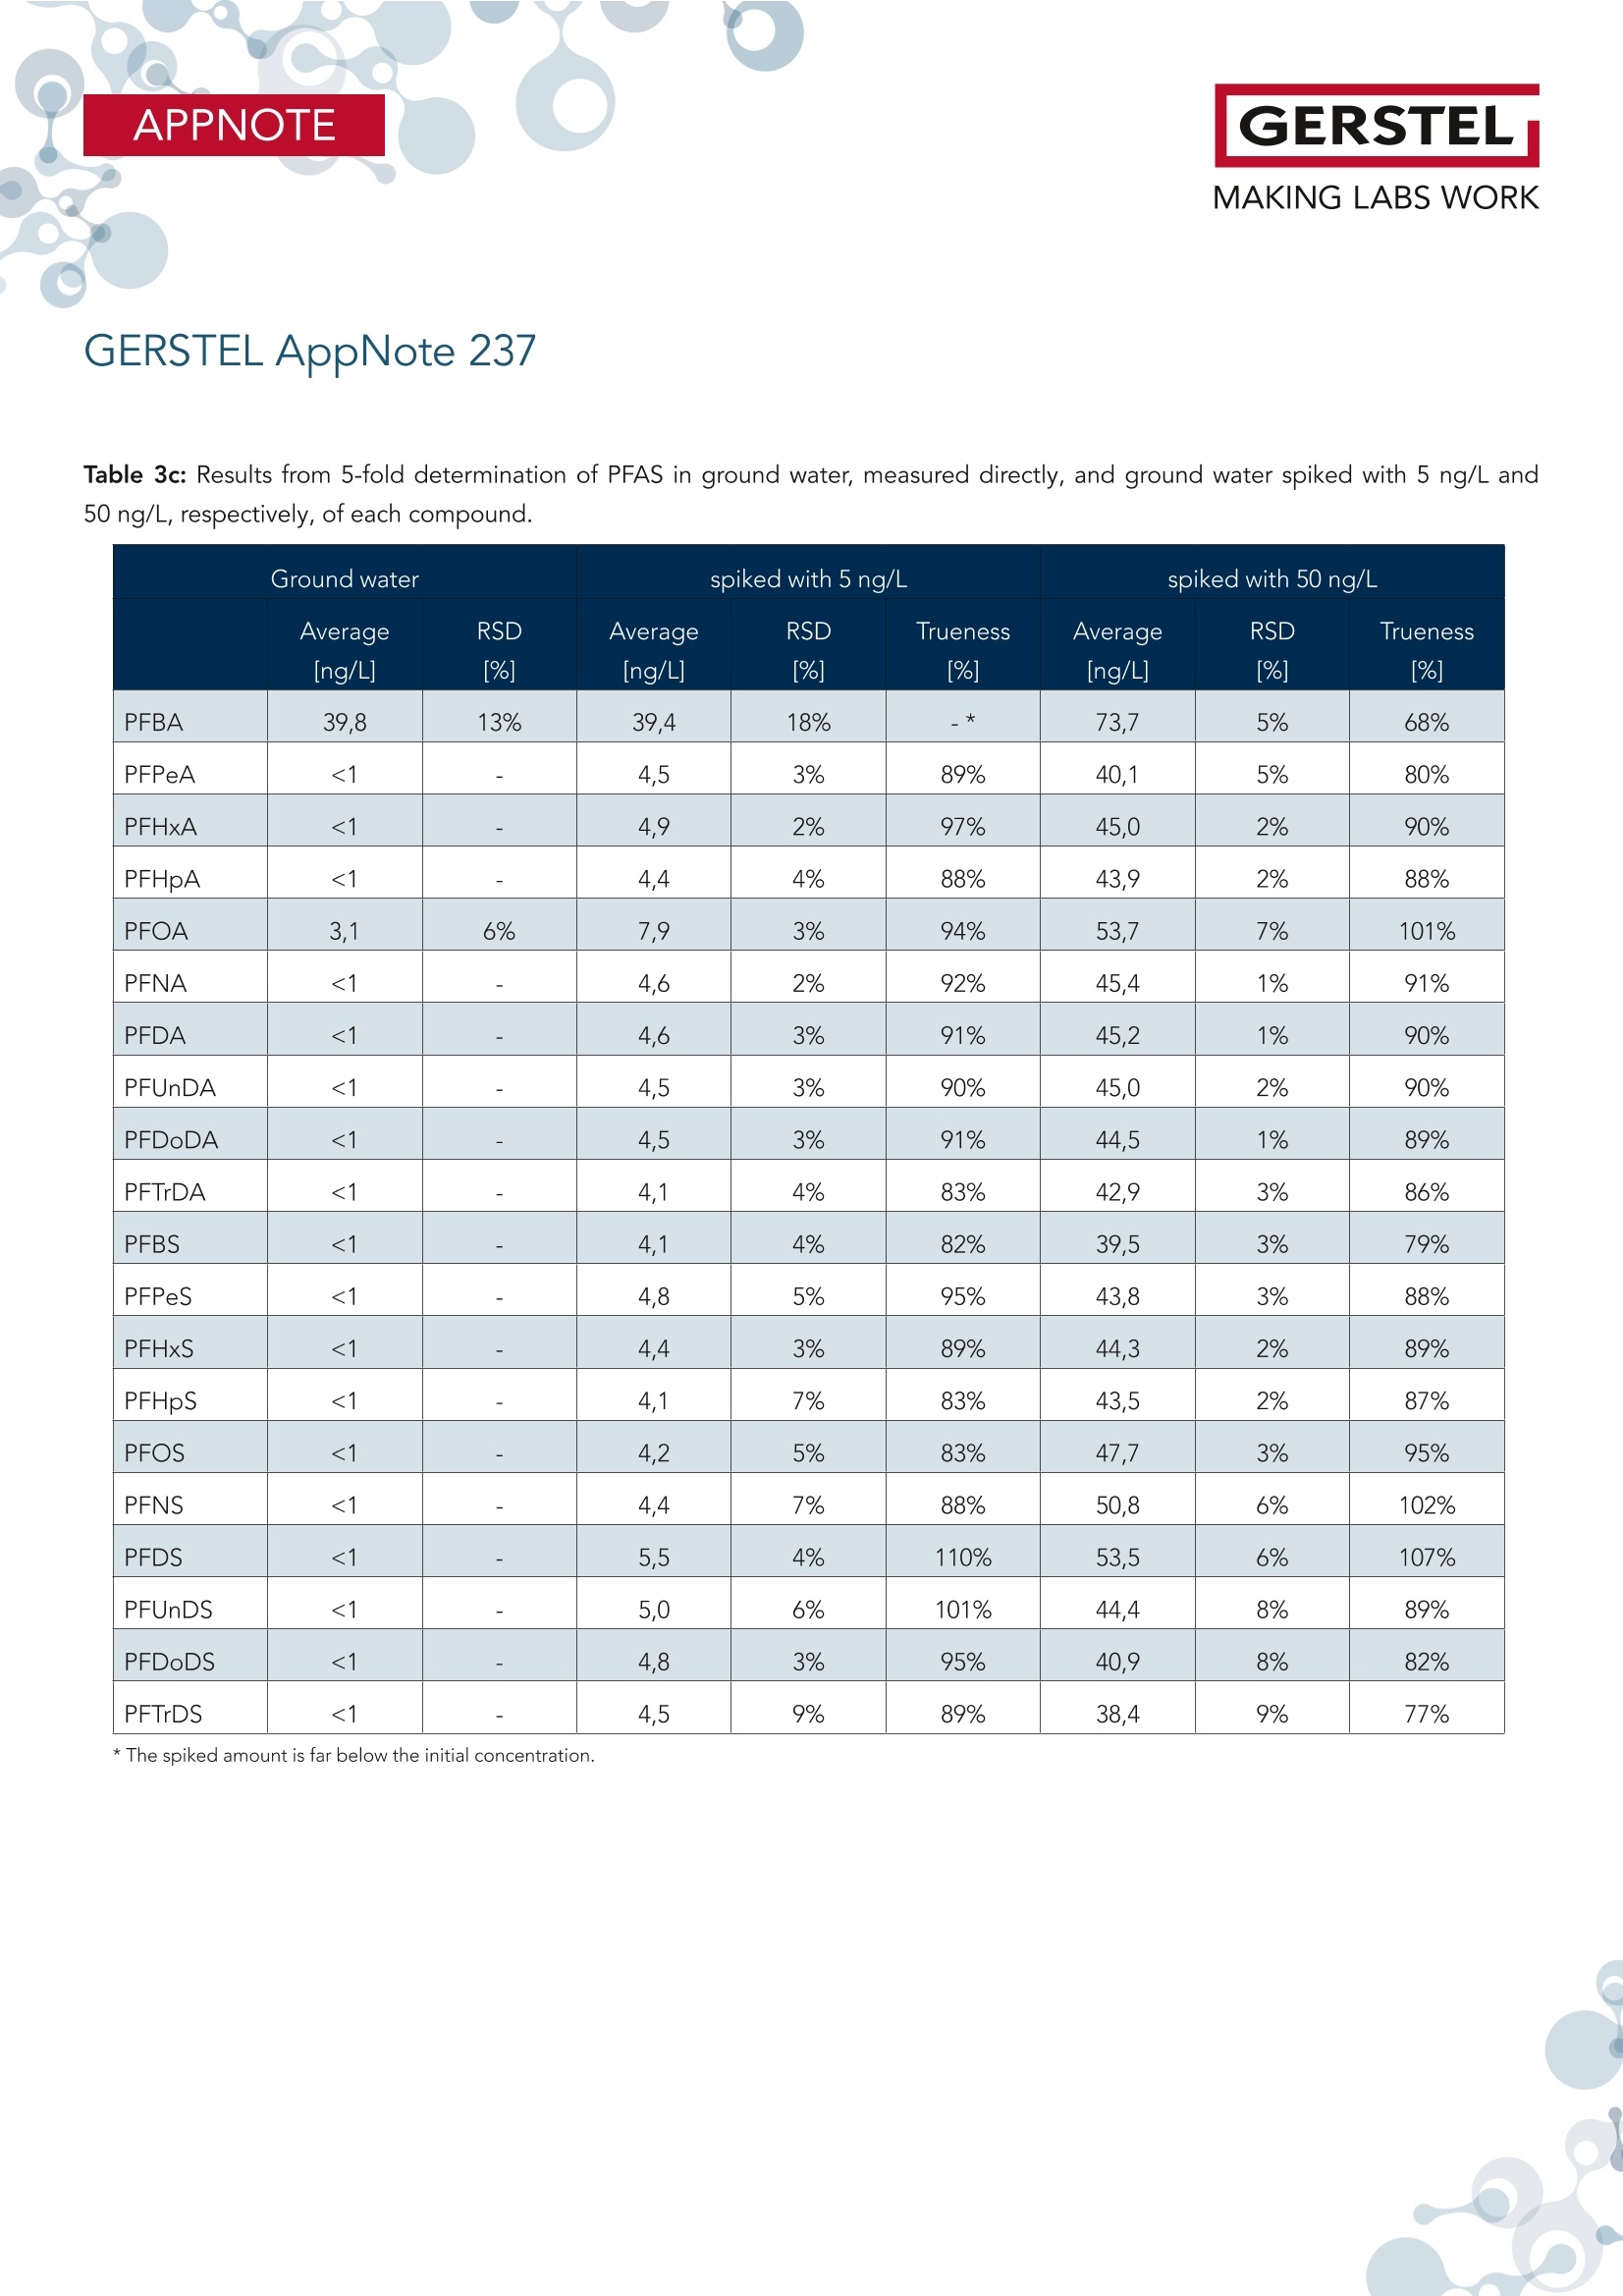
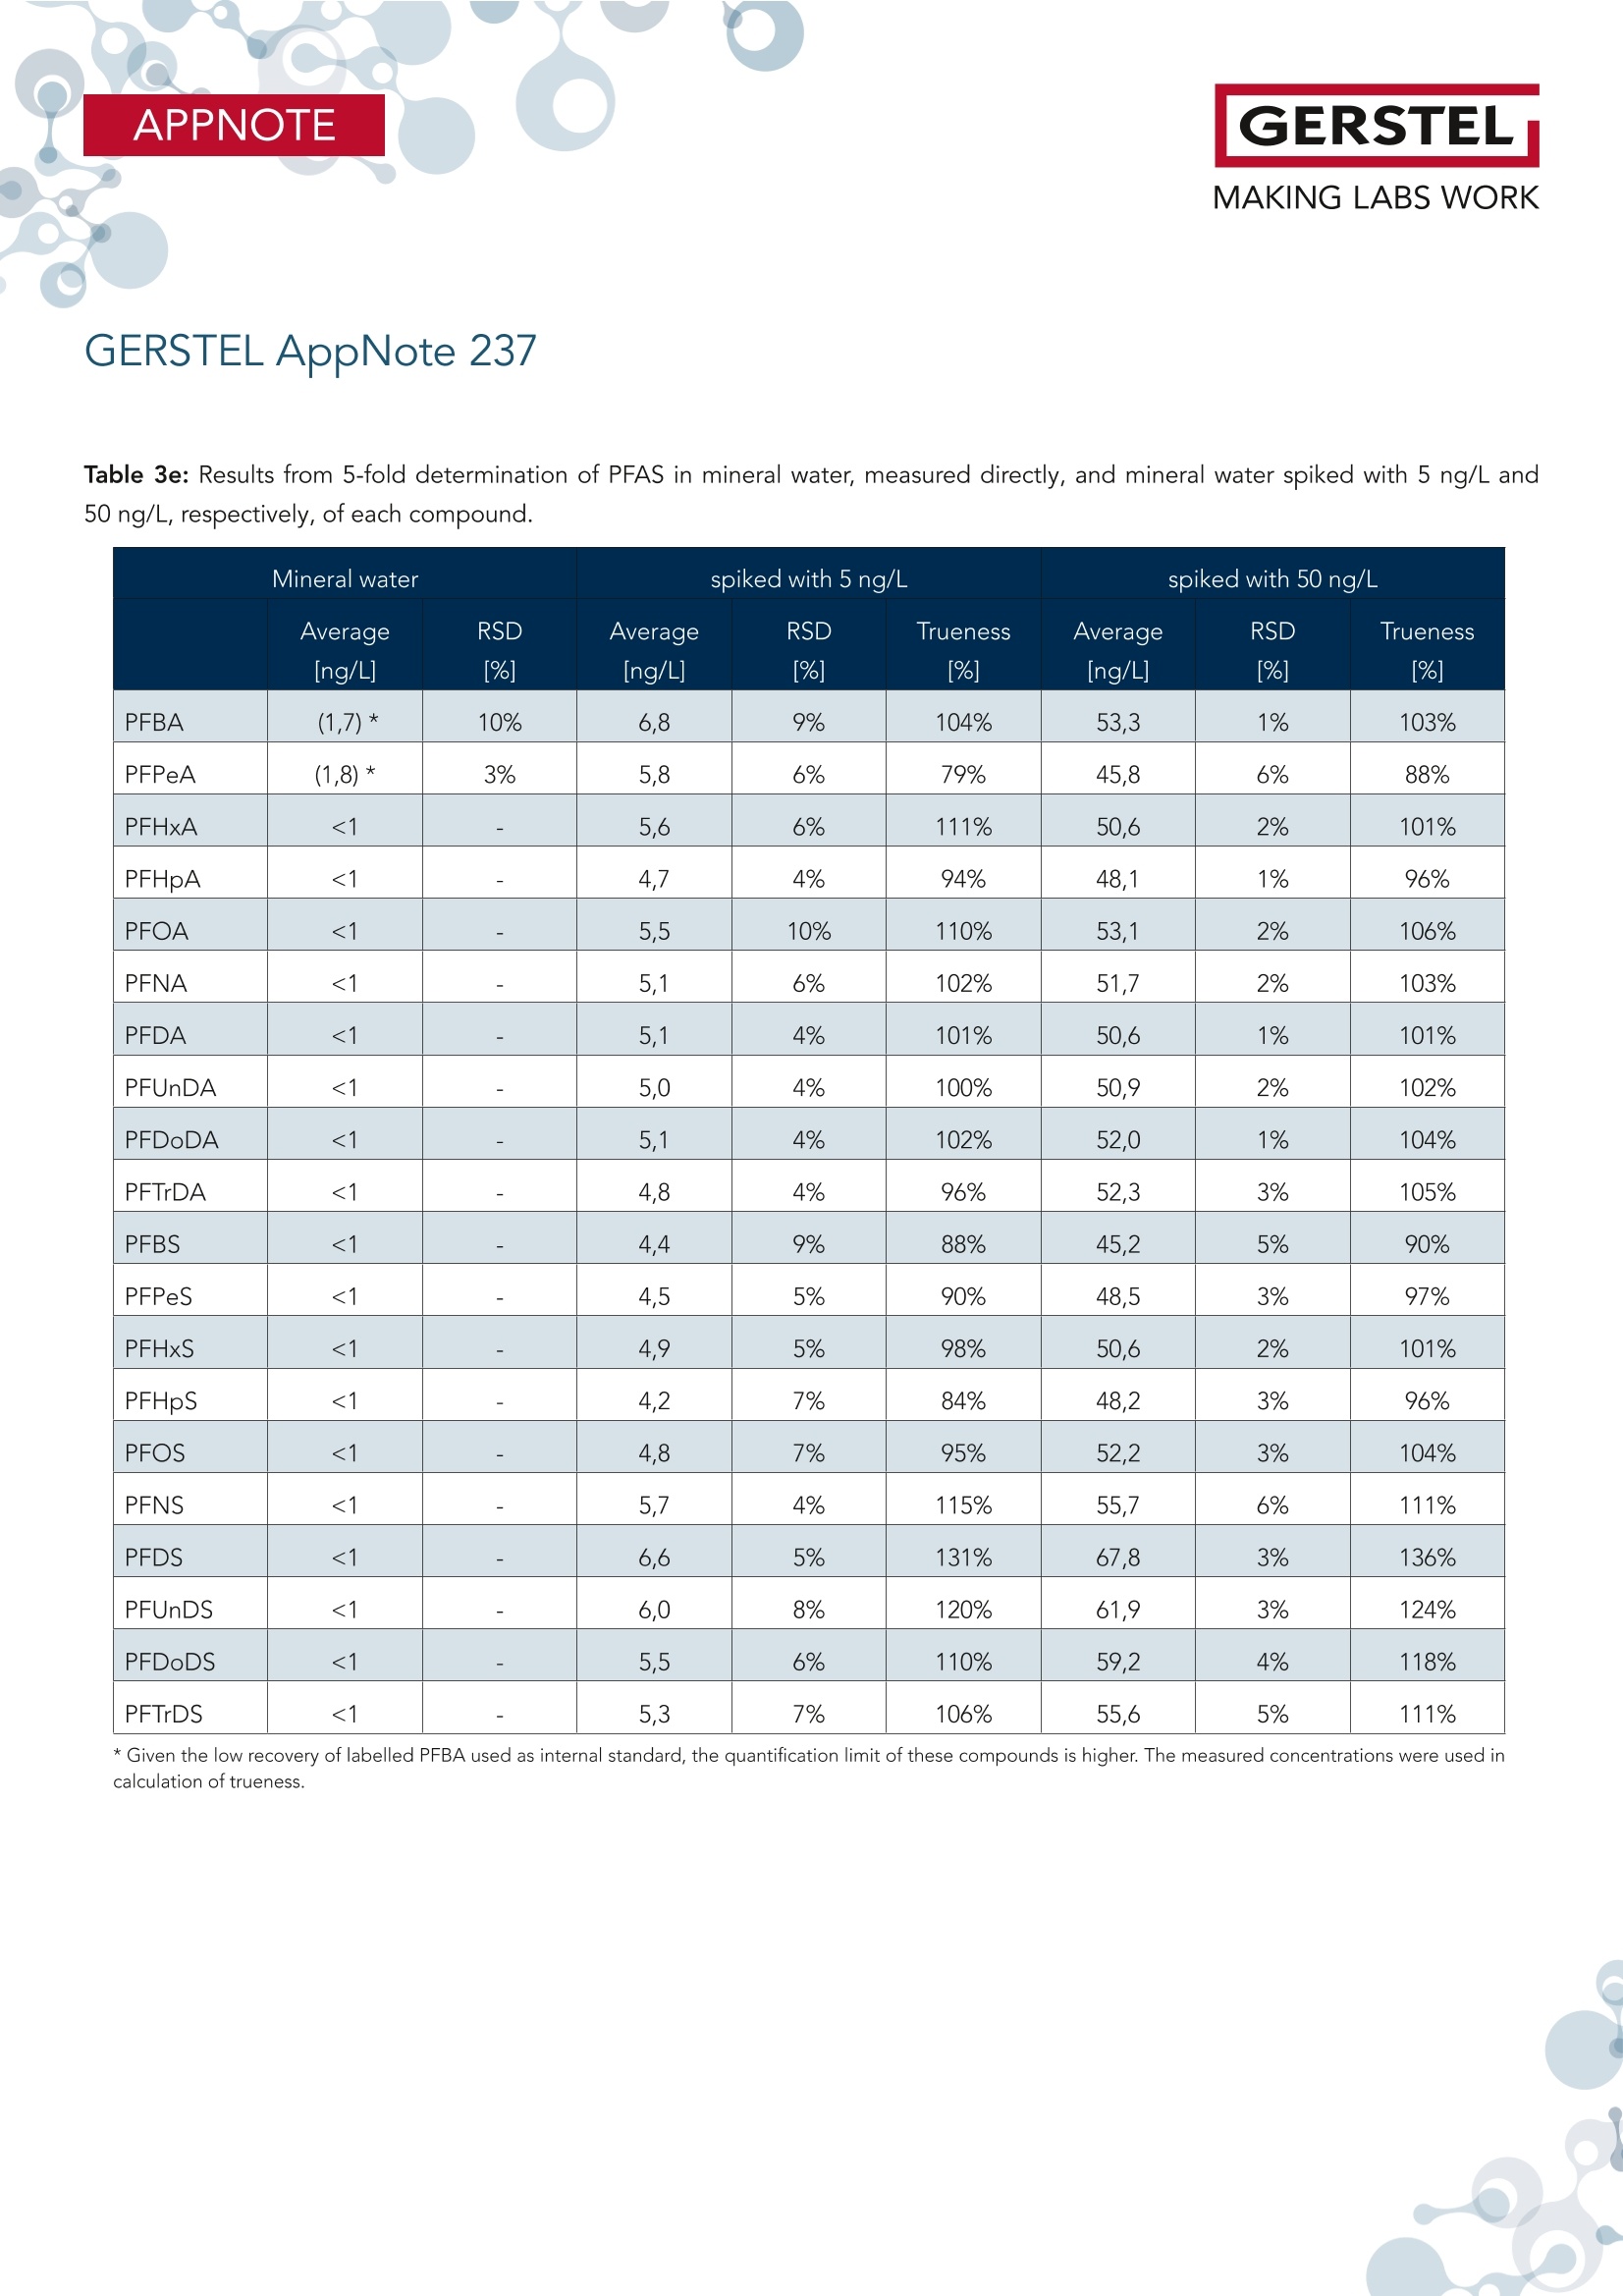
根据欧盟饮用水指令 (EU 2020/2184) 使用在线SPE、弱阴离子交换吸附剂(DIN38407-42)结合LCMS/MS的自动化方法测定全氟碳酸和全氟磺酸。此方法在0.2– 2.0 ng/L的校准范围内确定的定量限 (LOQ)都低于1 ng/L,符合欧盟饮用水指令中对20种PFAS总量低于0.1 µg/L的要求。通过对不同来源的加标水样进行分析,证明了该方法的准确性。相对标准偏差低于10%,正确度在80% -110% 之间。 PFAS化合物以及其检测标准全氟和多氟烷基物质 (PFAS) 是一系列高度氟化的人为化学品,具有特殊的物理化学特性,使其具有防油防水和耐热性。这使得它们适用于许多家庭和工业应用,例如不粘炊具、食品包装、地毯、清洁产品和消防泡沫。独特的化学特性使它们有用,但也难以分解。缺乏环境退化以及在水中的良好溶解度导致全球分布。PFAS 不仅存在于环境中,还存在于食物和动物饲料、人类和野生动物中。 PFAS有毒,急性接触可能对健康产生不利影响。世界各地的当局都在规范它们的使用和监测其在环境中的排放。此外,必须监测食品和饮用水,新的欧盟饮用水指令包括PFAS的最大限制。总PFAS的限值设置为0.5 µg/L,而最受关注的20种PFAS的总和最大限值为0.1 µg/L。为有效监测该值,总PFAS的检测限(LOD)为30 ng/L,单个PFAS化合物的检测限为1.5 ng/L。 在线SPE-LC-MS/MS鉴于大多数PFAS的极性,尤其是羧酸和磺酸,分析主要通过LC/MS完成。极性较小的碳链允许在基于C18的色谱柱上进行反相 (RP) 色谱。为了达到低检测限,水样通常通过SPE萃取。与传统SPE不同,在线SPE使用插入洗脱液流路的更小柱,可以直接洗脱到高效液相色谱柱,使得分析物能够定量转移到分析系统,从而提高检测限和定量限,并且减少样品使用量。此处介绍的工作基于弱阴离子交换 (WAX) 小药筒,基于DIN 38407-42标准方法,使用含氨的甲醇溶液进行洗脱。由于不能直接转移到LC色谱柱上,因此需要对在线SPE-LC/MS 系统配置额外的等度泵,然后将洗脱液与二元分析流动相的起始缓冲液合并。在线SPE-LC-MS/MS实验结果分享分析了不同的水样:实验室的自来水、德国鲁尔河畔米尔海姆鲁尔河的水、附近的地下水、奥地利山溪的水以及在当地超市购买的高盐矿泉水。分析物列表测定限 (LOD) 和定量限 (LOQ) 根据DIN 32645从0.2-2.0 ng/L范围内的10点校准获得标准溶液 (50 ng/L) 在水中的示例色谱图显示所有的多反应监测MRM标准水溶液(1 mL,橙色)的回收率与直接注入SPE小柱上的甲醇标准溶液(1 mL,蓝色)做对比总结在线 SPE-LC-MS/MS 系统与所介绍的方法相结合,可以全自动测定欧盟饮用水指令中列出的低ng/L范围内的PFAS化合物。主要优点是简单的样品处理、极低的溶剂消耗和出色的重现性。洗脱前对小柱进行有机清洗可有效去除基质干扰并提高结果的准确性。 此外,分析前无需过滤水样或用甲醇稀释。对不同来源的水样验证了方法的准确性和正确性,导致相对标准偏差低于10%,正确性在80% 和110% 之间。 在线SPE技术介绍SPExos 与标准的SPE相比使用了一个更小的,只装有50 mg吸附剂的小柱,使整个过程实现了显著的小型化。系统可以完全集成到LC-MS/MS系统中,洗脱液100%被转移到LC柱,以实现最佳的回收率和检测限。放在96位托盘中的SPExos小柱,可多次使用SPExos自动润洗、上样、洗脱和进样过程SPExos 可嵌入到GERSTEL多功能全自动样品前处理平台(MPS)和高效液相色谱系统LC-MS/MS系统中,实现高度自动化和高效性。APPNOTEGERSTELMAKING LABS WORKGERSTEL AppNote 237 APPNOTEGERSTELMAKING LABS WORK Determination of PFAS in Water according toEU 2020/2184 and DIN 38407-42 usingonline-SPE-LC-MS/MS Thomas Brandsch, Oliver Lerch GERSTEL GmbH & Co.KG, Eberhard-Gerstel-Platz 1, 45473 Mulheim an der Ruhr, Germany KeywordsEU Drinking Water Directive, LC/MS, online-SPE, SPExos, PFAS Abstract In the work presented here, the perfluorinated carbonic and sulfon-ic acids listed in the EU Drinking Water Directive (EU 2020/2184)were determined by an automated method based on solid phaseextraction with weak anion exchange sorbent combined with LC-MS/MS. Limits of quantification (LOQ) were determined from cal-ibrations in the range of 0.2 - 2.0 ng/L according to DIN 32645.These are all below 1 ng/L, allowing the monitoring of 0.1 pg/L forthe sum of 20 PFAS set as limit by the EU Drinking Water Direc-tive. The method accuracy was demonstrated based on analysisof spiked water samples from different sources. Relative standarddeviations were below 10% and trueness mainly between 80 and110%. Introduction Per- and polyfluoroalkyl substances (PFAS) are a family of highlyfluorinated anthropogenic chemicals with special physicochemi-cal properties that make them oil and water repellant as well asheat resistant. This makes them suited for many household andindustrial applications like nonstick cookware, food packaging,carpeting, cleaning products and firefighting foams. The uniquechemical properties make them useful, but also difficult to breakdown. The lack of environmental degradation in combination withgood solubility in water leads to a global distribution. PFAS arefound not only in the environment, but also in food and animalfeed, in humans, and in wildlife. PFAS are toxic and acute exposure could have detrimental healtheffects. Authorities worldwide are regulating their use and emis- sions into the environment. In addition, food and drinking watermust be monitored for their presence, and the new EU DrinkingWater Directive (EU 2020/2184)[1] includes maximum limits forPFAS. The limit for total PFAS is set to 0.5 pg/L and for the sumof 20 PFAS of most concern the maximum limit is 0.1 pg/L. Formonitoring this value, a limit of detection (LOD) of 30 ng/L for thesum and 1.5 ng/L for individual compounds is necessary. Given the polar nature of most PFAS, especially carbonic and sul-fonic acids, the analysis is mainly done by LC/MS. The less polarcarbonic chain allows reversed phase (RP) chromatography onC18-based columns. To reach low detection limits, water samples are usually extracted by means of SPE. First attempts weremade with polystyrene-divinylbenzene (SDVB) cartridges (e. g. USEPA Method 537/537.1 [2]), but the need to extend the analysisspectrum to short chain acids, lead to the use of anion exchangesorbents (e. g. US EPA Method 533 [3] or DIN 38407-42[4]). Ircombination with RP chromatography, this approach offers theadvantage of efficient clean-up, especially if the cartridges arewashed with an organic solvent prior to elution. Since LC/MS systems have become much more sensitive over therecent years, direct injection of water samples is a competitivealternative for low level analysis of PFAS. But when following thisapproach, the analysis of long chain acids becomes challenging,because they tend to stick to all surfaces, leading to low (and irre-producible) recovery. To overcome this drawback, the water sam-ples need to be diluted with methanol and filtered prior to LC/MSanalysis (e. g. US EPA Method 8327 [5]). Unlike traditional SPE, online-SPE relies on smaller cartridges in-serted into the eluent flow path that can be eluted directly onto the HPLC column. This enables quantitative transfer of analytes tothe analysis system, resulting in improved limits of detection andquantitation even when sample volumes are significantly reduced.Using this technique, the efficiency of SPE is combined with thesimplicity of direct injection. Our initial attempts at perform-ing PFAS analysis were made using RP cartridges (cf. GERSTELAppNote 190). The work presented here is based on weak anionexchange (WAX) cartridges. Elution is performed with ammonia inmethanol, which cannot be transferred directly onto the LC col-umn. A special configuration of the online-SPE-LC/MS system istherefore needed. For the work reported here, an online SPE sys-tem (GERSTEL SPExos, figure 1) was used that performs automatedcartridge exchange as well as automated rinsing of the entire sam-ple flow path between injections to ensure that sample to samplecarry over is reduced to an absolute minimum. All steps of a typicalSPE workflow are performed automatically including conditioning,loading, rinsing, and eluting the cartridge. Following the elutionstep, the cartridge is removed from the HPLC mobile phase flowpath freeing the system to prepare the next sample during theongoing LC-MS/MS analysis. The result is fully automated samplepreparation that doesn’t add to the overall analysis time once thefirst sample has been prepared and injected into the HPLC. Figure 1: The online SPE system GERSTEL SPExs Experimental Materials and Solvents Exactly 1 mL of water sample was filled into each conical 1.1 mLvial (GERSTEL 093640-045-00) by pipette, internal standard solu-tion was added and the vials were sealed with screw caps (GER-STEL 093640-075-00). For the extraction online SPE cartridgesfor the GERSTEL SPExs (Polymer WAX, GERSTEL 018804-023-00)were used. For chromatography methanol (hypergrade for LC-MS) and water(LC-MS grade) were used, fortified with ammonia solution 25%(for LC-MS) and/or formic acid 98-100% (for analysis, ACS, Reag.Ph Eur) all from Merck (Darmstadt, Germany). Cartridge wash wasperformed using a mixture of acetonitrile (gradient grade for liq-uid chromatography), acetone (for liquid chromatography) andformic acid 98-100% (for analysis, ACS, Reag. Ph Eur) in the ratio50:50:1, all from Merck. Preparation of samples and calibration standards. All standardswere purchased as solutions from Wellington Laboratories (distributed by Campro Scientific, Berlin, Germany): Native perfluorinat-ed compound mixture (2000 ng/mL for each compound), PFUnSand PFTrS as individual solutions with 50 pg/mL, and a mixtureof isotopically labelled PFAS used as internal standards. All sub-stances identified by their abbreviations are listed in Table 1. Thenative compounds were mixed to result in a stock solution of 1000ng/mL, which was diluted consecutively with methanol to producethe working solutions (0.04 to 200 ng/mL) used for spiking calibra-tion samples. The mixture of labeled compounds was diluted to 1ng/mL. Calibration samples were prepared in the 1.1 mL vials byadding 20-50 pL of stock solution and 50 pL solution of internalstandards to 1 mL LC-MS grade water. GERSTEL AppNote 237 Table 1: List of substances. Substance * Abbre-viation Molecular Formula CAS No Internal Standard used Perfluorobutanoic acid PFBA CHO,F, 375-22-4 13C -PFBA Perfluoropentanoic acid PFPeA C,HO,F。 2706-90-3 13C,-PFHxA Perfluorohexanoic acid PFHxA CHO,F 307-24-4 13C,-PFHxA Perfluoroheptanoic acid PFHpA C,HO,F13 375-85-9 13C -PFOA Perfluorooctanoic acid PFOA CgHO,F15 335-67-1 13C-PFOA Perfluorononanoic acid PFNA C,HO,F 375-95-1 13C_-PFNA Perfluorodecanoic acid PFDA CHO,F19 335-76-2 13C,-PFDA Perfluoroundecanoic acid PFUnDA CHO,F 2058-94-8 13C,-PFUnDA Perfluorododecanoic acid PFDoDA CHO,F23 206-203-2 13C,-PFDoDA Perfluorotridecanoic acid PFTrDA C13HO,F25 72629-94-8 13C,-PFDoDA Perfluorobutanesulfonic acid PFBS CHO.F,S 375-73-5 18O,-PFHxS Perfluoropentanesulfonic acid PFPeS C,HOFS 630402-22-1 18O,-PFHxS Perfluorohexanesulfonic acid PFHxS CHO,FI3S 355-46-4 18O,-PFHxS Perfluoroheptanesulfonic acid PFHpS CHOFS 357-92-8 13C-PFOS Perfluorooctanesulfonic acid PFOS C,HO.FS 1763-23-1 13C.-PFOS Perfluorononanesulfonic acid PFNS CHO.FS 98789-57-2 13C,-PFDA Perfluorodecanesulfonic acid PFDS C,HO,FS 335-77-3 13C,-PFUnDA Perfluoroundecanesulfonic acid PFUnS CgHO3F23S 749786-16-1 13C,-PFDoDA Perfluorododecanesulfonic acid PFDoS CHOFS 79780-39-5 13C,-PFDoDA Perfluorotridecanesulfonic acid PFTrS C,HOF,,S 791563-89-8 13C,-PFDoDA * For the sulfonic acids the corresponding Potassium (for PFBS) and Sodium salts were used for calibration and concentrations are given as such. Different water samples were analyzed: Tap water from our labora-tory, water from the river Ruhr in Mulheim an der Ruhr, Germany,groundwater from nearby, water from a mountain creek in Austriaand mineral water with high salt content purchased at a local su-permarket. For all water samples to be analyzed, 50 pL solutionof internal standards and 50 uL of methanol were added to 1 mLsample in the vial. Instrumentation The automated system consists of a MultiPurpose Sampler (MPSrobotic, GERSTEL) and an online SPE System (SPExs, GERSTEL)coupled to an LC-MS/MS system (Infinity Ⅱl 1260 Flexible Pumpand ULTIVO LC/TQ, Agilent Technologies, Waldbronn, Germany).SPE elution is performed using 0.25% ammonia in methanol de- livered from an additional isocratic HPLC pump (Infinity Ⅱ1260Iso Pump, Agilent Technologies). The eluate is merged with thestarting level buffer of the binary analytical pump in a valve fit-ted with a special T-rotor used in the SPExs system. As analyticalcolumn a Poroshell 120 EC-C18, 4.6 x 100 mm, 2.7 pm (AgilentTechnologies) was used. Between the binary pump and MPS, adelay column (Poroshell 120 EC-C18,4.6x50mm, 2.7 um, AgilentTechnologies) was installed. Injection was performed with a 2.5mL syringe into the injection valve on the MPS, fitted with a 1 mLstainless steel sample loop. Analysis Workflow The automated workflow consisted of initially conditioning thecartridge, first using 0.25% ammonia in methanol and then water.After injection of the sample into the loop, it was loaded ontothe cartridge using water. The cartridge was subsequently washedwith water, rinse solution (acetone/acetonitrile/formic acid), andmethanol. These steps were performed by the High-Pressure Dis-penser (HPD) unit of the SPExos (see figure 2). Figure 2: Flows during conditioning of the cartridge and loadingthe sample. Methanol from a solvent reservoir on the MPS is added to thevial and the vial contents then aspirated and injected into thesample loop of the injection valve, before starting the pumpsand switching the valves in elution position. The isocratic pumpelutes the cartridge with 0.25% methanol and the binary pump delivers 0.05% formic acid in water, merged in the T-rotor valve ofthe SPExos (see figure 3, top). After 7.5 minutes, the elution phaseis completed, and chromatography starts. Over the following 7minutes the binary pump delivers a gradient flow of 0.6 mL/minemploying water with 0.05% formic acid and methanol with 0.25%ammonia and 0.05% formic acid. During this time the SPExs sys-tem can be cleaned (see figure 3, bottom) and preparation of thenext sample begins (PrepAhead Mode). Clamp Left: 1000 bar ISS Valve1: 1000 bar ISS Valve2: 1000 bar Clamp Left: 1000 bar ISS Valve1: 1000 bar ISS Valve2: 1000 bar Analysis conditions LC Isocratic pump 0.25% NH, in methanol Time Flow(min) (mL/min)C 0.00.20.20.08.0 1.0 8.5 0.0Binary pump A -0.05% formic acid in waterB-0.25%NH,,0.05% formic acid in methanolTime Flow %B (min (mL/min)0.0 0.6 04.0 0.6 07.5 0.68.0 0.614 0.6 100 0.6 0 0.6 0 Analysis conditions MS Operation dynamic MRM Gas temperature 150°C Gas flow (N,): 11L/min Nebulizer pressure: 20 psi Sheath gas flow (N,): 12 L/min Sheath gas temperature: 400°C Capillary voltage: 4000V Nozzle voltage: 0V For each target compound and isotope labeled internal standard(ISTD) two MRM transitions were chosen, one quantifier and onequalifier (except PFBA und PFPeA, for which only one transitionhas sufficient intensity). Results and Discussion Usually in online-SPE, elution is performed using a gradient de-livered by the analytical pump. However, the WAX cartridgesare eluted with ammonia in methanol and this eluate cannot betransferred directly to the HPLC column. For this reason, an ex-tra (isocratic) HPLC pump elutes the cartridge, and the eluate issubsequently merged with the starting level buffer of the binaryanalytical mobile phase. This takes place in the SPExos system, us-ing a valve fitted with a special rotor. During this stage the ana-lytes reach the analytical column under isocratic conditions of 25%methanol (with 0.25%NH,) and 75% water with 0.05% formic acid.The short chain PFAS begin to migrate on the column, but thelonger chain PFAS are trapped at the beginning of the column.Switching the valve ends the elution step and starts the gradientchromatography, during which the methanol content is increasedrapidly to 80%, leading to focusing of first eluting peaks, while thelater eluting peaks are separated in the second gradient stage.The result is a chromatogram with nearly equidistant peaks for thecarbonic acids from C5 to C14. PFBA elutes a bit faster and in thechromatogram, the sulfonic acids elute close to the carbonic acidsthat have one more C atom (see figure 4). Figure 4: Example chromatogram for a standard solution (50 ng/L)in water with all recorded MRMs. Long chain perfluorinated acids dissolved in water are readily ad-sorbed on almost any type of surface. The DIN method thereforerecommends solutions with at least 40% methanol to avoid loss.EPA Method 8327 starts with diluting the water sample 1:1 withmethanol prior to direct injection. If samples with such high meth-anol content are injected to an SPE cartridge, short chain PFASare not retained. Using the MPS as injector, the sample vial canbe rinsed with methanol after the injection of the water sample.Injection of this rinse solution not only recovers analytes adsorbedon the surface of the vial, but also rinses injection syringe, sam-ple loop, and associated tubing with the result that all adsorbedanalytes were released, recovered, and transferred to the SPE car-tridge. In the method described here, the transfer of the rinsingsolution from the injection loop to the cartridge is done duringthe elution step, while the isocratic pump feeds eluent throughthe sample loop. This is possible because the rinsing solution onlycontains long chain PFAS, which are trapped during the elutionstep on the front of the analytical column, and no peak broaden-ing or splitting occurs. It is difficult to determine the absolute recovery of PFAS from wa-ter samples using this method because the absolute intensities ofdetector signals are highly dependent on the pH value and metha-nol content of the buffer when the analytes reach the MS. Injectinga small volume of standard solution directly to the column wouldlead to a completely different chromatogram. The peak intensitiesresulting from injecting a standard solution in water subjected toonline-SPE were compared to the peak intensities resulting frominjecting a standard solution in methanol with the same concen-tration directly onto the SPE cartridge using the transfer with theisocratic pump, as previously described. The results are shown infigure 5. The recovery of PFBA and some sulfonic acids is lower(which can be caused by the mentioned challenges), but there isno great discrepancy between long and short chain PFAS. The ef-ficiency of the vial wash approach is also demonstrated by the rel-ative recoveries achieved for standard solutions without vial washcompared to the same solutions analyzed with vial wash. Whileshort chain PFAS (carboxylic acids up to C10 and sulfonic acidsup to C8) are not affected, the long chain PFAS are recoveredless than 30% without vial wash, depending also on the lengthof time, over which the solution stays in the vial prior to injection(see figure 6). Figure 5: Recovery for a standard solution in water (1 mL, orange)compared to a standard solution in methanol (1 mL, blue) injecteddirectly on the prepared SPE cartridge. Figure 6: Recovery for selected analytes after 30 minutes (or-ange), 4 hours (blue) and 8 hours (grey) without washing the vialafter injection. Analyzing real water samples, we observed that the recovery of la-beled PFBA was much lower than for the other internal standardsused. It seems that the recovery of PFBA is negatively impactedby increased overall salt content. For the mineral water tested thesalt content was 2000 mg/L and the recovery of PFBA just around30%. Limits of Quantitation Method detection limits are not determined only by the sensitivityof the instrument, but also by the unavoidable blank values at subng/L level. The contribution from the buffers in the binary pumpcan be trapped on the delay column used, but for the isocraticcolumn this is not possible. However, the blank values were below1 ng/L and remained consistently at the same low levels through-out, given the closed system used for online-SPE. Limits of detection (LOD) and limits of quantitation (LOQ) werecalculated from calibration lines near the expected LOQ (0.2-2.0ng/L) as per the requirements of DIN 32645 [6]. Examples with andwithout significant blank values are given in figure 7. The calculat-ed LOQs are all below 1 ng/L, enabling monitoring at our belowthe 0.1 ug/L limit for the sum of PFAS compounds as stipulated bythe EU drinking water directive (table 2). In the case of high saltcontent in the sample, the recovery of labeled PFBA is lower andtherefore the quantification limit for PFBA (and PFPeA) has to beadjusted. Figure 7: Example calibration curves in the range of 0.2-2.0 ng/Lwith and without significant blank. Table 2: Limits of determination (LOD) and limits of quantitation(LOQ) obtained in accordance with DIN 32645 from 10-point cali-brations in the range 0.2 -2.0 ng/LL. Substance* LOD LOQ [ng/L] [ng/L] PFBA 0.14 0.44 PFPeA 0.27 0.82 PFHxA 0.13 0.42 PFHpA 0.19 0.58 PFOA 0.22 0.68 PFNA 0.13 0.42 PFDA 0.20 0.61 PFUnDA 0.17 0.54 PFDoDA 0.04 0.13 PFTrDA 0.15 0.46 PFBS 0.20 0.63 PFPeS 0.17 0.54 PFHxS 0.18 0.57 PFHpS 0.24 0.74 PFOS 0.23 0.69 PFNS 0.27 0.83 PFDS 0.25 0.76 PFUnS 0.24 0.74 PFDoS 0.25 0.76 PFTrS 0.27 0.81 * For the sulfonic acids the corresponding Potassium (for PFBS) and Sodium salts wereused for calibration and concentrations are given as such. Calibration For all compounds, the linear calibration range spans up to 10ug/L (see figure 8). After injection of higher concentration standardsolutions, we observed a slight carry over of some compounds inthe following chromatogram, but below 0.1%. To ensure the valid-ity of the quantitation limits, we recommend limiting the calibra-tion range to 1-1000 ng/L. For the water samples analyzed in thiswork, a 7-point calibration from 1 to 100 ng/L was used. Figure 8: Example calibration curves in the range of 1 - 10000ng/L for the first and the last analyte in the chromatogram. Repeatability and Trueness To show the applicability of the method and the trueness of deter-mination, water samples from different sources were measured inreplicate and spiked with two concentration levels (5 and 50 ng/L).Results from the 6-fold analyses of these samples are summarizedin table 3. Only low concentrations of some PFAS were detectedin tap water, river water and ground water. The highest concen-tration was 40 ng/L PFBA in the ground water sample analyzed.The river water contains 11 ng/L PFOA, and all other detectableconcentrations were below 10 ng/L. For the spiked tap water sample the trueness was between 74 and117% for all compounds. The repeatability (expressed as relativestandard deviation) was between 1 and 9% (average 5.9%) at lowlevel, and between 1 and 7% (average 3.2%) at high level, re-spectively. As is to be expected, the deviations were moderatelyhigher when using an internal standard that differs more from thetarget compound. This is the case mainly for PFPeA and somesulfonic acids. For the spiked river water sample, the trueness was between 72and 110% for all compounds. The repeatability was between 1and 9% (average 4.7%) at low level and 1 and 6% (average 2.7%)at high level, respectively. For the ground water sample the standard deviation for PFBA wassomewhat higher (13% for the original sample and 18% for thelow-level spiked sample) and the trueness for this compound inthe low-level spiked sample couldn't be determined, because thespiked amount of 5 ng/L was far below the initial concentration. Inthe high-level spiked sample, the trueness was 68%. For all other compounds the trueness was between 77 and 110% and therepeatability between 2 and 9% (average 4.3%) at low level, andbetween 1 and 9% (average 4.0%) at high level, respectively. As was to be expected, in the mountain creek water and mineralwater no PFAS was detected. While for the mountain creek true-ness (82-117%) and repeatability (2-9%, average 4.5% and 1-6%,average 2.5%), respectively, were excellent, in mineral water true-ness between 79 and 136% and repeatability at low level spikebetween 4 and 10% (average 5.9%) were slightly less impressiveThis probably was due to the high salt content of the mineralwater, and the fact that under these conditions the recovery oflabeled internal standards differs from that of various target com-pounds. At high level spike concentration, the repeatability wasmuch better, though (1 to 6%,average 2.9%). Example chromatograms from the river water sample below and above the quantifi-cation limit are shown in figure 9. GERSTEL AppNote 237 Table 3a: Results from 5-fold determination of PFAS in tap water, measured directly, and tap water spiked with 5 ng/L and 50 ng/L,respectively, of each compound. spiked with 5 ng/L spiked with 50 ng/L Average RSD Average RSD Trueness Average RSD Trueness PFBA 8,8 [%] [ng/L] [%] [%] [ng/L] 2% [%] PFPeA 5,6 7% 9,4 8% 74% 43,5 7% 76% PFHxA 4,4 4% 9,1 1% 94% 50,4 3% 92% PFHpA 1,9 6% 6,6 3% 95% 48,1 1% 92% PFOA <1 一 5,9 3% 117% 48,5 2% 97% PFNA <1 一 4,7 4% 95% 46,7 2% 93% PFDA <1 一 4,6 1% 92% 46,2 3% 92% PFUnDA <1 一 4,6 5% 92% 46,3 2% 93% PFDoDA <1 4,7 3% 94% 46,6 3% 93% PFTrDA <1 4,4 5% 87% 45,9 3% 92% PFBS 1,8 11% 6,4 5% 92% 42,2 4% 81% PFPeS <1 一 4,2 7% 84% 43,8 2% 88% PFHxS <1 4,5 9% 91% 46,2 2% 92% PFHpS <1 一 3,9 9% 79% 45,4 3% 91% PFOS <1 一 4,4 6% 88% 48,4 3% 97% PFNS <1 一 4,7 7% 94% 52,4 7% 105% PFDS <1 一 5,4 9% 109% 55,1 4% 110% PFUnDS <1 一 4,9 8% 98% 47,4 5% 95% PFDoDS <1 一 4,7 7% 93% 45,2 3% 90% PFTrS <1 4,6 7% 92% 43,6 4% 87% GERSTEL AppNote 237 Table 3b: Results from 5-fold determination of PFAS in river water, measured directly, and river water spiked with 5 ng/L and 50 ng/L,respectively, of each compound. River water spiked with 5 ng/L spiked with 50 ng/L Average RSD Average RSD Trueness Average RSD Trueness PFBA 5,8 [%] [ng/L] [%] [%] [ng/L] [%] %] PFPeA 5,3 20% 9,3 4% 80% 41,1 4% 72% PFHxA 6,1 3% 10,3 2% 84% 51,6 2% 91% PFHpA 3,0 3% 7,2 1% 84% 47,7 2% 89% PFOA 11,3 2% 14,8 1% 72% 58,9 3% 95% PFNA <1 一 5,0 2% 100% 47,7 1% 95% PFDA <1 一 4,9 3% 98% 46,9 1% 94% PFUnDA <1 一 4,6 3% 92% 46,2 2% 92% PFDoDA <1 4,6 3% 93% 46,6 1% 93% PFTrDA <1 4,3 4% 86% 45,9 3% 92% PFBS 3,7 9% 7,6 5% 78% 39,9 5% 72% PFPeS <1 一 4,5 5% 90% 45,5 3% 91% PFHxS <1 4,9 2% 98% 47,0 1% 94% PFHpS <1 一 4,1 8% 83% 44,0 2% 88% PFOS 2,0 10% 7,2 6% 103% 50,5 1% 97% PFNS <1 一 4,4 9% 88% 50,5 6% 101% PFDS <1 一 5,2 9% 105% 55,0 6% 110% PFUnDS <1 一 5,0 7% 99% 49,9 1% 100% PFDoDS <1 一 4,6 6% 91% 44,8 3% 90% PFTrDS <1 4,1 8% 82% 39,2 4% 78% GERSTEL AppNote 237 Table 3c: Results from 5-fold determination of PFAS in ground water, measured directly, and ground water spiked with 5 ng/L and50 ng/L, respectively, of each compound. spiked with 50 ng/L Average RSD Average RSD Trueness Average RSD Trueness [%] [ng/L] [%] [%] [ng/L] [%] [%] PFBA 39,8 13% 39,4 18% 73,7 5% 68% PFPeA <1 一 4,5 3% 89% 40,1 5% 80% PFHxA <1 一 4,9 2% 97% 45,0 2% 90% PFHpA <1 一 4,4 4% 88% 43,9 2% 88% PFOA 3,1 6% 7,9 3% 94% 53,7 7% 101% PFNA <1 4,6 2% 92% 45,4 1% 91% PFDA <1 一 4,6 3% 91% 45,2 1% 90% PFUnDA <1 一 4,5 3% 90% 45,0 2% 90% PFDoDA <1 4,5 3% 91% 44,5 1% 89% PFTrDA <1 一 4,1 4% 83% 42,9 3% 86% PFBS <1 一 4,1 4% 82% 39,5 3% 79% PFPeS <1 一 4,8 5% 95% 43,8 3% 88% PFHxS <1 4,4 3% 89% 44,3 2% 89% PFHpS <1 一 4,1 7% 83% 43,5 2% 87% PFOS <1 一 4,2 5% 83% 47,7 3% 95% PFNS <1 一 4,4 7% 88% 50,8 6% 102% PFDS <1 一 5,5 4% 110% 53,5 6% 107% PFUnDS <1 一 5,0 6% 101% 44,4 8% 89% PFDoDS <1 一 4,8 3% 95% 40,9 8% 82% PFTrDS <1 一 4,5 9% 89% 38,4 9% 77% *The spiked amount is far below the initial concentration. GERSTEL AppNote 237 Table 3d: Results from 5-fold determination of PFAS in mountain creek water, measured directly, and mountain creek water spiked with5 ng/L and 50 ng/L, respectively, of each compound spiked with 50 ng/L Average RSD Average RSD Trueness Average RSD Trueness [%] [ng/L] [%] [%] [ng/L] [%] [%] PFBA <1 一 4,1 5% 82% 45,8 1% 92% PFPeA <1 一 4,7 4% 93% 46,0 3% 92% PFHxA <1 一 4,9 4% 98% 46,2 2% 92% PFHpA <1 一 4,5 5% 90% 45,5 1% 91% PFOA <1 一 5,1 4% 102% 47,8 2% 96% PFNA <1 一 4,8 5% 96% 47,5 2% 95% PFDA <1 一 4,7 4% 94% 46,4 2% 93% PFUnDA <1 一 4,7 4% 95% 46,6 1% 93% PFDoDA <1 4,7 3% 94% 46,8 2% 94% PFTrDA <1 一 4,4 2% 89% 46,1 2% 92% PFBS <1 一 4,2 5% 84% 43,7 2% 87% PFPeS <1 一 4,4 3% 87% 44,7 1% 89% PFHxS <1 4,8 5% 97% 46,4 2% 93% PFHpS <1 一 4,2 9% 84% 44,3 3% 89% PFOS <1 一 4,3 7% 86% 49,1 4% 98% PFNS <1 一 4,8 2% 96% 55,0 6% 110% PFDS <1 一 5,4 5% 109% 58,5 2% 117% PFUnDS <1 一 4,9 6% 98% 49,9 3% 100% PFDoDS <1 一 4,8 4% 95% 46,1 4% 92% PFTrDS <1 4,7 6% 93% 44,4 4% 89% GERSTEL AppNote 237 Table 3e: Results from 5-fold determination of PFAS in mineral water, measured directly, and mineral water spiked with 5 ng/L and50 ng/L, respectively, of each compound. spiked with 5 ng/L spiked with 50 ng/L Average RSD Average RSD Trueness Average RSD Trueness [%] [ng/L] [%] [%] [ng/L] [%] [%] PFBA (1,7)* 10% 6,8 9% 104% 53,3 1% 103% PFPeA (1,8)* 3% 5,8 6% 79% 45,8 6% 88% PFHxA <1 一 5,6 6% 111% 50,6 2% 101% PFHpA <1 一 4,7 4% 94% 48,1 1% 96% PFOA <1 一 5,5 10% 110% 53,1 2% 106% PFNA <1 一 5,1 6% 102% 51,7 2% 103% PFDA <1 一 5,1 4% 101% 50,6 1% 101% PFUnDA <1 一 5,0 4% 100% 50,9 2% 102% PFDoDA <1 5,1 4% 102% 52,0 1% 104% PFTrDA <1 一 4,8 4% 96% 52,3 3% 105% PFBS <1 一 4,4 9% 88% 45,2 5% 90% PFPeS <1 一 4,5 5% 90% 48,5 3% 97% PFHxS <1 4,9 5% 98% 50,6 2% 101% PFHpS <1 一 4,2 7% 84% 48,2 3% 96% PFOS <1 一 4,8 7% 95% 52,2 3% 104% PFNS <1 一 5,7 4% 115% 55,7 6% 111% PFDS <1 一 6,6 5% 131% 67,8 3% 136% PFUnDS <1 一 6,0 8% 120% 61,9 3% 124% PFDoDS <1 一 5,5 6% 110% 59,2 4% 118% PFTrDS <1 5,3 7% 106% 55,6 5% 111% * Given the low recovery of labelled PFBA used as internal standard, the quantification limit of these compounds is higher. The measured concentrations were used incalculation of trueness. GERSTEL AppNote 237 Figure 9: Example chromatograms for selected analytes in river water (upper traces are from the corresponding internal standards),PFBA and PFOA above, PFHxS and PFDoDA below quantification limit. Conclusions The online SPE-LC-MS/MS system combined with the presentedmethod enables fully automated determination of PFAS com-pounds listed in the EU Drinking Water Directive in the low ng/Lrange. The main benefits are simple sample handling, very lowsolvent consumption and excellent reproducibility. The organicwash of the cartridges prior to elution effectively removes matrixinterferences and improves the accuracy of the results. Also, there is no need to filter water samples or dilute with metha-nol prior to analysis. Rinsing the vial with methanol after the sam-ple has been injected and subsequently injecting the rinse solu-tion to the analysis system results in the transfer of adsorbed PFASand remaining fine sediment particles to the SPE cartridge fromwhere they are eluted to the analysis system and included in theanalysis. The method accuracy and trueness were demonstratedfor water samples from different sources, resulting in relative stan-dard deviations below 10% and trueness mainly between 80 and110% References [1]CDIRECTIVE (EU) 2020/2184 OF THE EUROPEAN PARLIA-MENT AND OF THE COUNCIL of 16 December 2020 on thequality of water intended for human consumption (recast). [2] J.R. Shoemaker , D.A. Tettenhorst, EPA Method 537.1: Deter-mination of Selected Per-and Polyfluorinated Alky/ Substanc-es in Drinking Water by Solid Phase Extraction and LiquidChromatography/Tandem Mass Spectrometry (LC/MS/MS).U.S. Environmental Protection Agency, Office of Researchand Development, National Center for Environmental Assess-ment, Washington, DC, 2018. [3]L. Rosenblum, S.C. Wendelken, EPA Method 533: Determina-tion of Per- and Polyfluoroalkyl Substances in Drinking Waterby Isotope Dilution Anion Exchange Solid Phase Extractionand Liquid Chromatography/Tandem Mass Spectrometry.2019 Edition, December 2019 [4]LDIN 38407-42 German standard methods for the examinationof water, waste water and sludge-Jointly determinable sub-stances (group F)- Part 42: Determination of selected poly-fluorinated compounds (PFC) in water - Method using highperformance liquid chromatography and mass spectrometricdetection (HPLC/MS-MS) after solid-liquid extraction (F42).2011 Edition, March 2011. [5] SW-846 Test Method 8327: Per-and Polyfluoroalkyl Substanc-es (PFAS) by Liquid Chromatography/Tandem Mass Spec-trometry (LC/MS/MS). 2021 Edition, July 2021. [6] DIN 32645 Chemical analysis - Decision limit, detection lim-it and determination limit under repeatability conditions -Terms, methods, evaluation. 2008 Edition, November 2008.
确定


还剩13页未读,是否继续阅读?

产品配置单

GERSTEL(哲斯泰)为您提供《使用在线SPE-LC-MS/MS测定饮用水中的PFAS-根据欧盟饮用水指令和DIN38407标准》,该方案主要用于饮用水中有机污染物检测,参考标准--,《使用在线SPE-LC-MS/MS测定饮用水中的PFAS-根据欧盟饮用水指令和DIN38407标准》用到的仪器有GERSTEL自动进样器 MPS robotic
相关方案
更多
该厂商其他方案
更多