


方案详情
文
本篇文章使用了velp oxitest油脂氧化分析仪来评估在无麸质面包中添加不同比例的生咖啡内果皮的影响,以在保质期内改善结构、质量和化学性质。
方案详情

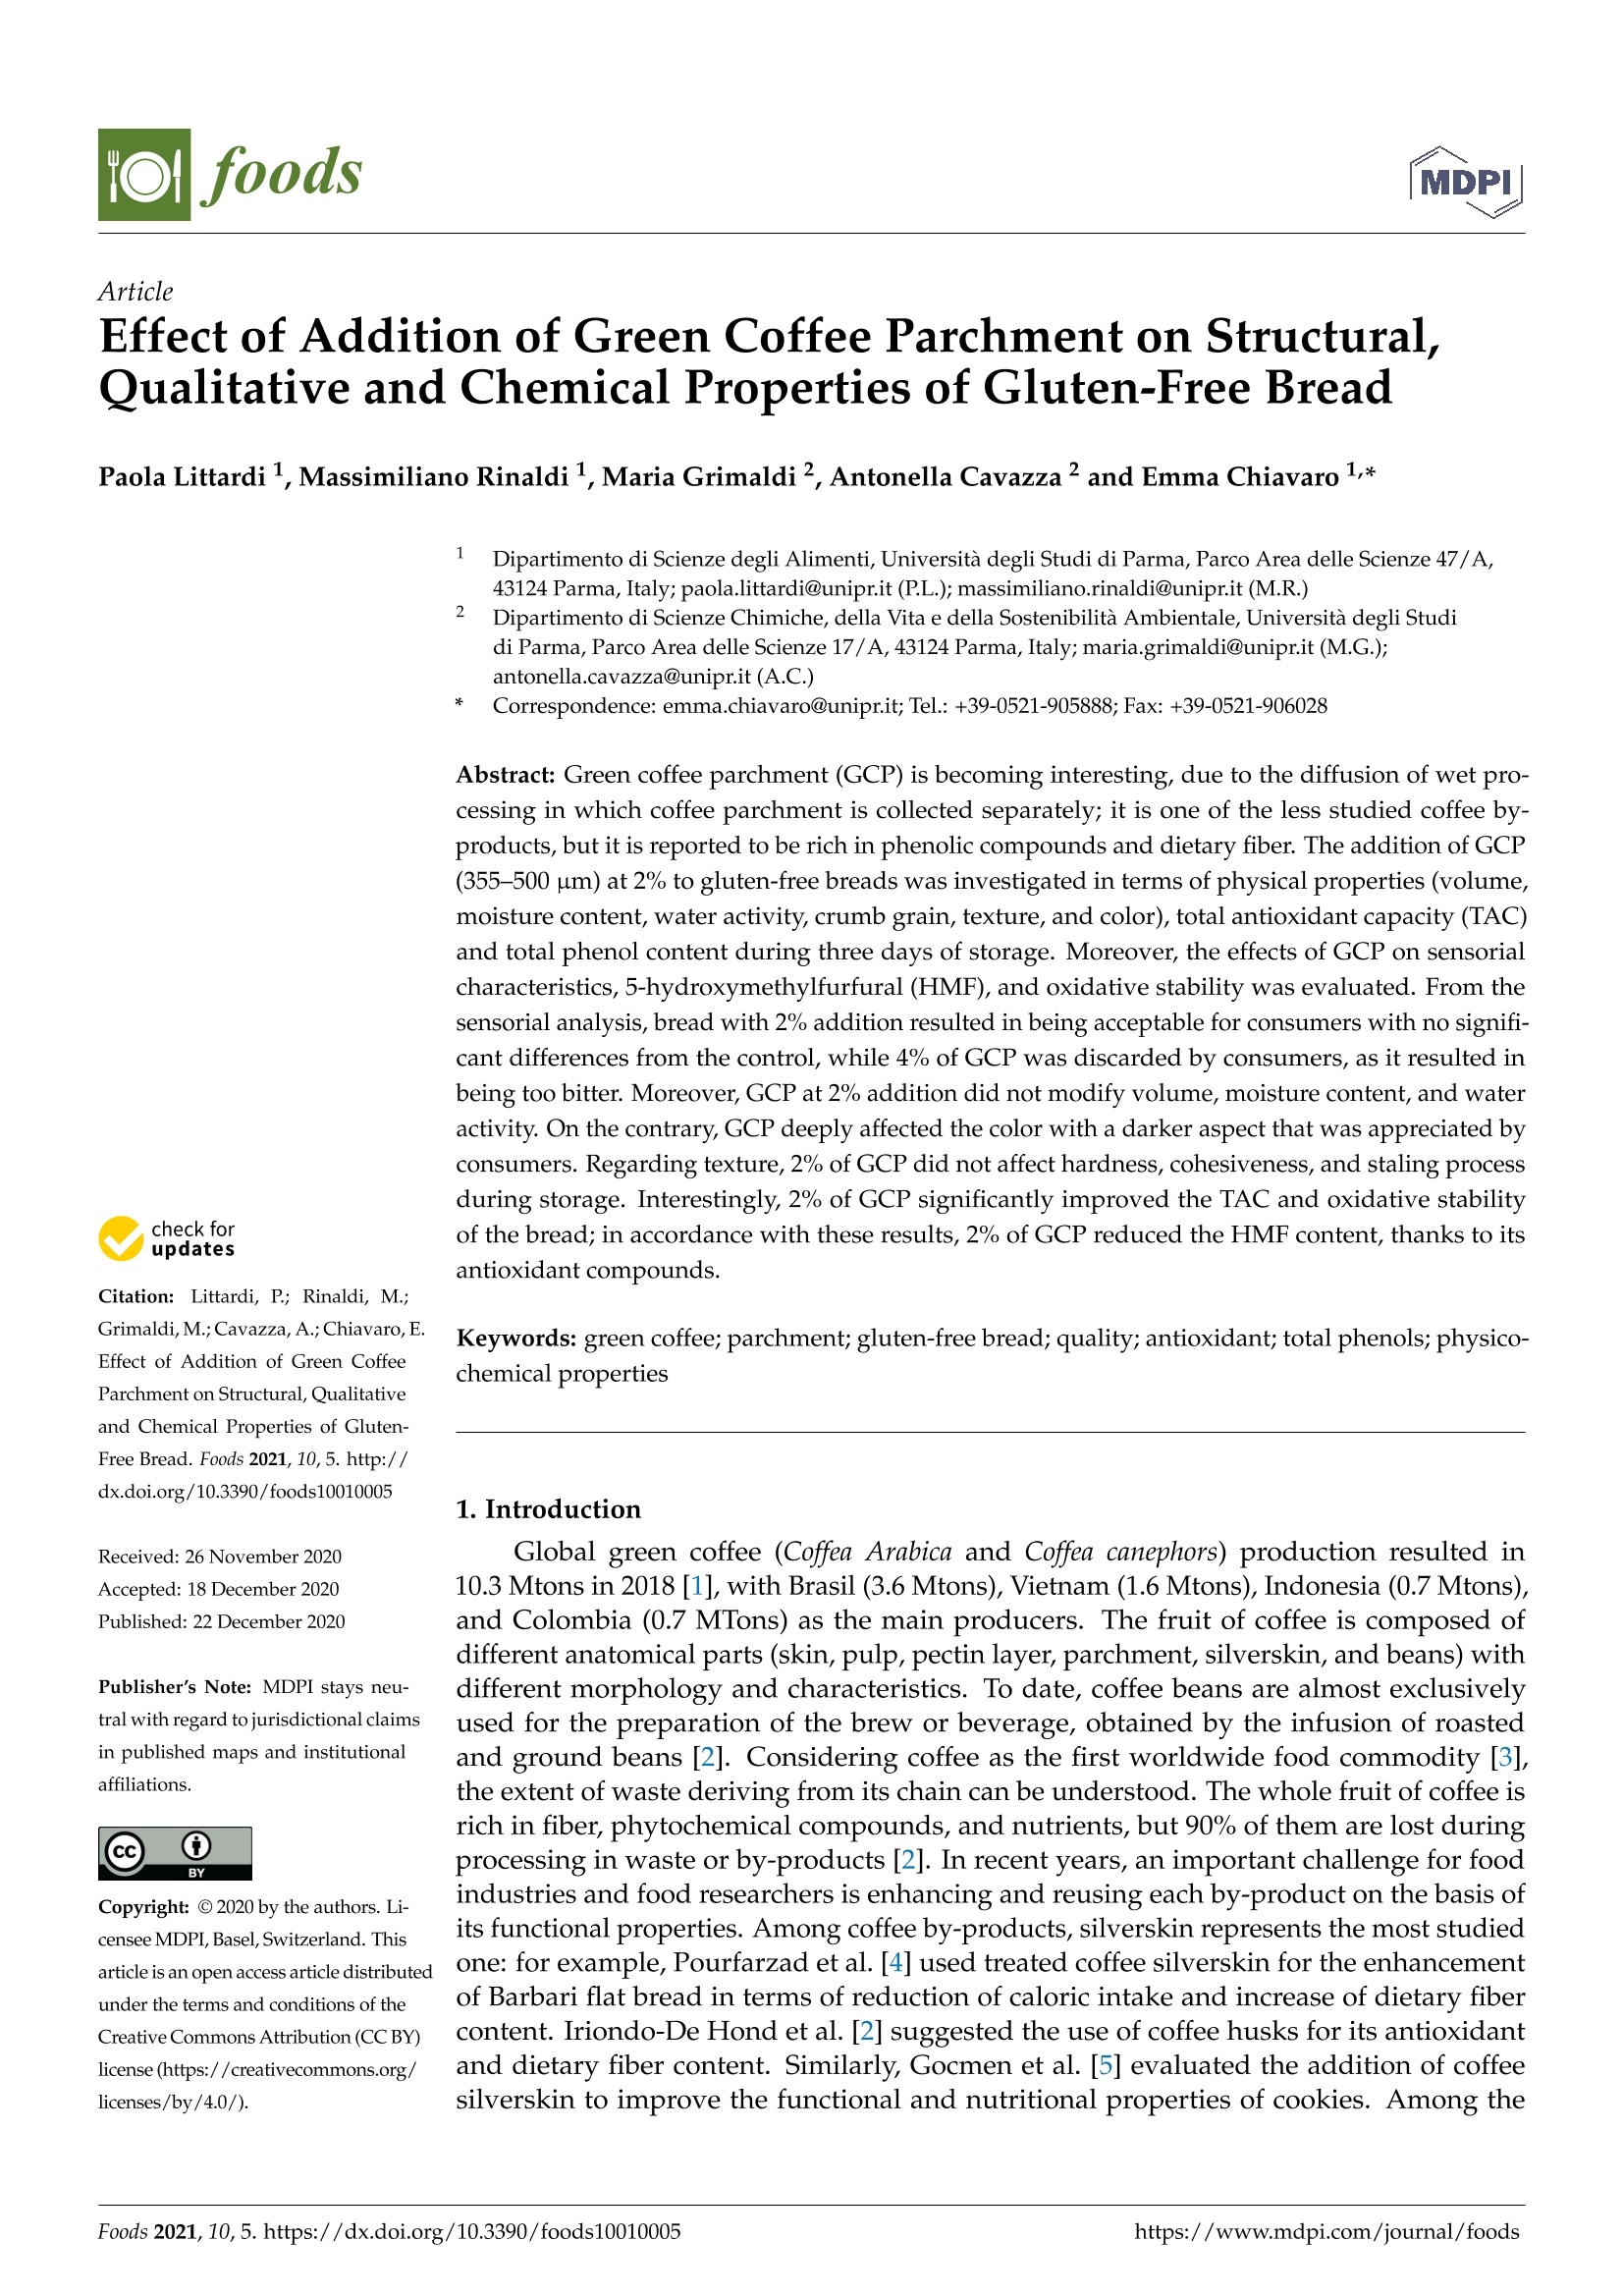
2 of 13Foods 2021,10,5 Foods 2021,10,53 of 13 Foods 2021, 10, 5. https://dx.doi.org/10.3390/foods10010005https://www.mdpi.com/journal/foods FOODS ARTICLE VELP OXITEST OXIDATION STABILITY REACTOR Effect of Addition of Green CoffeeParchment to Gluten-Free Bread WWW.VELP.COM Citation: Littardi, P.; Rinaldi, M.;Grimaldi, M.; Cavazza, A.;Chiavaro,E.Effect of Addition of Green CoffeeParchment on Structural,Qualitativeand Chemical Properties of Gluten-Free Bread. Foods 2021, 10,5. http://dx.doi.org/10.3390/foods10010005 Received: 26 November 2020 Accepted: 18 December 2020Published: 22 December 2020 Publisher's Note: MDPI stays neu-tral with regard to jurisdictional claimsin published maps and institutionalaffiliations. Copyright: O2020 by the authors. Li-censee MDPI, Basel, Switzerland. Thisarticle is an open access article distributedunder the terms and conditions of theCreative Commons Attribution (CC BY)license (https://creativecommons.org/licenses/by/4.0/). Effect of Addition of Green Coffee Parchment on Structural.Qualitative and Chemical Properties of Gluten-Free Bread Paola Littardi 1, Massimiliano Rinaldi 1, Maria Grimaldi 2, Antonella Cavazza2 and Emma Chiavaro 1* 1 Dipartimento di Scienze degli Alimenti, Universita degli Studi di Parma, Parco Area delle Scienze 47/A,43124 Parma, Italy; paola.littardi@unipr.it (P.L.); massimiliano.rinaldi@unipr.it (M.R.) 2 Dipartimento di Scienze Chimiche, della Vita e della Sostenibilita Ambientale, Universita degli Studidi Parma, Parco Area delle Scienze 17/A, 43124 Parma, Italy; maria.grimaldi@unipr.it (M.G.);antonella.cavazza@unipr.it (A.C.) Correspondence: emma.chiavaro@unipr.it;Tel.: +39-0521-905888; Fax: +39-0521-906028 Abstract: Green coffee parchment (GCP) is becoming interesting, due to the diffusion of wet pro-cessing in which coffee parchment is collected separately; it is one of the less studied coffee by-products, but it is reported to be rich in phenolic compounds and dietary fiber. The addition of GCP(355-500 um) at 2% to gluten-free breads was investigated in terms of physical properties (volume,moisture content, water activity, crumb grain, texture, and color), total antioxidant capacity (TAC)and total phenol content during three days of storage. Moreover, the effects of GCP on sensorialcharacteristics, 5-hydroxymethylfurfural (HMF), and oxidative stability was evaluated. From thesensorial analysis, bread with 2% addition resulted in being acceptable for consumers with no signifi-cant differences from the control, while 4% of GCP was discarded by consumers, as it resulted inbeing too bitter. Moreover, GCP at 2% addition did not modify volume, moisture content, and wateractivity. On the contrary, GCP deeply affected the color with a darker aspect that was appreciated byconsumers. Regarding texture, 2% of GCP did not affect hardness, cohesiveness, and staling processduring storage. Interestingly, 2% of GCP significantly improved the TAC and oxidative stabilityof the bread; in accordance with these results,2% of GCP reduced the HMF content, thanks to itsantioxidant compounds. Keywords: green coffee; parchment; gluten-free bread;quality; antioxidant; total phenols; physico-chemical properties 1. Introduction Global green coffee (Coffea Arabica and Coffea canephors) production resulted in10.3 Mtons in 2018 [1], with Brasil (3.6 Mtons), Vietnam (1.6 Mtons), Indonesia (0.7 Mtons),and Colombia (0.7 MTons) as the main producers. The fruit of coffee is composed ofdifferent anatomical parts (skin, pulp, pectin layer, parchment, silverskin, and beans) withdifferent morphology and characteristics. To date, coffee beans are almost exclusivelyused for the preparation of the brew or beverage, obtained by the infusion of roastedand ground beans [2]. Considering coffee as the first worldwide food commodity [3],the extent of waste deriving from its chain can be understood. The whole fruit of coffee isrich in fiber, phytochemical compounds, and nutrients, but 90% of them are lost duringprocessing in waste or by-products [2]. In recent years, an important challenge for foodindustries and food researchers is enhancing and reusing each by-product on the basis ofits functional properties. Among coffee by-products, silverskin represents the most studiedone: for example, Pourfarzad et al. [4] used treated coffee silverskin for the enhancementof Barbari flat bread in terms of reduction of caloric intake and increase of dietary fibercontent. Iriondo-De Hond et al. [2] suggested the use of coffee husks for its antioxidantand dietary fiber content. Similarly, Gocmen et al. [5] evaluated the addition of coffeesilverskin to improve the functional and nutritional properties of cookies. Among the components of the green fruit parchment, a fibrous endocarp that wraps and separatesthe seeds of coffee, represents ~6.1% of the weight of the entire fruit [3,6], and its reusewas partially studied. The parchment content in phenolic compounds is reported to be1.2-3.1 mg g-1 GAE [7], while its fiber content is about 92%[2]. Cubero-Castillo et al. [6]studied coffee parchment-enriched biscuits and observed that 2% of supplementation waswell accepted by panelists, and biscuits showed 5.4%of fiber content and an antioxidantactivity of 1116 umol TE/100 g. Moreover, parchment was suggested as an antifungaladditive with potential uses for food preservation [8]. Finally, the safety of coffee parch-ment was demonstrated by the absence of pesticides and mycotoxins (aflatoxin B1 andenniantin B) [9]. Coffee parchment is a by-product of coffee wet processing, in which the coffee parch-ment is removed after drying and hulling in distinct steps, which permits its collectionand use separately from other by-products [3]. By considering that approximately 40% ofall coffee around the world is wet processed, because it is considered to produce superiorquality [10], coffee parchment represents an important waste and deserves valorization. In the last decades, with the growing number of people affected by celiac disease,the market increased the call for gluten-free bakery products, that are known to be in-trinsically poor in fiber [11]. Aqueous extracts of coffee silverskin and husk were addedin gluten-free bread to obtain healthier products [12]. In this direction, the use of greencoffee parchment could be an interesting solution to improve both the fiber and nutraceu-ticals content of gluten-free bread. On the other hand, it is well known that the additionof dietary fiber from different origins could affect the quality characteristics of the finalproduct [13]. For these reasons, the aim of this study is to evaluate, for the first time in theliterature, the addition of ground green coffee parchment to gluten-free bread, consideringthe physical, physico-chemical, and sensory properties during shelf life. 2. Materials and Methods 2.1. Green Coffee Parchment Characteristics The moisture, protein, lipid, and ash of green coffee parchment were determined usingstandard procedures [14]. Moisture content was determined in the oven at 105C for 24 h.Crude fat content (AOAC, Method 920.39) [14] was determined with diethylether, usingan automatized Soxhlet extractor (SER 148/3 VELP SCIENTIFICA, Usmate Velate, Italy).Total ash was determined in a muffle furnace at 550 °C for 10 h (AOAC,Method 923.03)[12].Total nitrogen (AOAC, Method 955.04) [14] was determined with a Kjeldahl system (DKLheating digestor and UDK 139 semiautomatic distillation unit, VELP SCIENTIFICA),while fiber was determined with the gravimetric method (AOAC, Method 7.504) [14]. Water binding capacity (WBC), water absorption index (WAI), water solubility index(WSI), and water holding capacity (WHC) were determined on green coffee parchment [15].WBC is defined as the amount of water retained by the sample under low-speed cen-trifugation: 1.000 ± 0.005 g of samples were mixed with distilled water (10 mL) andcentrifuged at 2000× g for 10 min. WAI or swelling capacity and WSI were determinedon 50.0 mg ± 0.1 mg of green parchment samples dispersed in 1.0 mL of distilled waterand cooked at 90 °C for 10 min in a water bath under stirring. The cooked paste wascooled in an ice water bath for 10 min, and then centrifuged at 3000×g at 4°C for 10 min.The supernatant was decanted into an evaporating dish and the weight of dry solids wasrecovered by evaporating the supernatant at 105 °C till constant weight. Pellets (Wr) anddried supernatants (Ws) were weighed and WSI or WAI were calculated as follows: WHC is defined as the amount of water retained by the sample without being subjectedto any stress: 1.000 ±0.005 g of samples were mixed with distilled water (10 mL) and keptat room temperature for 24 h. The supernatant was decanted. The results were expressedas grams of water retained per gram of solid, as the average of three replicates. The pH of the parchment was determined by means of triplicate measurements witha pHmeter (Jenway, Staffordshire, UK) on parchment/distilled water suspension at a1:10 ratio [14]. 2.2. Bread Samples Preparation and Storage A commercial (Dr. Schar AG/SPA, Burgstall (BZ), Italy) gluten-free bread mixture waspurchased at a local supermarket and showed the following ingredients on the productlabel: corn starch, rice flour, vegetable fibers (psyllium,bamboo), whole rice flour (3.8%),lentil flour (3.6%), dextrose, thickening agent (hydroxypropylmethylcellulose), and salt.The proximate composition on 100 g of the mixture was: moisture 11.2 g, carbohydrates80 g (sugars 1.4 g), fat 0.9 g (saturated 0.2 g), fibers 4.4 g, proteins 2.7 g, and salt 0.8 g.The ground green coffee parchment (P) was kindly donated by the company Ferri dal 1905(CastelGoffredo, MN, Italy) and a particle size in the range 355-500 um was obtained bymeans of mechanical sieving. Control bread samples (C) were prepared with the following recipe: gluten-free breadmixture (250.0 g), tap water (200.0g), sunflower oil (10.0 g), compressed brewer’s yeast (5 g),and salt (2.5g). All the ingredients were purchased from a local supermarket. The recipewas developed starting from the instructions reported on the label of the gluten-freemixture with little adjustments for obtaining an acceptable product with the bread machineused in this work. Parchment breads (PB) were produced, substituting 2% (corresponding to 5 g) of themixture with P. Higher levels of substitution were not analyzed because previous consumeracceptance tests revealed that substitution at 4% conferred a marked bitter flavor to the finalproduct, maybe due to the presence of caffeine: as caffeine content in the coffee parchmentwas reported to be about 58 mg/g [2], with 10 g of P, the concentration of caffeine will be1.6mg/g of bread. A domestic bread machine (Moulinex, Groupe Seb Italia S.p.A.,Milano, Italy) wasused for breadmaking, with a rapid program: stirring + kneading + rising, 80 min; bak-ing, 55 min at 210 °C. Samples were then cooled down at room temperature for at least2 h and packaged in alcohol-sprayed sealed air-tight plastic bags, stored in the dark at25°C in a temperature-controlled chamber (ISCO9000, Milan, Italy) and analyzed at 0,1,and 3 days (Do, Di and D3) of shelf life. Three batches were produced and analyzed foreach bread formulation. 2.3. Bread Physical Analyses Specific volume (V,mL/g) of breads was determined by rapeseed displacementmethod in triplicate according to the AACC Approved Method 10-05.01 [16]. Moisture content (MC, g/100g) of the bread crumb was determined in triplicate oneach sample by drying at 105 °C to constant weight AACC standard method, 44-15.02[16].Water activity (aw) of crust and crumb was measured at 25 C (AQUALAB, DecagonDevices Inc.,Pullman, Washington,DC, USA). Three replicates for each batch per samplewere measured. Crumb grain was evaluated by means of a digital image analysis system, as previouslyreported [17]. Images of 3 central slices (thickness 20 mm) of each loaf were acquiredwith a scanner (Hewlett Packard, Palo Alto, CA, USA) at 600 dots per inch (dpi) takingsquares of 40 ×40 mm from the center of the images after calibration, standardization,and optimization by means of ImageJ (National Institutes of Health (NIH), Maryland, USA)software. The number of pores (expressed as percentage of the total number) was obtainedaccording to four pre-selected dimensional classes (cl.1: 0.01-0.099 mm²; cl.2:0.1-0.199 mm²;c1.3:0.2-0.99 mm²; c1.4:>1 mm2). Texture analysis was performed on the crust and crumb using a TA.XT2 Texture Ana-lyzer equipped with a 25 kg load cell (Stable Micro Systems, Godalming, UK) and TextureExpert for Windows software (version1.22) for data analysis on each loaf. The maximumpeak force obtained from the crust puncture test (P3 stainless steel probe, speed of 2 mm/s)was taken from the penetration curve on the whole loaf and considered as hardness (N).Crumb evaluation was carried out with a TPA test (P/35 cylindrical aluminum probe, speedof 2 mm/s up to the 40% of the original sample height) on ten cubes of 20 ×20 ×20 mmextracted from two central slices of the samples. The textural parameters considered werehardness (maximum peak force of the first compression cycle,N), cohesiveness (ratio ofpositive force area during the second compression to that during the first compressionarea, dimensionless), springiness (ratio of the length of the second to the first compressionpeak), resilience (area during the withdrawal of the penetration, divided by the area ofthe first penetration, dimensionless), and chewiness (product of hardness x cohesiveness xspringiness, N) [18]. Color was determined on fifteen pre-selected locations of the crust and crumb ofeach bread loaf. The analyses were performed using a Minolta Colorimeter (CM 2600d,Minolta Co., Osaka,Japan) equipped with a standard illuminant D65 and a 10° position ofthe standard observer. L* (lightness), a* (redness) and b* (yellowness) were quantified oneach sample using the Spectramagic software (Ver. 3.6) after calibration with white andblack tiles. 2.4. Bread Chemical Analyses Chemicals Water(MilliQ), ethanol 96%, methanol 99%, acetone, sodium carbonate, Folin-Ciocalteureagent, Carrez I and Carrez II reagents, DPPH (2,2-diphenyl-1-picrylhydrazyl), 5-hydroxymethylfurfural, and gallic acid analytical standard were all purchased fromSigma-Aldrich. 2.5. Total Phenolic Content (TPC), Total Antioxidant Capacity (TAC), and Oxitest Of the sample, 1.2 g were added to 20 mL of acetone, sonicated for 30 min, and cen-trifuged at 24°C and 6000 rpm for 10 min. The supernatant was collected in a flask:this operation was repeated three times ensuring a complete extraction. The extract wasdried under a gentle nitrogen stream, then 10 mL of ethanol were added, and the solutionwas filtered through a PTFE filter 0.45 um×25 mm. For the evaluation of the total phenolic content (TPC), 50 uL of sample extract wereadded to 1160 uL of water (MilliQ), 300 uL of sodium carbonate 20% w/w, and 100 uLof the Folin-Ciocalteu reagent; the solution was then incubated at 40°C for 30 min [13].An identical preparation was performed in the absence of the sample for blank evaluation.Absorbance was measured at 760 nm on a UV-vis Spectrophotometer (Thermo ScientificTMEvolutionTM 201/220). The TPC value was expressed as ug of GAE (gallic acid equiva-lent)/g of dry sample. The calibration curve was built using gallic acid in the concentrationrange from 0.78 to 25 ug/mL. All analyses were performed in triplicate. The total antioxidant capacity (TAC,%) was determined following the method pre-viously reported [19]. An amount of 500 uL of the sample extracts, prepared as for totalphenolic compounds determination, was added to 1.5 mL of freshly-prepared 60 uM2,2-diphenyl-1-picrylhydrazyl (DPPH) radical solution in methanol. After 30 min, the ab-sorbance of the solution was measured at 517 nm. The observed value was compared tothat of the DPPH radical solution in methanol and read at the same wavelength, but att=0 min. The oxidative stability was measured by Oxitest (Velp Scientifica, MB, Italy) at thefollowing operative conditions: 30 g of minced bread were placed in the reactor chamberat the temperature of 90 °C and oxygen pressure of 6 bar. Measures were performedin duplicate. 2.6. Determination of 5-HMF High Performance Liquid chromatography coupled to UV-DAD detector (Agilent1200 series, Milan, Italy),set at wavelength to 283 nm, was used for the determinationof 5-hydroxymethylfurfural (HMF). Next, 1.2 g of minced bread were mixed with 7 mLof distilled water and centrifuged at 25°C at 5000 rpm for 10 min. The supernatant wascollected and added to 1.5 mL of Carrez I (15%w/v), and 1.5 mL of Carrez II (30%w/v)reagent to precipitate the protein fraction. Then it was centrifuged at 5000 rpm for 10 minand 25°C, and filtered through a Nylon filter 0.45 um × 25 mm. This procedure wasrepeated in triplicate for C and PB on fresh bread (Do). The chromatographic separation of the analytes was carried out by means of a Phe-nomenex, Luna C18 (2) 100A 5 um, (250×2 mm) operating at a flow of 0.500 mL/min.The elution was performed by combination of eluent A (H2O/HCOOH 95:5) and eluentB (acetonitrile/HCOOH 95:5) according to the following gradient: from 0 to 2 min,% Bincreased from 10 to 20 and held until 6 min; from 6 to 7 min % B was raised up to 100holding for 5 min. Finally, the column was reconditioned for 5 min. For the quantitative determination, a calibration curve was built by using five levelsof standard concentration of the standard in the range between 0.06 mg/L and 0.2 mg/L;after checking the linearity range, the limits of detection and quantitation were evaluated(LOD =0.02 mg/L; LOQ=0.06 mg/L)". All solutions were analyzed in triplicate. 2.7. Sensory Analysis A pairwise panel test was done with 25 non-trained panelists (age range from 20 to56 and 15 females/10 males) to assess differences in terms of aspect, pores, consistency,taste, and flavor and overall assessment on bread cubes. Each sample was identified by athree-digit code. The participants were asked to refrain from eating, smoking, drinking,or chewing gum for 1 h prior to testing. They were asked to give a score on a 9-pointhedonic scale from 1 (dislike extremely) to 9 (like extremely) for several descriptors (aspect,crumb grain, texture, taste, and overall appeal) and the possibility to write free comments. 2.8. Statistical Analysis Means and standard deviations calculated with SPSS (v. 26.0, SPSS Inc., Chicago,IL, USA) statistical software were used to perform one way (ANOVA) with a Tukey-Kramer post-hoc test to evaluate the effect of storage at a significance level of 0.05 (p<0.05).At test(p≤0.05) was also performed to analyze differences between control and parchment-supplemented bread at the same day of storage. 3. Results and Discussion 3.1. Green Coffee Parchment Characteristics The centesimal composition of green coffee parchment showed a high presence offiber (64.3±3.2g/100g), followed by protein (17.4±2.1 g/100 g), ash (6.3±1.7 g/100 g),and lipid (4.1 ±0.3 g/100 g) with a moisture content of 7.9 ±1.6 g/100 g, while the pH ofgreen coffee parchment was about 6.6±0.2. The high presence of fiber and the substantiallylow fat content make this by-product an interesting ingredient for fiber fortification ingluten-free bread production. Hydration properties showed the following values: WBC4.49±0.17 g/g, WHC 5.44 ±0.41 g/g, WAI 11.94 ±3.06 g/g, WSI 0.33 ±0.13 g/g.Obtained hydration properties are very similar to those reported for coconut residues [20]that presented a very similar total fiber content and a predominant insoluble fraction.Particularly, WHC values of coffee parchment was similar to wheat bran [21] with apossible encouraging application in bread. 3.2. Bread Physical Characterization The specific volume of bread loaves (Figure 1) was 3.6 mL/g both for C and P samples,being not affected by the presence of the green coffee parchment. In contrast with what wasobserved by Rinaldi et al. [13] for similar granulometries of cocoa bean shell addition togluten-free bread, the specific volume was not influenced by the storage time remaining inthe range 3.6-3.8 mL/g both in C and PB. Other authors [22] observed a significant volumeincrease with insoluble fiber addition to gluten-free bread, while Gomez et al. [23] evi-denced a significant volume decrease for the addition of coffee-derived fiber in traditionalwheat bread. Figure 1. Specific volume (mL/g), mean and standard deviation, of control (C) and parchment supplemented (PB)bread loaves. Different small and capital letters, for C and PB, respectively, in-dicate significant differences (p≤ 0.05)during storage. Crumb moisture content (Figure 2) remained constant in PB and C (~46g/100 g),maybe due to the considered short shelf life [13]. Considering that the moisture gradientbetween crumb and crust allows the migration of water between these two regions duringstorage [20], the packaging in alcohol-sprayed sealed air-tight plastic bags maybe havereduced this effect. No significant differences were evidenced between C and PB, due to theinsoluble fiber of the green coffee parchment. In accordance with moisture content, wateractivity was in the range 0.94-0.95 for both samples during storage without no significantdifferences. This result is in accordance with the expected high content of insoluble dietaryfiber of coffee parchment compared to other by-products that act as a physical binder ofwater without any effect on water activity [2]. Figure 2. Moisture content (g/100 g), mean and standard deviation, of control (C) and parchment supplemented (PB) breads.Different small and capital letters, for C and PB, respectively, indicate significant differences (p≤0.05) during storage. Figure 3. Appearance of control and parchment enriched breads. (a) (b) Figure 4. (a) Numberof holes (%), mean and standard deviation, for the selected dimensional clasScheme 0.099;0.1-0.199;0.2-0.99;>1.0) in fresh (day 0) control (C) and parchment bread (PB). (b)Number of holes (%) belonging to classes 0.01-0.09 mm²and 0.2-0.99 mm² in PB during storage. Different small and capital letters, for the two classes, respectively, are significantlydifferent (p<0.05). No significant differences were evidenced in C bread during storage concerning the %of holes for the considered dimensional classes. On the other hand, in PB, the 0.01-0.09 mm-and 0.2-0.99 mm² classes significantly varied during storage (Figure 4b). The decreasing% of holes belonging to the smallest class (0.01-0.09 mm²) in favor of the increasing % ofthem belonging to bigger one (0.2-0.99 mm²) was observable. This was probably due tothe ability of parchment to bind water, hindering the formation and stabilization of smallholes during bread production [24], but during storage, the holes’ walls were subjected todehydration and got thinner by increasing their dimensions [25]. Colorimetric data are reported in Table 1. Crust and crumb PB lightness (L*) werenot affected during storage but showed significant lower values than C bread even if themoisture content was comparable between the two samples (Figure 2). This was due tothe natural darker color of parchment (in crust and crumb). The redness/greenness andyellowness/blIOWueness parameters (a* and b*, respectively) were both influenced by thepresence of coffee parchment especially in crumb: higher values (p<0.001) were observedin supplemented bread, maybe due to the intrinsic color of the green coffee parchment.The general darkening of color parameters, due to the supplementation with this ingredient,could be very interesting to improve the gluten-free bread appearance that generally showsa pasty color [26]. Table 1. Crust and crumb colorimetric parameters for control (C) and green coffee parchment (PB) breads a. L* a* b* PB *** PB PB Day0 86.88± 77.14± 2.48± 3.05± *** 14.33± 15.19± Crust 0.69 a 1.03 a 0.29 b 0.28 b 0.93 a 0.85 ab 85.29± 77.24± *** 2.93± 3.22± 15.12± 15.50± Day 1 0.72 b 1.23 a 0.32 a 0.27 ab 0.95 a 0.81 a 85.59± 77.04± *** 2.96± 3.27± 兴 14.19± 14.88± Day 3 1.13 b 1.08 a 0.45 a 0.20 a 0.86a 0.65 b L* a* b* C PB PB PB 85.86± 69.11± *** -0.66土 3.38± *** 11.68± 16.20± *** Day 0 0.74 a 1.96 a 0.08b 0.24 b 1.08 a 0.74 a Crumb 83.74± 69.60± *** -0.55± 3.32± *** 10.91± 15.91± *** Day1 2.06b 1.22a 0.09a 0.19 b 0.81 a 0.63 a 86.34± 70.12± *** -0.63± 3.67± *** 11.45± 16.27± *** Day 3 1.28a 1.56 a 0.10 ab 0.24 a 0.46 a 0.50 a a Means and standard deviations in column followed by different letters significantly differ (p<0.05) among different storage times for thesame bread. * p<0.05; **p <0.01;*** p<0.001. Crust hardness (Table 2) resulted in 3.20 ±0.89 Nand 3.80 ±1.11 N in C and PB,respectively, and as desired, no significant differences were observed in fresh breads (day 0).It decreased during storage in both samples, due to the water migration from crumb tocrust favored by the absence of gluten [27], without significant differences. On the contrary,the evolution of crumb hardness presented a different trend (Table 2). Although duringbread staling the loss of water and the starch retrogradation causes the hardening of crumb,the hardening of crumb at day 3 was observed in PB, while no significant differences wereobserved for C. The different behaviors in C and PB was maybe due to the interaction andcompetition between hydrocolloids of the mixture and the coffee parchment for bindingwater with a different redistribution of water between components in PB. In particular,a positive influence on the softness of the crumb during storage, by helping to retainmoisture and by increasing the perception of crumb moistness, is expected for ingredientsrich in soluble fiber [28], while coffee parchment is poor in this fraction. Moreover, if wateris limited in the original mass, and many substances have to compete for it, high-fiber ingredients cannot carry out their functionality: this fact could explain the absence of theantistaling effect of coffee parchment [29]. Table 2. Crust and crumb textural parameters during storage for control (C) and parchment bread (PB). CRUST CRUMB Hardness(N) Hardness (N) Resilience (%) Cohesiveness (-) Springiness (-) Chewiness (N) PB C PB C PB PB c PB C PB 23.13 25.52 87.24 87.36 3.20± 3.80± 1.83± 1.79± ±1.59 ±2.46 0.60± 0.62± 土3.55 ±3.11 0.98± 0.96± Day 0 0.89 a 1.11 a 0.23 a 0.35 b a a 0.01 a 0.03 a b a 0.17a 0.19 a 1.83± 2.23土 2.01± 1.80土 22.02 19.87 0.56± 0.52土 90.05 84.55 1.07± 0.80土 ±2.63 ±3.42 ±2.76 ±7.27 Day 1 0.27b 0.57b 0.15 a 0.38b a b 0.04 ab 0.05b b a 0.20 a 0.24b 1.54± 1.83± 1.88± 2.09± 24.52 19.88 0.56土 0.52± 95.62 85.54 0.96± 0.91± Day 3 0.26b 0.51b 0.18 a 0.72 a ±4.30 a ±2.87 b 0.06b 0.05b 土2.19 a ±3.59 a 0.09 a 0.27 ab a,b Means and standard deviations in column followed by different letters significantly differ (p<0.05) among different storage times forthe same bread. Cohesiveness decreased in both samples during storage, as expected, without signifi-cant differences between samples. Springiness increased in C, while remaining constantin PB. Chewiness did not show variation in C during storage, while it decreased in PB.Conte et al.[29] underlined the correlation between these parameters and the crumb struc-ture, in term of porosity, number of holes, and holes areas. This could explain the increasinghardness in PB, associated with a larger number of bigger holes and the smaller presenceof smaller ones during storage. 3.3. Bread Chemical Characterization Result of total phenolic content (TPC) was reported in Table 3: differently from whatwas expected [2], no significant differences were obtained in the TPC between C andPB, without scientific literature available to confirm or refute this results. It has to beunderlined that phenolic compounds from different origins show different response tothe Folin-Ciocalteu method, as well as the antioxidant capacity of each compound beingaffected by its structure [30]. Table 3. Total phenolic content (TPC), antioxidant capacity, and oxidative stability, means andstandard deviations, in control (C) and parchment bread (PB). TPC (mg GAE/g) Antioxidant Capacity (%) Oxidative Stability (min) C PB PB c PB 0.98±0.07 1.07±1.16 10.9±0.2 65.6±1.6* 493.0±5.7 748.5±12.0 ** *p<0.05;**p<0.01. On the other hand, the results obtained with the DPPH method,revealed that theantioxidant capacity of green coffee parchment-supplemented bread was more than six-fold higher with respect to control bread(Table3). Therefore,we can assume that activecompounds occur in the ingredient added to the supplemented bread, and they are ableto react with the DPPH assay, consequently explicating a significant antioxidant capacityin the final product. In order to confirm this finding, the evaluation of oxidative stabilitywas measured using the Oxitest reactor, an instrument able to record the effect of thestability of a sample submitted to accelerated oxidative conditions (by a combinationof high temperature and oxygen pressure). This test permits to evaluate the total effectexerted by active compounds on the whole product, without any pre-treatment, rather than the action of selected extracted compounds on a specific reagent, as in the classicspectrophotometric assays. The results recorded (Table 3), related to the induction period (expressed in minutes),showed values significantly higher in PB, about 50% higher than the control, confirmingthe presence of active compounds that are able to preserve the product during storage. According to the results obtained by DPPH and Oxitest, the evaluation of the HMFshowed a significant reduction of this compound in PB (3.9 ±0.3 ug/g), since the amountof the analyte found was about two times lower than that measured in the control(8.3±0.4 ug/g). This effect can be attributed to the presence of antioxidant compounds,as previously observed in buckwheat bread by a previous study [31], underlining the in-hibitory effect of quercetin that is able to entrap HMF. The antioxidant capacity of flavonoidsand vitamin C and E may also have a significant effect in reducing the progression of theMaillard reaction, as reported by previous studies [32]. 3.4. Sensory Analysis The sensory analysis evidenced that PB breads were perceived similar to the controlfor the majority of the considered descriptors (Figure 5): non-trained panelists causedalso a great variability in judgments and absence of significant differences could be dueto this fact. Among the free comments reported by panelists, PB was described witha better color and with more homogenous crumb characteristics than C. Interestingly,many panelists perceived PB samples as more salty than C, confirming the positive effectof green parchment on gluten-free breads that are generally recognized as bland andrequire high salt contents with related health problems. Only a few panelists gave thedescription of "bitter" (due to the presence of caffeine), but without a negative impact onthe perceived taste. Figure 5. Box plot for sensorial analysis C and PB bread. 4. Conclusions This study attempts to evaluate for the first time in the literature the impact of theaddition of green coffee parchment to gluten-free bread, in terms of structural, qualitative,and chemical properties during storage. From the obtained results, it could be concluded that the green coffee parchment isa source of dietary fiber, able to improve the antioxidant capacity in gluten-free bakeryproducts. The structure resulted less homogenous than the control and the staling duringshort-term storage seems to be accelerated but without a severe effect on crumb hardnessand textural attributes. Further studies are required to understand the staling during alonger storage period. The color characteristics were appreciated by the sensory analysis, showing crust and crumb darkening, with promising expectations. Moreover, parchment-enriched bread showed a high antioxidant capacity, oxidative stability, and lower presenceof HMF, as compared to the control bread. In view of these considerations, the technological/functional aspects of green coffeeparchment and the high global production of coffee, could promote the valorization ofthis by-product. Although the nutritional claim for fiber content was not reached forthe supplemented bread studied in this work, the possibility of using this interesting by-product in other foods to obtain positive health,economic, and environmental sustainabilityeffects could be considered. Finally, this paper represents a preliminary study of GCP addition to bread andsuggests that the debittering step could be a possible way to increase the amount of GCPin gluten-free bread in order to improve its nutritional and sensorial characteristics. Author Contributions: P.L.: Writing-Review & Editing; M.R.: Conceptualization, Investigation,Writing-Original Draft, Project administration; M.G.: Investigation; A.C.: Data Curation, Writing-Review & Editing; E.C.: Writing-Review & Editing, Project administration. All authors have readand agreed to the published version of the manuscript. Funding: This research received no external funding. Acknowledgments: The authors are grateful to Paola Ornaghi (Velp Scientifica, MB, Italy) for makingavailable the Oxitest reactor used in this study. Conflicts of Interest: The authors declare no conflict of interest. References 1. FAOSTAT. Food and Agriculture Organization of the United Nations. 2008. Available online: http://www.fao.org/faostat/en/#data/QC (accessed on 17 October 2020). 2. Iriondo-De Hond, A.; Aparicio Garcia, N.; Fernandez-Gomez, B.; Guisantes-Batan, E.; Velazquez Escobar, F.; Blanch, G.P.;San Andres, M.I.; Sanchez-Fortun,S.; del Castillo, M.D. Validation of coffee by-products as novel food ingredients. Innov. FoodSci. Emerg. 2019,51,194-204. [CrossRef] 3Esquivel, P.; Jimenez, V.M. Functional properties of coffee and coffee by-products. Food Res. Int. 2012, 46,488-495.[CrossRef] 4 Pourfarzad, A.;Mahdavian-Mehr, H.; Sedaghat, N. Coffee silverskin as a source of dietary fiber in bread-making: Optimizationof chemical treatment using response surface methodology. LWT-Food Sci. Technol.2013,50,599-606. [CrossRef] 5. Gocmen, D.;Sahan, Y.;Yildiz, E.; Coskun, M.; Aroufai, I.A. Use of coffee silverskin to improve the functional properties of cookies.J.Food Sci. Technol. 2019,56,2979-2988.[CrossRef] [PubMed] 6. Cubero-Castillo, E.; Bonilla-Leiva, A.; Garcia-Velazques,E. Coffee berry processing byproduct valorization: Coffee parchment asa potential fiber source to enrich bakery goods. J. Health Popul. Nutr. 2017,1,1-7. 7. Benitez, V.; Rebollo-Hernanz, M.; Hernanz, S.; Chantres,S.; Aguilera, Y.;Martin-Cabrejas, M.A. Coffee parchment as a newdietary fiber ingredient: Functional and physiological characterization. Food Res. Int. 2019, 122,105-113.[CrossRef] 8. Klingel, T.; Kremer, J.I.; Gottstein, V.; Rajcic de Rezende, T.; Schwarz, S.; Lachenmeier, D.W. A Review of Coffee By-ProductsIncluding Leaf, Flower, Cherry, Husk, Silver Skin, and Spent Grounds as Novel Foods within the European Union. Foods2020,9,665.[CrossRef] 9. Iriondo-DeHond, A.; Iriondo-DeHond, M.; Del Castillo, M.D. Applications of compounds from coffee processing by-products.Biomolecules 2020,10,1219. [CrossRef] 10. Dadi,D.;Mengistie, E.; Terefe, G.; Getahun, T.; Haddis, A.; Birke, W.; Van der Bruggen, B. Assessment of the effluent qualityof wet coffee processing wastewater and its influence on downstream water quality. Ecohydrol. Hydrobiol. 2018, 18, 201-211.CrossRef| 11. Arslan, M.; Rakha, A.; Xiaobo,Z.;Mahmood, M.A. Complimenting gluten free bakery products with dietary fiber: Opportunitiesand constraints. Trends Food Sci. Tech. 2019,83,194-202.[CrossRef] 12.2.Guglielmetti, A.; Fernandez-Gomez, B.; Zeppa, G.; Castillo, M. Nutritional quality, potential health promoting properties andsensory perception of an improved gluten-free bread formulation containing inulin, rice protein and bioactive compoundsextracted from coffee byproducts. Pol. J. Food Nutr. Sci. 2019,51,157-166. [CrossRef] 13. Rinaldi, M.; Littardi, P.; Paciulli, M.; Caligiani, A.; Chiavaro, E. Effect of cocoa bean shells granulometries on qualitative propertiesof gluten-free bread during storage. Eur. Food Res. Technol. 2020,246,1583-1590.[CrossRef] 14. AOAC, Association of Official Analytical Chemists. Official Method of Analysis, 16th ed.; Association of Official Analytical:Washington, DC, USA, 2002. 15. Sarangapani, C.; Thirumdas, R.; Devi, Y.; Trimukhe, A.; Deshmukh,R.R.; Annapure, U.S. Effect of low-pressure plasma onphysico-chemical and functional properties of parboiled rice flour. LWT Food Sci. Technol. 2016,69,482-489. [CrossRef] 16. AACC, American Association of Cereal Chemists. Approved Methods of the AACC, 10th ed.; American Association of CerealChemists: St. Paul, MN, USA, 2000. ( 17. Rinaldi, M.; Paciulli, M.; Caligiani, A.; Scazzina,F; Chiavaro, E. Sourdough fermentation and chestnut flour in gluten-free bread:A shelf-life evaluation. Food Chem. 2 017, 224, 1 44-152. [C rossRef] [ Pu bM e d ] ) ( Bourne, M.C. Texture profile analysis. F o od Technol. 1978, 32,62-66. 18 ) ( Pasqualone, A.; D elvecchio, L.N.; Mangini, G.; Taranto, F.; Blanco, A. Variability of total soluble phenolic compounds a ndantioxidant activity in a collection of tetraploid wheat. Agric. Food Sci. 2 0 14, 23, 3 0 7-316. [C r o ssRef] ) 20. Raghavendra, S.N.; Rastogi, N.K.; Raghavarao, K.S.M.S.; Tharanathan, R.N. Dietary fiber from coconut residue: Effects ofdifferent treatments and particle size on the hydration properties. Eur. Food Res. Technol. 2004, 218,563-567.[CrossRef] 21. Es to,F.; Arlotti, G.; Bonifati, A.M.; Napolitano, A.; Vitale, D.;Fogliano, V. Antioxidant activity and dietary fibre in durumwheat bran by-products. Food Res. Int. 2005, 38,1167-1173. [CrossRef] 22...Sabanis, D.; Lebesi, D.; Tzia, C. Effect of dietary fibre enrichment on selected properties of gluten-free bread. LWT-FoodSci. Technol. 2009,42,1380-1389. [CrossRef] 23. Gomez,M.;Ronda,F.;Blanco, C.A.; Caballero, P.A.; Apesteguia, A. Effect of dietary fibre on dough rheology and bread quality.Eur. Food Res. Technol.2003, 216,51-56. [CrossRef] ( 24. E. Cauvain, S.P. Breadmaking: I mproving Quality; Woodhead Publishing: Cambridge, UK, 2012; pp. 299-329. ) 25. Gray, J.A.; Bemiller, J.N. Bread staling: Molecular basis and control. Compr. Rev. Food Sci. Food Saf. 2003, 2, 1-21. [CrossRef] 26. Masure, H.G.; Fierens, E.; Delcour, J.A. Current and forward looking experimental approaches in gluten-free bread makingresearch. J. Cereal Sci. 2016,67,92-111. [CrossRef] 27. Gallagher, E.; Gormley, T.R.; Arendt, E.K. Crust and crumb characteristics of gluten free breads. J. Food Eng. 2003, 56, 153-161.|CrossRefl ( 28. Cappa, C.; Lucisano, M.; M a riotti, M. Influence of P s yllium, sugar beet fibre and water on gluten-free dough properties and bread quality. Carbohydr. Polym. 2013,98, 1657-1666.[ CrossR e f] ) 31..Zhang, Y.;An, X. Inhibitory mechanism of quercetin against the formation of 5- (hydroxymethyl)-2-furaldehyde in buckwheatflour bread by ultra-performance liquid chromatography coupled with high-resolution tandem mass spectrometry. Food Res. Int.2017,95,68-81.[CrossRef] ( 32. Favreau-Farhadi,N.; Pecukonis, L.; Barrett, A. The inhibition of maillard browning by different concentrations of rosmarinic acid and epigallocatechin-3-gallate in m o del, bakery, an d fruit systems. J. Fo o d Sci. 2015,80, C2 1 40-C2146. [Cross Ref] ) WWW.VELP.COM 本篇文章使用了velp oxitest油脂氧化分析仪来评估在无麸质面包中添加不同比例的生咖啡内果皮的影响,以在保质期内改善结构、质量和化学性质。咖啡是世界上最受欢迎的产品。它含有丰富的纤维和营养物质。在加工过程中,这些重要物质有90%被当做生产杂质被去除掉,其中之一就是生咖啡内果皮。有一个可以应用的领域是生产无麸质烘焙产品。由于对麸质过敏的人越来越多,近来这个市场有了相当大的发展。众所周知,无麸质食品的纤维含量很低,添加生咖啡内果皮可以改善和提高这些食品的纤维和营养素含量。添加生咖啡内果皮后无麸质面包样品的氧化稳定性:oxitest油脂氧化分析仪(意大利VELP)通过将样品置于高氧化应激环境中,oxitest反应器分析和比较氧化稳定性,在几分钟内提供准确的结果,按原样品测试,不需要分离脂肪。将30克切碎的无麸质面包置于温度为90°c,氧气压力为6bar 的氧化室中。oxitest油脂氧化分析仪与装有软件的计算机相连,测量无麸质面包样品的氧化稳定性。它显示ip(诱导期)值、自氧化过程的速度和加速度,以及产品消耗的氧气总量。诱导期越长,随着时间的推移,氧化稳定性越强。含有生咖啡内果皮的无麸质面包的平均ip值 显著高于对照样品。oxitest分析表明,生咖啡内果皮是一种膳食纤维来源,能够提高无麸质烘焙产品的抗氧化能力,而不改变其口感特征和质地。有鉴于此,生咖啡内果皮在这方面的功能应促进这种副产品的价值化,并将其用于其他食品的生产,以实现对健康,经济和环境可持续性的积极影响。
确定


还剩13页未读,是否继续阅读?

产品配置单

北京盈盛恒泰科技有限责任公司为您提供《无麸质面包中油脂氧化分析检测方案(食用油品分析)》,该方案主要用于糕点/月饼/粽子中理化分析检测,参考标准--,《无麸质面包中油脂氧化分析检测方案(食用油品分析)》用到的仪器有VELP-油脂氧化分析仪OXITEST、意大利VELP公司-食品油脂氧化分析仪
相关方案
更多
该厂商其他方案
更多