


采用LaVision公司DaVis8.4图像采集和分析软件平台,可编程时间控制器PTU和高速相机,红外相机,构成一套可以用双色法,红外法测温,以及粒子图像测速系统,测量了水池沸腾过程的温度和速度场。
方案详情

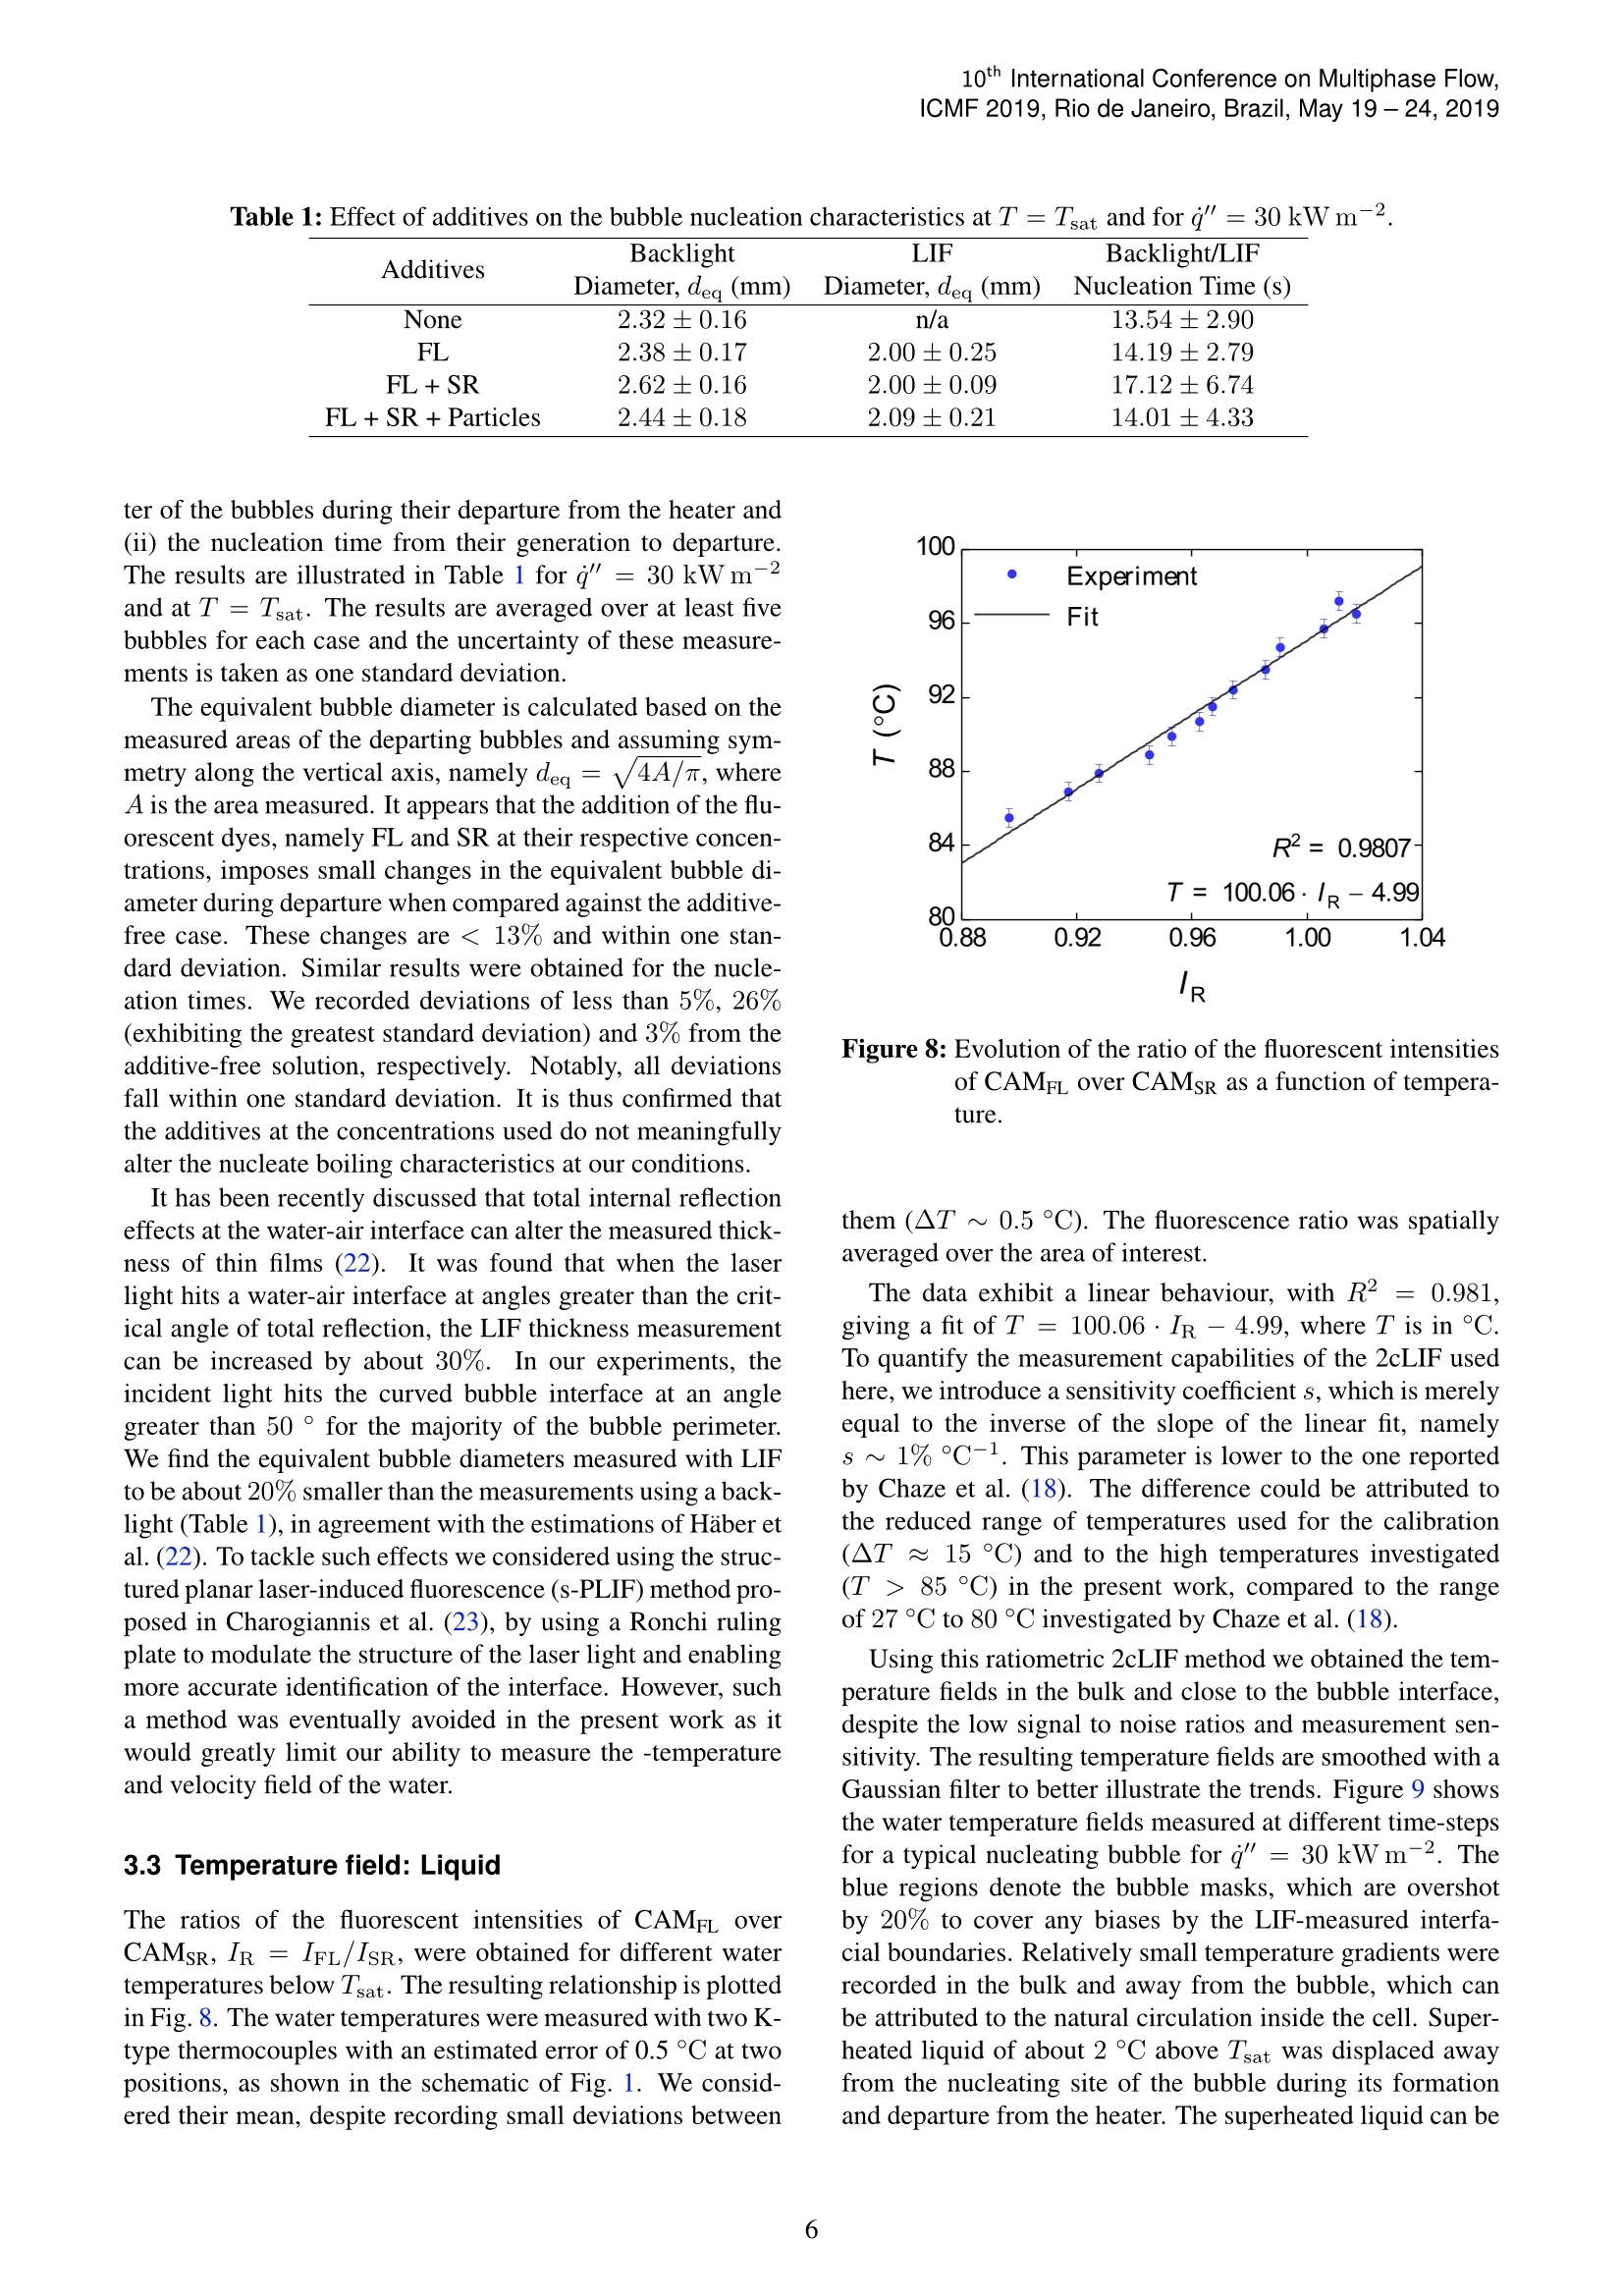
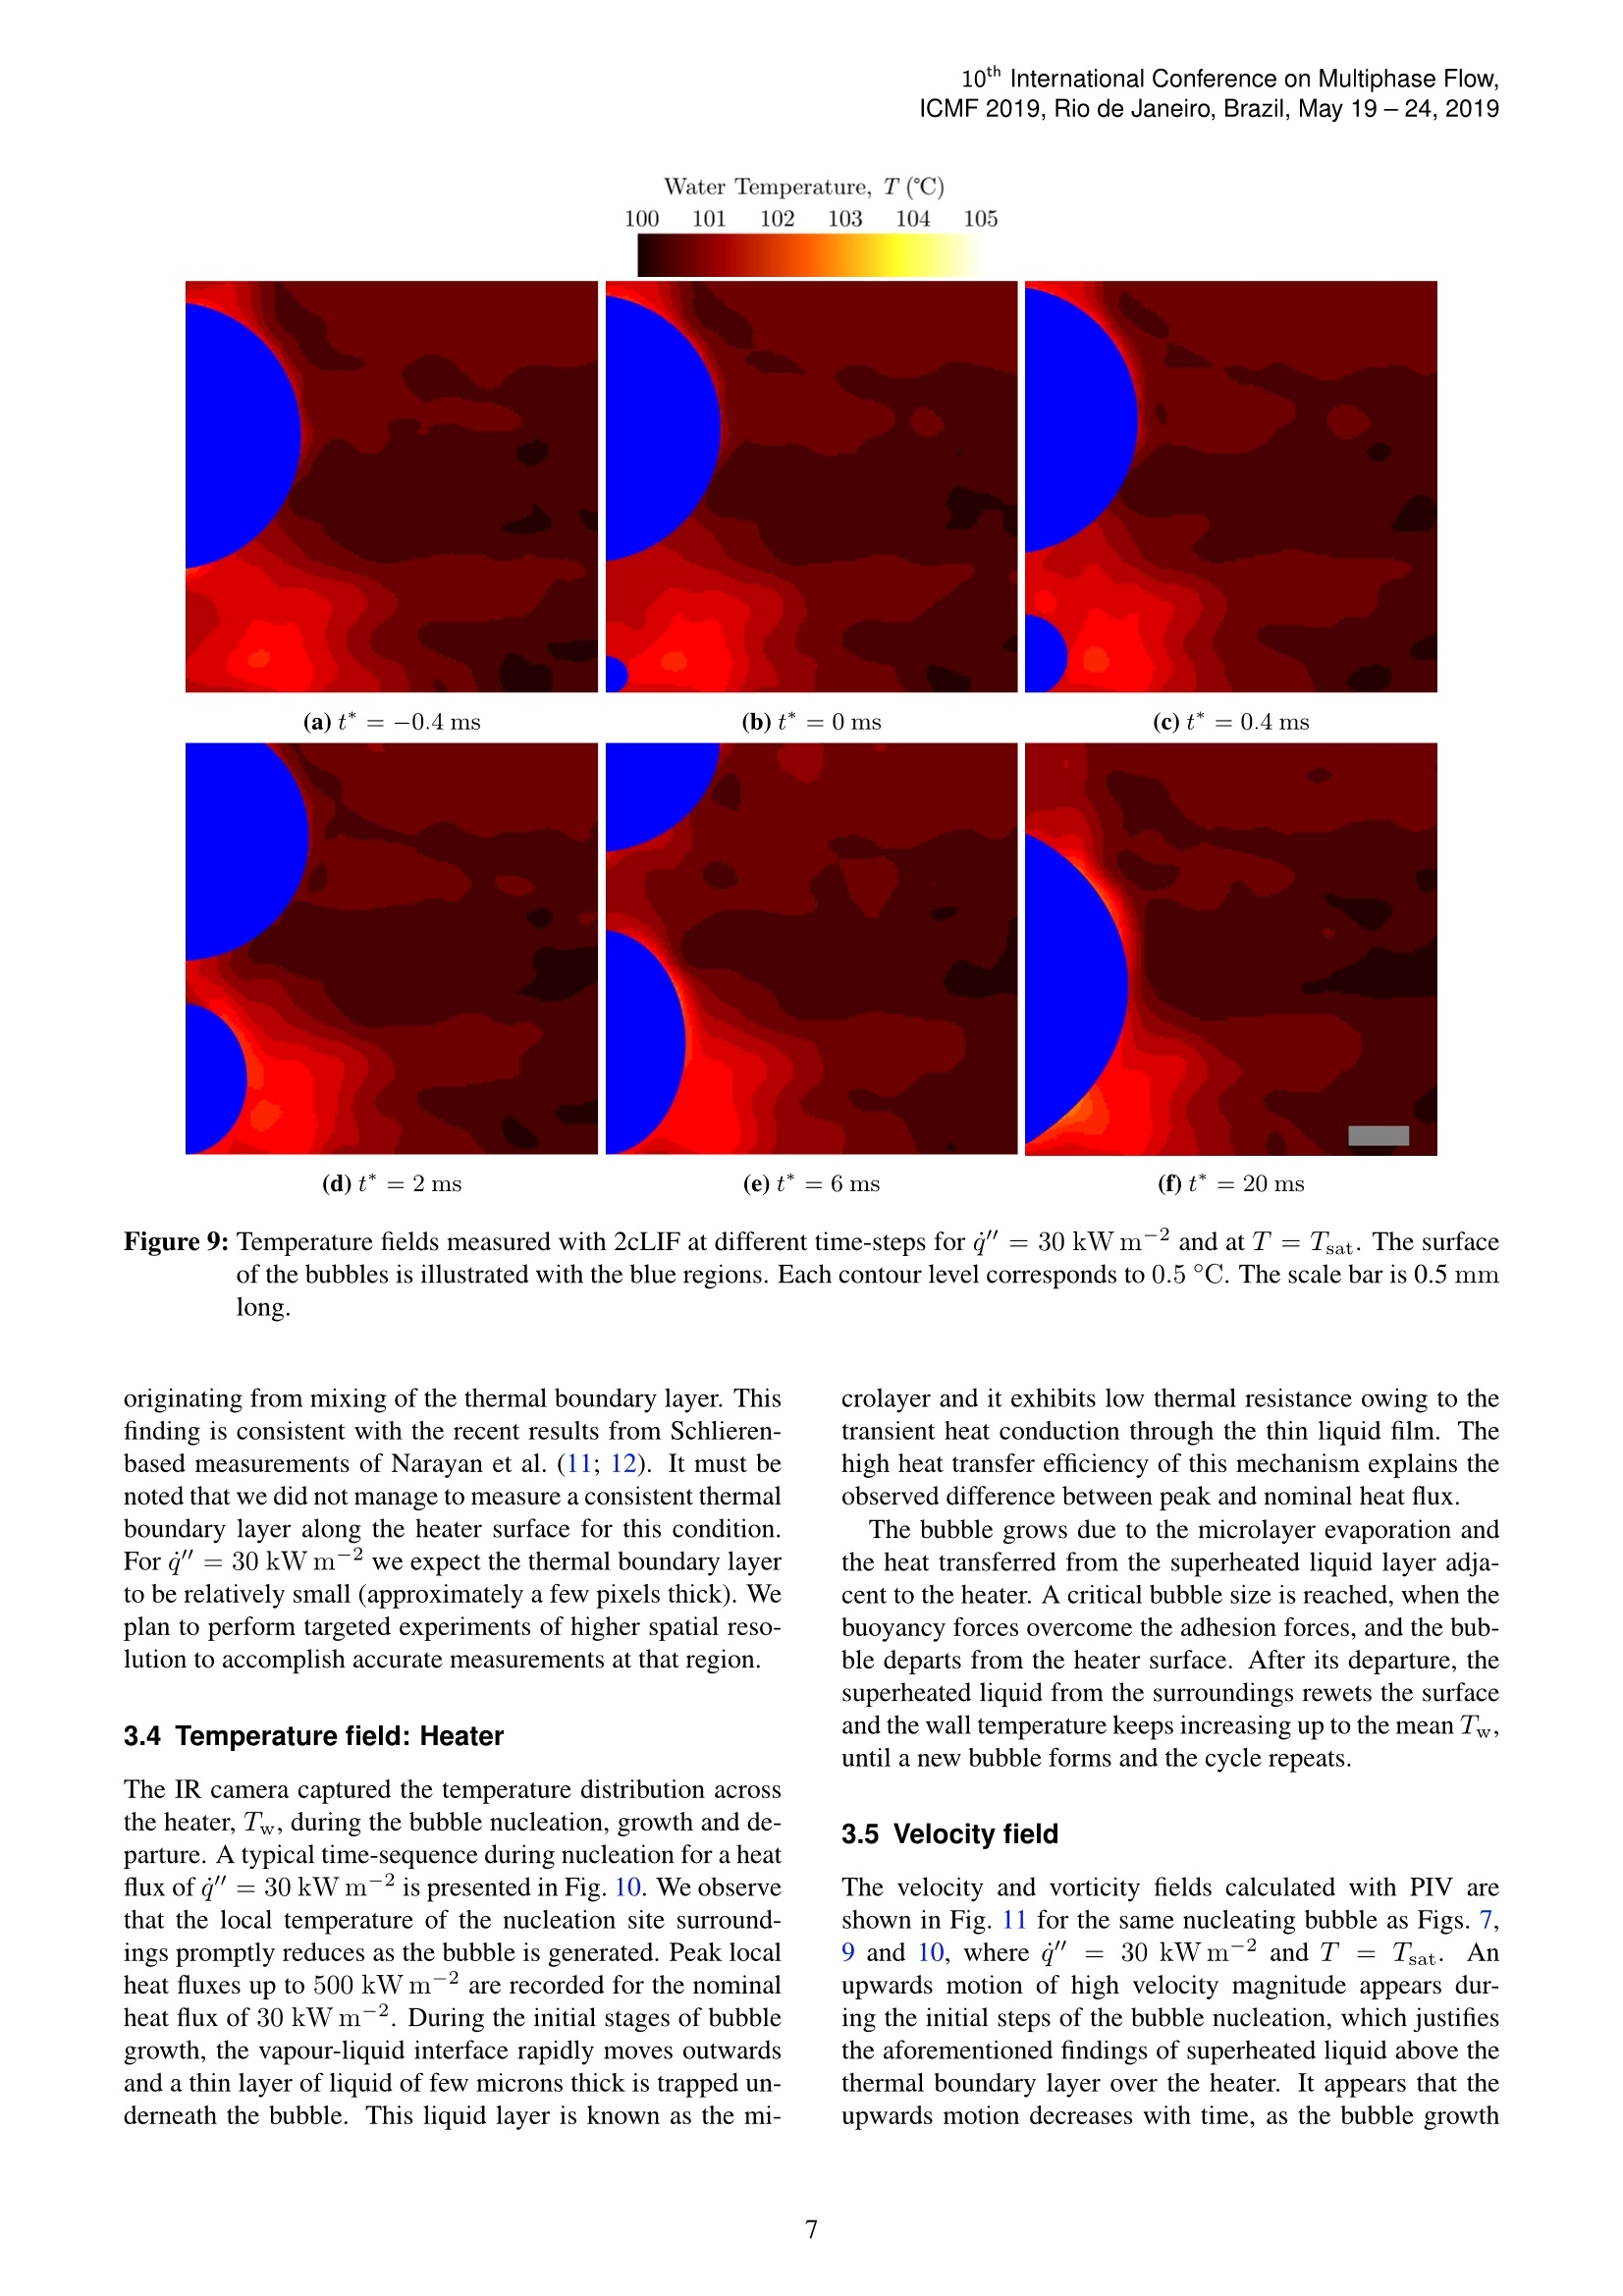
10*h International Conference on Multiphase Flow,ICMF 2019, Rio de Janeiro, Brazil, May 19-24,2019 Temperature and velocity field measurements of pool boiling using two-colourlaser-induced fluorescence, infrared thermometry and particle image velocimetry Victor Voulgaropoulosl,*, Gustavo M. Aguiar, Omar K. Matar,Matteo Bucci and Christos N. Markides1 Department of Chemical Engineering, Imperial College London, London, UK ‘Department of Nuclear Science and Engineering, Massachusetts Institute of Technology, Cambridge MA, USA^v.voulgaropoulos@imperial.ac.uk Keywords: infrared thermometry, laser diagnostics, pool boiling, whole field measurements Abstract We study nucleate pool boiling in water at saturation temperature and ambient pressure under low heat fluxes. A combinationof high-speed and spatially-resolved diagnostic tools are developed and applied to provide detailed insight into the flow andheat transfer mechanisms during bubble life cycle. Two fluorescent dyes with non-overlapping spectra are seeded into thewater and are excited by a Nd:YLF laser sheet at 527 nm. A two-colour laser-induced fluorescence method is employedto individually track the fluorescence of each dye by connecting two cameras, equipped with separate optical filters, to abeamsplitter and a lens. Tracer particles are also introduced in the water to perform simultaneous particle image velocimetrymeasurements. Finally, synchronised high-speed infrared thermometry is conducted to acquire the surface temperature fieldover the heater. The links between the interfacial/bubble dynamics, flow and heat transfer are investigated. Superheated liquidfrom the thermal boundary layer adjacent to the heater is displaced upwards, due to the growth and departure of the bubbles.Two counteracting vortices form on each side of the bubbles during their departure and rise, which contribute to the scavengingand mixing of the bulk water, resulting in a trail of superheated liquid below them. 1 Introduction Nucleate boiling is a very effective mode of heat transferand is therefore employed in a wide range of industrial ap-plications, from nuclear reactors (1; 2) to emerging high-performance micro-systems (3). A comprehensive under-standing of the heat and fluid flow processes during the phe-nomenon is hence crucial as it can unlock new avenues forthe more efficient use of thermal energy. However, complexand dynamic two-phase transport phenomena are involved innucleate boiling, which require further research. Empirical methods have been predominantly developed sofar to try to explain these coupled and interacting mecha-nisms, which are, however, inherently limited to a narrowrange of operational conditions. Recently, the rise of mecha-nistic methods (4; 5) and the advances and increasing detailof computational efforts (6; 7) have resulted in a need for de-tailed space and time-resolved experimental measurementsfor validation and model development purposes. Several experimental techniques have been employed toinvestigate the flow and heat transfer during pool boilingin the past. Earlier efforts extracted local temperature in-formation with thermocouples and microsensors (8), whilemore recent efforts have emerged that can provide whole fieldinformation on the temperature distribution over the heaterwith infrared (IR) diagnostics (9;10) and the temperature in the liquid bulk with rainbow Schlieren (11; 12), which areintrinsically averaged along the depth of field of the imagingsystem. Here, we combine advanced infrared- and laser-based di-agnostic tools (13; 14; 15) for the first time, in order to ex-tract spatiotemporally resolved temperature and velocity in-formation during the bubble life cycle and to investigate anyassociated phenomena during pool boiling. A high-speedIR technique, previously developed by Bucci et al. (10), isused to obtain the temperature and heat flux distributions overthe heater surface and is employed in conjunction with two-colour laser-induced fluorescence (2cLIF) (16) and particleimage velocimetry (PIV) methods, which are able to providesimultaneous local temperature and velocity-field informa-tion in the water phase, respectively. The current work hasa technical experimental nature and is focused on the ap-plication of such techniques in a pool boiling system. Thephysics of the phenomena will be discussed in more detail aswe progress in this study. 2 Experimental Methodology 2.1 Apparatus The apparatus used for the pool boiling experiments is il-lustrated in Fig. 1. The cell was filled with DI water andwas brought to saturation temperature, Isat, via a circulating Figure 1: Schematic of the apparatus and instruments usedfor the experiments. heating bath. The temperature of the water, T, was mon-itored with K-type thermocouples located at bespoke posi-tions, close to the heater and at the top of the side-view win-dow. Once the bulk water reached its saturation temperature,i.e.T=Tsat was established, current was supplied to a thin-film indium tin oxide (ITO) heater coated on a IR transparentsapphire glass, providing the heat flux to initiate boiling. We coated a~100 um area at the centre of the heater withhydrophobic material (PTFE) to artificially control the nucle-ation topology and generate isolated bubble at a desired loca-tion (centre of the heater). Bubbles nucleating along the pathof the laser beam and the camera’s depth of field, would ob-struct the implementation of the laser diagnostic techniques. 2.2 Experimental techniques We employed a ratiometric 2cLIF method to obtain the tem-perature field of the water by tracking the emission of twofluorescent dyes dissolved in it, namely fluorescein disodium(FL) and sulforhodamine101 (SR). The concentration of eachdye was equal to CFL =4-10-5 M and CsR =1.4·10-7 M.Two high-speed (HS) cameras were connected to a pelli-cle beamsplitter (R45%: T55%) and a Nikon 105 mm lens(cf. Fig.1). An extension tube was connected between eachcamera and the beamsplitter, which also acted as a holder forthe optical filters. Different optical filter arrangements (com-binations of short, long and notch filters) were used for eachcamera to visualise each fluorescent dye separately. Additionally, fluorescent tracer particles of mean size10 um at a concentration below 0.01 M emitting primarilyabove 入> 550 nm (where入 denotes the wavelength) werealso introduced in the water. Tracking their displacementwith PIV allows for velocity field measurements. Figure 2illustrates the optical wavelength bands visualised by eachcamera, along with the spectra of the dyes and particles used. The first camera, CAMFL (Phantom V12.1), recorded thefluorescent intensity of the temperature-sensitive FL dye(Band 1 in Fig. 2), while the second camera, CAMsR (Phan-tom V25.12), recorded the intensity of the temperature- Figure 2: Normalised excitation and emission spectra of FL,SR and the fluorescent tracer PIV particles. Thespectral bands recorded with each camera are il-lustrated with the shaded rectangles. The dottedblack line denotes the laser light at 入=527 nm. insensitive SR dye and the PIV tracer particles (Band 2 inFig. 2). The spectral bands of each camera have been se-lected to avoid spectral conflicts, which can lead to erroneousresults (17;18). It is imperative for our experiments to usea ratiometric approach, as reflections from the bubble inter-face can influence the measurements. Also, this approachallowed us to obtain temperature measurements closer to thebubble interface. The 2cLIF method has been used recentlyby Chaze et al. (16) to measure the temperature field insideof drops impinging on a hot solid surface. A high-speed Nd:YLF laser was utilised at its second har-monic (527 nm) to excite both dyes and the particles, asshown in the absorption spectra of Fig. 2. One cavity of thelaser was used with a pulse repetition frequency of 2.5 kHzand an average power of ~25 W. Dedicated optics were con-nected to the laser head to generate a thin sheet of light andto define the measurement volume of the PIV and LIF tech-niques. The laser sheet thickness was measured with a sharprazor blade connected to a plate with a traversing mechanismand coated with a black dye to avoid any laser reflections. The blade was initially positioned so that it completelyblocks the laser sheet, recording zero values of fluorescenceatz~0 mm. As the blade was gradually advanced along thetransverse direction and perpendicularly to the laser sheet,the fluorescence signal recorded by both cameras started toincrease and reached its maximum value when the blade wasno longer blocking the laser sheet. The fluorescence was bothspace- and time-averaged over 300 images and the resultingdistribution of the fluorescence is shown in Fig. 3(a). Thefluorescence shown is normalised with the maximum lightrecorded. The probability distribution Pr(z) and the proba-bility density function PDFr(z) of the fluorescence I alongz were then calculated for each dye as shown in Fig.3(b),inorder to extract the laser sheet thickness. 1.2 (a) Cumulative distribution (b) Probability distribution and probability density function Figure 3: The laser sheet thickness measured from the fluorescence light recorded from the high-speed cameras as the bladetraversed along the transverse direction z. Figure 4: Thermal (for SR) and photo degradation (for both FL and SR) induced by the elevated solution temperature and thelaser light, respectively. The data in (a) for 60 to 80 °C have been obtained from Chaze et al. (16). The laser sheet thickness is reported here as the full widthhalf maximum (FWHM) value of the light distribution. Thelight recorded can be described by a normal PDFr(z) of theform: as illustrated in the PDFs of Fig.3(b). In the aforementionedrelation the standard deviation is noted as o and the mean asuz. The FWHM can be then calculated as: which can be written as FWHM ~ 2.355o or 213 um and209 um for the fluorescence of CAMFL and CAMsR, respec-tively. The resulting laser sheet thickness is taken as the meanbetween the two cameras equal to 211 um. It has been found that SR can be subject to thermal degra-dation when its temperature exceeds the ambient (16). Inour current work, we induced boiling at water saturated con-ditions, which resulted in the degradation of SR over time.Figure 4(a) presents the fluorescence of SR over time at fourdifferent temperatures, spanning the range of 60 °C to 98°C.The fluorescence was both space- and time-averaged over300 images. The different curves are obtained from our ex-periments and from Chaze et al.(16). We chose the upper temperature limit below the saturationtemperature of water to avoid boiling. The volume of theliquid during the runs remained practically constant so anyevaporation effects that would result in an increase of CsRwere neglected. The fluorescence appears to be decreasing ina linear manner for all the temperatures shown, therefore wefitted a line with a negative slope passing through each dis-tinct temperature data set. Higher temperatures induce faster degradation of the dye, resulting in smaller slope values. We subjected a solution of water containing the dyes at thesame concentration as the experiments to a laser light of thesame frequency and power as the experiments in order to in-vestigate the effects of the photo degradation on the dyes. Wethen recorded the fluorescence emitted over time from bothdyes. The results are illustrated in Fig. 4(b). A quasi-lineardrop in the fluorescence is recorded, similarly to the thermaldegradation data. We fitted a linear curve with a negativeslope, as presented in Fig. 4(b). The overall experiments andcalibration procedure lasted over 30 min, so the curves ofFig. 4 can be used to correct for any thermal and light degra-dation occurring during the experiments. Finally, an IR camera (TELOPS Fast M3k) was usedto record the thermal radiation emitted by the boiling sur-face (ITO) during the experiments at a spatial resolution of50 um pixel- and an exposure time of 50 ms. All camerasrecorded the bubble nucleation events at 2.5 kHz and weresynchronised via a high-speed PTU controller (LaVision). 2.3 Imageanalysis Spatial calibration and image corrections were applied tothe 2cLIF, PIV and IR raw images using in-built functionsof DaVis 8.4 (LaVision) and in-house developed MATLAB(Mathworks) algorithms.. The image processing steps fol-lowed for the 2cLIF and PIV are portrayed in Fig. 5. The im-ages from both cameras are needed to have matching field ofviews to allow for pixel to pixel correspondence and thus en-able the application of ratiometric 2cLIF. Spatial correctionsare applied to the images of each camera to minimise any ro-tation or magnification differences. Images of a calibrationtarget with patterned circles of known distances and dimen-sions immersed in the cell were taken, and the native spatialcalibration algorithm of DaVis 8.4 was applied to the raw im-ages, e.g. Fig.5(a). A typical corrected image of CAMsR isshown in Fig.5(b). Both cameras had a resulting resolutionof 52 um pixel- after the spatial calibration. To avoid any noise from the PIV particle signal of CAMsRon the resulting temperature field, the particles were removedfrom the images using a similar approach to Voulgaropou-los and Angeli (19;20) and shown in Fig. 5(c)-(f). First, amoving average filter was applied in 3 by 3 pixel’neighbour-hoods to isolate the particles and was followed by a dilatationfilter. The dilated images were then binarised using a globalthreshold and subtracted from the spatially corrected imagesto give Fig.5(e). The remaining holes’ that originally con-tained the particles were interpolated to produce the final im-ages, as shown in Fig. 5(f). The final images were used forthe ratiometric 2cLIF temperature measurements. A similar methodology to Charogiannis et al. (21) wasused to obtain the velocity field in the water phase from thesubtracted moving average images of Fig. 5(c), which con-tained the isolated PIV particles. An algorithmic mask wasfirst calculated, which was based on the intensity variationscaused at the bubble interface. The mask prevented the cal-culation of velocity vectors in the gas phase. The DaVis 8.4PIV cross-correlation algorithm was then used in a three-pass iterative mode with interrogation windows of decreasingsize, starting from 64 by 64 pixels and continuing to 32 by (a) Raw (c) Subtract sliding background (e) Threshold and subtraction (f) Interpolation Figure 5: Image processing steps applied to a typical imageof CAMsR to spatially correct the image and re-move the PIV particles. 32 pixels with 50% overlap for the last two iterations. Theimages were finally post-processed with a universal outlierdetection filter and any windows containing outliers were re-moved and interpolated. Finally, the optimal smoothing filterofDaVis 8.4 was applied to better illustrate the results. The heater temperature and heat flux distribution werecalculated from the IR images by solving a coupled three-dimensional heat conduction and two-dimensional radiationinverse problem. The IR camera measures the combined ra-diation emitted by: (i) the boiling surface, (ii) the substrateand (iii) the reflections of the background radiation. The heatconduction model used here provides the temperature andheat flux distributions over the heater surface. The interestedreader is referred to Bucci et al. (10) for a detailed descriptionof the model and the image analysis procedure. 3 Results and Discussion 3.1 Phenomenology Different nucleation characteristics were encountered duringboiling at T=Tsat for various heat fluxes,q", supplied fromthe heater to the liquid. As shown in the images of Fig. 6,the boiling characteristics differ primarily by the density ofnucleation sites. The only nucleation site triggered for lowenough heat fluxes (q"<60 kW m-2) was the artificial nu-cleation site in the centre of the heater, e.g. Fig.6(a), while (c)q"=100kWm (d)q"=300kWm--2 Figure 6: Nucleation characteristics encountered for different heat fluxes at T=Tsat. The scale bar is 2 mm long. (a)t*=0 ms (b)t*= 0.4 ms (c)t* =2 ms (d) t* =6 ms (e)t*= 20 ms Figure 7: Nucleation characteristics encountered at different time-steps for q"=30kWm-2 and at T=Tsat. The scale baris 1 mm long. below q"<30kW m-2 we did not observe any nucleationtaking place. The artificial nucleation site corresponds to thearea with the initial hydrophobic PTFE coating. For q"=60 kW m-2,i.e. Fig. 6(b), we started to observea secondary bubble nucleating from the edges of the heater.For higher heat fluxes, as in Fig. 6(c), neighbouring bubblesclose to the initial nucleation site appeared, and coalescencecould be seen. For q"> 200 kWm-2 as in Fig. 6(d), wecould only observe a bulk cloud of vapour generated fromthe heater instead of distinct bubbles. Such cases will not beinvestigated in the current work, due to the refractive indexmismatch between the liquid and vapour phase that causesobstructions to the laser sheet. Most conditions investigatedwith 2cLIF and PIV span the range from 30 to 60 kWm-. Five different time-steps of a typical case of a singlenucle- ating bubble are shown in Fig. 7 for q"=30 kW m-2 and atsaturation temperature. The images portray the life cycle ofa typical single vapour bubble, from its generation to depar-ture. The time in the captions is denoted as t*, where t* =0signals the first frame where a nucleus of the bubble is visiblein the images. The bubble is initially spherical and graduallygrows as more vapour is generated by the surrounding super-heated liquid. During this time, the bubble loses its sphericityand detaches due to the buoyancy forces. 3.2 Effect of additives We investigated the effects of the added dyes and particles tothe water on the nucleation characteristics during pool boil-ing, by quantifying their effects on: (i) the equivalent diame- Table 1: Effect of additives on the bubble nucleation characteristics at T=Tsat and for q"=30 kW m-2 Additives Backlight LIF Backlight/LIF Diameter, deq (mm) Diameter, deq (mm) Nucleation Time (s) None 2.32±0.16 n/a 13.54±2.90 FL 2.38±0.17 2.00±0.25 14.19±2.79 FL+ SR 2.62±0.16 2.00±0.09 17.12±6.74 FL+SR + Particles 2.44±0.18 2.09±0.21 14.01±4.33 ter of the bubbles during their departure from the heater and(ii) the nucleation time from their generation to departure.The results are illustrated in Table 1 for q"= 30 kWm-and at T = Tsat. The results are averaged over at least fivebubbles for each case and the uncertainty of these measure-ments is taken as one standard deviation. The equivalent bubble diameter is calculated based on themeasured areas of the departing bubbles and assuming sym-metry along the vertical axis, namely deq=√4A/m, whereAis the area measured. It appears that the addition of the flu-orescent dyes, namely FL and SR at their respective concen-trations, imposes small changes in the equivalent bubble di-ameter during departure when compared against the additive-free case. These changes are < 13% and within one stan-dard deviation. Similar results were obtained for the nucle-ation times. We recorded deviations of less than 5%, 26%(exhibiting the greatest standard deviation) and 3% from theadditive-free solution, respectively. Notably, all deviationsfall within one standard deviation. It is thus confirmed thatthe additives at the concentrations used do not meaningfullyalter the nucleate boiling characteristics at our conditions. It has been recently discussed that total internal reflectioneffects at the water-air interface can alter the measured thick-ness of thin films (22). It was found that when the laserlight hits a water-air interface at angles greater than the crit-ical angle of total reflection, the LIF thickness measurementcan be increased by about 30%. In our experiments, theincident light hits the curved bubble interface at an anglegreater than 50° for the majority of the bubble perimeter.We find the equivalent bubble diameters measured with LIFto be about 20% smaller than the measurements using a back-light (Table 1), in agreement with the estimations of Haber etal.(22). To tackle such effects we considered using the struc-tured planar laser-induced fluorescence(s-PLIF) method pro-posed in Charogiannis et al. (23), by using a Ronchi rulingplate to modulate the structure of the laser light and enablingmore accurate identification of the interface. However, sucha method was eventually avoided in the present work as itwould greatly limit our ability to measure the -temperatureand velocity field of the water. 3.3 Temperature field: Liquid The ratios of the fluorescent intensities of CAMeL overCAMsR, IR = IFL/IsR, were obtained for different watertemperatures below Isat. The resulting relationship is plottedin Fig. 8. The water temperatures were measured with two K-type thermocouples with an estimated error of 0.5 °C at twopositions, as shown in the schematic of Fig. 1. We consid-ered their mean, despite recording small deviations between Figure 8: Evolution of the ratio of the fluorescent intensitiesof CAMFL over CAMsR as a function of tempera-ture. them(AT~0.5°C). The fluorescence ratio was spatiallyaveraged over the area of interest. The data exhibit a linear behaviour, with R2=0.981.giving a fit of T=100.06·IR - 4.99, where T is in °C.To quantify the measurement capabilities of the 2cLIF usedhere,we introduce a sensitivity coefficient s, which is merelyequal to the inverse of the slope of the linear fit, namelys~ 1%°C-1. This parameter is lower to the one reportedby Chaze et al. (18). The difference could be attributed tothe reduced range of temperatures used for the calibration(AT~15C) and to the high temperatures investigated(T>85°C) in the present work, compared to the rangeof 27 °C to 80 °C investigated by Chaze et al. (18). Using this ratiometric 2cLIF method we obtained the tem-perature fields in the bulk and close to the bubble interface,despite the low signal to noise ratios and measurement sen-sitivity. The resulting temperature fields are smoothed with aGaussian filter to better illustrate the trends. Figure 9 showsthe water temperature fields measured at different time-stepsfor a typical nucleating bubble for q"=30 kW m-2. Theblue regions denote the bubble masks, which are overshotby 20% to cover any biases by the LIF-measured interfa-cial boundaries. Relatively small temperature gradients wererecorded in the bulk and away from the bubble, which canbe attributed to the natural circulation inside the cell. Super-heated liquid of about 2 °C above Tsat was displaced awayfrom the nucleating site of the bubble during its formationand departure from the heater. The superheated liquid can be Water Temperature, T(℃)100 101 102 103 104 105 (d) t*=2 ms (e) t*=6 ms (f)t*= 20 ms Figure 9: Temperature fields measured with 2cLIF at different time-steps for q"=30 kWm-2 and at T=Tsat. The surfaceof the bubbles is illustrated with the blue regions. Each contour level corresponds to 0.5 C. The scale bar is 0.5 mmlong. originating from mixing of the thermal boundary layer. Thisfinding is consistent with the recent results from Schlieren-based measurements of Narayan et al. (11; 12). It must benoted that we did not manage to measure a consistent thermalboundary layer along the heater surface for this condition.For q"=30 kW m-2 we expect the thermal boundary layerto be relatively small (approximately a few pixels thick). Weplan to perform targeted experiments of higher spatial reso-lution to accomplish accurate measurements at that region. 3.4 Temperature field: Heater The IR camera captured the temperature distribution acrossthe heater, Tw, during the bubble nucleation, growth and de-parture. A typical time-sequence during nucleation for a heatflux of q"=30 kW m-2is presented in Fig. 10. We observethat the local temperature of the nucleation site surround-ings promptly reduces as the bubble is generated. Peak localheat fluxes up to 500 kW m-2are recorded for the nominalheat flux of 30 kW m-2. During the initial stages of bubblegrowth, the vapour-liquid interface rapidly moves outwardsand a thin layer of liquid of few microns thick is trapped un-derneath the bubble. This liquid layer is known as the mi- crolayer and it exhibits low thermal resistance owing to thetransient heat conduction through the thin liquid film. Thehigh heat transfer efficiency of this mechanism explains theobserved difference between peak and nominal heat flux. The bubble grows due to the microlayer evaporation andthe heat transferred from the superheated liquid layer adja-cent to the heater. A critical bubble size is reached, when thebuoyancy forces overcome the adhesion forces, and the bub-ble departs from the heater surface. After its departure, thesuperheated liquid from the surroundings rewets the surfaceand the wall temperature keeps increasing up to the mean Tw,until a new bubble forms and the cycle repeats. 3.5 Velocity field The velocity and vorticity fields calculated with PIV areshown in Fig. 11 for the same nucleating bubble as Figs. 7,9 and 10, where q"= 30kWm-2and T= Tsat. Anupwards motion of high velocity magnitude appears dur-ing the initial steps of the bubble nucleation, which justifiesthe aforementioned findings of superheated liquid above thethermal boundary layer over the heater. It appears that theupwards motion decreases with time, as the bubble growth Figure 10: Wall temperature fields over the heater surface measured with IR at different time-steps for q"=30 kWm-2 andat T=Tsat. The images are portraying the whole heater area of 10 mm. (a)t*=0 ms (C) t* =2 ms (d)t*=6 ms (e)t*=20 ms Figure 11: Vector and vorticity fields of the water measured with PIV at different time-steps for q"= 30 kWm-2 and atT=Tsat. The scale bar is 1 mm long and the reference vector corresponds to a velocity magnitude of 0.1 ms-.The velocity fields are superimposed over the sliding average images of CAMsr. slows down. It is our future aim to explore the links betweenthe two rates and define the contributions of the natural con-vection and bubble growth in the resulting velocity field. Two counteracting vortices are forming on each side of thebubble after its departure, as shown in Fig. 9. These two vor-tices exhibit high levels of vorticity, with the maxima of thevorticity magnitude located close to their centres. These vor-tices induce an upwards mixing motion, which contributesto the presence of superheated liquid away from the heater.These vortices can also help reform the thermal boundarylayer after the bubble departs.Similar observations havebeen previously explored in Refs. (9;24). From the velocityvectors located away from the nucleating bubble we can ob-serve a distinct left-hand side motion, which can be attributedto the natural circulation caused by temperature gradients be-tween the top and bottom of the cell. 4 Concluding remarks We developed a combined high-speed infrared and laser-based diagnostic technique that enabled the simultaneous acquisition of spatiotemporally-resolved information on thewater velocity as well as the water and wall temperature dur-ing nucleate pool boiling. The technique is based on the si-multaneous application of two-colour laser-induced fluores-cence and particle image velocimetry and was applied to apool boiling cell of transparent side windows. The techniquewas combined with infrared measurements performed fromthe bottom of the cell, which was equipped with a sapphireglass/ITO heater. The set of measurements allowed us to findlinks between the heat transfer and fluid flow mechanismstaking place during the boiling process at saturated condi-tions and low heater heat fluxes. This study focused on the technical challenges encoun-tered during the experiments of single-bubble nucleate boil-ing and presented a measure of steps to define and over-come them. From the resulting temperature fields aroundthe bubble we found the presence of superheated liquid be-ing transferred from the growing and rising bubble to thebulk. Vortices were formed on each side of the rising bub-ble, which contributed to mixing close to the heater. The in-frared measurements supported these findings showing low temperatures at the nucleation site during the bubble forma-tion, which were accompanied by high local heat fluxes. Generally, the results show the intrinsic coupled natureof the flow and thermal fields during this important phe-nomenon. For this reason, we plan to investigate a wide rangeof heat fluxes and bulk water temperatures (subcooled condi-tions) to obtain a holistic view of the phenomena. Finally,an on-going effort is being made to extract information closeto the thermal boundary layer from these flows, enabling adetailed analysis of the heat flux partitioning. Acknowledgements This work was supported by the MIT International Scienceand Technology Initiatives (MISTI) Global Seed Funds, theDepartment for International Development (DFID) throughthe Royal Society-DFID Africa Capacity Building Initiative,the Imperial College London Faculty of Engineering DameJulia Higgins Postdoc Collaboration Fund and Chevron Cor-poration. Data supporting this publication can be obtained onrequest from cep-lab@imperial.ac.uk. ( References ) ( [1] Su, G.Y., Bucci,M., McKrell, T. and B uongiorno, J.,Int. J. Heat Mass Transfer 96, 667 ( 2016). ) ( [2] Su, G. Y., Bucci, M., M cKrell, T.an d Buongiorno, J., Int. J . Hea t Mass Transfer 96,685 (2016). ) ( [3] Huo, X ., C hen, L., Tian, Y .S. a nd Karayiannis, T.G., Appl. Therm. Eng. 24, 1225 (2004). ) ( [4] Colombo, M . and F a irweather, M., Int. J. Heat Mass Transfer 85, 1 35 (2015). ) ( [5] Sugrue,R. and Buongiorno,J.,Nuc.En g . De s . 305,717 (2016). ) ( [6] Magnini, M ., Pulvirenti, B . and T home, J.R., I n t. J. Heat Mass Transfer 59, 451 (2013). ) ( [7] Smith,E . R., Theodorakis, P.E., Craster, R .V. and Matar, O.K., Langmuir 34, 12501(2018). ) ( [8] Hutter, C. , Kenning,D.B.R., Sefiane, K., Kar a yiannis,T.G., Lin, H., Cummins, G., and Walton, A.J., E xp. Therm. Fluid Sci. 34, 422(2010). ) ( [9] Gerardi, C.D., Buongiorno, J., Hu, L.W. and McKrell,T., Int. J. Heat Mass Transfer 53, 4185 (2010). ) ( [ 1 0] Bucci,M., Richenderfer, A., Su, G.-Y., M c Krell,T. and Buongiorno,J., I n t. J.Multiphase Flow 83, 115 ( 2016). ) ( [11] N arayan, S . , Srivastava, A . a nd Singh, S., I nt. J. Heat Mass Transfer 120, 127 (2018). ) ( [12] N arayan,S., S r ivastava, A. and Singh, S., I nt. J.Multi- phase Flow 110, 82 (2019). ) ( [13] M athie, R ., Nakamura, H. a n d Markides, C.N., Int. J. Heat Mass Transfer 56, 819 (2013). ) ( [14] Charogiannis, A. , An, J.S. and Markides, C.N., Exp. Thermal Fluid Sci. 68,516(2015). ) ( [15] M arkides, C.N., Mathie, R. a n d Charogiannis, A., Int.J. Heat Mass Transfer 93, 872(2016). ) ( [16] Chaze, W., Caballina, O., Castanet, G. and Le m oine, F., Exp. Fluids 58,96 (2017). ) ( [17] Sakakibara, J. a nd A drian, R.J., E x p. Fluids 26, 7(1999). ) ( [ 1 8] Chaze, W., Caballina,O., Castanet, G. and Lemoine, F., Exp. Fluids 57, 58 (2016). ) ( [19] V oulgaropoulos,V . and Angeli,P., Exp. Fluids 58, 1 70(2017). ) ( [20]V o ulgaropoulos, V., D o ctoral dissertation, UCL ( U ni-versity Collge London) (2018). ) ( [21] Charogiannis, A., Denner, F. , va n Wachem, B.G.M.,Kalliadasis, S. and M arkides, C.N., Phys. Re v . Fluids2,014002(2017). ) ( [22] Haber, T ., Gebretsadik, M. , Bockhorn, H. and Zarzalis, N., Int. J . Multiphase Flow 76, 64 (2015). ) ( [23] Charogiannis, A ., An, J.S. a nd Markides, C . N., 1 3 h International Conference on Heat Transfer, Fluid M e - chanics and T hermodynamics, I g uazu Falls, B r azil(2017). ) ( [24] Bhatt, D ., Kangude, P. and Srivastava, A., Ph y s. Fluids31,017102(2019). ) We study nucleate pool boiling in water at saturation temperature and ambient pressure under low heat fluxes. A combination of high-speed and spatially-resolved diagnostic tools are developed and applied to provide detailed insight into the flow and heat transfer mechanisms during bubble life cycle. Two fluorescent dyes with non-overlapping spectra are seeded into the water and are excited by a Nd:YLF laser sheet at 527 nm. A two-colour laser-induced fluorescence method is employed to individually track the fluorescence of each dye by connecting two cameras, equipped with separate optical filters, to a beamsplitter and a lens. Tracer particles are also introduced in the water to perform simultaneous particle image velocimetry measurements. Finally, synchronised high-speed infrared thermometry is conducted to acquire the surface temperature field over the heater. The links between the interfacial/bubble dynamics, flow and heat transfer are investigated. Superheated liquidfrom the thermal boundary layer adjacent to the heater is displaced upwards, due to the growth and departure of the bubbles. Two counteracting vortices form on each side of the bubbles during their departure and rise, which contribute to the scavenging and mixing of the bulk water, resulting in a trail of superheated liquid below them.
确定


还剩7页未读,是否继续阅读?

产品配置单


北京欧兰科技发展有限公司为您提供《水池池沸腾过程中温度和速度场检测方案(CCD相机)》,该方案主要用于其他中温度和速度场检测,参考标准--,《水池池沸腾过程中温度和速度场检测方案(CCD相机)》用到的仪器有LaVision HighSpeedStar 高帧频相机、德国LaVision PIV/PLIF粒子成像测速场仪、PLIF平面激光诱导荧光火焰燃烧检测系统、LaVision DaVis 智能成像软件平台
推荐专场
CCD相机/影像CCD
更多


相关方案
更多
该厂商其他方案
更多