


方案详情
文
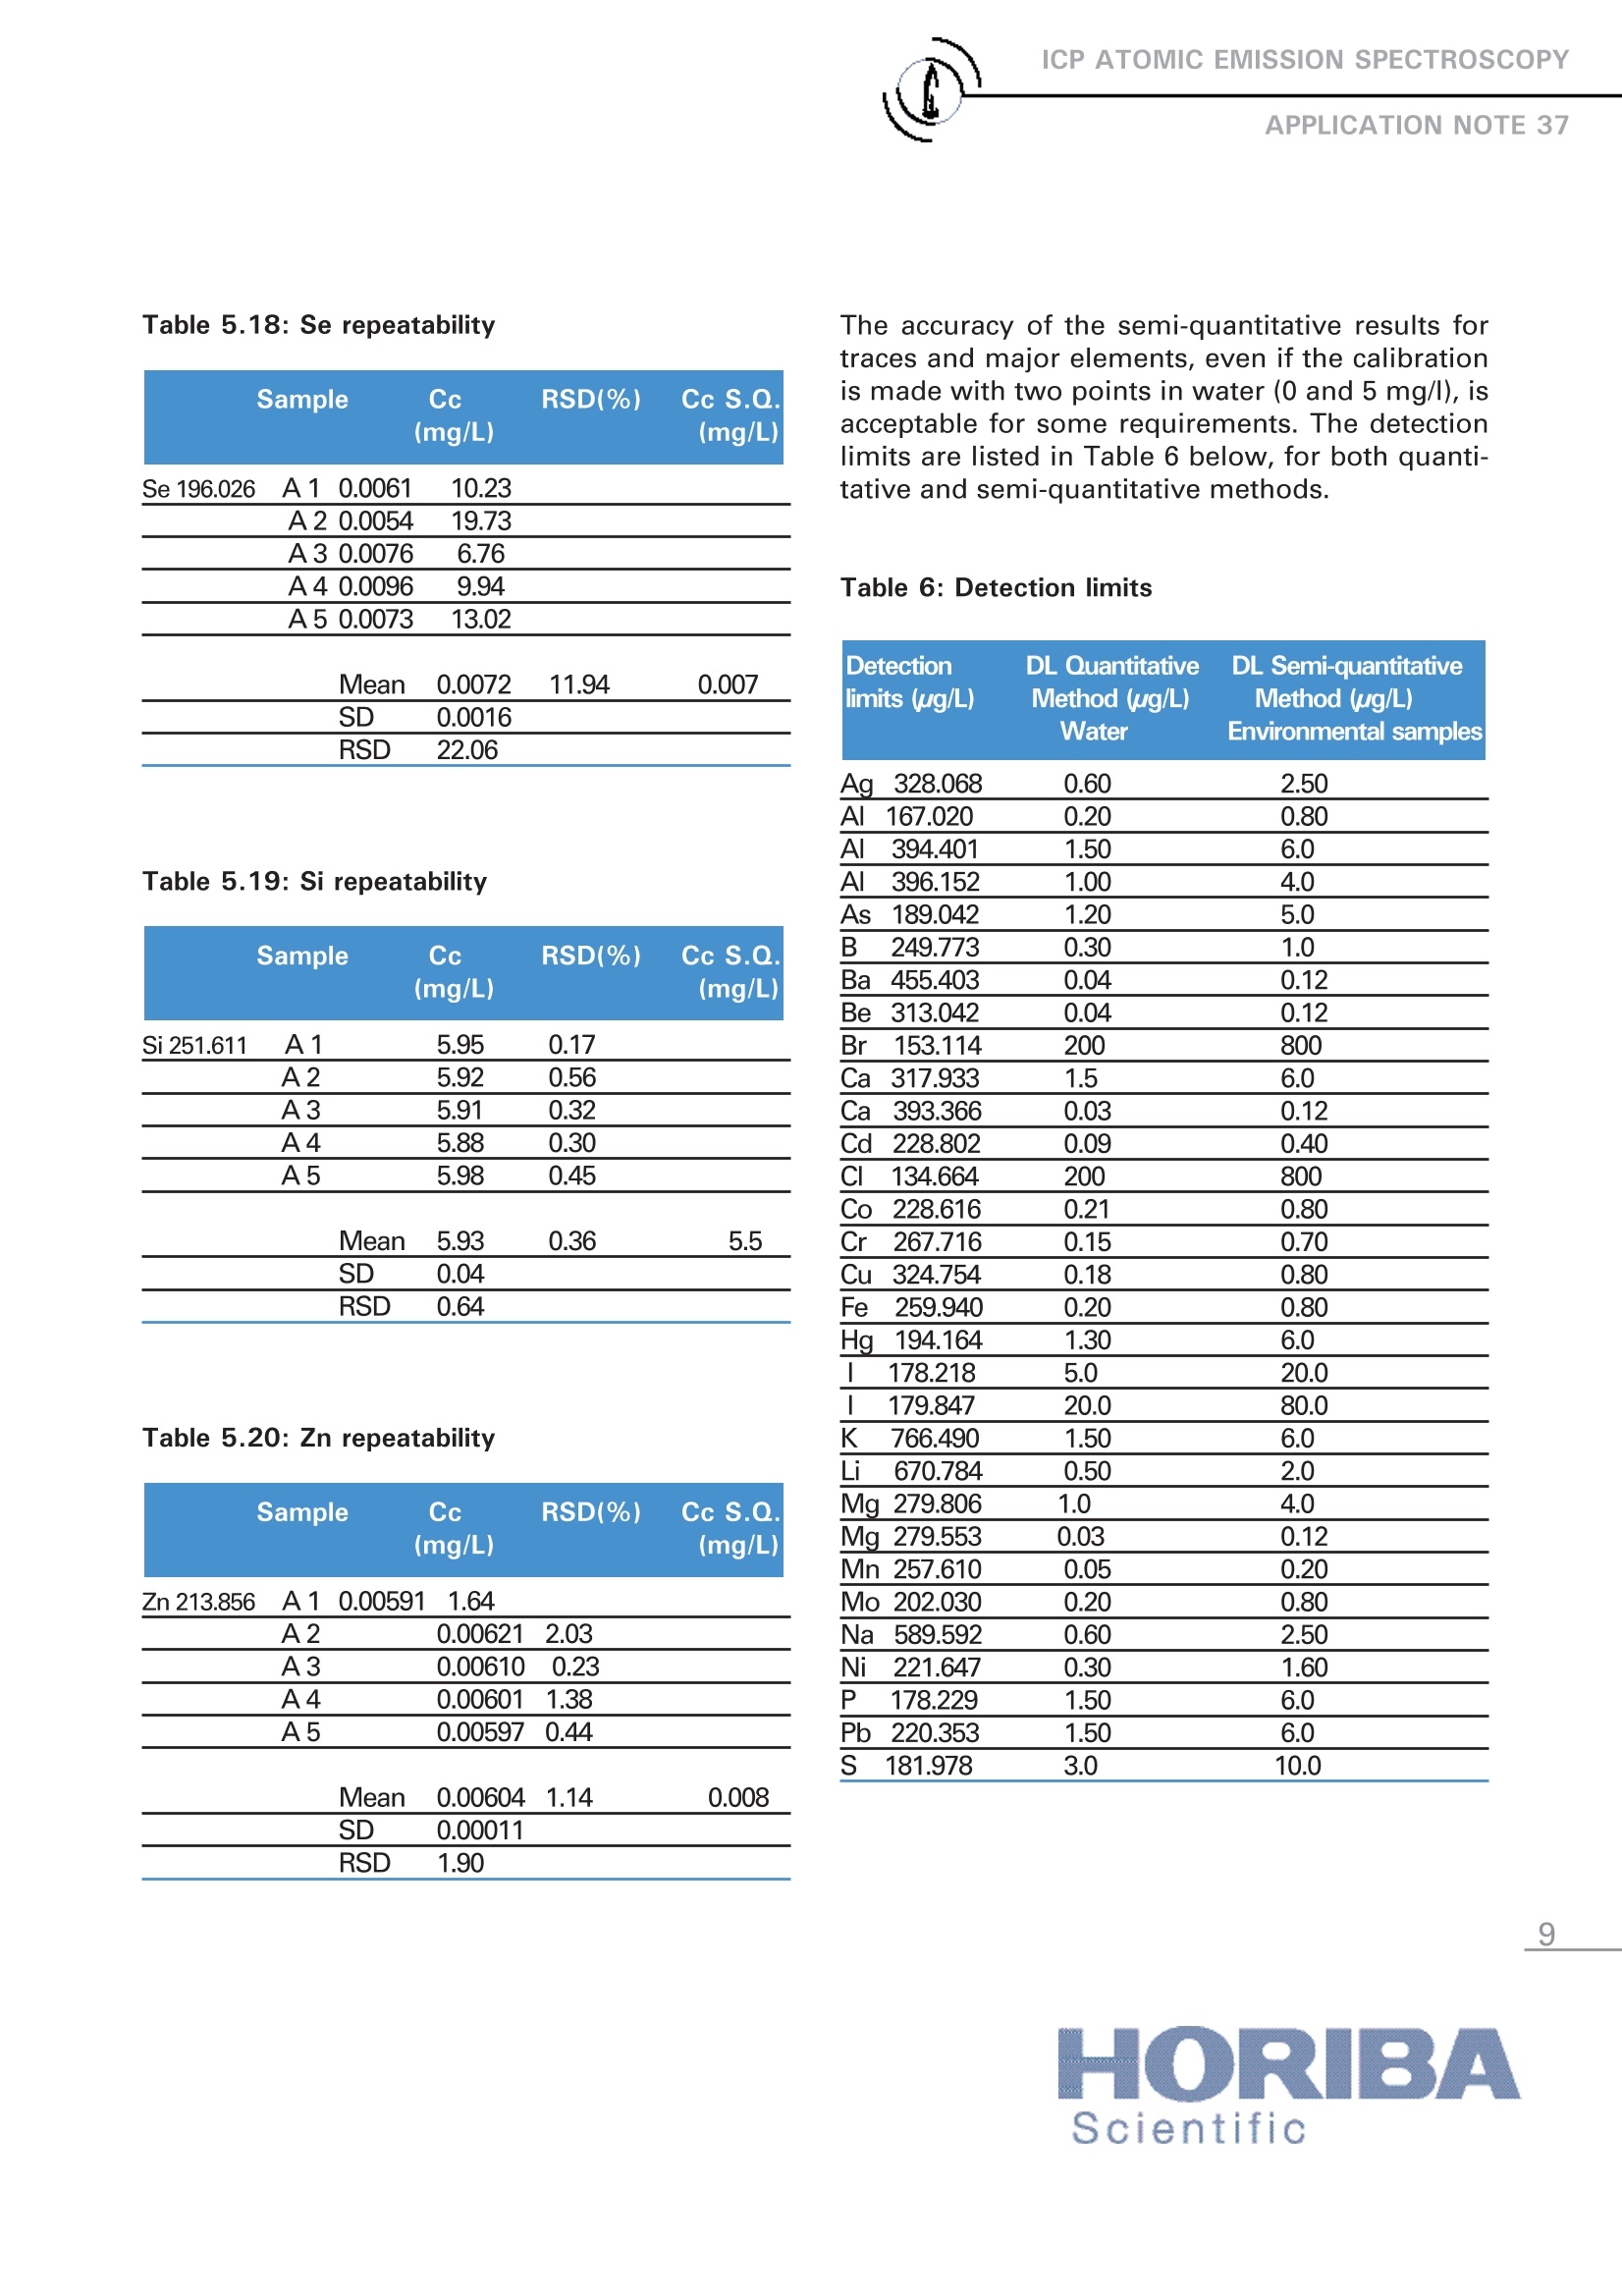
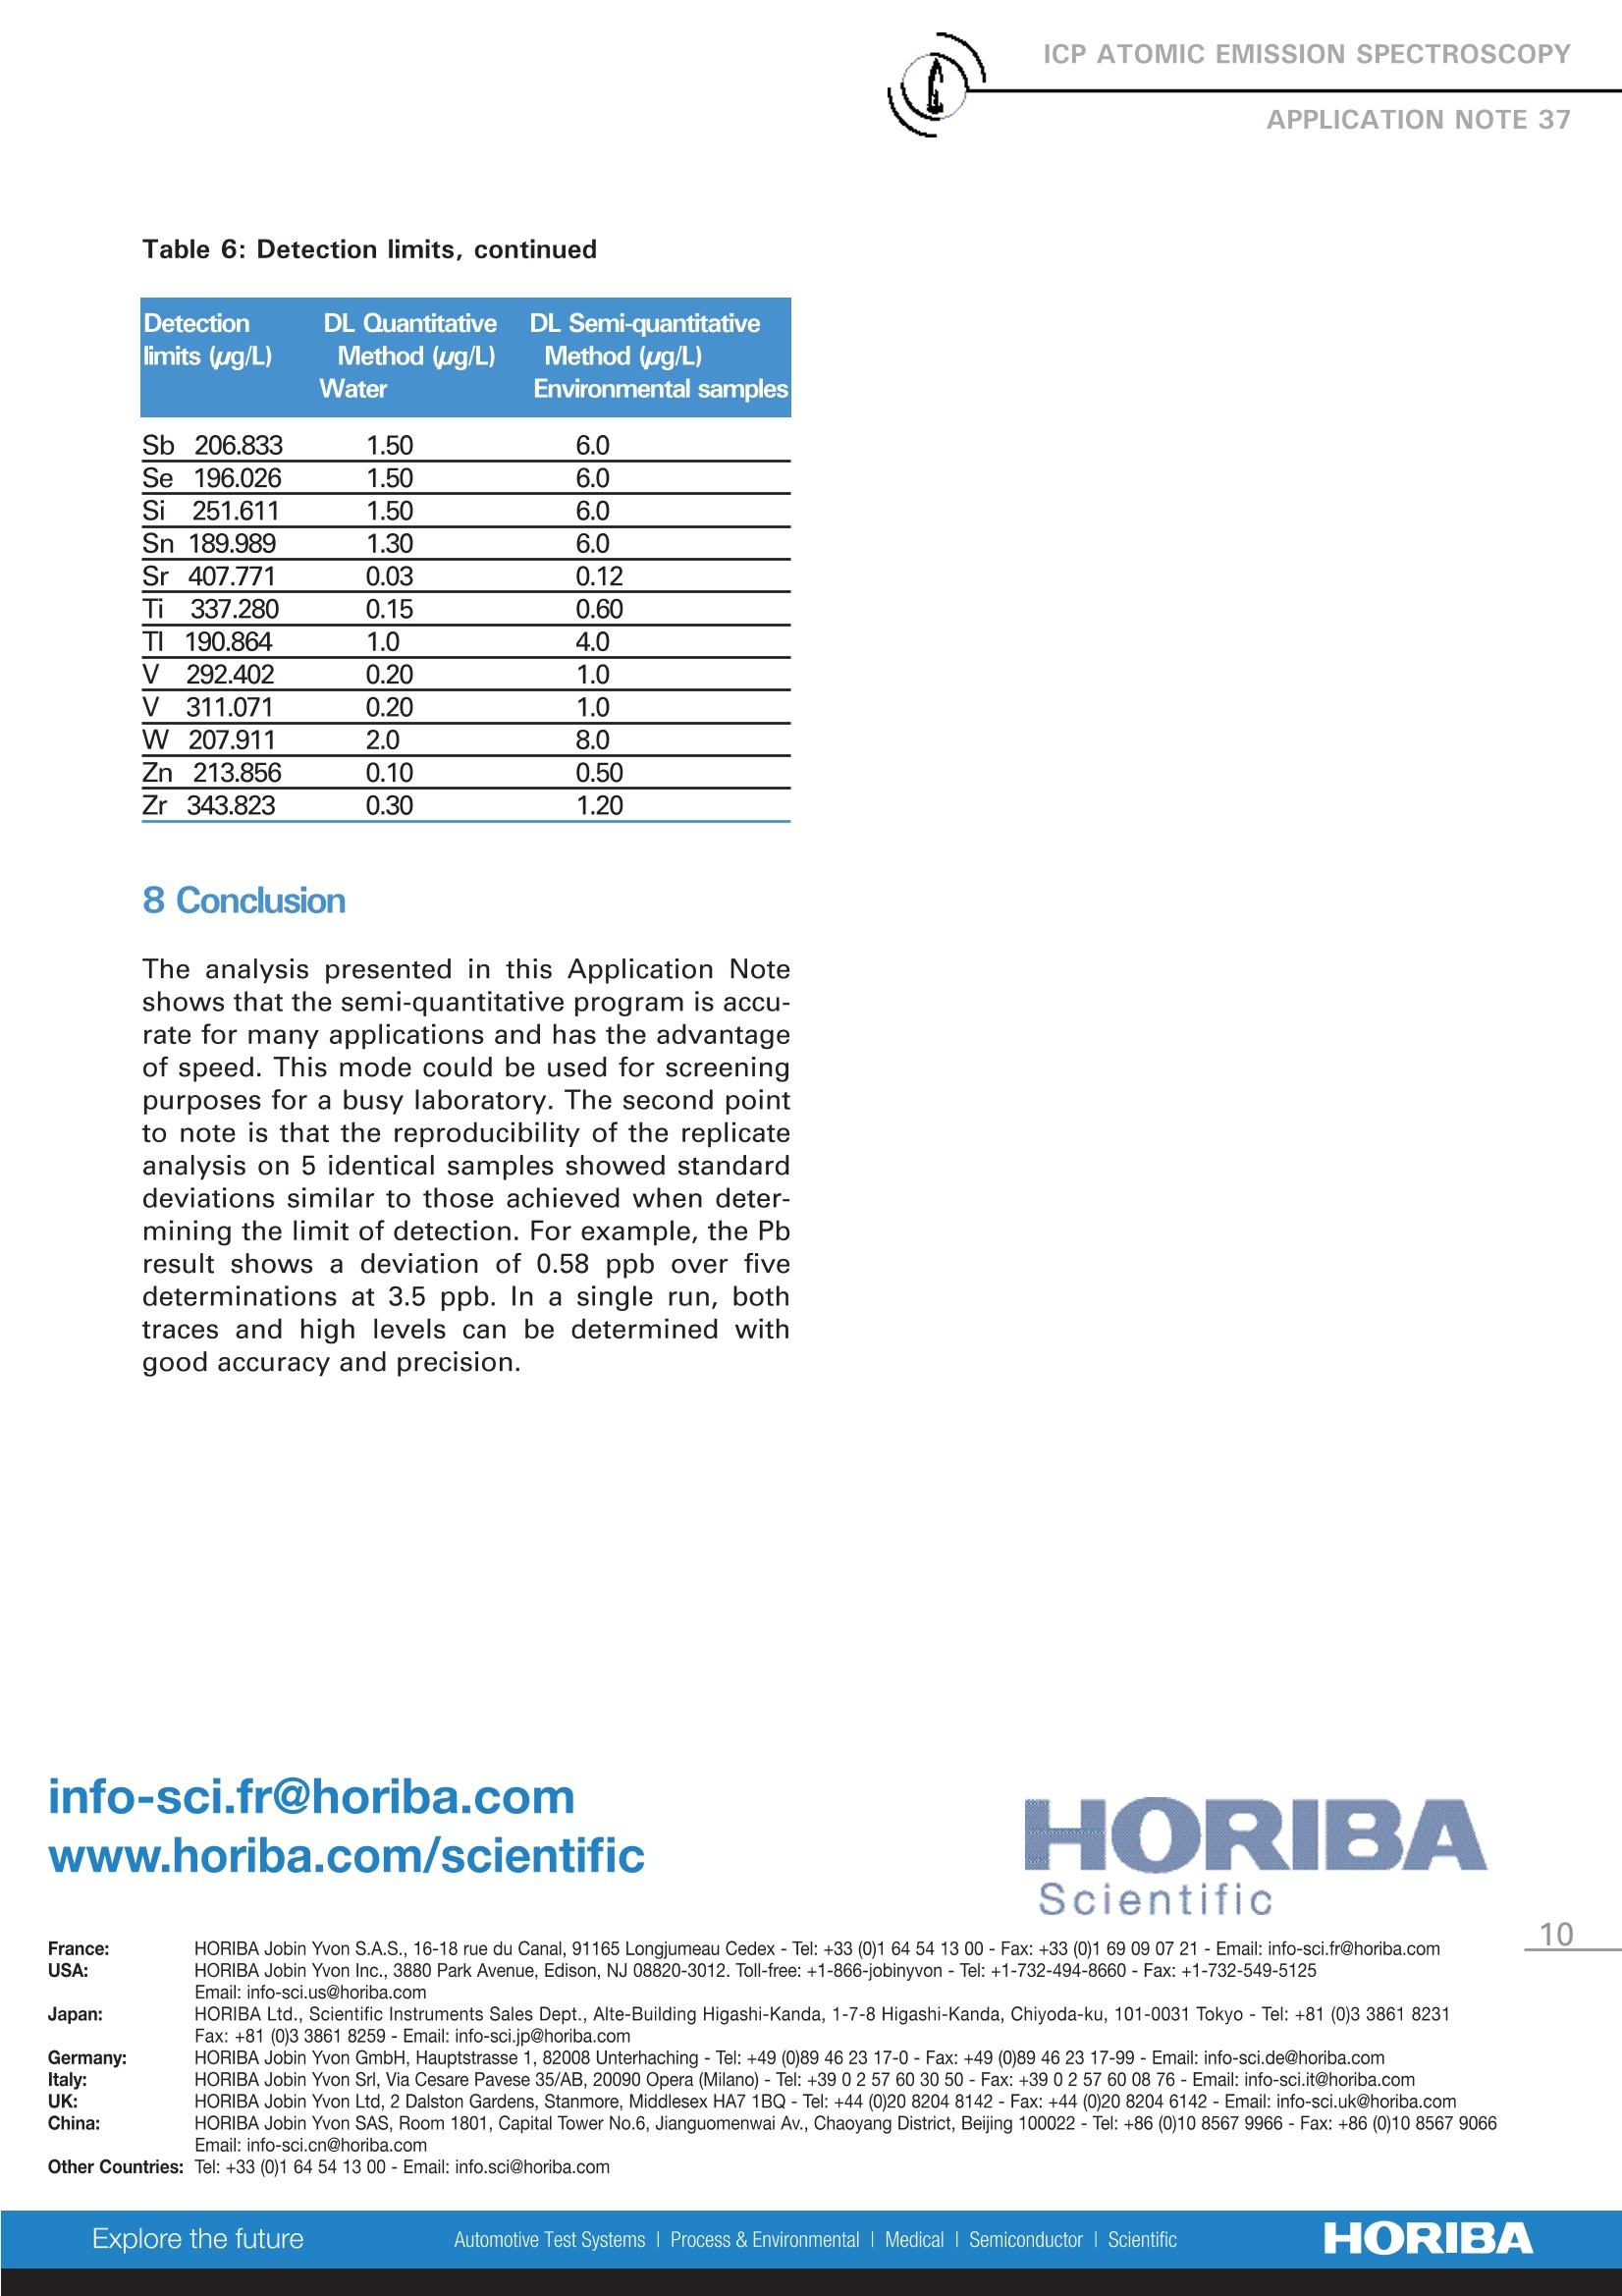
The analysis presented in this Application Note shows that the semi-quantitative program is accurate for many applications and has the advantage of speed. This mode could be used for screening purposes for a busy laboratory. The second point to note is that the reproducibility of the replicate analysis on 5 identical samples showed standard deviations similar to those achieved when determining the limit of detection. For example, the Pb result shows a deviation of 0.58 ppb over five determinations at 3.5 ppb. In a single run, both traces and high levels can be determined with good accuracy and precision.
方案详情

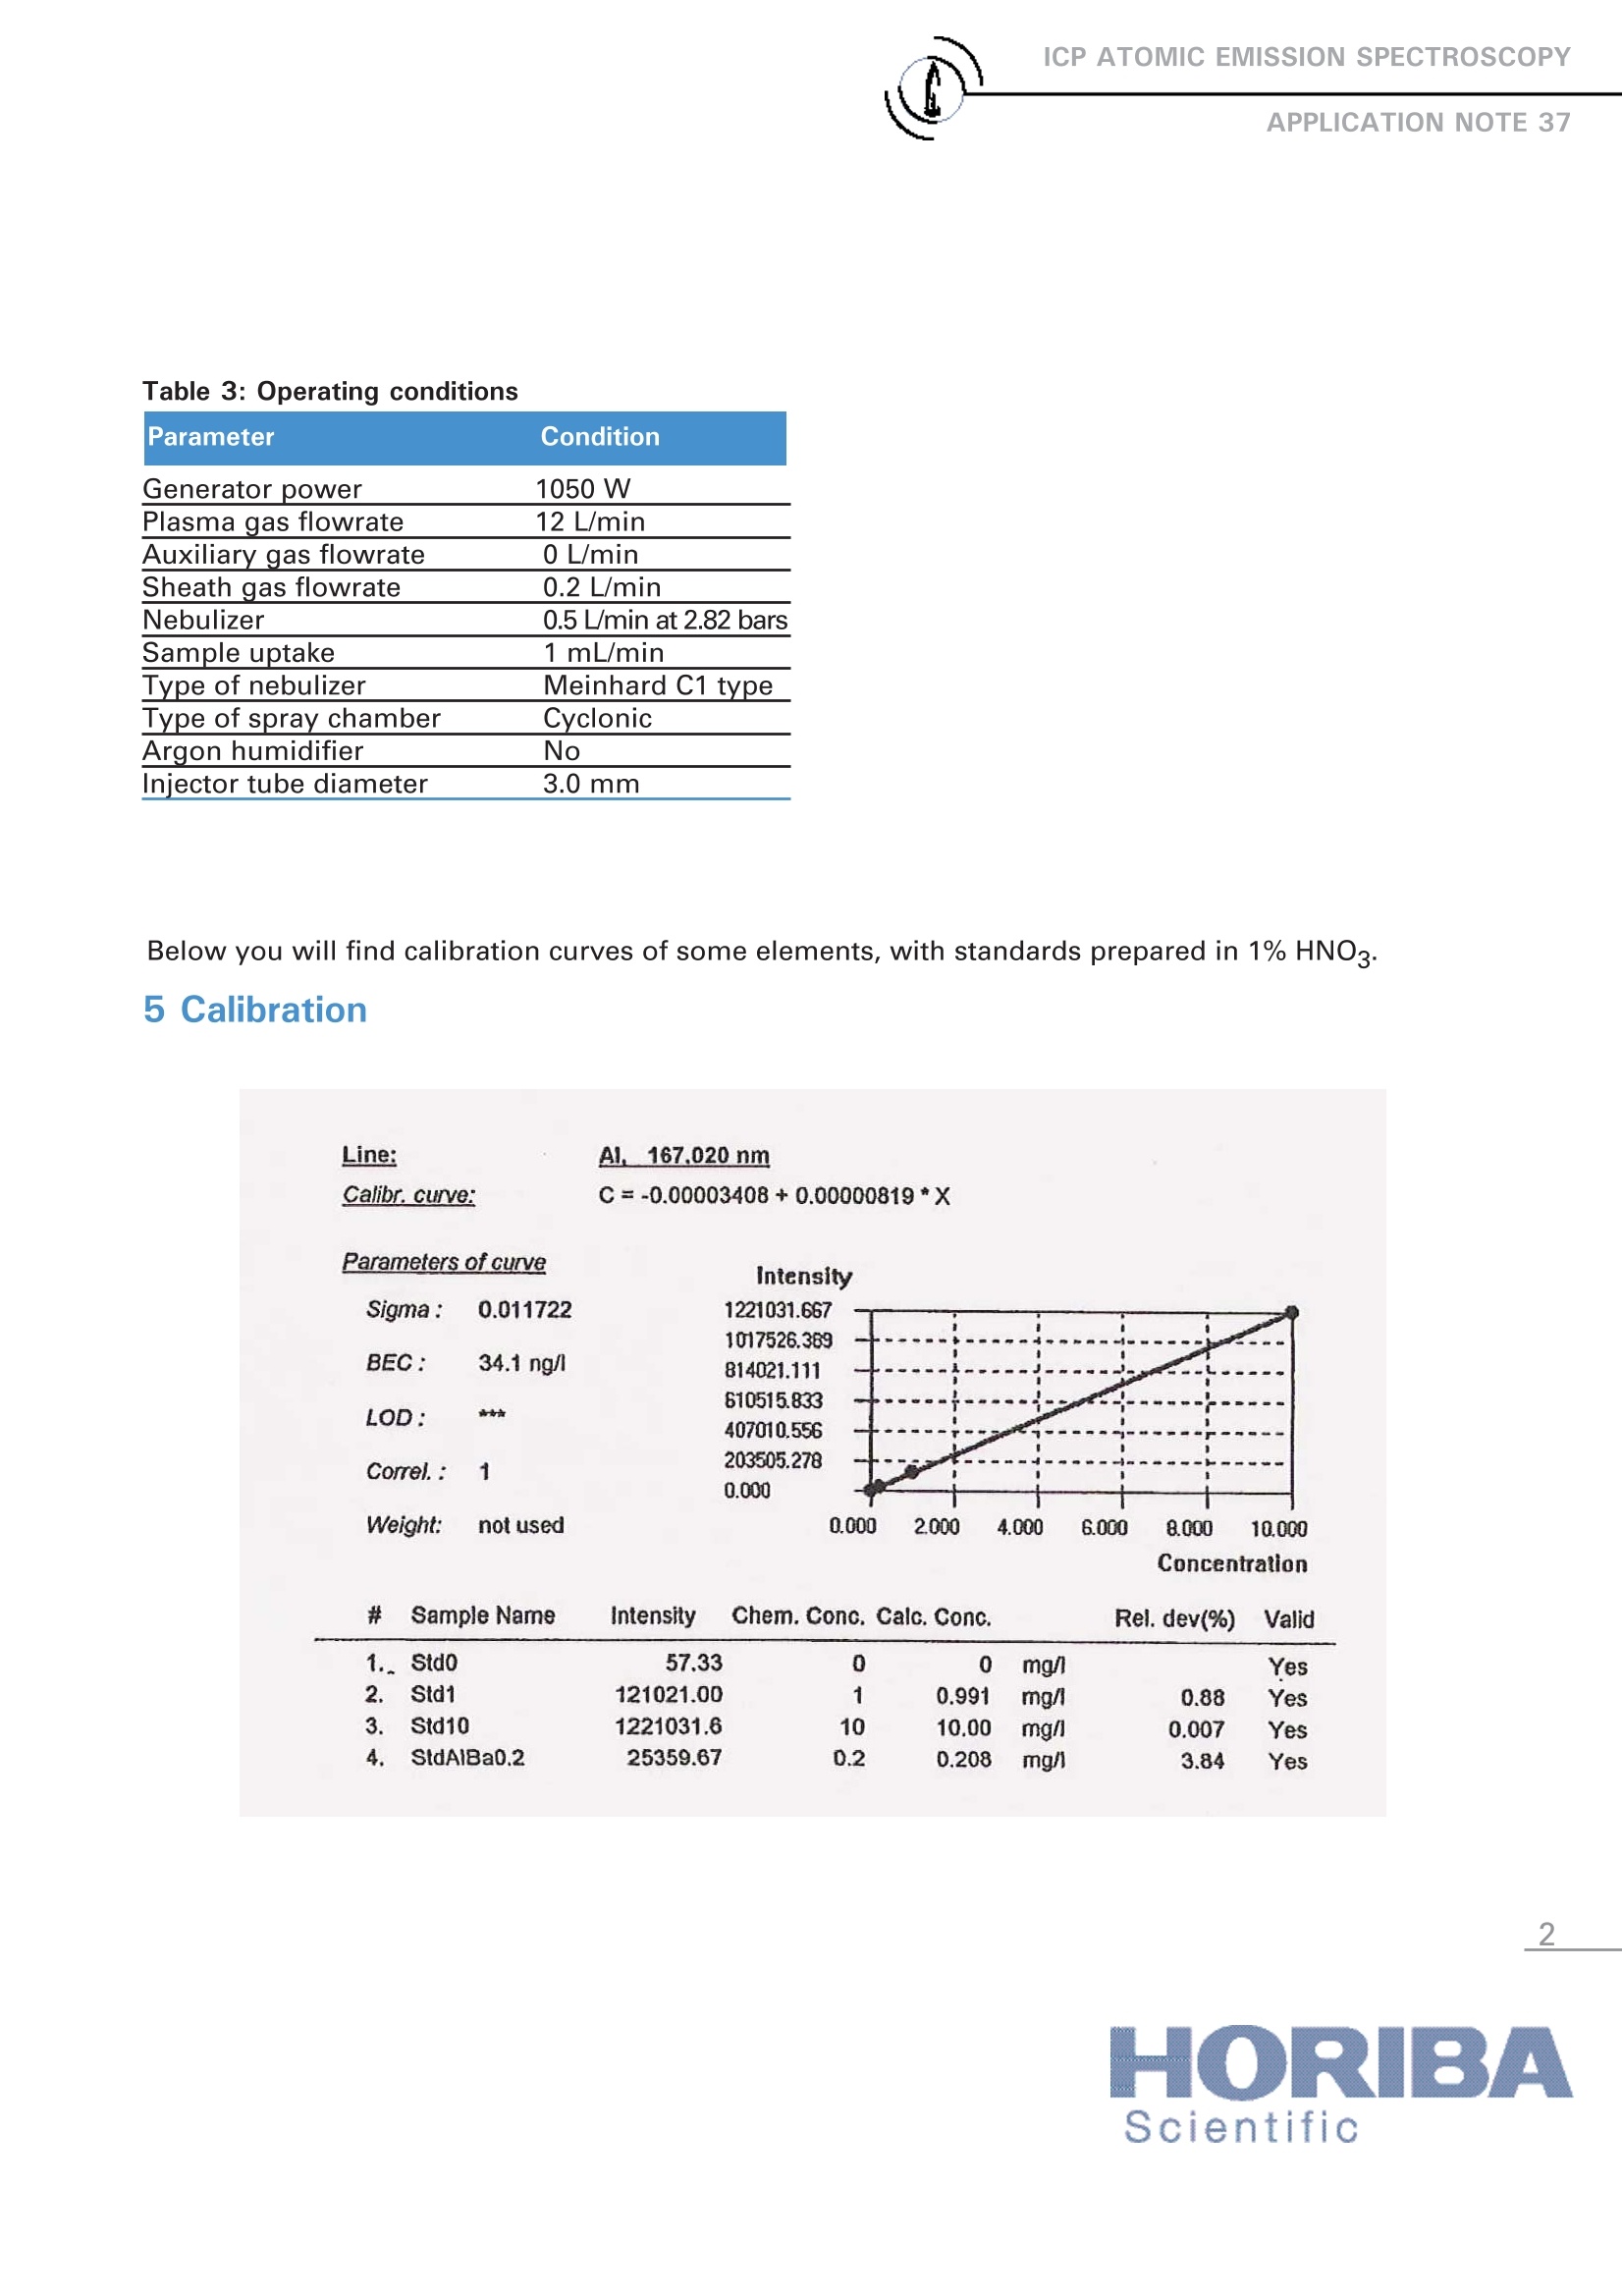
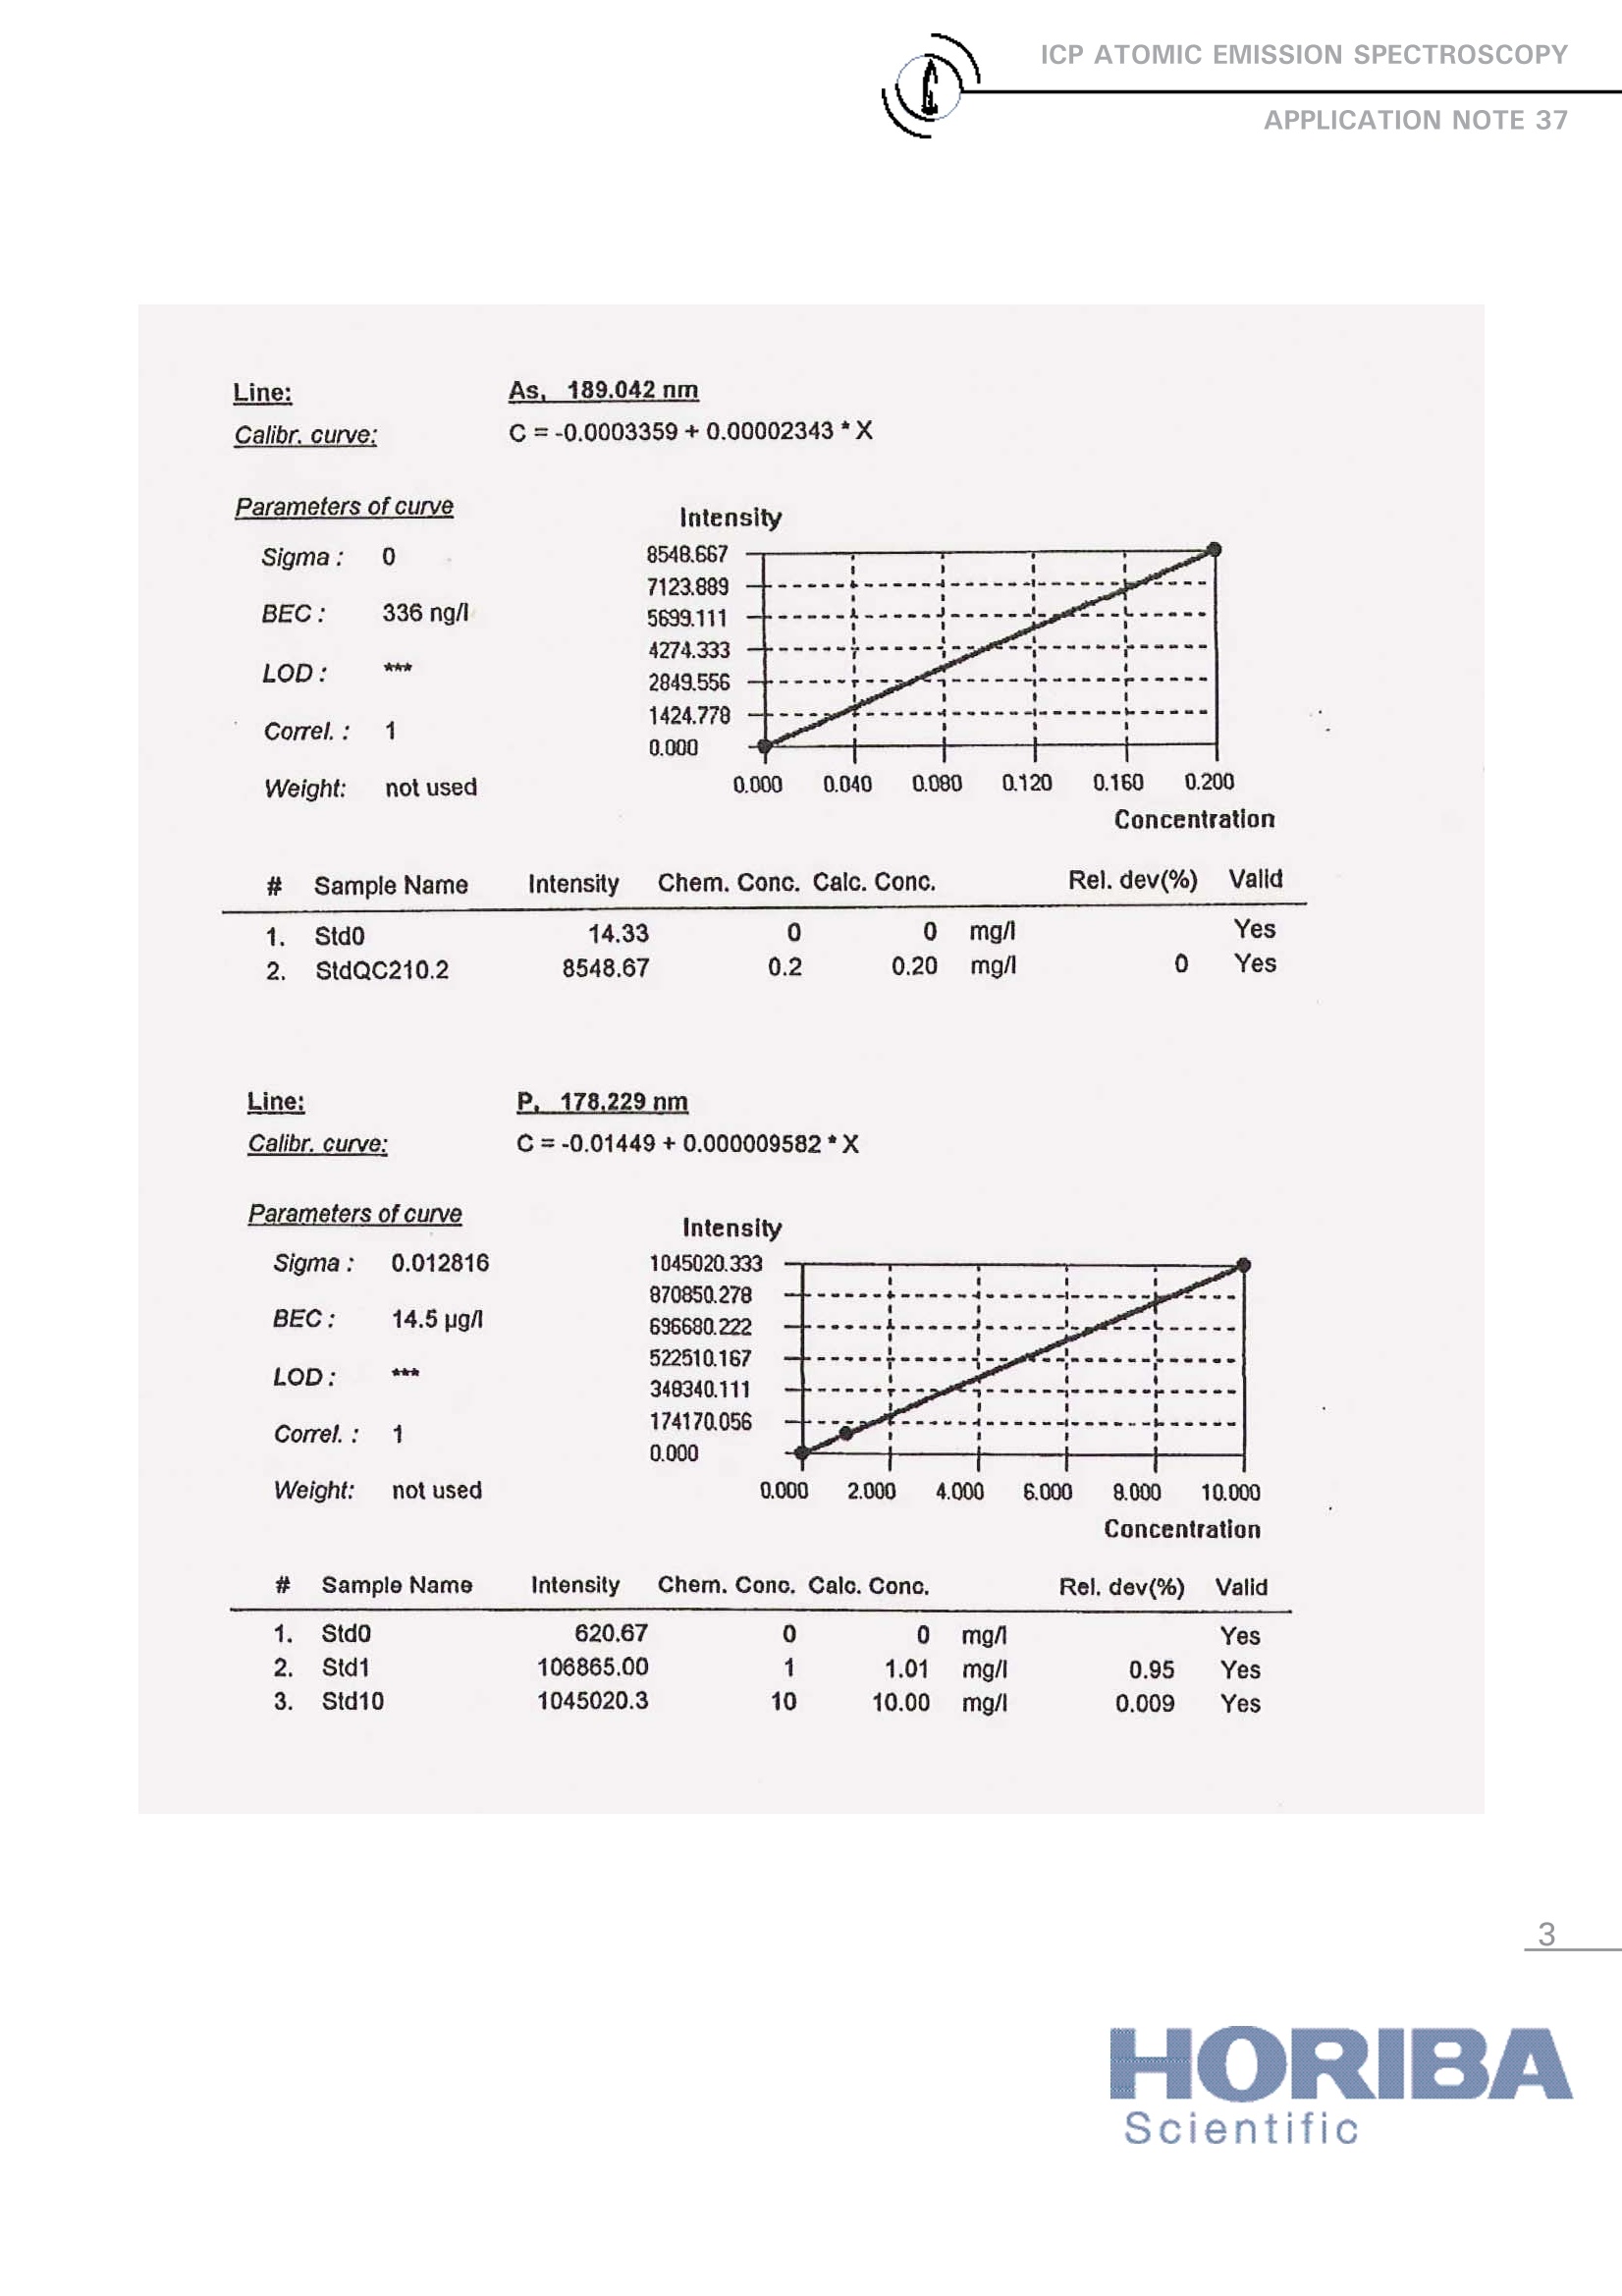
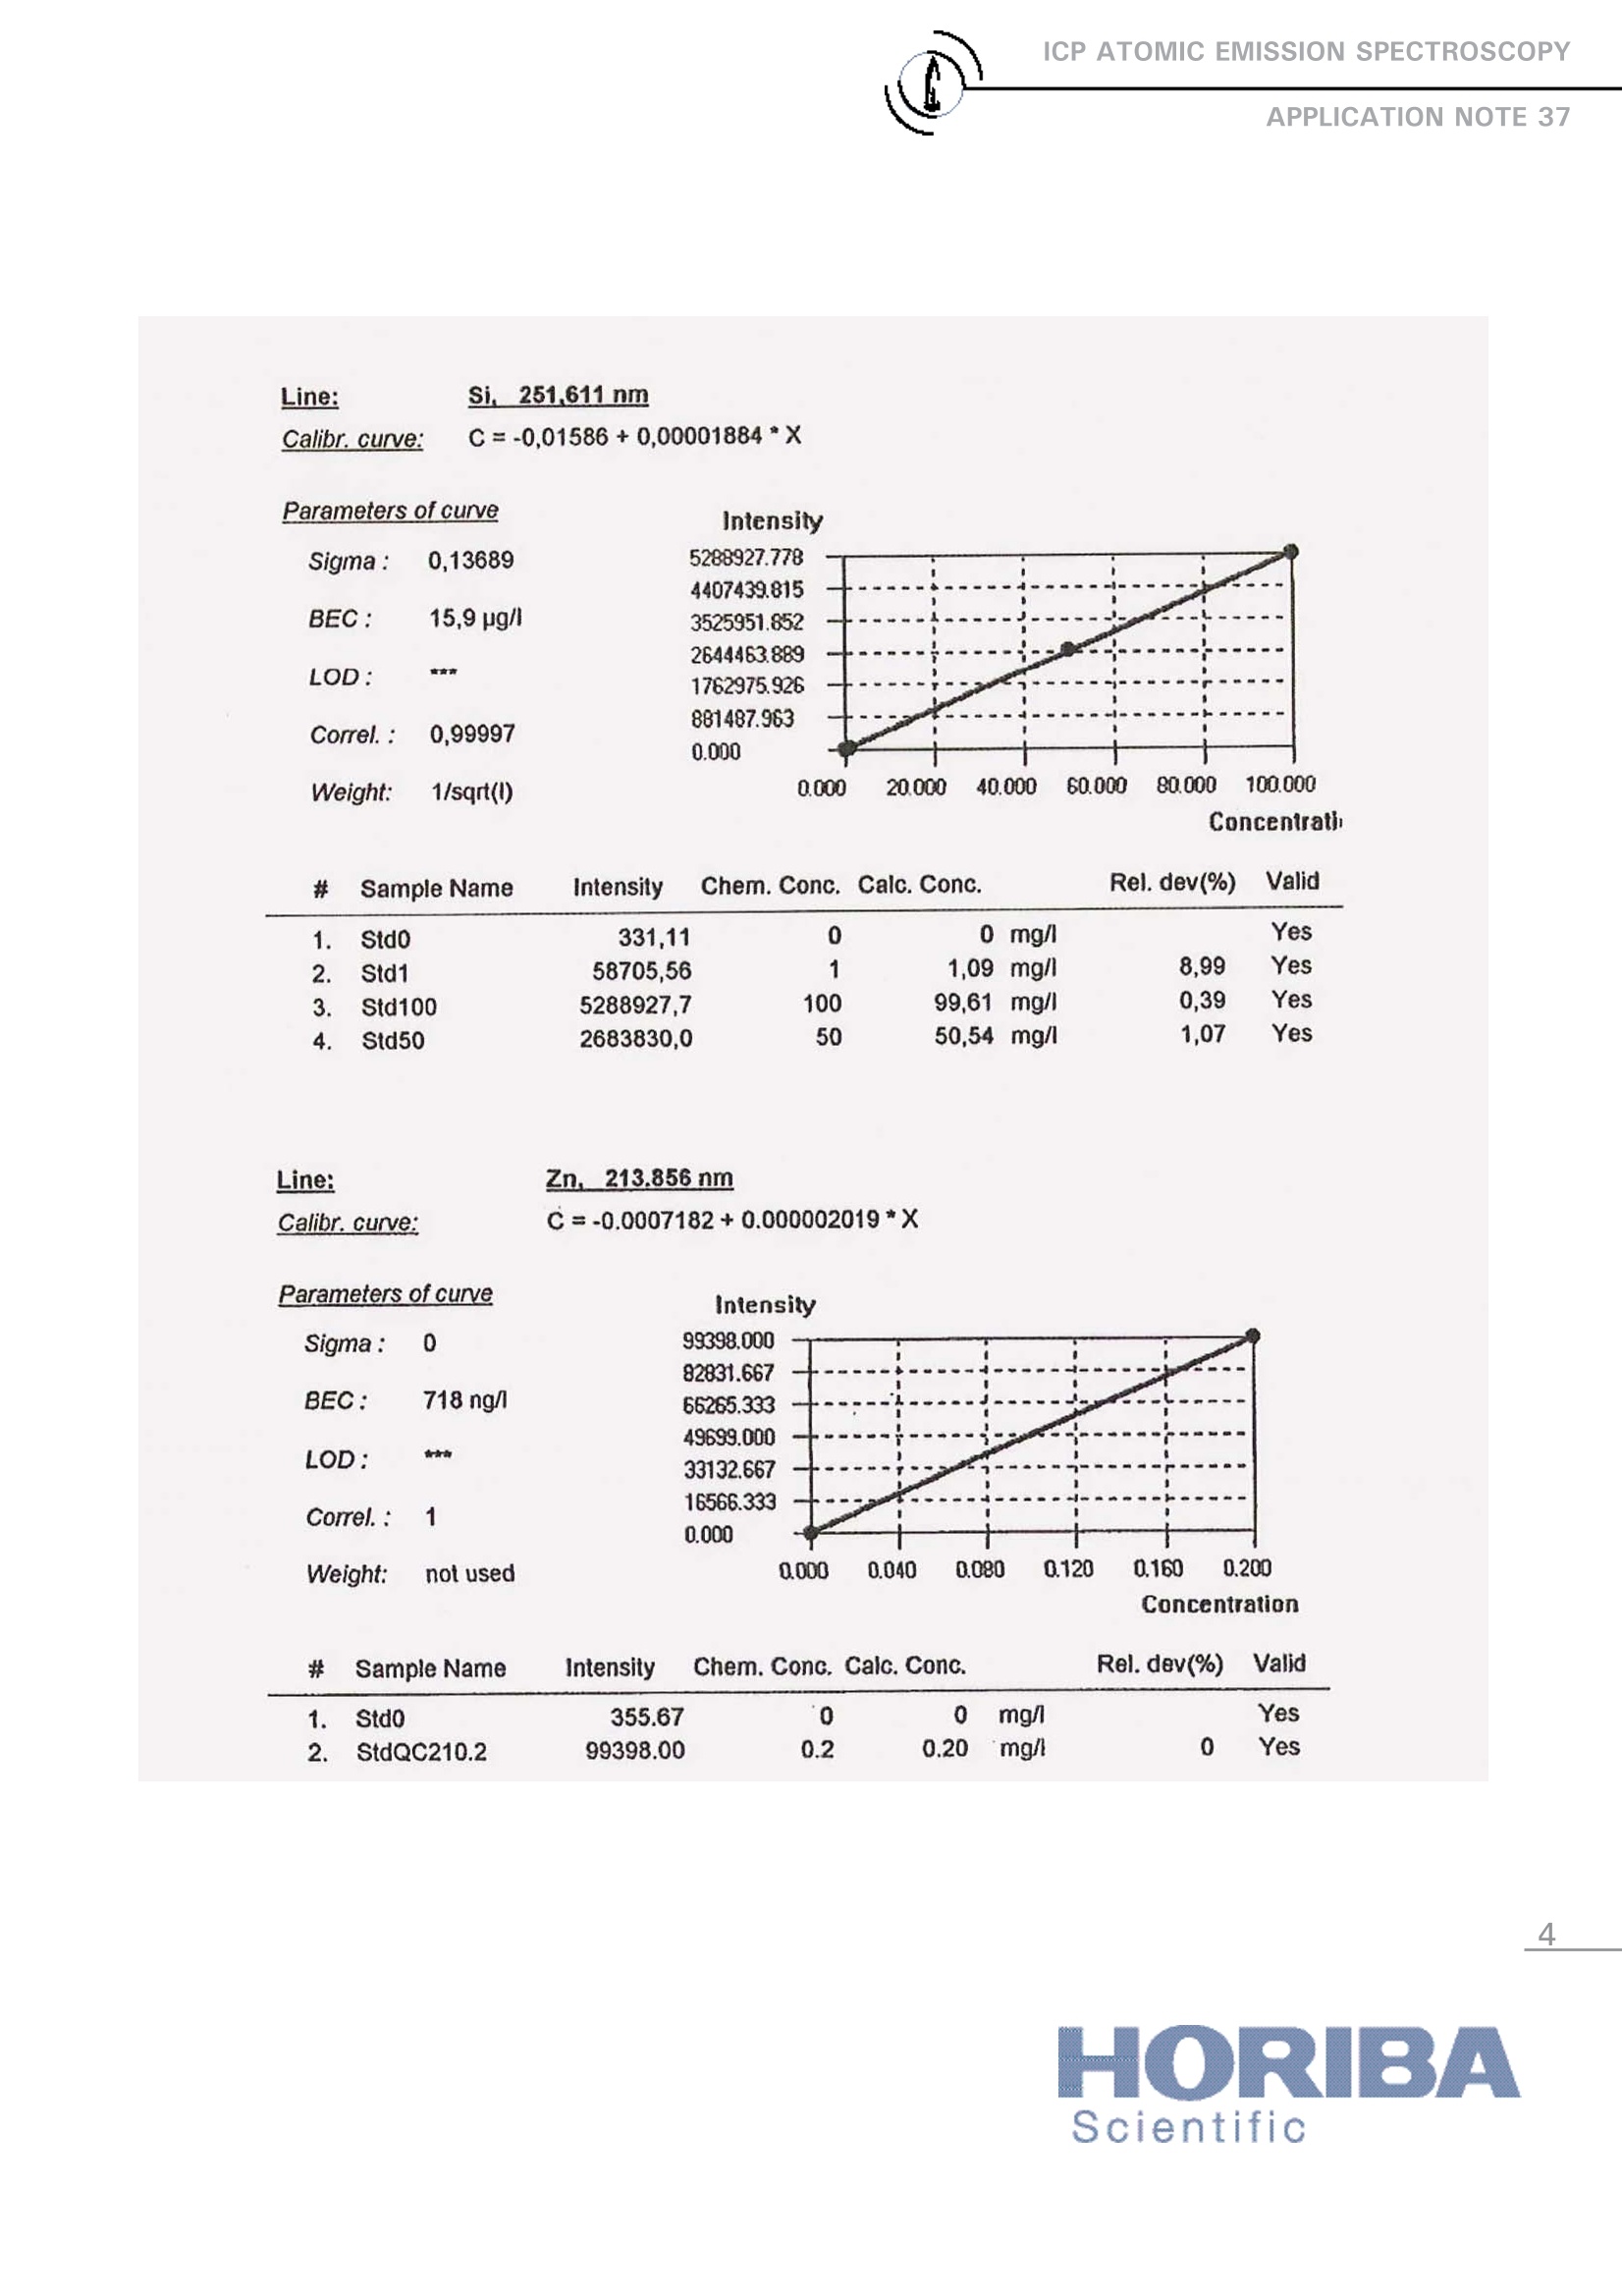
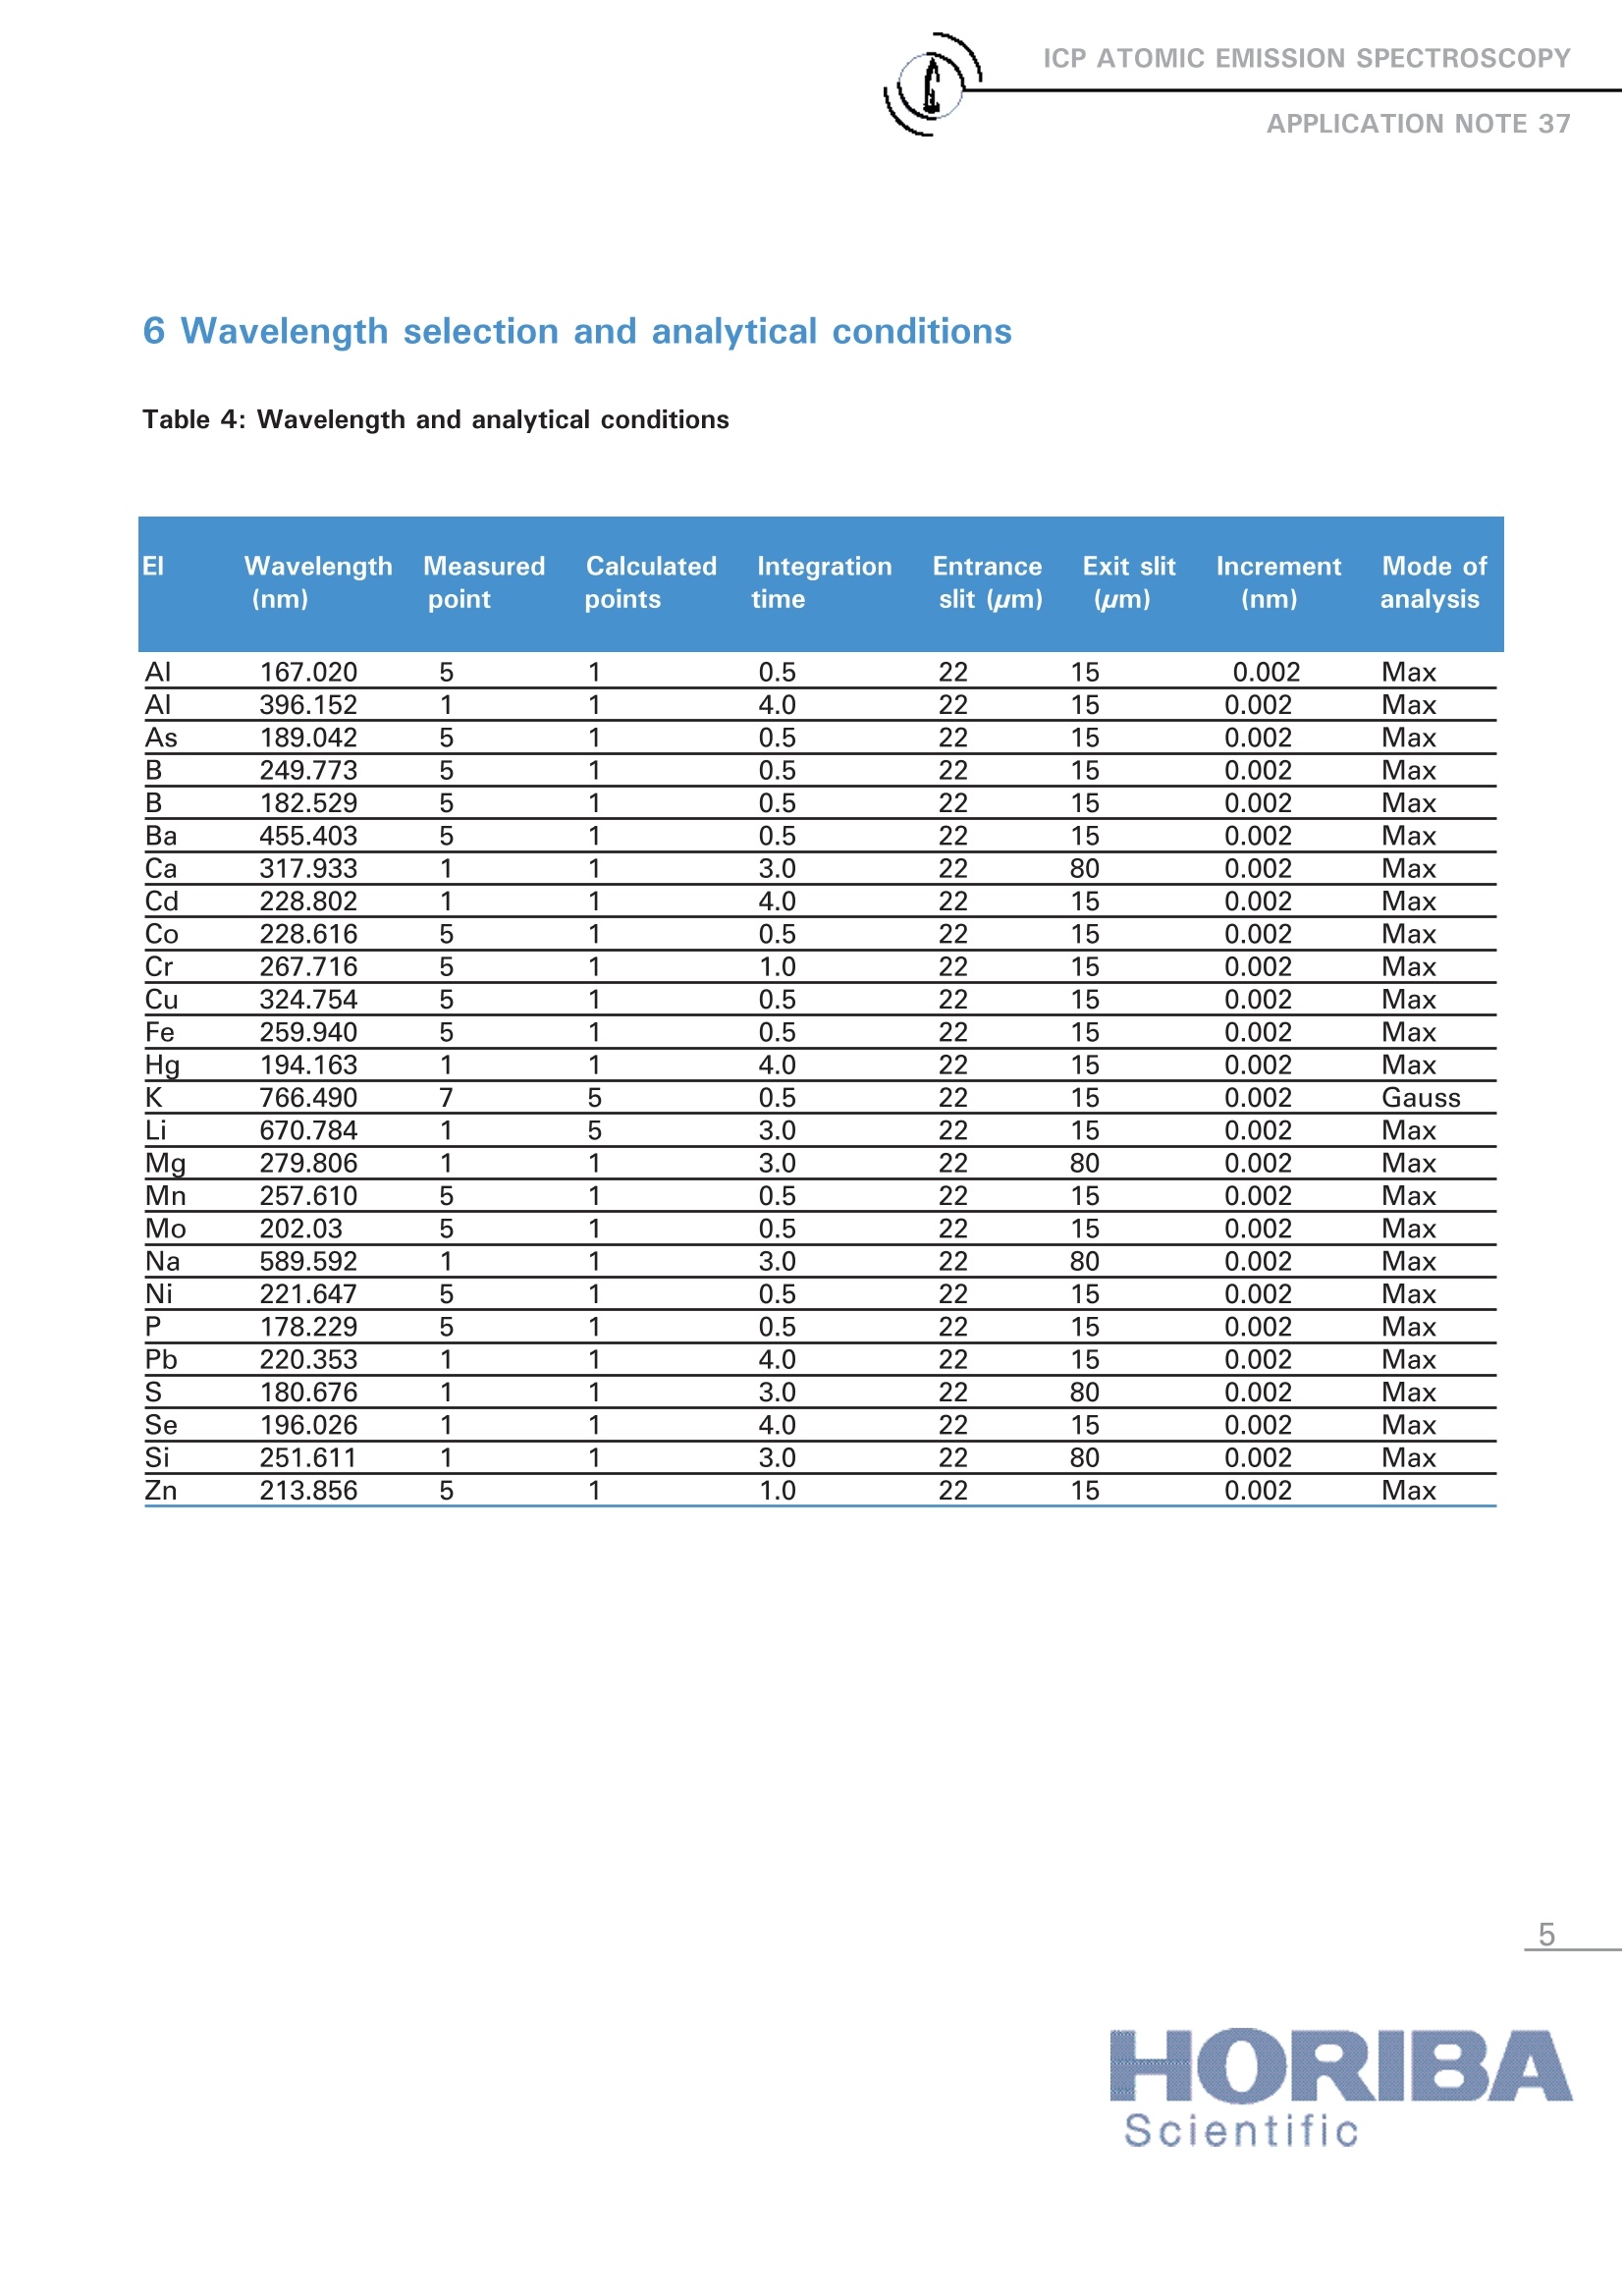
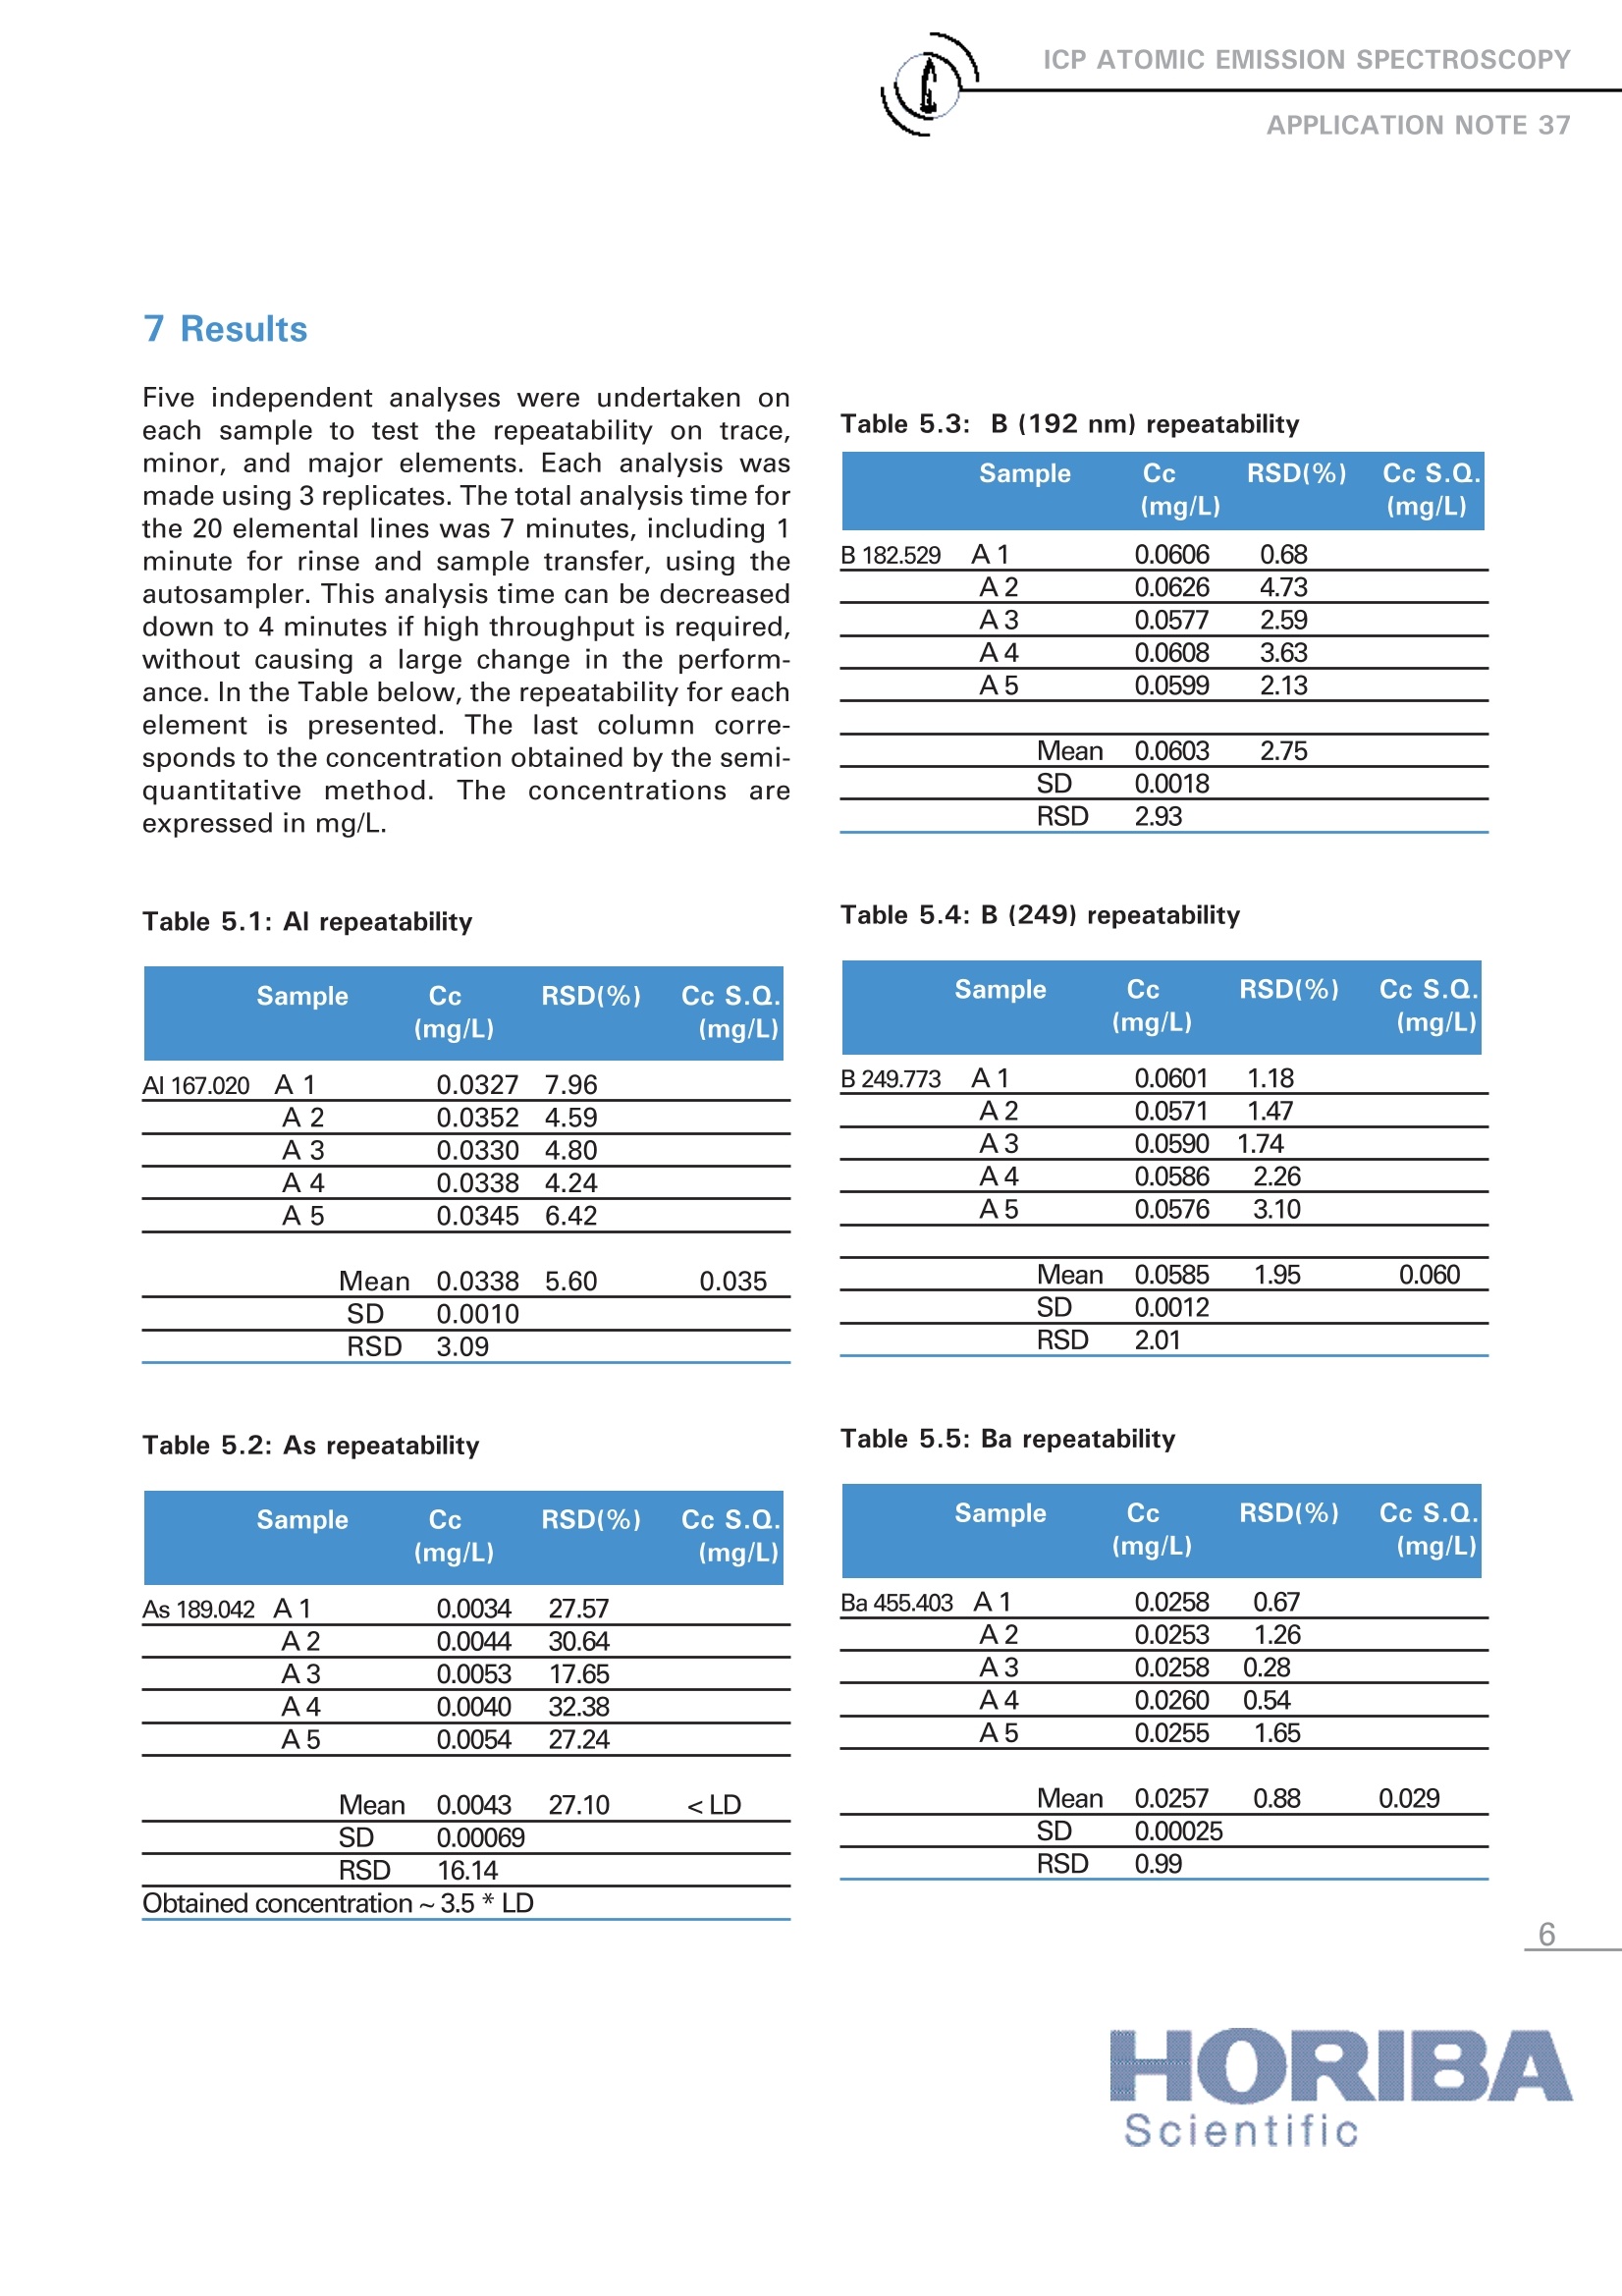
ICP ATOMIC EMISSION SPECTROSCOPYAPPLICATION NOTE 37 Analysis Repeatability of Trace and Major Elements in a WaterSample Agnes COSNIERHORIBA ScientificLongjumeau, France Keywords: environment Elements: Al, As, B, Ba, Ca, Cd, Co, Cr, Cu, Fe, Hg, K, Li, Mg, Mn, Mo, Na, Ni, P, Pb, S, Se, Si,Zn This Application Note examines the analysisrepeatability of trace and major levels of ele-ments in a water sample.The water samplewas initially analyzed using a rapid semi-quanti-tative method to determine the concentrationrange for all the elements. Five successiveanalyses were then measured,using a quantita-tive method, to establish the repeatability ofboth low and high concentrations. 2 Principle 2.1 Technique used The elemental analysis of these samples wasundertaken by Inductively Coupled PlasmaAtomic Emission Spectrometry (ICP-AES). Thesample is nebulized then transferred to anargon plasma. It is decomposed, atomized andionized whereby the atoms and ions are excited.We measure the intensity of the light emittedwhen the atoms or ions return to lower levels ofenergy. Each element emits light at characteris-tic wavelengths and these lines can be used forquantitative analysis after a calibration. 2.2 Wavelength choice The choice of the wavelength in a given matrixcan be made using the profile function, or byusing "Win-Image", which is rapid semi-quanti-tative analysis mode using multiple wave-lengths. The principle is the same in either case:record the scans of analytes at low concentra-tion, and of the matrix. By superimposing the spectra, we 3 Sample Preparation The water samples were stabilized in 1% HNO. 4 Instrument specification The work was performed on a ULTIMA 2 withthe specifications shown below. Table 1: Specification of spectrometer Parameters Specifications Mounting Czerny-Turner Focal length 1 m Thermoregulation Yes Variable resolution Yes Nitrogen purge Yes Grating number of grooves 2400 gr/mm Orders 2 1st order resolution 0.005 nm 2nd order resolution 0.010 nm Table 2: Specification of RF Generator Parameters Specifications Type of generator Solid state Observation Radial Frequency 40.68 MHz Control of gas flowrate By computer Control of pump flow By computer Cooling Air The operating conditions of the spectrometerare listed in Table 3. Table 3: Operating conditions Parameter Condition Generator power 1050 W Plasma gas flowrate 12 L/min Auxiliary gas flowrate 0 L/min Sheath gas flowrate 0.2 L/min Nebulizer 0.5 L/min at 2.82 bars Sample uptake 1 mL/min Type of nebulizer Meinhard C1 type Type of spray chamber Cyclonic Argon humidifier No Injector tube diameter 3.0 mm Below you will find calibration curves of some elements, with standards prepared in 1% HNO3. 5 Calibration L i n e : As, 189.042 nm Calibr. curve: C=-0.0003359+0.00002343*X Parameters of curve Intensity 8548.667 Concentration # Sample Name Intensity Chem. Conc. Calc. Conc. Std0 14.33 0 0 mg/l Yes 2.StdQC210.2 8548.67 0.2 0.20 mg/l 0 Yes Line: P.178.229 nmCalibr. curve: C=-0.01449+0.000009582*X Parameters of curve Intensity Concentration # Sample Name Intensity Chem. Conc. Calc. Conc.R el . de v (% ) V alid Std0 620.67 0 0 mg/l Yes 2. sStd1 106865.00 1.01 mg/l 0.95 Yes Std10 1045020.3 10 10.00 mg/l 0.009 Yes Line: Si. 251.611 nmCalibr. curve: C=-0,01586+0,00001884*X Parameters of curve Intensity Concentrati Chem. Conc. Calc. Conc. Rel. dev(%) Valid # Stdo 331,11 0 0 mg/l Yes Std1 58705.56 1 1,09 mg/l 8,99 Yes Std100 5288927,7 100 99,61 1 mg/1 0.39 Yes 4. Std50 2683830,0 50 50,54 mg/l 1,07 Yes Line: Zn.213.856nm Calibr. curve: C=-0.0007182+0.000002019*X Parameters of curve Concentration Stdo 355.67 0 0 mg/l Yes StdQC210.2 99398.00 0.2 0.20 mg/l 0 Yes 6 Wavelength selection and analytical conditions Table 4: Wavelength and analytical conditions EI Wavelength Measured Calculated Integration Entrance Exit slit Increment Mode of (nm) point points time slit (um) (um) (nm) analysis AI 167.020 5 1 0.5 22 15 0.002 Max AI 396.152 1 1 4.0 22 15 0.002 Max As 189.042 5 1 0.5 22 15 0.002 Max B 249.773 5 1 0.5 22 15 0.002 Max B 182.529 5 1 0.5 22 15 0.002 Max Ba 455.403 5 1 0.5 22 15 0.002 Max Ca 317.933 1 1 3.0 22 80 0.002 Max Cd 228.802 1 1 4.0 22 15 0.002 Max Co 228.616 5 1 0.5 22 15 0.002 Max Cr 267.716 5 1 1.0 22 15 0.002 Max Cu 324.754 5 1 0.5 22 15 0.002 Max Fe 259.940 5 1 0.5 22 15 0.002 Max Hg 194.163 1 1 4.0 22 15 0.002 Max K 766.490 7 5 0.5 22 15 0.002 Gauss Li 670.784 1 5 3.0 22 15 0.002 Max Mg 279.806 1 1 3.0 22 80 0.002 Max Mn 257.610 5 1 0.5 22 15 0.002 Max Mo 202.03 5 0.5 22 15 0.002 Max Na 589.592 1 1 3.0 22 80 0.002 Max Ni 221.647 5 1 0.5 22 15 0.002 Max P 178.229 5 1 0.5 22 15 0.002 Max Pb 220.353 1 1 4.0 22 15 0.002 Max S 180.676 1 1 3.0 22 80 0.002 Max Se 196.026 1 1 4.0 22 15 0.002 Max Si 251.611 1 1 3.0 22 80 0.002 Max Zn 213.856 5 1 1.0 22 15 0.002 Max Five independent analyses were undertaken oneach sample to test the repeatability on trace,minor, and major elements. Each analysis wasmade using 3 replicates. The total analysis time forthe 20 elemental lines was 7 minutes, including 1minute for rinse and sample transfer, using theautosampler. This analysis time can be decreaseddown to 4 minutes if high throughput is required,without causing a large change in the perform-ance. In the Table below, the repeatability for eachelement is presented. The last column corre-sponds to the concentration obtained by the semi-quantitative method. The concentrations areexpressed in mg/L. Table 5.1: Al repeatability AI167.020 Sample Cc RSD(%) Cc S.Q. (mg/L) (mg/L) A 1 0.0327 7.96 A2 0.0352 4.59 A3 0.0330 4.80 A4 0.0338 4.24 A5 0.0345 6.42 SD 0.0010 Mean 0.0338 5.60 0.035 RSD 3.09 Table 5.2: As repeatability Sample Cc RSD(%) Cc S.Q. (mg/L) (mg/L) As 189.042 A1 0.0034 27.57 A2 0.0044 30.64 A3 0.0053 17.65 A4 0.0040 32.38 A5 0.0054 27.24 Mean 0.0043 27.10
确定
还剩8页未读,是否继续阅读?

产品配置单

HORIBA(中国)为您提供《水中Zn元素检测方案(ICP-AES)》,该方案主要用于环境水(除海水)中(类)金属及其化合物检测,参考标准--,《水中Zn元素检测方案(ICP-AES)》用到的仪器有HORIBA Ultima Expert高性能ICP光谱仪
相关方案
更多
该厂商其他方案
更多