


方案详情
文
1964年安德森发明六级生物采样器200-400个孔,被推荐作为空气微生物采集的标准,被认为是最具可操作性,性能可靠的仪器.这篇文章详细描述的他的设计过程,类型,数据分析方法等.
方案详情

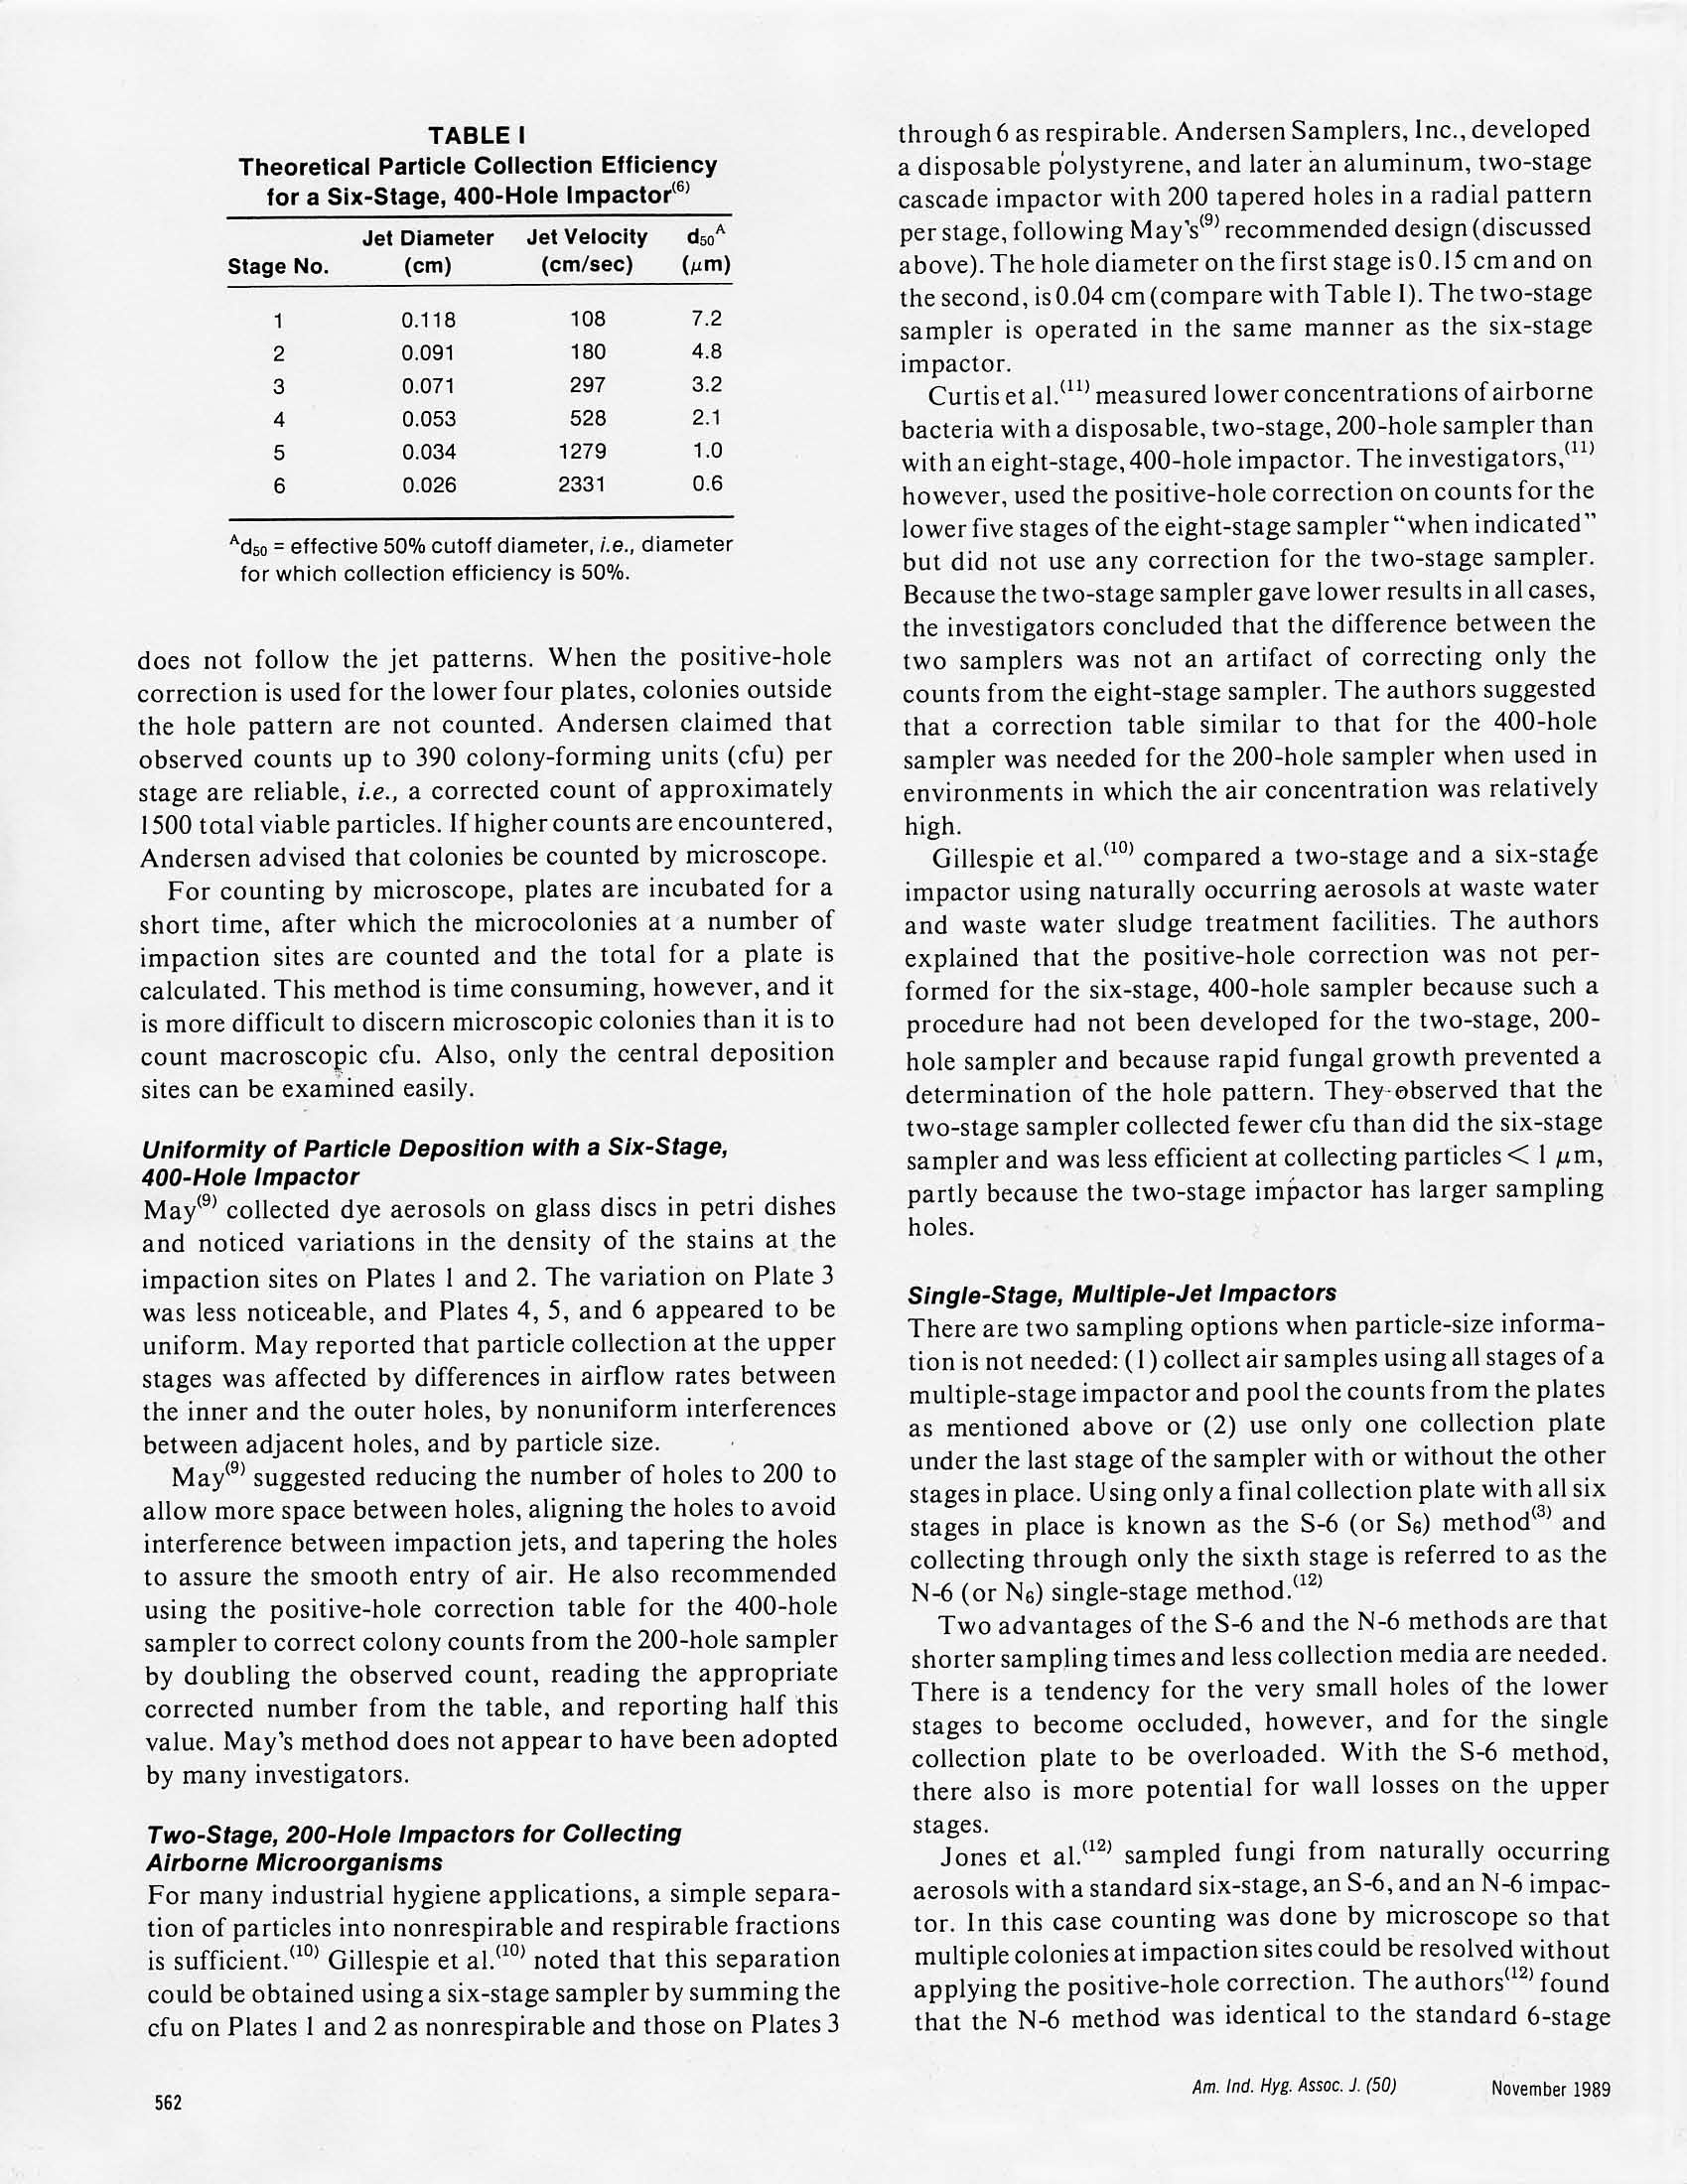
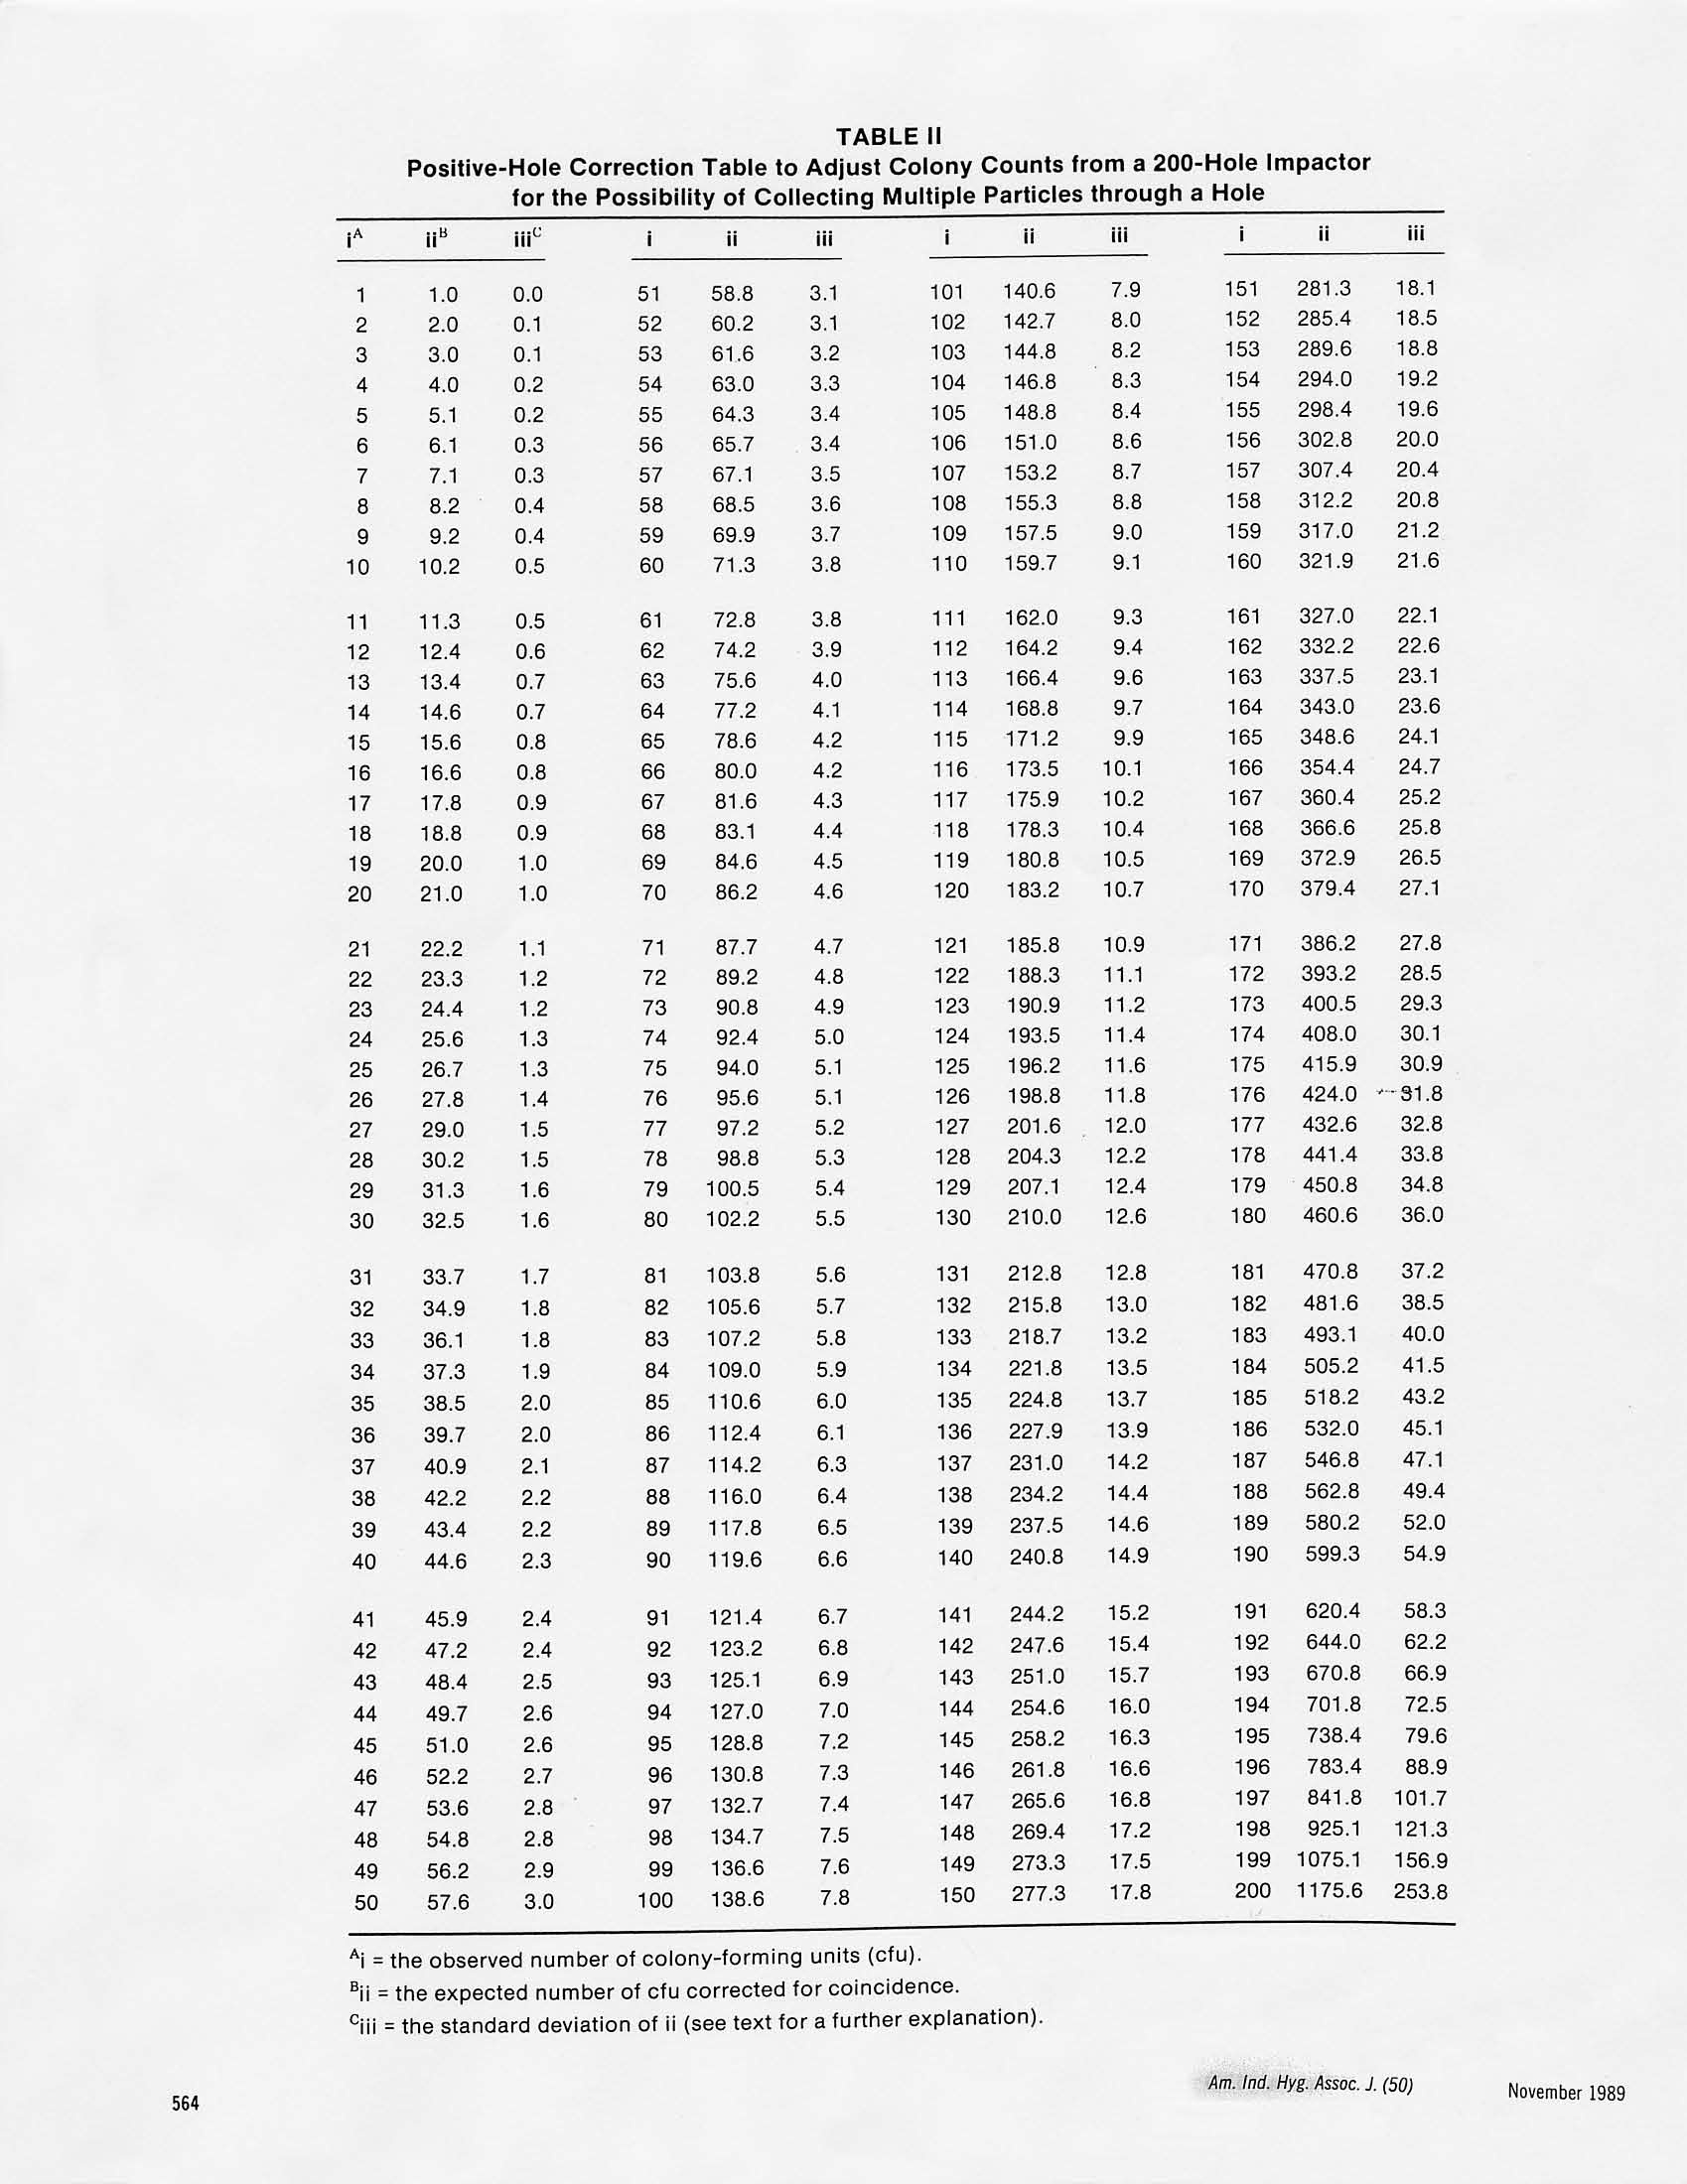
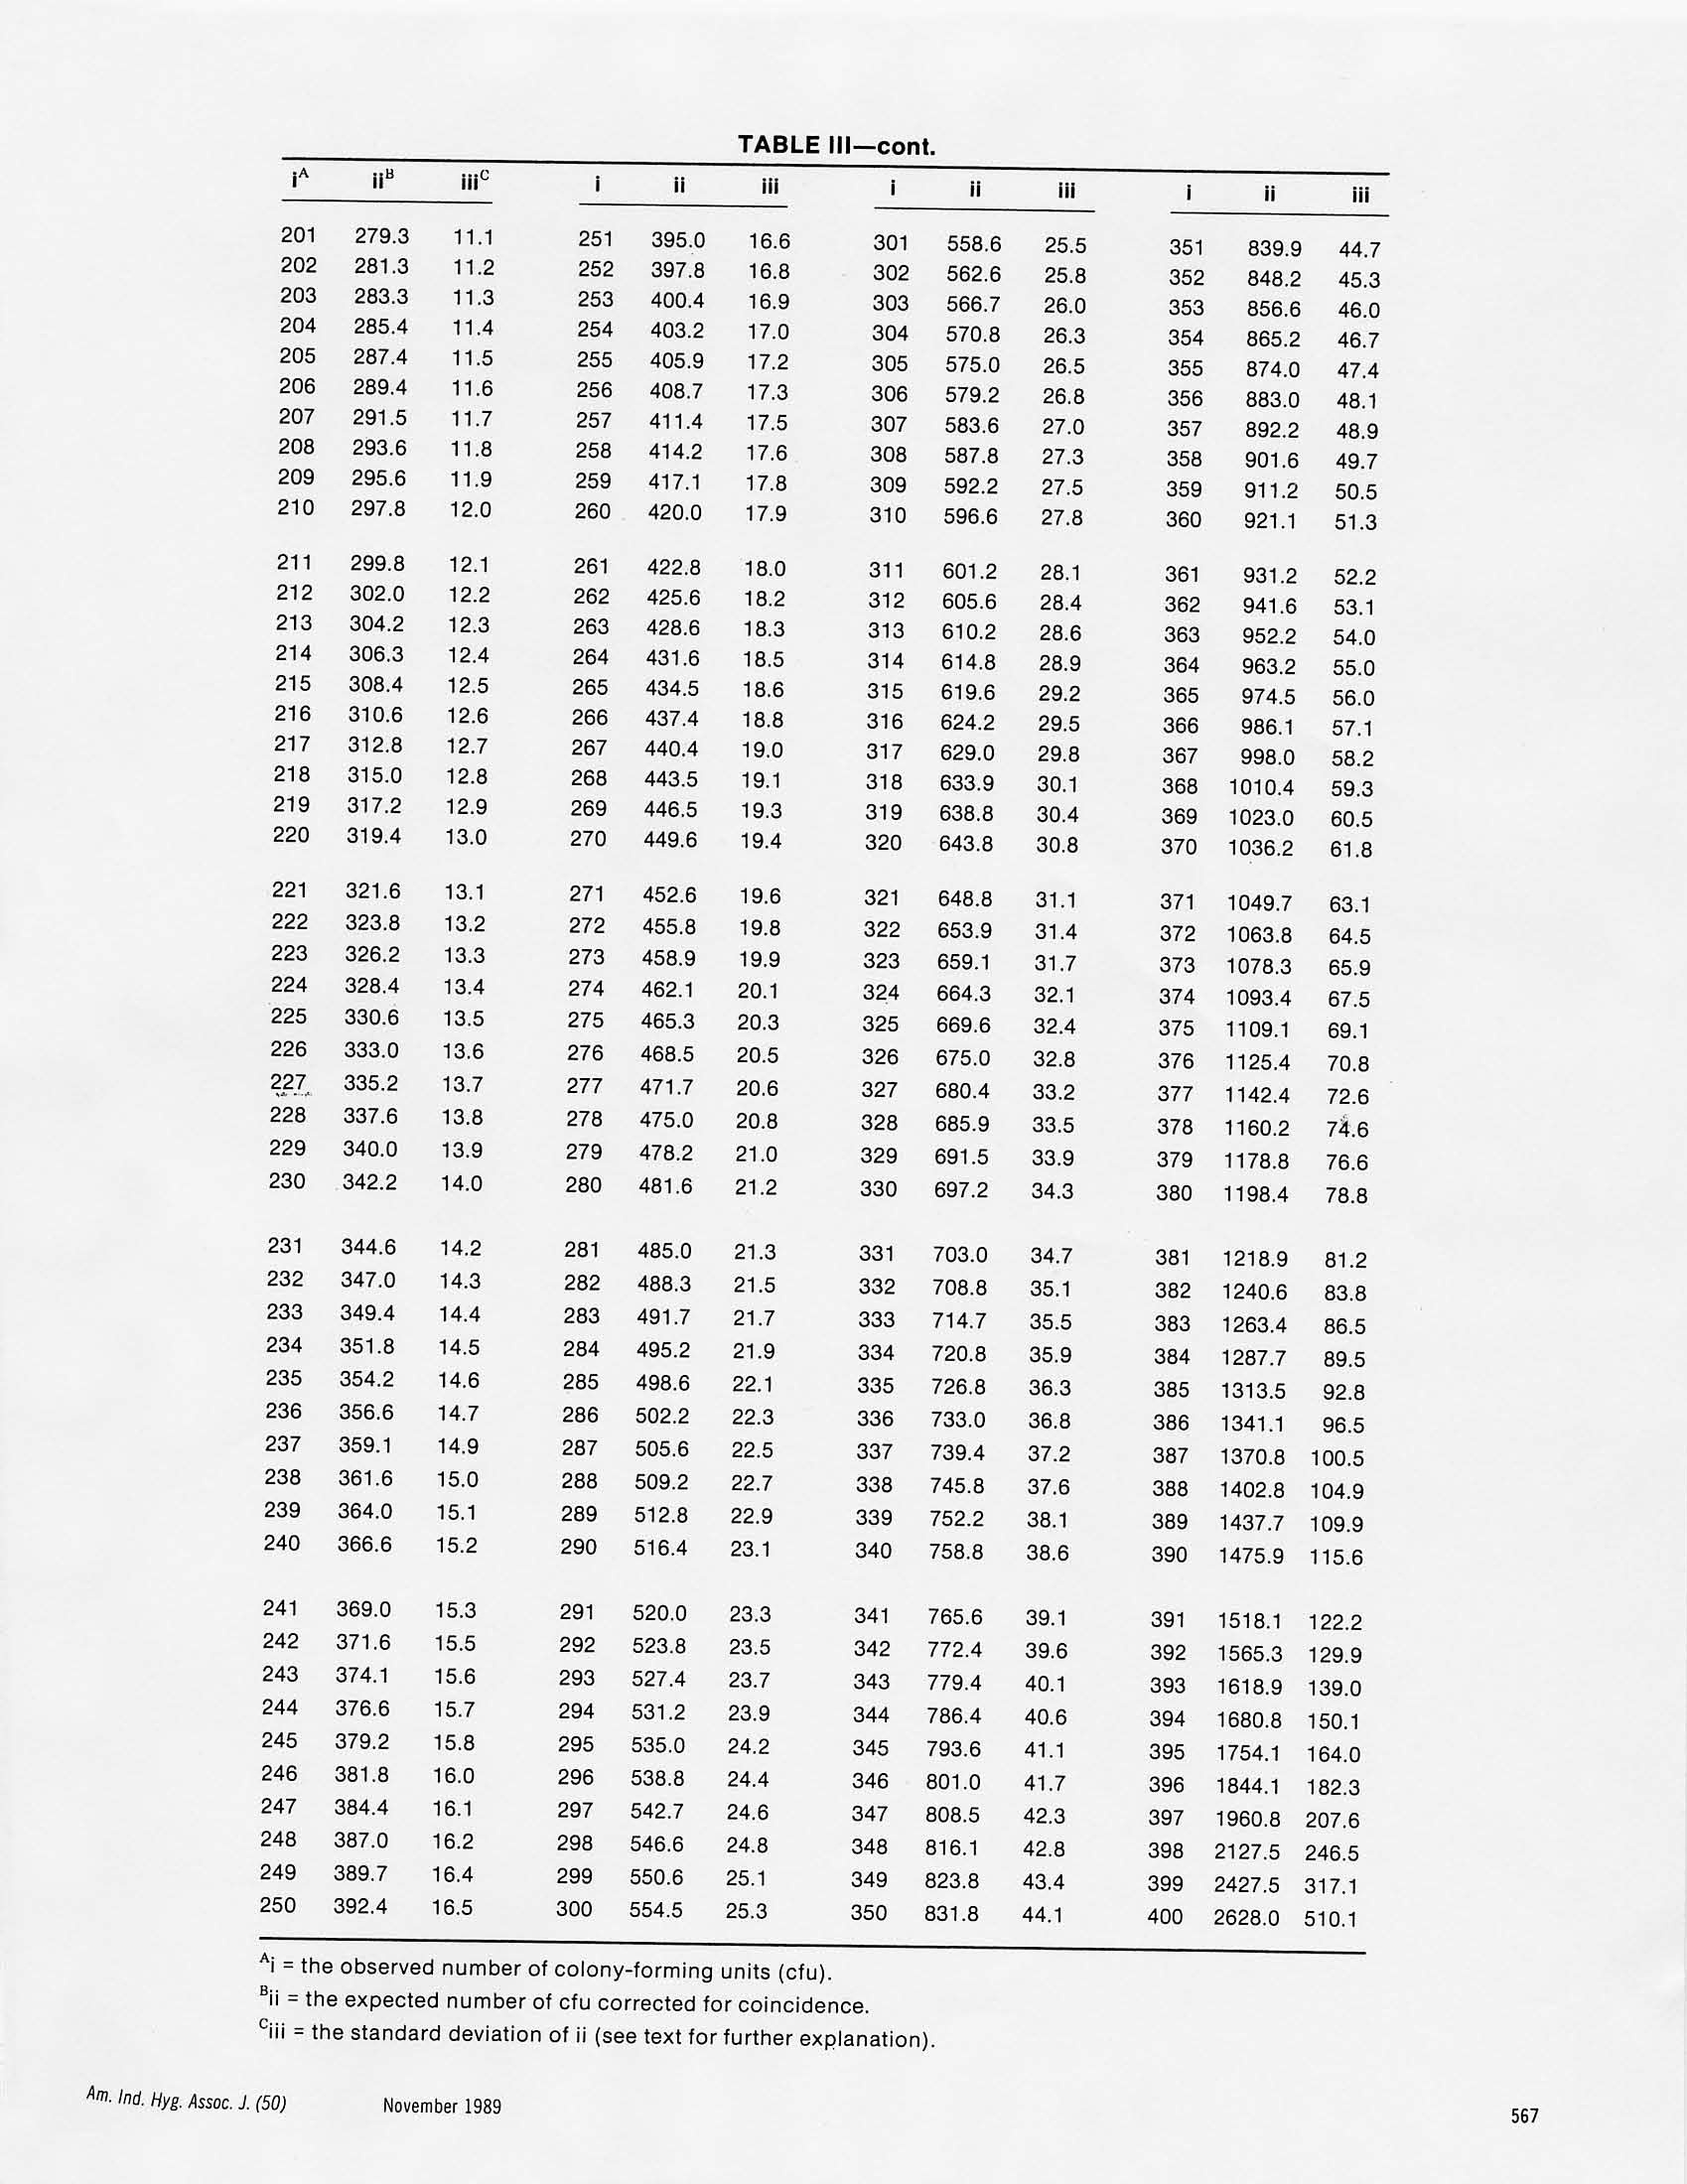
Am. Ind. Hyg. Assoc. J. 50(11):561-568(1989)4085 TABLE III Positive-Hole Correction of Multiple-Jet Impactorsfor Collecting Viable Microorganisms JANET M.MACHER California Indoor Air Quality Program, Air and Industrial Hygiene Laboratory, California Department of Health Services,2151 Berkeley Way, Berkeley, CA 94704 Multiple-jet impactors, typically with 200 or 400 holes, are used widely for collecting aerosols of living bacteria and fungi. In this type ofimpactor, the air jets impinge directly onto nutrient agar in a petri dish which is incubated after sampling until collected cells multiply intocolonies. The observed number of colonies can be adjusted for the probability that more than one viable particle was collected through asampling hole and merged with other microorganisms at an impaction site to produce a single colony.A“positive-hole"correction table hasbeen published for a 400-hole impactor, but none has been produced previously for the 200-hole impactor. The expected number of sampledparticles required to fill each of 1 through 200 and 1 through 400 impaction sites and the standard deviations of these values were calculatedfrom probability theory. The results were compared with a Monte Carlo simulation. By using correction tables (which include the standarddeviation of an expected value) an investigator can report the most probable viable particle count and a 95% confidence interval (mean±2standard deviations). The range of collected particles that could have produced an observed number of colonies increases as the number ofcollected particles increases, and investigators should acknowledge the uncertainty associated with adjusted counts. It is advisable to use animpactor with the greatest practical number of sampling holes because this decreases the likelihood that multiple particles are deposited at theimpaction sites. The assumption that all jets in a single-stage, multiple-jet sampler are equally likely to collect particles was tested experi-mentally with an aerosol of bacterial spores and found to be reasonable. Introduction A six-stage,400-hole impactor" was recommended in 1964as a standard or a reference sampler for collecting airbornemicroorganisms and has been considered the most practi-cal and aerodynamically sound sampler for this type ofwork.() A modified version of the 400-hole impactor isrecommended for measuring human exposure to airbornemicroorganisms in indoor environments.(4.5) The presentdiscussion deals specifically with the impactors of one manu-facturer (Andersen Samplers, Inc., Atlanta,Ga.), althoughthe information also applies to similar multiple-jet impactors. During sampler operation, a vacuum pump is used todraw air at a rate of 28 L/min through the 400 holes of the1mpactor. The 400 air jets impinge on nutrient agar in 10-cmdiameter petri dishes, or plates, which are positionedbeneath the six stages. Particles that escape impaction on thefirst plate proceed with the airstream to the next stage. Thediameter of the exhaust section of each stage is slightly largerthan a plate, allowing the airstream to flow around the plateto the next stage. On each stage,the 400 holes are arranged inlI concentric rings. The number of holes per ring, movingIrom the center to the outer edge, is 10, 15, 20, 26,31,37,42,48,53,58,and 60. All holes on a stage are the same diameter,but the size of the holes decreases progressively from Stage 1to Stage 6, resulting in the separation of particles into sixaerodynamic size fractions() (Table1). oobtain a size distribution of viable particles, a sampleris loaded with six glass petri dishes,each containing 27 mL ofsterile nutrient agar suitable for the organism(s) to be col-lected. In some cases it is more convenient to use disposableDlastic petri dishes; in which case, they are filled with 45 mL of medium in order to maintain the correct distance betweenthe impactor stage and the collecting surface. See Andersen,Cipriano, and Furuhashi and Miyamae(6) for further dis-cussions of the effects of changing the jet-to-plate distanceand Andersen"and Cipriano"on the use of plastic dishes.After sampling, the plates are removed, covered immediately,and incubated for a time and at a temperature suitable forthe organisms collected. A bacterial or fungal colony formsat each impaction site where one or more particles weredeposited. Only particles containing at least one viablemicroorganism can be detected. The manufacturer also produces one-,two-,and six-stagesamplers specifically designed for use with commercially-prepared plastic petri plates. Any number and combinationof stages can be used (see below). Positive-Hole Correction Andersen"provided a positive-hole correction or conver-sion table for use with the 400-hole impactor. The table wasbased on the principle that as the number of viable particlesimpinging on a plate increased, the probability of particlesentering unoccupied holes decreased. The values in the tablewere calculated from the following formula: where Pr is the expected number of viable particles requiredto produce r positive holes, and N is the total number ofholes per stage. Andersen" stated that the positive-hole correction is notneeded for Plates l and 2 because the deposition of particles Theoretical Particle Collection Efficiencyfor a Six-Stage, 400-Hole Impactor Jet Diameter Jet Velocity dso^ Stage No. (cm) (cm/sec) (um) 1 0.118 108 7.2 2 0.091 180 4.8 3 0.071 297 3.2 4 0.053 528 5 0.034 1279 6 0.026 2331 0.6 dso=effective 50% cutoff diameter, i.e., diameterfor which collection efficiency is 50%. does not follow the jet patterns. When the positive-holecorrection is used for the lower four plates, colonies outsidethe hole pattern are not counted. Andersen claimed thatobserved counts up to 390 colony-forming units (cfu) perstage are reliable,i.e., a corrected count of approximately1500 total via ble particles. If higher counts are encountered,Andersen advised that colonies be counted by microscope. For counting by microscope, plates are incubated for ashort time, after which the microcolonies at a number ofimpaction sites are counted and the total for a plate iscalculated. This method is time consuming,however,and itis more difficult to discern microscopic colonies than it is tocount macroscopic cfu. Also, only the central depositionsites can be examined easily. Uniformity of Particle Deposition with a Six-Stage,400-Hole Impactor Maycollected dye aerosols on glass discs in petri dishesand noticed variations in the density of the stains at theimpaction sites on Plates l and 2. The variation on Plate 3was less noticeable, and Plates 4, 5, and 6 appeared to beuniform. May reported that particle collection at the upperstages was affected by differences in airflow rates betweenthe inner and the outer holes, by nonuniform interferencesbetween adjacent holes, and by particle size. May suggested reducing the number of holes to 200 toallow more space between holes, aligning the holes to avoidinterference between impaction jets, and tapering the holesto assure the smooth entry of air. He also recommendedusing the positive-hole correction table for the 400-holesampler to correct colony counts from the 200-hole samplerby doubling the observed count, reading the appropriatecorrected number from the table, and reporting half thisvalue. May’s method does not appear to have been adoptedby many investigators. Two-Stage, 200-Hole Impactors for CollectingAirborne Microorganisms For many industrial hygiene applications, a simple separa-tion of particles into nonrespirable and respirable fractionsis sufficient.( Gillespie et al. noted that this separationcould be obtained using a six-stage sampler by summing thecfu on Plates l and2 as nonrespirable and those on Plates 3 through6 as respirable. Andersen Samplers,Inc.,developeda disposable polystyrene, and later an aluminum, two-stagecascade impactor with 200 tapered holes in a radial patternper stage, following May’srecommended design (discussedabove).The hole diameter on the first stage is 0.15 cmand onthe second, is 0.04 cm (compare with Table I).The two-stagesampler is operated in the same manner as the six-stageimpactor. Curtiset al.(11) measured lower concentrations of airbornebacteria with a disposable, two-stage,200-hole sampler thanwith an eight-stage,400-hole impactor.The investigators,however, used the positive-hole correction on counts for thelower five stages of the eight-stage sampler“when indicatedbut did not use any correction for the two-stage sampler.Because the two-stage sampler gave lower results in all cases,the investigators concluded that the difference between thetwo samplers was not an artifact of correcting only thecounts from the eight-stage sampler. The authors suggestedthat a correction table similar to that for the 400-holesampler was needed for the 200-hole sampler when used inenvironments in which the air concentration was relativelyhigh. Gillespie et al.(10) compared a two-stage and a six-stageimpactor using naturally occurring aerosols at waste waterand waste water sludge treatment facilities. The authorsexplained that the positive-hole correction was not per-formed for the six-stage, 400-hole sampler because such aprocedure had not been developed for the two-stage, 200-hole sampler and because rapid fungal growth prevented adetermination of the hole pattern. They-observed that thetwo-stage sampler collected fewer cfu than did the six-stagesampler and was less efficient at collecting particles<1 um,partly because the two-stage impactor has larger samplingholes. Single-Stage, Multiple-Jet Impactors There are two sampling options when particle-size informa-tion is not needed:(1) collect air samples using all stages of amultiple-stage impactor and pool the counts from the platesas mentioned above or (2) use only one collection plateunder the last stage of the sampler with or without the otherstages in place. Using only a final collection plate with all sixstages in place is known as the S-6 (or Se) method andcollecting through only the sixth stage is referred to as theN-6(or Na) single-stage method. 12 Two advantages of the S-6 and the N-6 methods are thatshorter sampling times and less collection media are needed.There is a tendency for the very small holes of the lowerstages to become occluded, however, and for the singlecollection plate to be overloaded. With the S-6 method,there also is more potential for wall losses on the upperstages. Jones et a1.(12) sampled fungi from naturally occurringaerosols with a standard six-stage, an S-6,and an N-6 impac-tor. In this case counting was done by microscope so thatmultiple colonies at impaction sites could be resolved withoutapplying the positive-hole correction. The authors 2foundthat the N-6 method was identical to the standard 6-stage sampler, but therS-6 method recovered, on average,approx-imately half as many viable particles as the standardsix-stage impactor. Comparisons of Multiple-Jet Impactors and OtherAir Samplers Furuhashi and Miyamae compared a six-stage impactorand a slit-to-agar sampler, using a laboratory-generatedaerosol of Serratia marcescens (a rod-shaped bacterium,approximately 0.5 umx0.5 tol um). The authorused thepositive-hole correction for the 400-hole impactor whendetermining the number of collected bacteria. They observedthat when the air concentration was above 1400 cfu/m, thesix-stage sampler collected significantly fewer cfu than didthe slit sampler. The authors considered several possibleexplanations for the higher slit sampler counts, for example,the shattering of particles in the slit sampler and losses on thewalls of the six-stage sampler. They concluded that thenumber of multiple viable particles forming single coloniesin the impactor sampler was greater than the numberobtained from the positive-hole correction table. Zimmerman et al.3) compared a two-stage, 200-holeimpactor with a three-stage impinger using a simulatedwaste water irrigation spray of Escherichia coli (a rod-shaped bacterium,approximately 1 x3 um), aerosolized aspredominantly single-cell droplets. The authors(3) notedthat the disagreement between the impinger and the impac-tor measurements was greater when they observed morethan 120 cfu on the impactor samples. Although they did notapply a positive-hole correction, Zimmerman et al.(13) dis-cussed such adjustment, stating that it is based on probabil-ity statistics with little or no experimental evidence to sup-port it. The above discussions demonstrate that researchers havenot applied positive-hole corrections uniformly to theirdata. Although May suggested a reasonable method toadapt the 400-hole correction table for a 200-hole impactor,other investigators do not appear to know of this procedure.Even when investigators use the original correction table,they report corrected counts without any consideration ofthe range of numbers of collected particles that could haveproduced the observed number of cfu. The use of the mostprobable value alone confers a false precision to an adjustedmeasurement. I hese deficiencies were addressed in the study reportedhere by calculating from probability theory:(1) the expectednumber of collected viable particles that would produce lthrough 200 and I through 400 observed cfu and (2) thestandard deviations of these values. The results were com-pared with a Monte Carlo simulation in which repeatedestimations of the values were made, from which averagesand standard deviations were determined. The assumption that all jets in a multiple-jet sampler areequally likely to collect particles was evaluated by collectingbacterial spores and recording where colonies developed onsampled plates. The 400-hole, N-6 impactor was chosen forevaluation because this sampler is one of the most widelyreecommended and used instruments for studying exposureto airborne microorganis,(9)1ms(4.5) and because May already had demonstrated the uniformity of particle deposition forthe 200-hole sampler. Experimental Materials and Methods Calculation of Correction Tables Correction tables for 200-and 400-hole impactors were cal-culated from the following formulas:14) and where N is the total number of holes,n, is the average number ofparticles that must be collected to fill k holes, E(n,) is theexpected value ofn, and var(n ) is the variance of n. Ny, inEquation 2 is equivalent to Pr in Equation 1. For the hypothetical sampler described above, it wasassumed that the collection of particles stopped at theinstant a particle entered the kth hole. In reality, collectionstops at random, and the expected number of particles col-lected ifk holes were filled would be equal to or greater thann, but less than ne+j.Therefore, theaverage,(n,+n+1-1)/2,is reported here. The calculation was compared with a Monte Carlo simu-lation of the collection of airborne particles in a multiple-hole sampler. Particles were assumed dropped at randominto N holes until k were occupied. A hole was consideredoccupied after one or more particles had entered that cell.The desired number of holes to be filled was designated X.The program took N as a parameter and performed 1000iterations, indexed by i. On each iteration, the programsimulated dropping balls at random into the holes until kwere occupied fork=1,...,N. The empirical mean of Xoveri=1,...,1000 was used to estimate the expected value, andthe standard deviation of these 1000 counts was used toestimate the standard error. If particle collection among thesampling holes was unequal (see below), the Monte Carlosimulation could have been weighted to account for thesedifferences, and a correction table would have been pro-duced that reflected the nonuniform particle collection. Uniformity of Particle Collection Although there did not appear to be any reason to doubt thatparticle collection was equal for all holes within each con-centric ring of holes on an impactor stage, the possibility ofdifferences between the rings needed to be checked for thesingle-stage,400-hole sampler. The assumption of uniform particle collection was testedby collecting aerosols of Bacillus subtilis spores (approxi-mately 0.5x1.0 um) and comparing the average number ofcolonies collected in each of the 11 rings of impaction sites.The concentration of the test suspension was adjusted toproduce predominantly single-spore droplets from a collison TABLE IIPositive-Hole Correction Table to Adjust Colony Counts from a 200-Hole Impactor for the Possibility of Collecting Multiple Particles through a Hole i^ ii ii i ii iii i ii iii i ii ii 1 1.0 0.0 51 58.8 3.1 101 140.6 7.9 151 281.3 18.1 2 2.0 0.1 52 60.2 3.1 102 142.7 8.0 152 285.4 18.5 3 3.0 0.1 53 61.6 3.2 103 144.8 8.2 153 289.6 18.8 4 4.0 0.2 54 63.0 3.3 104 146.8 8.3 154 294.0 19.2 5 5.1 0.2 55 64.3 3.4 105 148.8 8.4 155 298.4 19.6 6 6.1 0.3 56 65.7 3.4 106 151.0 8.6 156 302.8 20.0 7 7.1 0.3 57 67.1 3.5 107 153.2 8.7 157 307.4 20.4 8 8.2 0.4 58 68.5 3.6 108 155.3 8.8 158 312.2 20.8 9 9.2 0.4 59 69.9 3.7 109 157.5 9.0 159 317.0 21.2 10 10.2 0.5 60 71.3 3.8 110 159.7 9.1 160 321.9 21.6 11 11.3 0.5 61 72.8 3.8 111 162.0 9.3 161 327.0 22.1 12 12.4 0.6 62 74.2 3.9 112 164.2 9.4 162 332.2 22.6 13 13.4 0.7 63 75.6 4.0 113 166.4 9.6 163 337.5 23.1 14 14.6 0.7 64 77.2 4.1 114 168.8 9.7 164 343.0 23.6 15 15.6 0.8 65 78.6 4.2 115 171.2 9.9 165 348.6 24.1 16 16.6 0.8 66 80.0 4.2 116 173.5 10.1 166 354.4 24.7 17 17.8 0.9 67 81.6 4.3 117 175.9 10.2 167 360.4 25.2 18 18.8 0.9 68 83.1 4.4 118 178.3 10.4 168 366.6 25.8 19 20.0 1.0 69 84.6 4.5 119 180.8 10.5 169 372.9 26.5 20 21.0 1.0 70 86.2 4.6 120 183.2 10.7 170 379.4 27.1 21 22.2 1.1 71 Aj= the observed number of colony-forming units (cfu). Bji=the expected number of cfu corrected for coincidence. C= the standard deviation of ii (see text for a further explanation). nebulizer (BGl, Inc., Waltham, Mass.).(15) The averages andthe variances of the number of cfu in each ring for 13 sampleswere compared using one-way analysis of variance. Results The results of the exact calculations of particle coincidence(using Equation2) are displayed in Table Il for the case ofa200-hole sampler and in Table IlI for the case ofa 400-hole20sampler. The values in Table II agree with May’s methodof using half the corrected value from the 400-hole table fortwice the observed 200-hole sampler colony count. Forexample, the expected value for an observed colony count of130 cfu collected with a 200-hole impactor is 210 cfu (TableIl). This value could bederived from Table Ill by looking upthe corrected value for 260 cfu (i.e.,2×130) and dividing thenumber in column ii by two (i.e., 420/2=210). The MonteCarlo simulation agreed very well with the exact calculationand is not presented here. ln the test of equal particle collection among the 11 ringsof holes in the 400-hole impactor, the average numbers of cfufor rings 2,3,7,8,and 10 were slightly higher than the overallaverage, while for rings 4,5, 6,9, and 11, the counts wereslightly lower than the overall average (Table IV). A test ofequal variance, however, found no significant difference (Pvalue=0.9766), and a test of equal means also showed nodifference (p value=0.9998). Discussion By using a correction table that includes an expected valueand a standard deviation, an investigator can report theaverage corrected value along with a 95% confidence inter-val (mean ± 2 standard deviations). For example, whenbacterial or fungal colonies are observed at 50 of 200 impac-tion sites, an average of 58 viable particles would have beencollected. The 95% confidence interval, however, would be52 to 64. Ifcolonies were present at all 200 impaction sites, anaverage of 1176 viable particles would have been collected,and the interval from 668 to 1683 viable particles would havea 95% probability of containing the true value. Of course inactual use, a sample would be discarded as overloaded ifcolonies grew at every impaction site. Tables Il and III demonstrate that as the number of filledholes increases, the standard deviation also increases. For thecase of the 200-holesampler, the standard deviation is only5.2% of the mean when 50 holes are occupied, but thecoefficient of variation(CV)increases to 21.6% when all 200holes are occupied. For the case ofthe 400-hole sampler,when 50 holes are occupied, the CV is 3.5%; when 200 holesare occupied, the CV is 4.0%; and when all 400 holes areoccupied, the CV is 19.4%. This suggests that there is anadvantage to using an impactor with 400 holes rather thanOne with 200 holes because the more sampling holes that areavailable to particles, the less likely it is that multiple parti-cles will be collected at the same impaction site. For exam-ple, 400 viable particles collected with a 200-hole impactorwould result in, on average, 173 cfu, i.e., an average of 2.3particles per impaction site. This same number of viable particles collected with a 400-hole sampler would result in,on average, 253 cfu, i.e., an average of 1.6 particles perimpaction site. Collecting viable particles singly increasesthe likelihood that all of the bacteria or fungi in a colony arethe same, which decreases the chance that one species ofmicroorganism overgrows others in a colony and maskstheir presence. The test of the uniformity of colony distribution on asingle-stage, 400-hole impactor agreed with what Mayfound, i.e., that there is little variation in particle depositionacross a plate when the jet velocity is above 500 cm/sec.Therefore, interference between holes in the single-stage,400-hole impactor does not appear to be a problem. Colonycounting, however, would be facilitated greatly if the 400holes were arranged in a rectangular grid rather than in(9)concentric rings, as May also suggested. When comparing concentrations of airborne bacteria orfungi, it is best to collect more than one sample at eachlocation or under each set of environmental conditions to becompared. The corrected counts are read from the appro-priate table and converted to concentration measurements bydividing by the sampled air volume. The standard deviationslikewise are converted to concentration measurements. Themeans of two sets of measurements can be compared usingat-test: and a pooled standard deviation (Sp): where Furuhashi and Miyamae noted that the positive-holecorrection appeared to underestimate the actual number ofcollected particles at the upper limit of the sampler’s capac-ity. The accuracy of Tables II and lII needs to be verified,perhaps by counting the number of microcolonies collectedat impaction sites and comparing the totals with the theoret-ical corrected counts. The difficulty that colony formation presents in quantify-ing the number of particles collected with an impactor isunique to the sampling of viable microorganisms. A multiple-jet impactor could be used to collect viable bacteria andfungi without correcting the observed colony counts forcoincidence if investigators used sufficiently short samplingtimes so that the colony counts always were below thenumber at which correction for multiple hits became neces-sary. Using more than one stage also would reduce thenumber of cfu on each plate if the particle-size distributionof the sampled aerosol was sufficiently broad. A third alter-native would be to count microscopic colonies before theymerged to form single macroscopic cfu at the impactionsites. These practices, however, would limit severely theusefulness of multiple-jet impactors. Therefore, it is more Positive-Hole Correction Table to Adjust Colony Counts from a 400-Hole Impactorfor the Possibility of Collecting Multiple Particles through a Hole i^ ii 邢 i ii iii i ii iii i ii iii 1 1.0 0.0 51 54.6 2.0 101 116.4 4.3 151 189.6 7.2 2 2.0 0.1 52 55.7 2.0 102 117.8 4.4 152 191.2 7.3 3 3.0 0.1 53 56.8 2.0 103 119.1 4.4 153 192.8 7.4 4 4.0 0.1 54 58.0 2.1 104 120.4 4.5 154 194.4 7.4 5 5.0 0.2 55 59.2 2.1 105 121.8 4.5 155 196.1 7.5 6 6.0 0.2 56 60.3 2.2 106 123.2 4.6 156 197.7 7.6 7 7.1 0.2 57 61.5 2.2 107 124.5 4.6 157 199.4 7.7 8 8.1 0.3 58 62.6 2.3 108 125.9 4.7 158 201.0 7.7 9 9.1 0.3 59 63.8 2.3 109 127.2 4.7 159 202.6 7.8 10 10.1 0.3 60 65.0 2.3 110 128.6 4.8 160 204.4 7.9 11 11.1 0.4 61 66.2 2.4 111 130.0 4.8 161 206.0 7.9 12 12.2 0.4 62 67.4 2.4 112 131.4 4.9 162 207.6 8.0 13 13.2 0.5 63 68.6 2.5 113 132.8 4.9 163 209.4 8.1 14 14.2 0.5 64 69.7 2.5 114 134.2 5.0 164 211.0 8.1 15 15.3 0.5 65 70.9 2.6 115 135.6 5.1 165 212.8 8.2 16 16.3 0.6 66 72.1 2.6 116 137.0 5.1 166 214.4 8.3 17 17.4 0.6 67 73.3 2.7 117 138.4 5.2 167 216.2 8.4 18 18.4 0.6 68 74.5 2.7 118 139.8 5.2 168 217.9 8.4 19 19.4 0.7 69 75.7 2.7 119 141.2 5.3 169 219.6 8.5 20 20.5 0.7 70 77.0 2.8 120 142.7 5.3 170 221.4 8.6 21 21.6 0.8 71 i^ ii iiiC ii iii i ii iii i ii iii 201 279.3 11.1 251 395.0 16.6 301 558.6 25.5 351 839.9 44.7 202 281.3 11.2 252 397.8 16.8 302 562.6 25.8 352 848.2 45.3 203 283.3 11.3 253 400.4 16.9 303 566.7 26.0 353 856.6 46.0 204 285.4 11.4 254 403.2 17.0 304 570.8 26.3 354 865.2 46.7 205 287.4 11.5 255 405.9 17.2 305 575.0 26.5 355 874.0 47.4 206 289.4 11.6 256 408.7 17.3 306 579.2 26.8 356 883.0 48.1 207 291.5 11.7 257 411.4 17.5 307 583.6 27.0 357 892.2 48.9 208 293.6 11.8 258 414.2 17.6 308 587.8 27.3 358 901.6 49.7 209 295.6 11.9 259 417.1 17.8 309 592.2 27.5 359 911.2 50.5 210 297.8 12.0 260 2420.0 17.9 310 596.6 27.8 360 921.1 51.3 211 299.8 12.1 261 422.8 18.0 311 601.2 28.1 361 931.2 52.2 212 302.0 12.2 262 425.6 18.2 312 605.6 28.4 362 941.6 53.1 213 304.2 12.3 263 428.6 18.3 313 610.2 28.6 363 952.2 54.0 214 306.3 12.4 264 431.6 18.5 314 614.8 28.9 364 963.2 55.0 215 308.4 12.5 265 434.5 18.6 315 619.6 29.2 365 974.5 56.0 216 310.6 12.6 266 437.4 18.8 316 624.2 29.5 366 986.1 57.1 217 312.8 12.7 267 440.4 19.0 317 629.0 29.8 367 998.0 58.2 218 315.0 12.8 268 443.5 19.1 318 633.9 30.1 368 1010.4 59.3 219 317.2 12.9 269 446.5 19.3 319 638.8 30.4 369 1023.0 60.5 220 319.4 13.0 270 449.6 19.4 320 643.8 30.8 370 1036.2 61.8 221 321.6 13.1 271 i=the observed number of colony-forming units (cfu). ii=the expected number of cfu corrected for coincidence. iii= the standard deviation of ii (see text for further explanation). TABLE IV Demonstration of Uniform Particle Collectionfor a Single-Stage, 400-Hole Impactor Impactor Ring Number of Mean Number Standard Number^ Holes/Ring of cfu/Ring Deviation 1 0.346 0.2537 2 0.354 0.2040 3 0.365 0.2004 4 0.310 0.2473 5 0.341 0.2108 6 0.337 0.2422 7 0.366 0.2317 8 0.364 0.2206 9 0.331 0.2072 10 0.368 0.2419 11 0.320 0.1949 Overall 400 0.346 0.2168 ARing 1 is at the center of the impactorstage,and Ring11is at the outer edge. convenient to adjust sampling data using a positive-holecorrection table, and it is preferable to use a table thatincludes an estimate of the standard deviations associatedwith the expected values. Acknowledgment The assistance of F.Y. Huang, K.S. Liu, and S. Twiss forhelp with the data analysis; of K. Earls and I. Gushin for helpin the laboratory; of D. Freedman for calculating the tablesand for writing the computer simulation; and of S. Haywardand W. John for reviewing the manuscript is acknowledgedgratefully. References 1.Andersen, A.: Andersen Sampler for the Collection, Sizingand Evaluation of Viable Airborne Particles. J. Bacteriol. 76:471-484 (1958). 2.Brachman, P.S., R. Ehrlich,H.F. Eichenwald, V.J. Cabeli,T.W. Kethley, S.H. Madin, J.R. Maltman, G. Middlebrook,J.D. Morton,I.H. Silver, and E.K. Wolfe: Standard Samplerfor Assay of Airborne Microorganisms. Science. 144:1295(1982). 3.Solomon, W.R. and J.A. Gilliam: A Simplified Application ofthe Andersen Sampler to the Study of Airborne FungusParticles. J. Allergy. 45:1-13 (1970). 4.Morey, P.,J. Otten, H. Burge, M. Chatigny, J. Feeley, F.M.LaForce, and K. Peterson: Bioaersols. Airborne ViableMicroorganisms in Office Environments: Sampling Pro-tocol and Analytical Procedures. Appl. Ind. Hyg. 1:R-19-R-23 (1986). 5.Burge,H.A., M. Chatigny, J. Feeley, K. Kreiss, P. Morey,J.Otten,and K. Peterson:Bioaerosols. Guidelines for Assess-ment and Sampling of Saprophytic Bioaerosols in theIndoor Environment. Appl. Ind.Hyg.2:R-10-R-16(1987). 6.Furuhashi,M. and T. Miyamae: Evaluation of the Commer-cial Bacterial Air Samplers by the New Bacterial AerosolGenerator. Bull. Tokyo Med. Dent.Univ. 28:7-21(1981). 7. (Cipriano, R.:“Bubble and Aerosol Spectra Produced by aLaboratory Simulation of a Breaking Wave." Ph.D. Diss.State University of New York at Albany, New York,1979.pp.197-258. 8. Feller, W.: An Introduction to Probability Theory and ItsApplications. Vol.1.3d ed. New York: John Wileyand Sons,1968. pp. 224-225. 9.May, K.R.: Calibration of a Modified Andersen BacterialAerosol Sampler. Appl. Microbiol. 12:37-43 (1964). 10.Gillespie,V.L., C.S. Clark, H.S.Bjornson, S.J.Samuels,andJ.W. Holland: A Comparison of Two-Stage and Six-StageAndersen Impactors for Viable Aerosols. Am. Ind. HygAssoc. J. 42:858-864 (1981). 11.(Curtis,S.E.,R.K.Balsbaugh,and J.G.Drummond: Compari-son of Andersen Eight-Stage and Two-Stage Viable AirSamplers. Appl. Environ. Microbiol. 35:208-209 (1978). 12.Jones, W., K. Morring,P. Morey,and W. Sorenson:Evalua-tion of the Andersen Viable Impactor for Single-StageSampling. Am. Ind. Hyg. Assoc. J. 46:294-298 (1985). 13.Zimmerman,N.J., P.C.Reist, and A.G. Turner: Comparisonof Two Biological Aerosol Sampling Methods. Appl. Environ.Microbiol. 53(1):99-104(1987). 14. Kolchin,V.F.,B.A. Sevastyanov, and V.P. Chistyakov: Ran-dom Allocations. Washington, D.C.: V.H. Winston andSons, 1978. p.11. 15. May, K.R.: The Collison Nebulizer: Description, Perfor-mance and Application. Aeroso/ Sci. 4:235-243 (1973).31 October 1988; Revised 20 April 1989 Copyright American Industrial Hygiene AssociationAm. Ind. Hyg. Assoc. J.( November Am. Ind. Hyg. Assoc. J. (November
确定


还剩6页未读,是否继续阅读?

产品配置单

北京赛克玛环保仪器有限公司为您提供《六级生物采样器中设计过程,类型,数据分析方法检测方案 》,该方案主要用于其他中设计过程,类型,数据分析方法检测,参考标准--,《六级生物采样器中设计过程,类型,数据分析方法检测方案 》用到的仪器有TISCH TE-10-800型 安德森六级微生物撞击采样器
相关方案
更多