


采用LaVision以增强型CCD相机为核心器件构成的PLIF测试系统,根据双线原子激光诱导荧光原理,测量分析发动机内部的准瞬态二维温度场。
方案详情

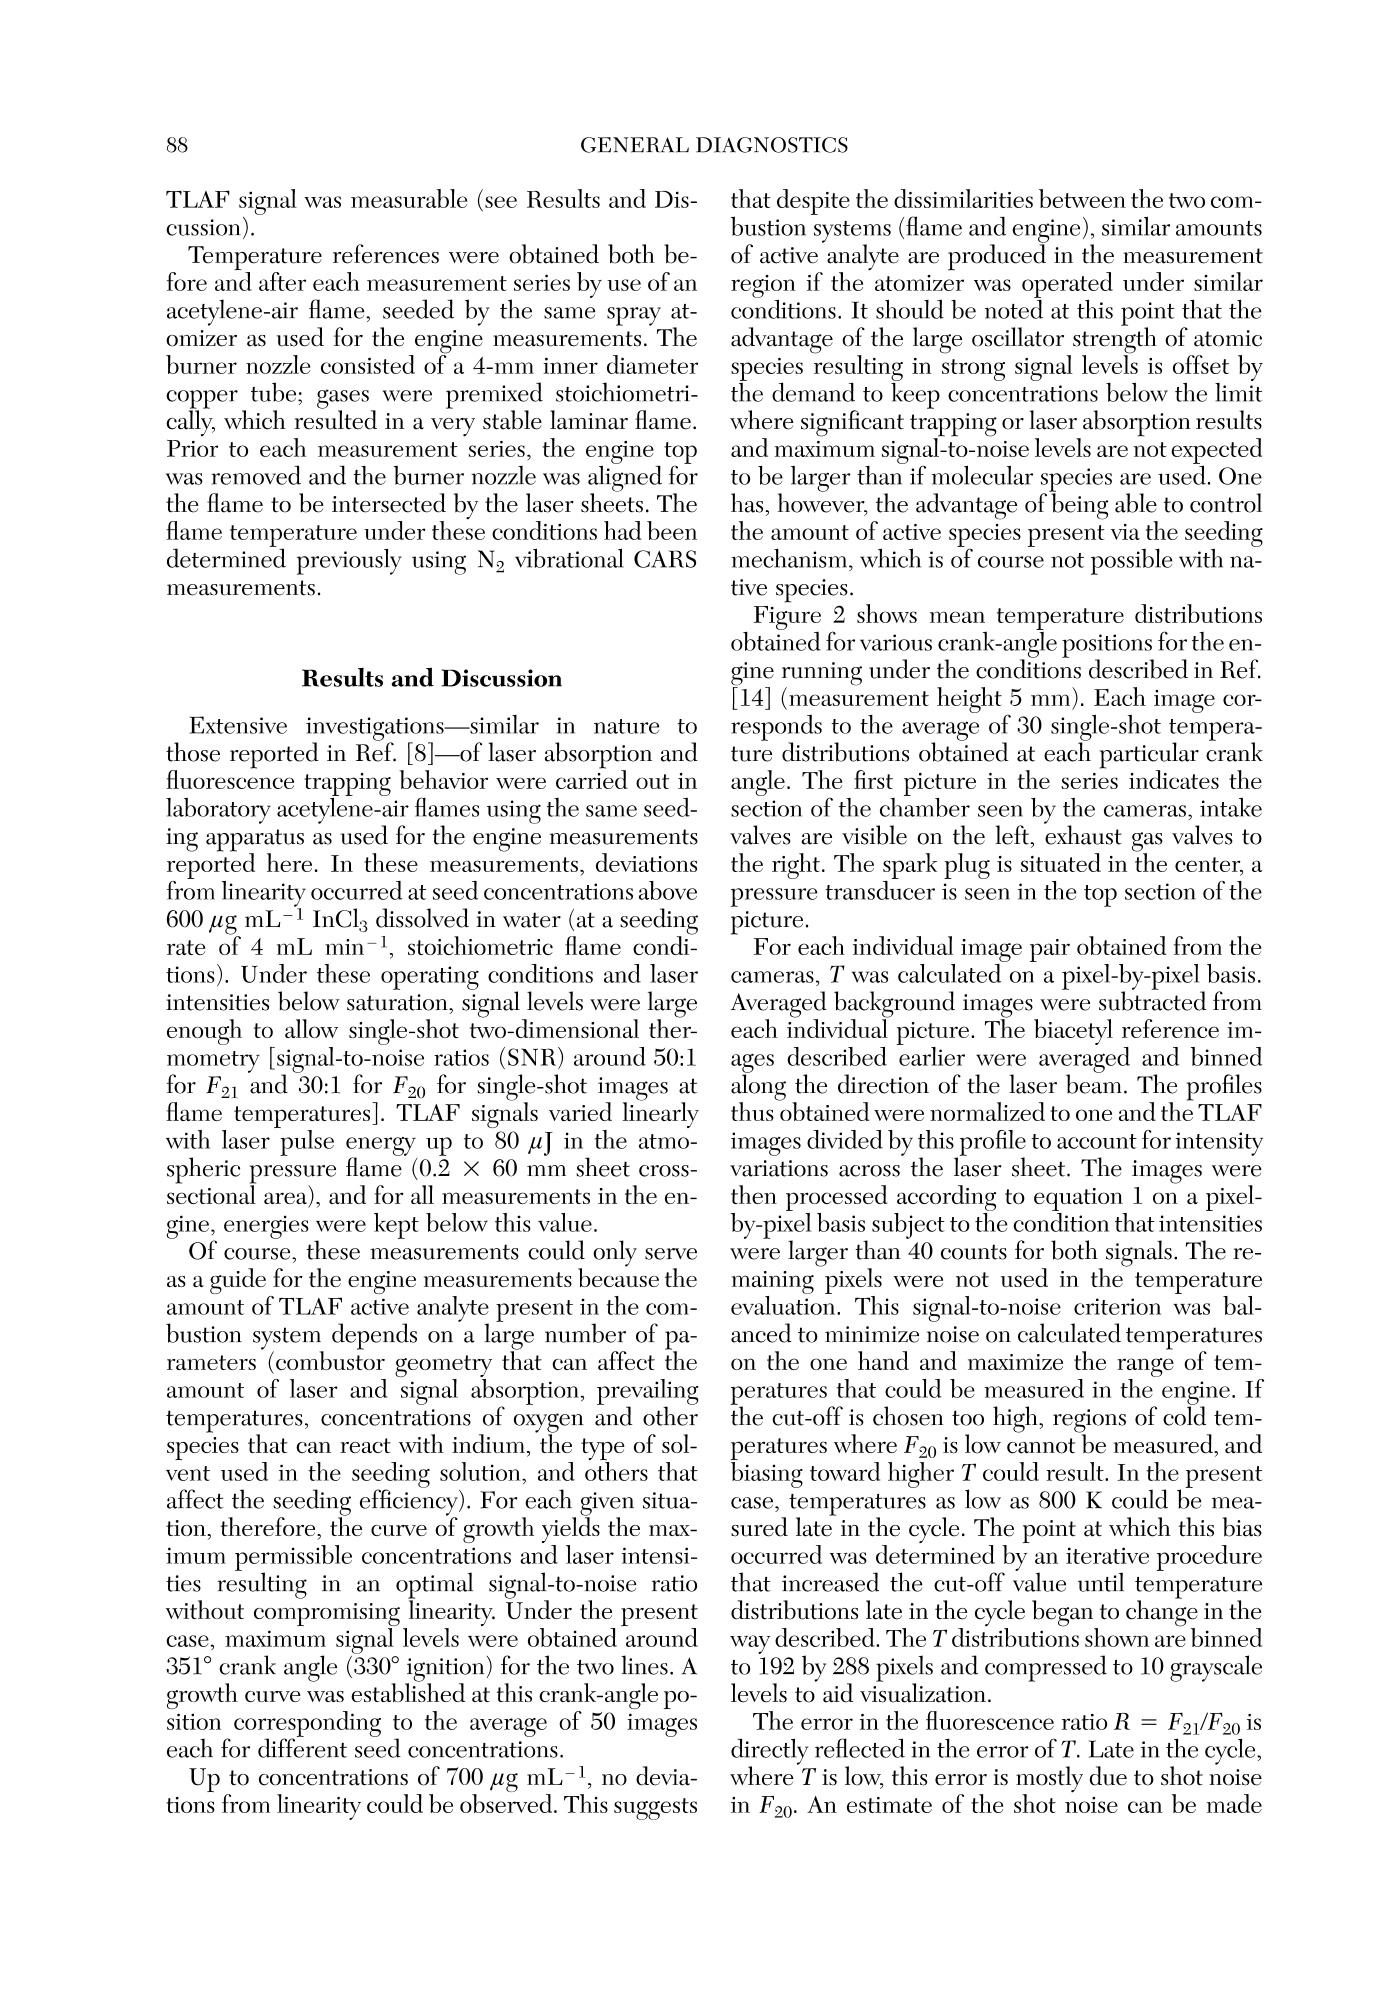
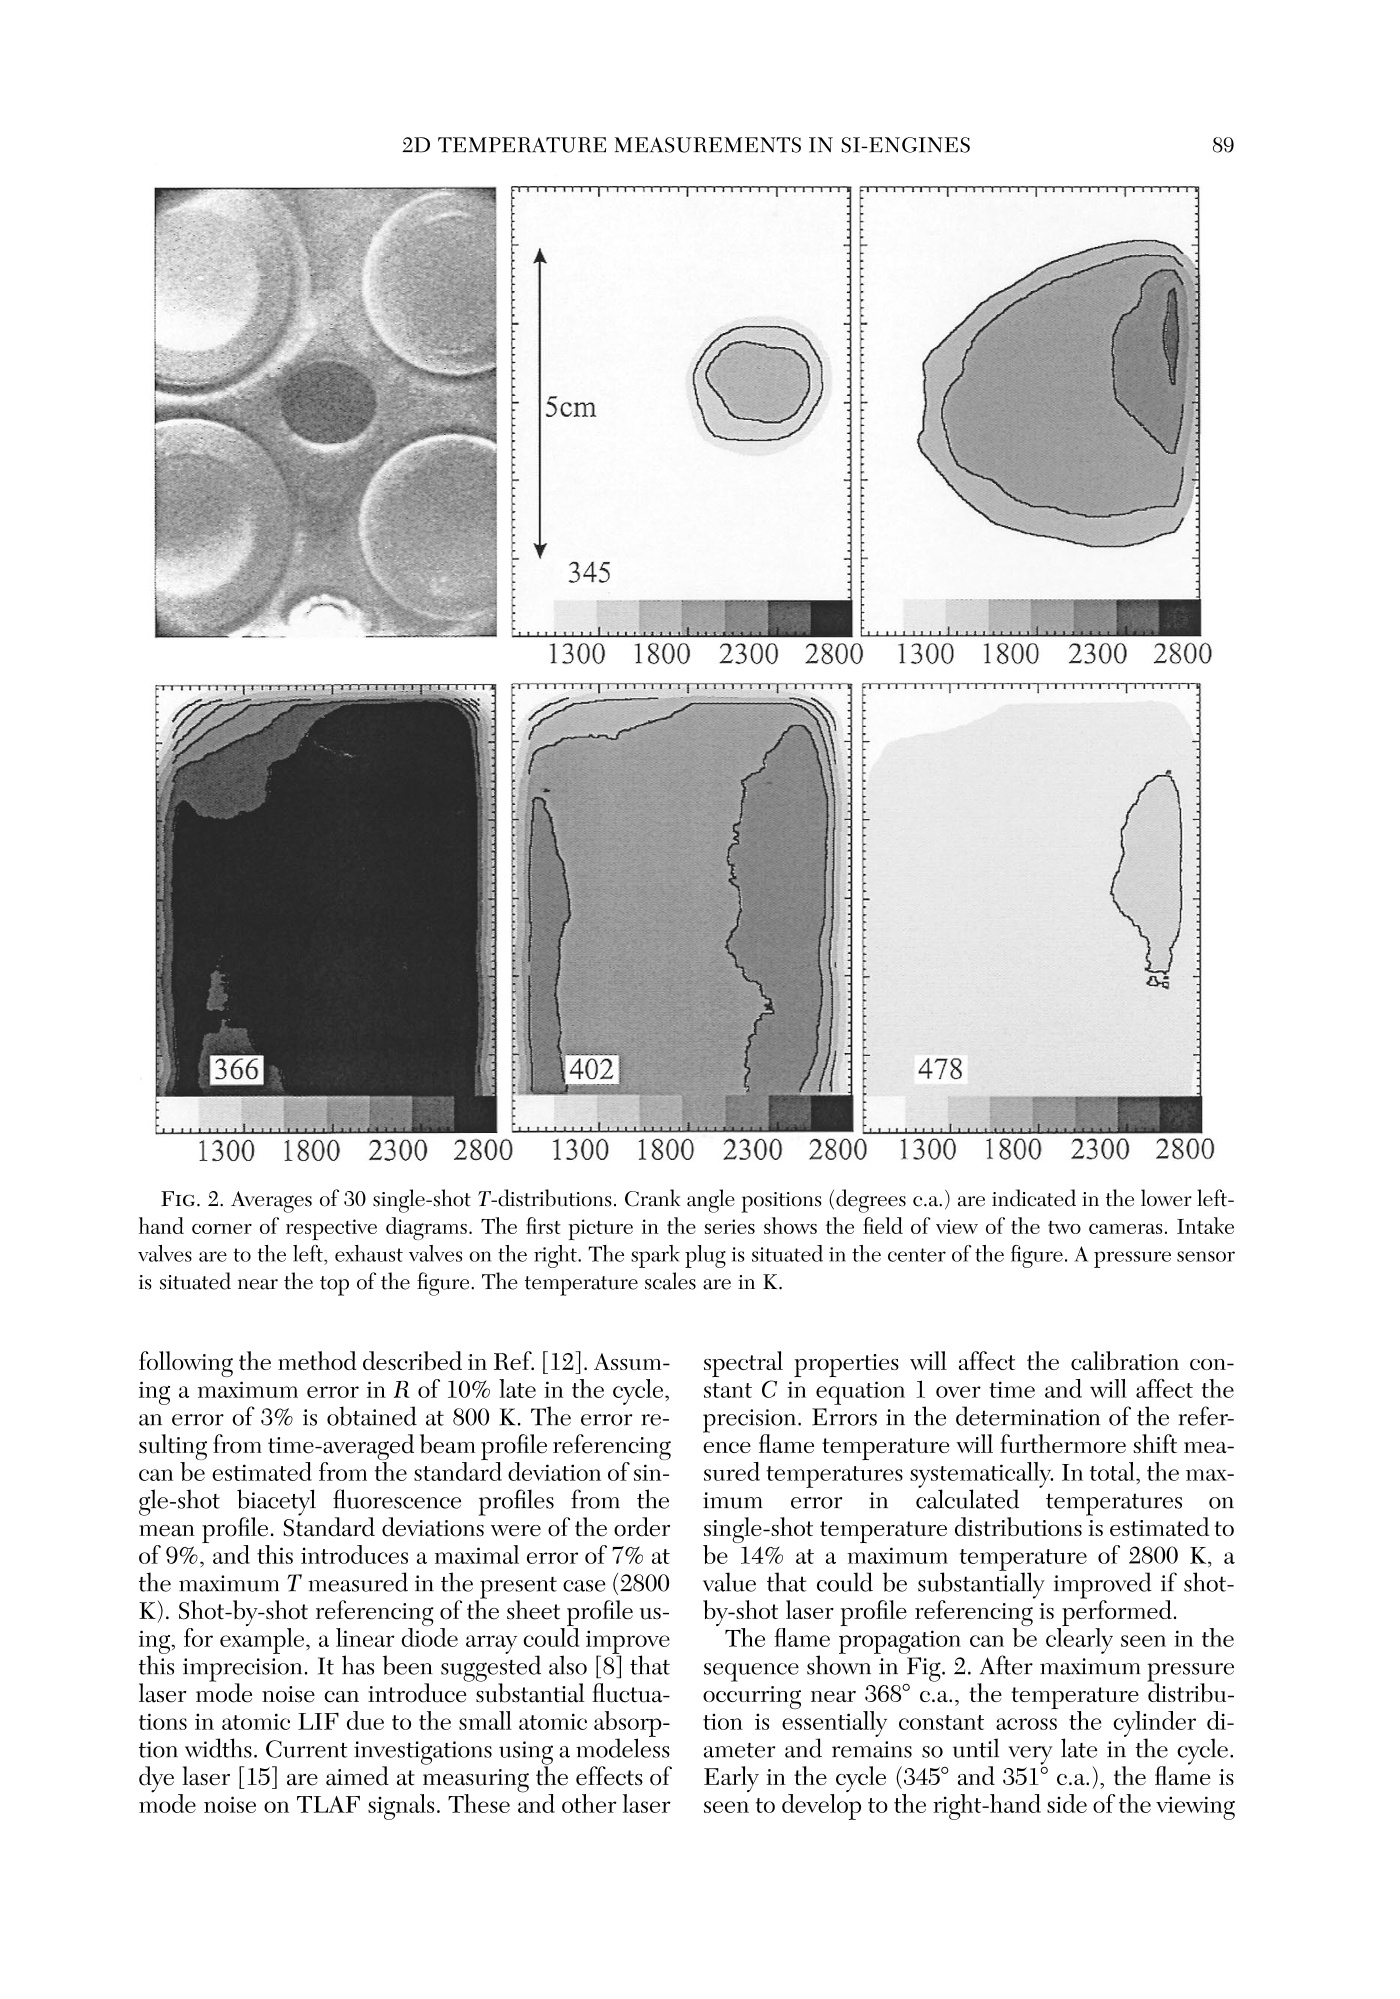
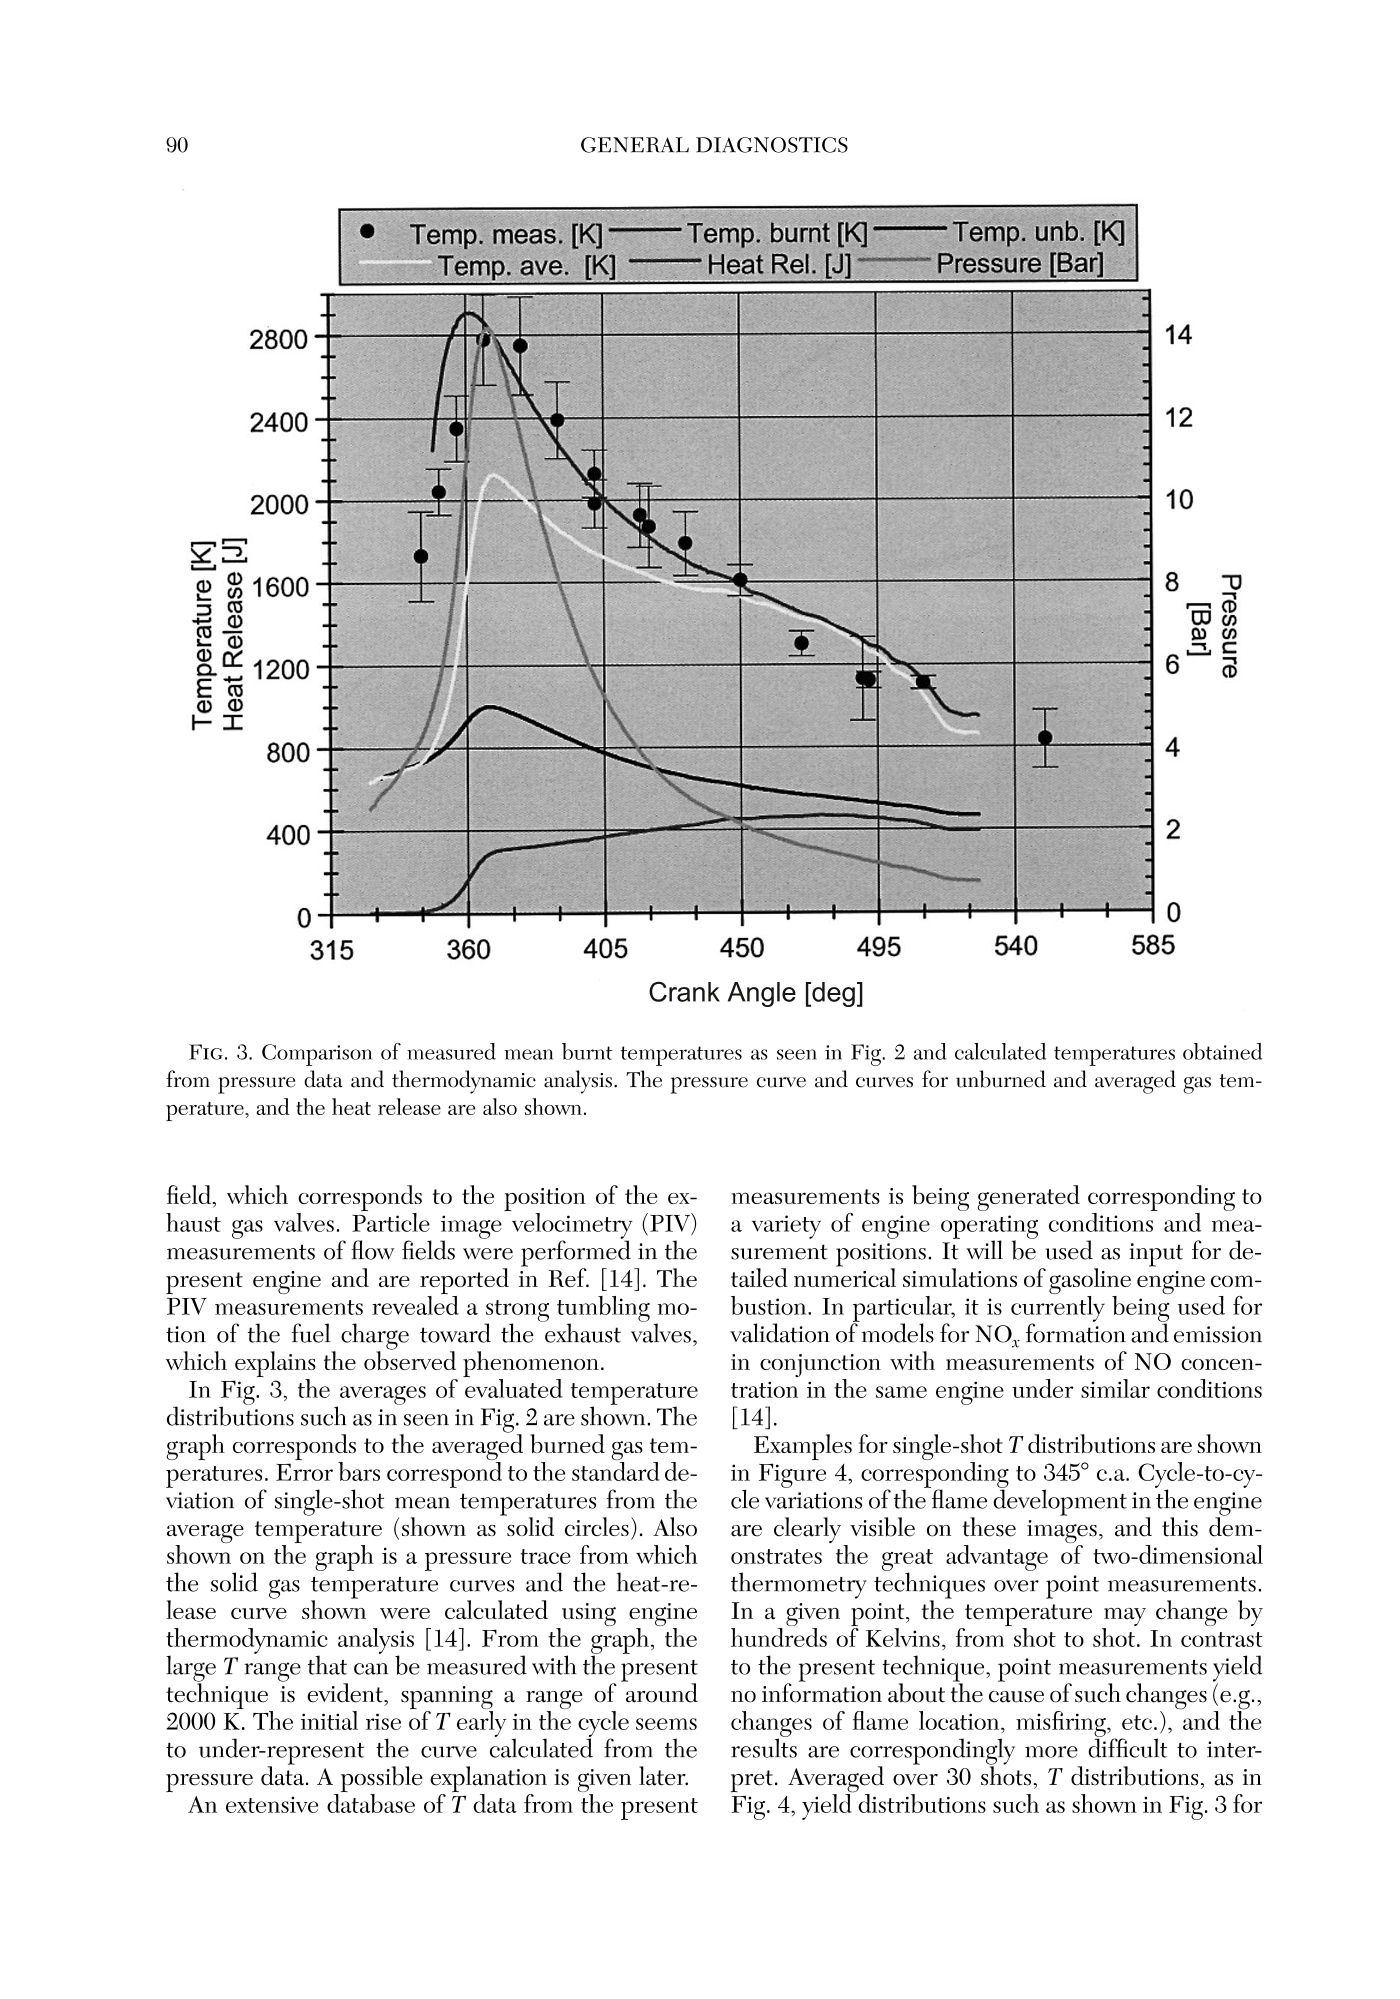
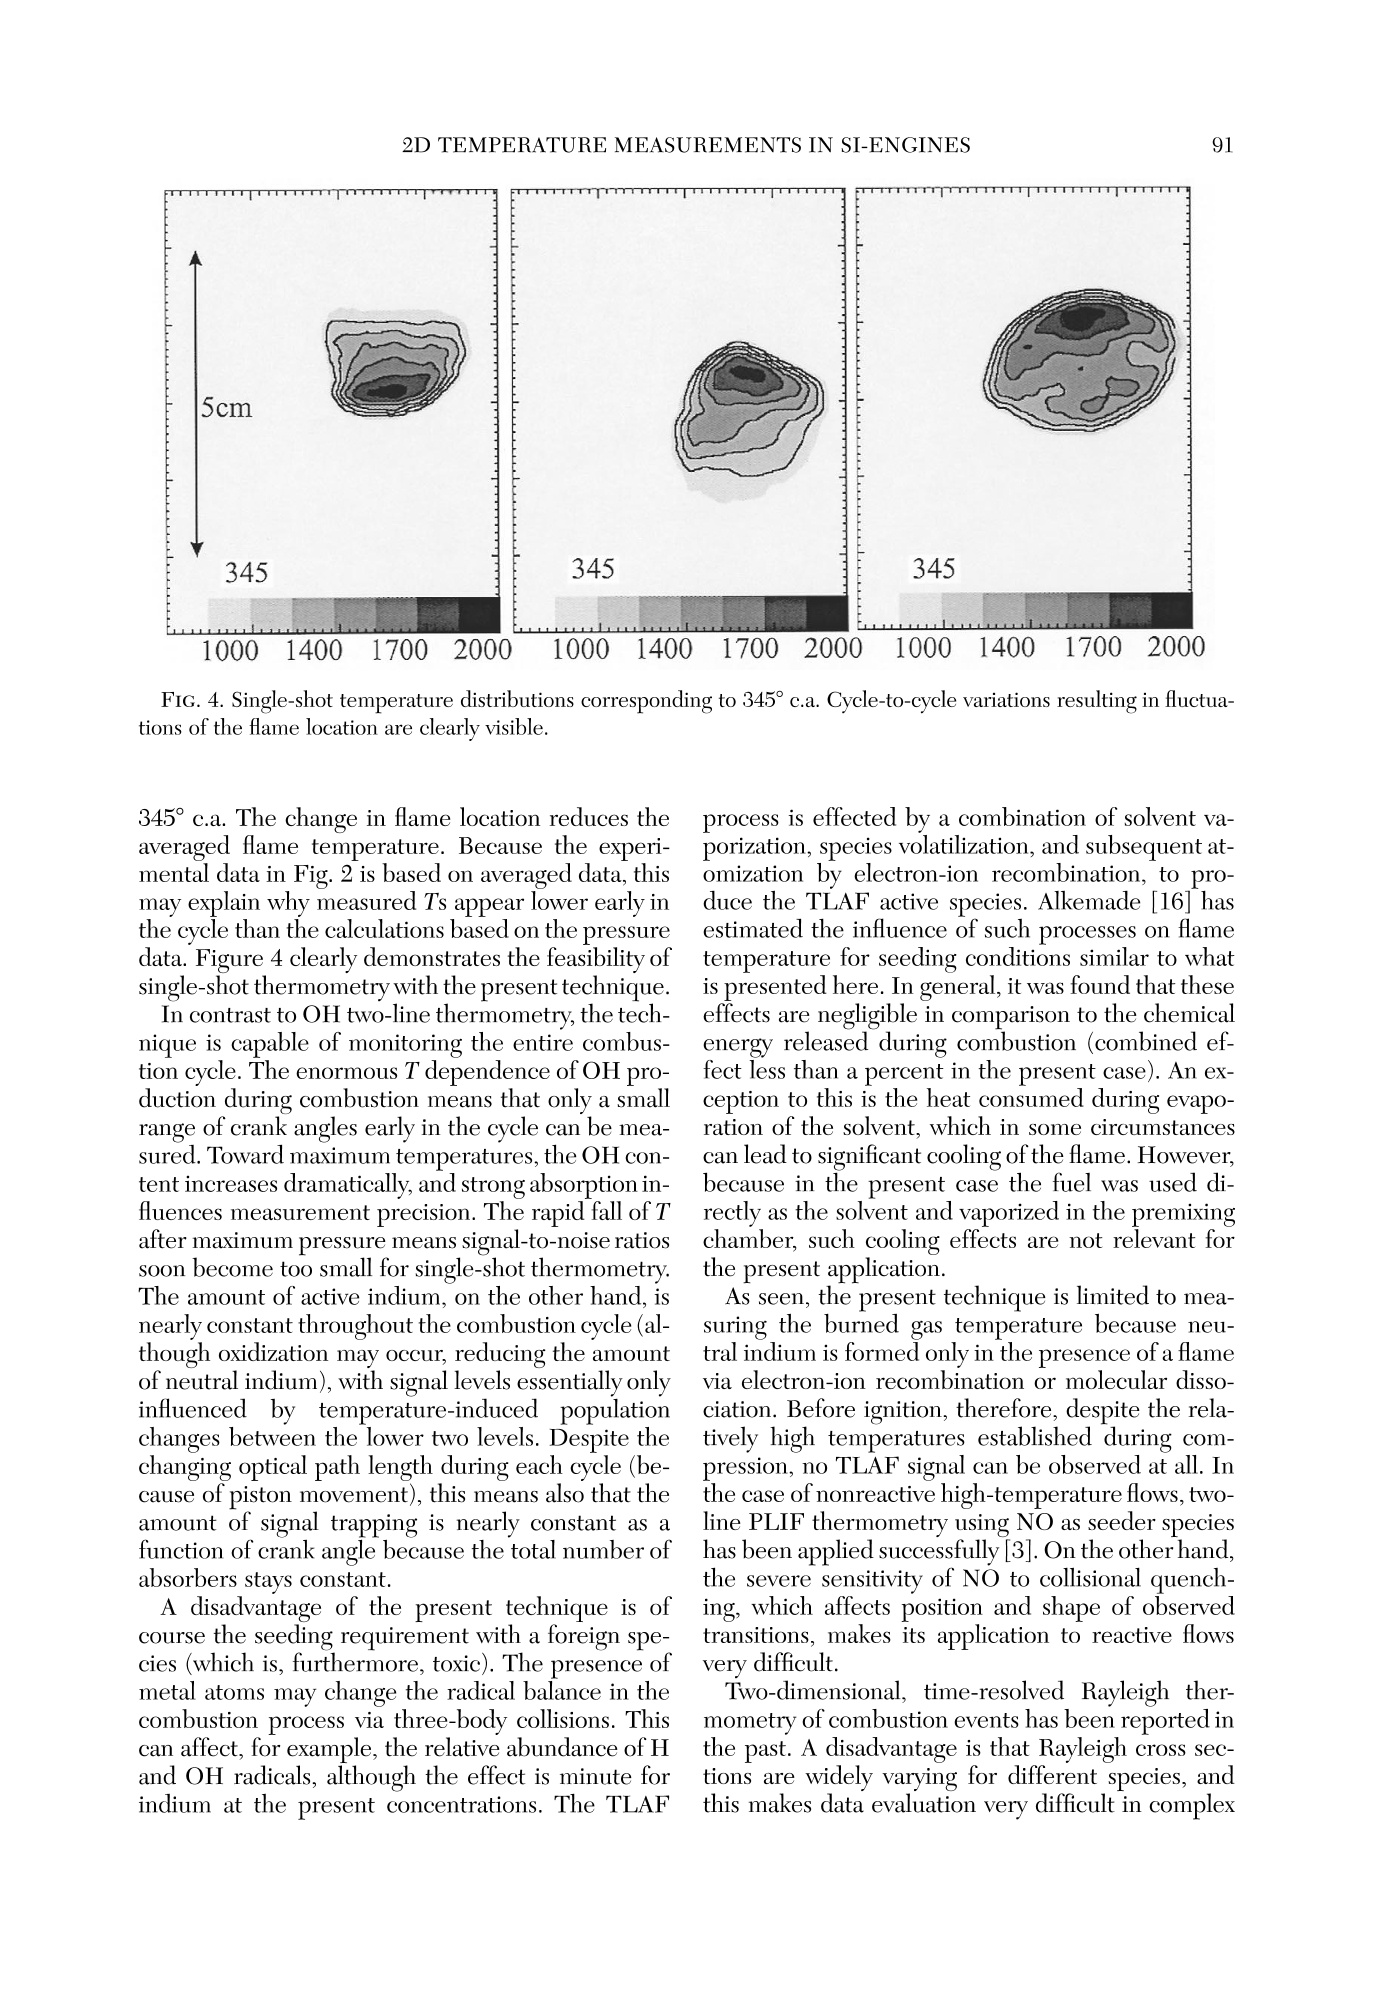
Twenty-Seventh Symposium (International) on Combustion/The Combustion Institute, 1998/pp. 85-93 GENERAL DIAGNOSTICS86 85 QUASI-INSTANTANEOUS TWO-DIMENSIONALTEMPERATUREMEASUREMENTS IN A SPARK IGNITION ENGINE USING 2-LINE ATOMICFLUORESCENCE C. F. KAMINSKI, J. ENGSTROM AND M. ALDEN Division of Combustion PhysicsLund Institute of Technology P.O. Box 118 S-22100 Lund, Sweden Two-dimensional thermometry by the two-line atomic fluorescence method (TLAF) from atomic indiumperformed in an internal combustion engine is reported for the first time. The engine was a modifiedproduction engine running on iso-octane fuel. Small quantities of atomized indium were admitted to theengine chamber by injecting solutions containing InCl mixed with iso-octane. Temperatures could bemeasured over the entire combustion cycle covering a range from 800 to 2800 K at pressures up to 14bar. A precision of 14% on single-shot temperature distributions was obtained, a figure that is expected tcbe much improved if laser intensity profile normalization is performed on a shot-by-shot basis and not, asin the present case, on averaged intensity profiles. Advantages of the technique are its sensitivity over alarge temperature range, its insensitivity to collisional quenching processes, the small laser powers required,and the possibility to use wavelengths at which interferences from native flame species, such as smallhydrocarbons, are low. Limitations are discussed, and comparisons with other techniques are made. Introduction Data on temperature field distributions of turbu-lent combustion processes can provide important in-put for the improvement of theoretical models andthe optimization of practical combustion devices.The task of measuring time-resolved temperaturefield distributions of burned gases is experimentallychallenging, and few techniques are currently avail-able that accomplish this task. Rayleigh and Ramanscattering techniques using pulsed lasers have beenapplied to this end, but their low sensitivities maketheir use limited for two-dimensional temperaturemeasurements of burned gases on a shot-by-shot ba-sis [1]. Planar laser-induced fluorescence (PLIF), onthe other hand, has the required sensitivity, and itsapplication for single-shot thermometry has beendemonstrated on molecular species such as OH [2]and NO [3]. These experiments are extensions of thetwo-line fluorescence methods reported in Refs. [4]and [5]. In two-line atomic fluorescence (TLAF), two tem-perature-sensitive electronic states in thermal equi-librium with the combustion gas are probed directlywith two laser pulses. The ratio of the resulting fluo-rescence is proportional to the temperature.TLAFfrom metal species seeded into laminar flames hasbeen shown to provide both accurate and precisetemperature measurements with a precision reach-ing 2% on a shot noise basis [6,7]. More recently,point measurements of temperatures in turbulent flames were reported using continuous wave lasersmodulated at frequencies up to 10 kHz and atomicindium as seeder species [8]. The precision of thetechnique was better than 3%. A related technique is thermally assisted LIF [9],where collisional redistribution during the laserpulse length among states close to the laser-excitedstate results in fluorescence lines other than the oneinitially excited. If the system reaches thermal equi-librium, a temperature can be determined from theratio of the spectrally resolved fluorescence line in-tensities. An advantage over TLAF is that only a sin-gle laser is required. Recently, thermally assistedLIF has been demonstrated to be capable of highlyprecisetwo-dimensionaltemperature measure-ments in flames [10]. However, owing to signal lim-itations, only time-averaged temperature measure-ments of laminar combustion events could beperformed using thermally assisted LIF. Two-di-mensional, single-shot temperature measurementsusing TLAF, on the other hand, have recently beendemonstrated in flames seeded with atomic indium[11]. The present paper reports on the first appli-cation of this technique in a near-production SI en-gine running on iso-octane fuel. Burned gas tem-perature distributions could be measured on ashot-by-shot basis over practically the entire com-bustion cycle, with temperatures varying by~2000K. Advantages ofthe technique are presented as wellas limitations, and comparisons are made with otherlaser thermometry methods. Theory The theory of TLAF is described in detail else-where [12]. Briefly, two time-delayed laser pulses atwavelengths Ao2 and A12 are used to probe theground state 0 and first excited state 1 of a suitableseeder species by driving transitions to a commonupper state 2. Upon excitation by A02, level 2 willfluoresce back to the two available lower states 0 and1, yielding LIF signals F20 and F21, respectively. Adetector D is used that is filtered to collect the LIFsignal corresponding to F21 only. Similarly, anotherfiltered detector Do collects the LIF signal F20 in-duced by A21. Because A20 is degenerate with thesignal wavelength F20 (and similarly A21 coincidesspectrally with F21), time gating of the detectorsmust be used to discriminate against laser stray light.In turbulent combustion environments, the delaybetween the two excitation pulses must be chosento be short on turbulent timescales but longenoughfor the population dynamics to relax to equilibriumbefore the second pulse arrives. In thermal equilibrium, the ratio F20/F21 can bedirectly related to the temperature T of the system.It can be shown that where eo is the energy difference between the twolower states involved (in J), kg is Boltzmann’s con-stant, A2; are the fluorescence wavelengths, and I;and F2i (i=0,1) are the laser and the fluorescencesignal intensities, respectively. C is a system-depen-dent calibration constant that needs to be deter-mined separately and includes factors such as spec-tral overlap between laser and atomic linewidths,detector and light collection efficiencies, etc., and isbest determined by performing a calibration mea-surement in a system with known temperature.Equation l is valid under the assumption of a linearrelationship between laser intensity and LIF signal.Because the oscillator strengths of atomic seederspecies can be of the order of unity, the effects ofsaturation and fluorescence trapping have to be care-fully checked for in a given measurement situation.Note that because F21 and F20 usually correspond tovery different frequencies in TLAF and because thepopulations in the lower two states are different, theamount of signal trapping will not be equal for thetwo signals. This is in contrast to some moleculartwo-line techniques where due to fast collisional re-distributions, the spectral shapes of the fluorescencemay be very similar for the two excited lines [4]. Inthe present case, saturation and self-absorption mustbe checked for by establishing so-called curves ofgrowth [13] for different laser intensities and seederspecies concentrations. state of many metal atoms makes them ideally suitedas seeder species for TLAF thermometry becausethe population distribution over states 0 and 1 canbe sensitive over a large range of temperatures[11,13]. In the present case, atomic indium was cho-sen because it offers good sensitivity in a T rangeencountered in a multitude of practical combustionenvironments (~500-3000 K). The large oscillatorstrengths of metal species as seeds means that onlyminute quantities and small laser powers are re-quired, an advantage for PLIF applications.94 The measurement error of the temperature eval-uated from the TLAF signals will be a combinationof errors from F2o and F21 and laser intensity mea-surements. It can be written as where a/x denotes the relative error in the quantityx. Furthermore, shifts in temperature will resultfrom errorsintthe calibrationnconstant C irequation 1. Experiment Engine Figure 1 shows a schematic diagram of the engineused in the experiments. The engine top was a re-search version of the Volvo N1P engine fitted ontcan AVL 528 one-cylinder engine, equipped with anAVL 514 optical access option. Laser access was ei-ther through quartz pentroof windows, allowingprobing close to valves and spark plug, or through e30-mm quartz liner to allow measurements furtherdown into the chamber. The direction of the laserbeams was perpendicular to the plane of Fig. 1. LIFsignals propagating through the transparent pistonwere reflected out of the engine block by a 45° mirror prior to detection by the camera system. All mea-surements reported in the present paper correspondto the 5-mm measurement position in Figure 1. To obtain maximal reproducibility, the fuel and airwere premixed by injecting the fuel into a heated,2-m-long pipe, which ensured complete vaporizationof the charge, prior to entry into the combustionchamber. To reduce the amount of residuals in thecombustion chamber from previous engine cycles,the system was run on skip-fired mode, with ignitionoccurring every fifth cycle only. Cycle-to-cycle vari-ations of cylinder pressure and heat release werekept below 10% in this way [14]. The engine char-acteristics and present operating conditions are de-tailed in Ref. [14]. Optical Setup A Spectra-Physics PIV 400 double-cavity Nd:YAGlaser was used to pump the two dye lasers (Lumonics FIG. 1. Optical access to the engine chamber. A 45-de-gree mirror placed below the transparent piston was usedto reflect the TLAF signals out of the chamber. Hyperdye-300) used in the present experiments.The frequency-tripled output at 355 nm from cavityl was used to pump dye laser 1 operating on meth-anol solutions of Coumarin 445 to obtain output at451 nm. Pulses from cavity 2 were delayed by 500ns with respect to cavity 1 and frequency doubled to532 nm. This was used to pump a dye laser at 667nm whose output was subsequently mixed with theresidual fundamental radiation at 1064 nm to pro-vide output around 410 nm. The beams were spa-tially filtered and attenuated and formed into sheetsof approximately 200 um thickness and 6 cm width.Pulse energies were approximately 80 pJ per pulsein the interaction region and monitored on a shot-by-shot basis by use of a fast photodiode and twoboxcar-integrating amplifiers (Stanford SRS250).Care was taken to sample the same spatial extent ofthe beams as entered the reaction chamber. TLAF signals were monitored by two intensifiedCCD cameras (LaVision Flamestar II) with 14-bitdynamic resolution and a chip size of 576 by 384pixels. Both cameras were equipped with standard105-mmcamera lenses (Nikon). A beamsplittercoated to be highly reflecting at 45° for F21 andhighly transmitting for F20 was used to separate theoptical axes for the two signals. The two detectingcameras were arranged at right angles to each otherand mounted on precision x, y, z, 0 positioningstages. Combined with software mirroring of one ofthe camera images, this allowed precise alignment of the two images on a pixel-by-pixel basis. Thelightcollection solid angle of the imaging system was max-imized corresponding to ~f/9 for the given enginegeometry and signal path. Distortions caused by theintensifiers (cushioning, misalignment of fiber cou-plers, etc.) were undetectable on the present imagescale, and no further software image corrections hadto be employed once alignment had been achieved. Trigger pulses for the whole system were derivedfrom a crankshaft encoder that was referenced to thefuel injection pulse provided by the AVL electronics.At 1200 rpm, this corresponded to a pulse train at10 Hz to which the YAG lasers could be synchro-nized, which were optimized for this repetion rate.Cameras were triggered only every fifth cycle, whenignition occurred. Separate pulses were provided forYAG flashlamps, Q switches, interpulse delay, cam-era intensifier gates, and CCD exposure, achievedby the use of three delay generators. In this way, theTLAF system could be locked to any desired crankangle. Seeding Procedure InClg salt was dissolved in a few droplets of iso-propanol and then mixed with isooctane at typicalconcentrations of 700 ug mL-1. The resulting solu-tion was seeded into the heated premixing chamberby use of a spray atomizer assembly and a dropletsize selector (Perkin Elmer). The doped isooctanewas seeded at approximately 4 mL min-1, and therest of the fuel-air mixture was injected via a stan-dard port injector into the premixing chamber. Thecombined air-fuel ratio was held stoichiometric. Initial experiments were carried out by addingInClg directly to the fuel and simply injecting itthrough the port injector, but for some reason, verylow TLAF signals were obtained in this way, even athigh seed concentrations. This is in contrast to ear-lier findings [11]. In the present case, fuel from themain tank was filtered before injection, and it isthought possible that the metal ions in solution un-derwent chemical changes upon filter passage,thereby reducing the amount of active species avail-able in the cylinder chamber. Reference Measurements Laser sheet profile measurements were carriedout using LIF from biacetyl added to the chamberjust prior and after each experimental run. Becausesheet corrections were not performed on a shot-by-shot basis, fluctuations and long-term drifts in thebeam profiles during measurement runs contributedto errors in the determination of T. Background images were taken before and aftereach measurement series by triggering on a skippedcycle, where no ignition occurred and hence no TLAF signal was measurable (see Results and Dis-cussion). Temperature references were obtained both be-fore and after each measurement series by use of anacetylene-air flame, seeded by the same spray at-omizer as used for the engine measurements. Theburner nozzle consisted of a 4-mm inner diametercopper tube; gases were premixed stoichiometri-cally, which resulted in a very stable laminar flame.Prior to each measurement series, the engine topwas removed and the burner nozzle was aligned forthe flame to be intersected by the laser sheets. Theflame temperature under these conditions had beendetermined previously using N vibrational CARSmeasurements. Results and Discussion Extensive investigations-similar in nature tothose reported in Ref. [8]—of laser absorption andfluorescence trapping behavior were carried out inlaboratory acetylene-air flames using the same seed-ing apparatus as used for the engine measurementsreported here. In these measurements, deviationsfrom linearity occurred at seed concentrations above600 ug mL-1 InClg dissolved in water (at a seedingrate of 4 mL min-1, stoichiometric flame condi-tions). Under these operating conditions and laserintensities below saturation, signal levels were largeenough to allow single-shot two-dimensional ther-T-mometry [signal-to-noise ratios (SNR) around 50:1for F21 and 30:1 for F20 for single-shot images atflame temperatures]. TLAF signals varied linearlywith laser pulse energy up to 80pJ in the atmo-spheric pressure flame (0.2 × 60 mm sheet cross-sectional area), and for all measurements in the en-gine, energies were kept below this value. Of course, these measurements could only serveas a guide for the engine measurements because theamount of TLAF active analyte present in the com-bustion system depends on a large number of pa-rameters (combustor geometry that can affect theamount of laser and signal absorption, prevailingtemperatures, concentrations of oxygen and otherspecies that can react with indium, the type of sol-vent used in the seeding solution, and others thataffect the seeding efficiency). For each given situa-tion, therefore, the curve of growth yields the max-imum permissible concentrations and laser intensi-ties resulting in an optimal signal-to-noise ratiowithout compromising linearity. Under the presentcase, maximum signal levels were obtained around351° crank angle (330° ignition) for the two lines. Agrowth curve was established at this crank-angle po-D-sition corresponding to the average of 50 imageseach for different seed concentrations. Up to concentrations of 700 ug mL-1, no devia-tions from linearity could be observed. This suggests that despite the dissimilarities between the two com-bustion systems (flame and engine), similar amountsof active analyte are produced in the measurementregion if the atomizer was operated under similarconditions. It should be noted at this point that theadvantage of the large oscillator strength of atomicspecies resulting in strong signal levels is offset bythe demand to keep concentrations below the limitwhere significant trapping or laser absorption resultsand maximum signal-to-noise levels are not expectedto be larger than if molecular species are used. Onehas, however, the advantage of being able to controlthe amount of active species present via the seedingmechanism, which is ofcourse not possible with na-tive speciesS. Figure 2 shows mean temperature distributionsobtained for various crank-angle positions for the en-gine running under the conditions described in Ref.[14] (measurement height 5 mm). Each image cor-responds to the average of 30 single-shot tempera-ture distributions obtained at each particular crankangle. The first picture in the series indicates thesection of the chamber seen by the cameras, intakevalves are visible on the left, exhaust gas valves tothe right. The spark plug is situated in the center, apressure transducer is seen in the top section of thepicture. For each individual image pair obtained from thecameras, T was calculated on a pixel-by-pixel basisAveraged background images were subtracted fromeach individual picture. The biacetyl reference im-ages described earlier were averaged and binnedalong the direction of the laser beam. The profilesthus obtained were normalized to one and the TLAFimages divided by this profile to account for intensityvariations across the laser sheet. The images werethen processed according to equation l on a pixel-by-pixel basis subject to the condition that intensitieswere larger than 40 counts for both signals. The re-maining pixels were not used in the temperatureevaluation. This signal-to-noise criterion was balanced to minimize noise on calculated temperatureson the one hand and maximize the range of tem-peratures that could be measured in the engine. Ifthe cut-off is chosen too high, regions of cold tem-peratures where F20 is low cannot be measured, andbiasing toward higher T could result. In the presentcase, temperatures as low as 800 K could be mea-sured late in the cycle. The point at which this biasoccurred was determined by an iterative procedurethat increased the cut-off value until temperaturedistributions late in the cycle began to change in theway described. The T distributions shown are binnedto 192 by 288 pixels and compressed to 10 grayscalelevels to aid visualization. The error in the fluorescence ratio R=F21/F20 isdirectly reflected in the error of T. Late in the cycle,where T is low, this error is mostly due to shot noisein F20. An estimate of the shot noise can be made FIG. 2. Averages of 30 single-shot T-distributions. Crank angle positions (degrees c.a.) are indicated in the lower left-hand corner of respective diagrams. The first picture in the series shows the field of view of the two cameras. Intakevalves are to the left, exhaust valves on the right. The spark plug is situated in the center of the figure. A pressure sensoris situated near the top of the figure. The temperature scales are in K. following the method described in Ref.[12]. Assum-ing a maximum error in R of 10% late in the cycle,an error of 3% is obtained at 800 K. The error re-sulting from time-averaged beam profile referencingcan be estimated from the standard deviation of sin-gle-shot biacetyl fluorescence profiles from themean profile. Standard deviations were of the orderof 9%, and this introduces a maximal error of 7% atthe maximum T measured in the present case (2800K). Shot-by-shot referencing of the sheet profile us-ing, for example, a linear diode array could improvethis imprecision. It has been suggested also [8] thatlaser mode noise can introduce substantial fluctua-tions in atomic LIF due to the small atomic absorp-tion widths. Current investigations using a modelessdye laser [15] are aimed at measuring the effects ofmode noise on TLAF signals. These and other laser spectral properties will affect the calibration con-stant C in equation 1 over time and will affect theprecision. Errors in the determination of the refer-ence flame temperature will furthermore shift mea-sured temperatures systematically. In total, the max-imumerror ir calculated temperaturesonsingle-shot temperature distributions is estimated tobe 14% at a maximum temperature of 2800 K, avalue that could be substantially improved if shot-by-shot laser profile referencing is performed. The flame propagation can be clearly seen in thesequence shown in Fig. 2. After maximum pressureoccurring near 368°c.a., the temperature distribu-tion is essentially constant across the cylinder di-ameter and remains so until very late in the cycle.Early in the cycle (345° and 351°c.a.), the flame isseen to develop to the right-hand side of the viewing Crank Angle [deg] FIG. 3. Comparison of measured mean burnt temperatures as seen in Fig. 2 and calculated temperatures obtainedfrom pressure data and thermodynamic analysis. The pressure curve and curves for unburned and averaged gas tem-perature, and the heat release are also shown. field, which corresponds to the position of the ex-haust gas valves. Particle image velocimetry (PIV)measurements of flow fields were performed in thepresent engine and are reported in Ref. [14]. ThePIV measurements revealed a strong tumbling mo-tion of the fuel charge toward the exhaust valves,which explains the observed phenomenon. In Fig. 3, the averages of evaluated temperaturedistributions such as in seen in Fig. 2 are shown. Thegraph corresponds to the averaged burned gas tem-peratures. Error bars correspond to the standard de-viation of single-shot mean temperatures from theaverage temperature (shown as solid circles). Alsoshown on the graph is a pressure trace from whichthe solid gas temperature curves and the heat-re-lease curve shown were calculated using enginethermodynamic analysis [14]. From the graph, thelarge T range that can be measured with the presenttechnique is evident, spanning a range of around2000 K. The initial rise of T early in the cycle seemsto under-represent the curve calculated from thepressure data. A possible explanation is given later. An extensive database of T data from the present measurements is being generated corresponding tca variety of engine operating conditions and mea-surement positions. It will be used as input for de-tailed numerical simulations of gasoline engine com-bustion. In particular, it is currently being used forvalidation of models for NO, formation and emissionin conjunction with measurements of NO concen-tration in the same engine under similar conditions[14]. Examples for single-shot T distributions are shownin Figure 4, corresponding to 345°c.a. Cycle-to-cy-cle variations of the flame development in the engineare clearly visible on these images, and this dem-onstrates the great advantage of two-dimensionalthermometry techniques over point measurements.In a given point, the temperature may change byhundreds of Kelvins, from shot to shot. In contrastto the present technique, point measurements yieldno information about the cause of such changes (e.g.,changes of flame location, misfiring,etc.), and theresults are correspondingly more difficult to inter-pret. Averaged over 30 shots, T distributions, as inFig. 4, yield distributions such as shown in Fig. 3 for FIG. 4. Single-shot temperature distributions corresponding to 345°c.a. Cycle-to-cycle variations resulting in fluctua-tions of the flame location are clearly visible. 345°c.a. The change in flame location reduces theaveraged flame temperature. Because the experi-mental data in Fig. 2 is based on averaged data, thismay explain why measured Ts appear lower early inthe cycle than the calculations based on the pressuredata. Figure 4 clearly demonstrates the feasibility ofsingle-shot thermometry with the present technique. In contrast to OH two-line thermometry, the tech-nique is capable of monitoring the entire combus-tion cycle. The enormous T dependence of OH pro-duction during combustion means that only a smallrange of crank angles early in the cycle can be mea-sured. Toward maximum temperatures, the OH con-tent increases dramatically, and strong absorption in-fluences measurement precision. The rapid fall of Tafter maximum pressure means signal-to-noise ratiossoon become too small for single-shot thermometry.The amount of active indium, on the other hand, isnearly constant throughout the combustion cycle (al-though oxidization may occur, reducing the amountof neutral indium), with signal levels essentially onlyinfluencedby temperature-induced populationchanges between the lower two levels. Despite thechanging optical path length during each cycle (be-cause of piston movement), this means also that theamount of signal trapping is nearly constant as afunction of crank angle because the total number ofabsorbers stays constant. A disadvantage of the present technique is ofcourse the seeding requirement with a foreign spe-cies (which is, furthermore, toxic). The presence ofmetal atoms may change the radical balance in thecombustion process via three-body collisions. Thiscan affect, for example, the relative abundance of Hand OH radicals, although the effect is minute forindium at the present concentrations. The TLAF process is effected by a combination of solvent va-porization, species volatilization, and subsequent at-omization by electron-ion recombination, to pro-duce the TLAF active species. Alkemade [16] hasestimated the influence of such processes on flametemperature for seeding conditions similar to whatis presented here. In general, it was found that theseeffects are negligible in comparison to the chemicalenergy released during combustion (combined ef-fect less than a percent in the present case). An ex-ception to this is the heat consumed during evapo-ration of the solvent, which in some circumstancescan lead to significant cooling of the flame. However,because in the present case the fuel was used di-rectly as the solvent and vaporized in the premixingchamber, such cooling effects are not relevant forthe present application. As seen, the present technique is limited to mea-suring the burned gas temperature because neu-tral indium is formed only in the presence of a flamevia electron-ion recombination or molecular disso-ciation. Before ignition, therefore,despite the rela-tively high temperatures established during com-pression, no TLAF signal can be observed at all. Inthe case of nonreactive high-temperature flows, two-line PLIF thermometry using NO as seeder specieshas been applied successfully [3].On the other hand,the severe sensitivity of NO to collisional quench-ing, which affects position and shape of observedtransitions, makes its application to reactive flowsvery difficult. Two-dimensional, time-resolved Rayleigh ther-mometry of combustion events has been reported inthe past. A disadvantage is that Rayleigh cross sec-tions are widely varying for different species, andthis makes data evaluation very difficult in complex environments such as SI engines. Furthermore, verylarge laser powers are required that can perturb theflame chemistry. One of the most distinct advantages of the in-dium-TLAF method is that only minute laser pow-ers are required and excitation and fluorescence oc-curintheevisible wavelengthregionwhereabsorption by small hydrocarbons and other nativespecies in combustion is small. This is in contrast tothe other techniques discussed earlier, which areperformed in the UV spectral region. Current ex-periments are carried out in sooting flames and en-gines running on commercial fuels to investigate thepotential of TLAF in these environments. Conclusion Time-resolved, two-dimensional thermometry ofhighly turbulent combustion events has been dem-onstrated for the first time using two-line atomicfluorescence (TLAF). The technique was appliedsuccessfully to a near-production automotive enginerunning on isooctane fuel. The temperature sensi-tivity of the technique allowed measurements overthe entire combustion cycle to be performed cov-ering a temperature range of nearly 2000 K. Thetechnique is conceptually simple and should find ap-plications in a variety of hot, reacting flows. Acknowledgments The authors would like to thank Mr. Goran Josefsson andDr. Ingemar Magnusson, Volvo Car Corporation, Goth-enburg, for the provision of PIV and engine thermody-namic data and stimulating technical discussions. REFERENCES l. Eckbreth, A. C., Laser Diagnostics for CombustionTemperature and Species, 2nd ed., Combustion Sci- ence and Technology Series, vol. 3, Gordon andBreach Publishers, New York, 1996. ( 2. Seitzman, J. M., Hanson, R. K., D eBarber, P. A., andHess, C. F., Appl. Opt.33:4000-4012 (1994). ) ( 3. M CMillin, B . K ., Palmer, J. L. , and Hanson, R. K.Appl. Opt. 32:7533 - 7545(1993). ) 4. Cattolica, R., Appl. Opt. 20:1156-1166 (1981). 5. Lucht, R. P., Laurendeau, N. M., and Sweeney, D. W.,Appl. Opt. 21:3729-3735 (1982). 6. Omenetto, N., Benetti, P., and Rossi, G., SpectrochimActa 27B:453-461(1972). 7. Bradshaw, J., Nikdel, S., Reeves, R., Bower, J., Ome-netto, N., and Wineefordner, J. D., in Laser Probes forCombustion Chemistry (D. R. Crosley, ed.), ACS Sym-posium Series 134, American Chemical Society,1980,pp.199-203. 8. Dec, J. and Keller, J. O., in Twenty-First Symposium(International) on Combustion, The Combustion In-stitute, Pittsburgh, 1986, pp. 1737-1745. 9. Elder, M. L., Zizak, G., Bolton, D., Hovath,J.J., andWinefordner, J.D., Appl. Spectrosc. 38:113-118(1984). 10. Berten, H. O. and Kleinermanns, K., Appl. Phys. B61:605-610(1995). 11. Kaminski, C. F, Engstrom, J., and Alden, M., VDIBerichte 1313:555-560 (1997). 12. Alkemade, C. T. J., Pure Appl. Chem. 23:73-97(1970) 13. Haraguchi, H., Smith, H., Weeks, S., Johnson, D. J.,and Winefordner, J. D., Appl. Spectr. 31:156-163(1977). 14. Hildenbrand, F., Schulz, C., Sick, V, Josefsson, G.,Magnusson, I., Andersson, O., and Alden, M., SAE pa-per 980148 (1998). 15. Ewart, P., Opt. Commun. 55:124 (1985). 16. Alkemade,C. T. J., in Flame Emission and Atomic Ab-sorption Spectrometry, vol.1 (J. A. Dean and T. C.Rains, eds.), Marcel Dekker, New York, 1969, pp. 100-151. COMMENTS Michael Drake, General Motors, USA. Can this mea-surement technique be used to measure end gas tempera-tures in IC engines? Specifically, have you tried to makemeasurements close to surfaces, and are there problems?Second, can you seed with indium compounds that are lessthermally stable than indium chloride that you used in thepresent experiments? This could lead to dissociation in theend gas providing the atomic indium in the end gas neededfor your technique. Author’s Reply. I presume this question is related toknock studies in engines. With the present technique, wehave been unsuccessful in getting TLAF signals from in-dium before ignition. There are other indium compoundsthat are less stable than InClg, for example, metal-organic compounds, but many are very toxic or otherwise difficultto handle. I believe that in our case, an electron ion recom-bination is required in the gas phase before neutral indiumis produced, and the flame enhances this process. Possiblyuse of a vapor of pure indium or a compound that producesatomic indium when dissociated can be used for thispurpose. Concerning the question of measurements nearengine walls, we have not tried this yet. In the presentapplication, there was no evidence of contamination of thecylinder walls by indium, but if low wall temperatures pre-vail, loss of indium by condensation and consequent loss ofsignal may pose a problem. Yasuo Takagi, Nissan Motor, Japan. In the single-shottemperature distribution data, the temperature in the pe-ripheral region of the flame looks too low (about 1000 K).Can you comment why? Author’s Reply. The one-sided temperature gradients onsingle-shot temperature distributions were only visible veryearly in the cycle. The measurements shown correspond to a short time period after ignition, where the flame kernelhad just reached the region we were probing with our lasersheet. The effect was changing from shot to shot. I assumeit is caused by turbulent gas flow onto the developing flamekernel, which initially propagates at low speeds. In this con-text, the gradients could be explained by transport of hotflame gases out of the flame via turbulent diffusion. Two-dimensional thermometry by the two-line atomic fluorescence method (TLAF) from atomic indiumperformed in an internal combustion engine is reported for the first time. The engine was a modifiedproduction engine running on iso-octane fuel. Small quantities of atomized indium were admitted to theengine chamber by injecting solutions containing InCl3 mixed with iso-octane. Temperatures could bemeasured over the entire combustion cycle covering a range from 800 to 2800 K at pressures up to 14bar. A precision of 14% on single-shot temperature distributions was obtained, a figure that is expected tobe much improved if laser intensity profile normalization is performed on a shot-by-shot basis and not, asin the present case, on averaged intensity profiles. Advantages of the technique are its sensitivity over alarge temperature range, its insensitivity to collisional quenching processes, the small laser powers required,and the possibility to use wavelengths at which interferences from native flame species, such as smallhydrocarbons, are low. Limitations are discussed, and comparisons with other techniques are made.
确定

还剩7页未读,是否继续阅读?

产品配置单


北京欧兰科技发展有限公司为您提供《火花塞引燃发动机中准瞬态二维温度场检测方案(流量计)》,该方案主要用于汽车电子电器中可靠性能检测,参考标准--,《火花塞引燃发动机中准瞬态二维温度场检测方案(流量计)》用到的仪器有PLIF平面激光诱导荧光火焰燃烧检测系统、德国LaVision PIV/PLIF粒子成像测速场仪、激光诱导白炽光烟雾粒子成像分析仪(LII)、汽车发动机多参量测试系统
推荐专场


烟气监测(CEMS)/烟气分析仪
更多


相关方案
更多
该厂商其他方案
更多