


方案详情
文
采用LaVision公司独有的,快门宽度最小可达50皮秒的增强型CCD相机,通过化疗可咯和多模光学成像方法对光子激发诱导线粒体损伤机理进行了研究。
方案详情

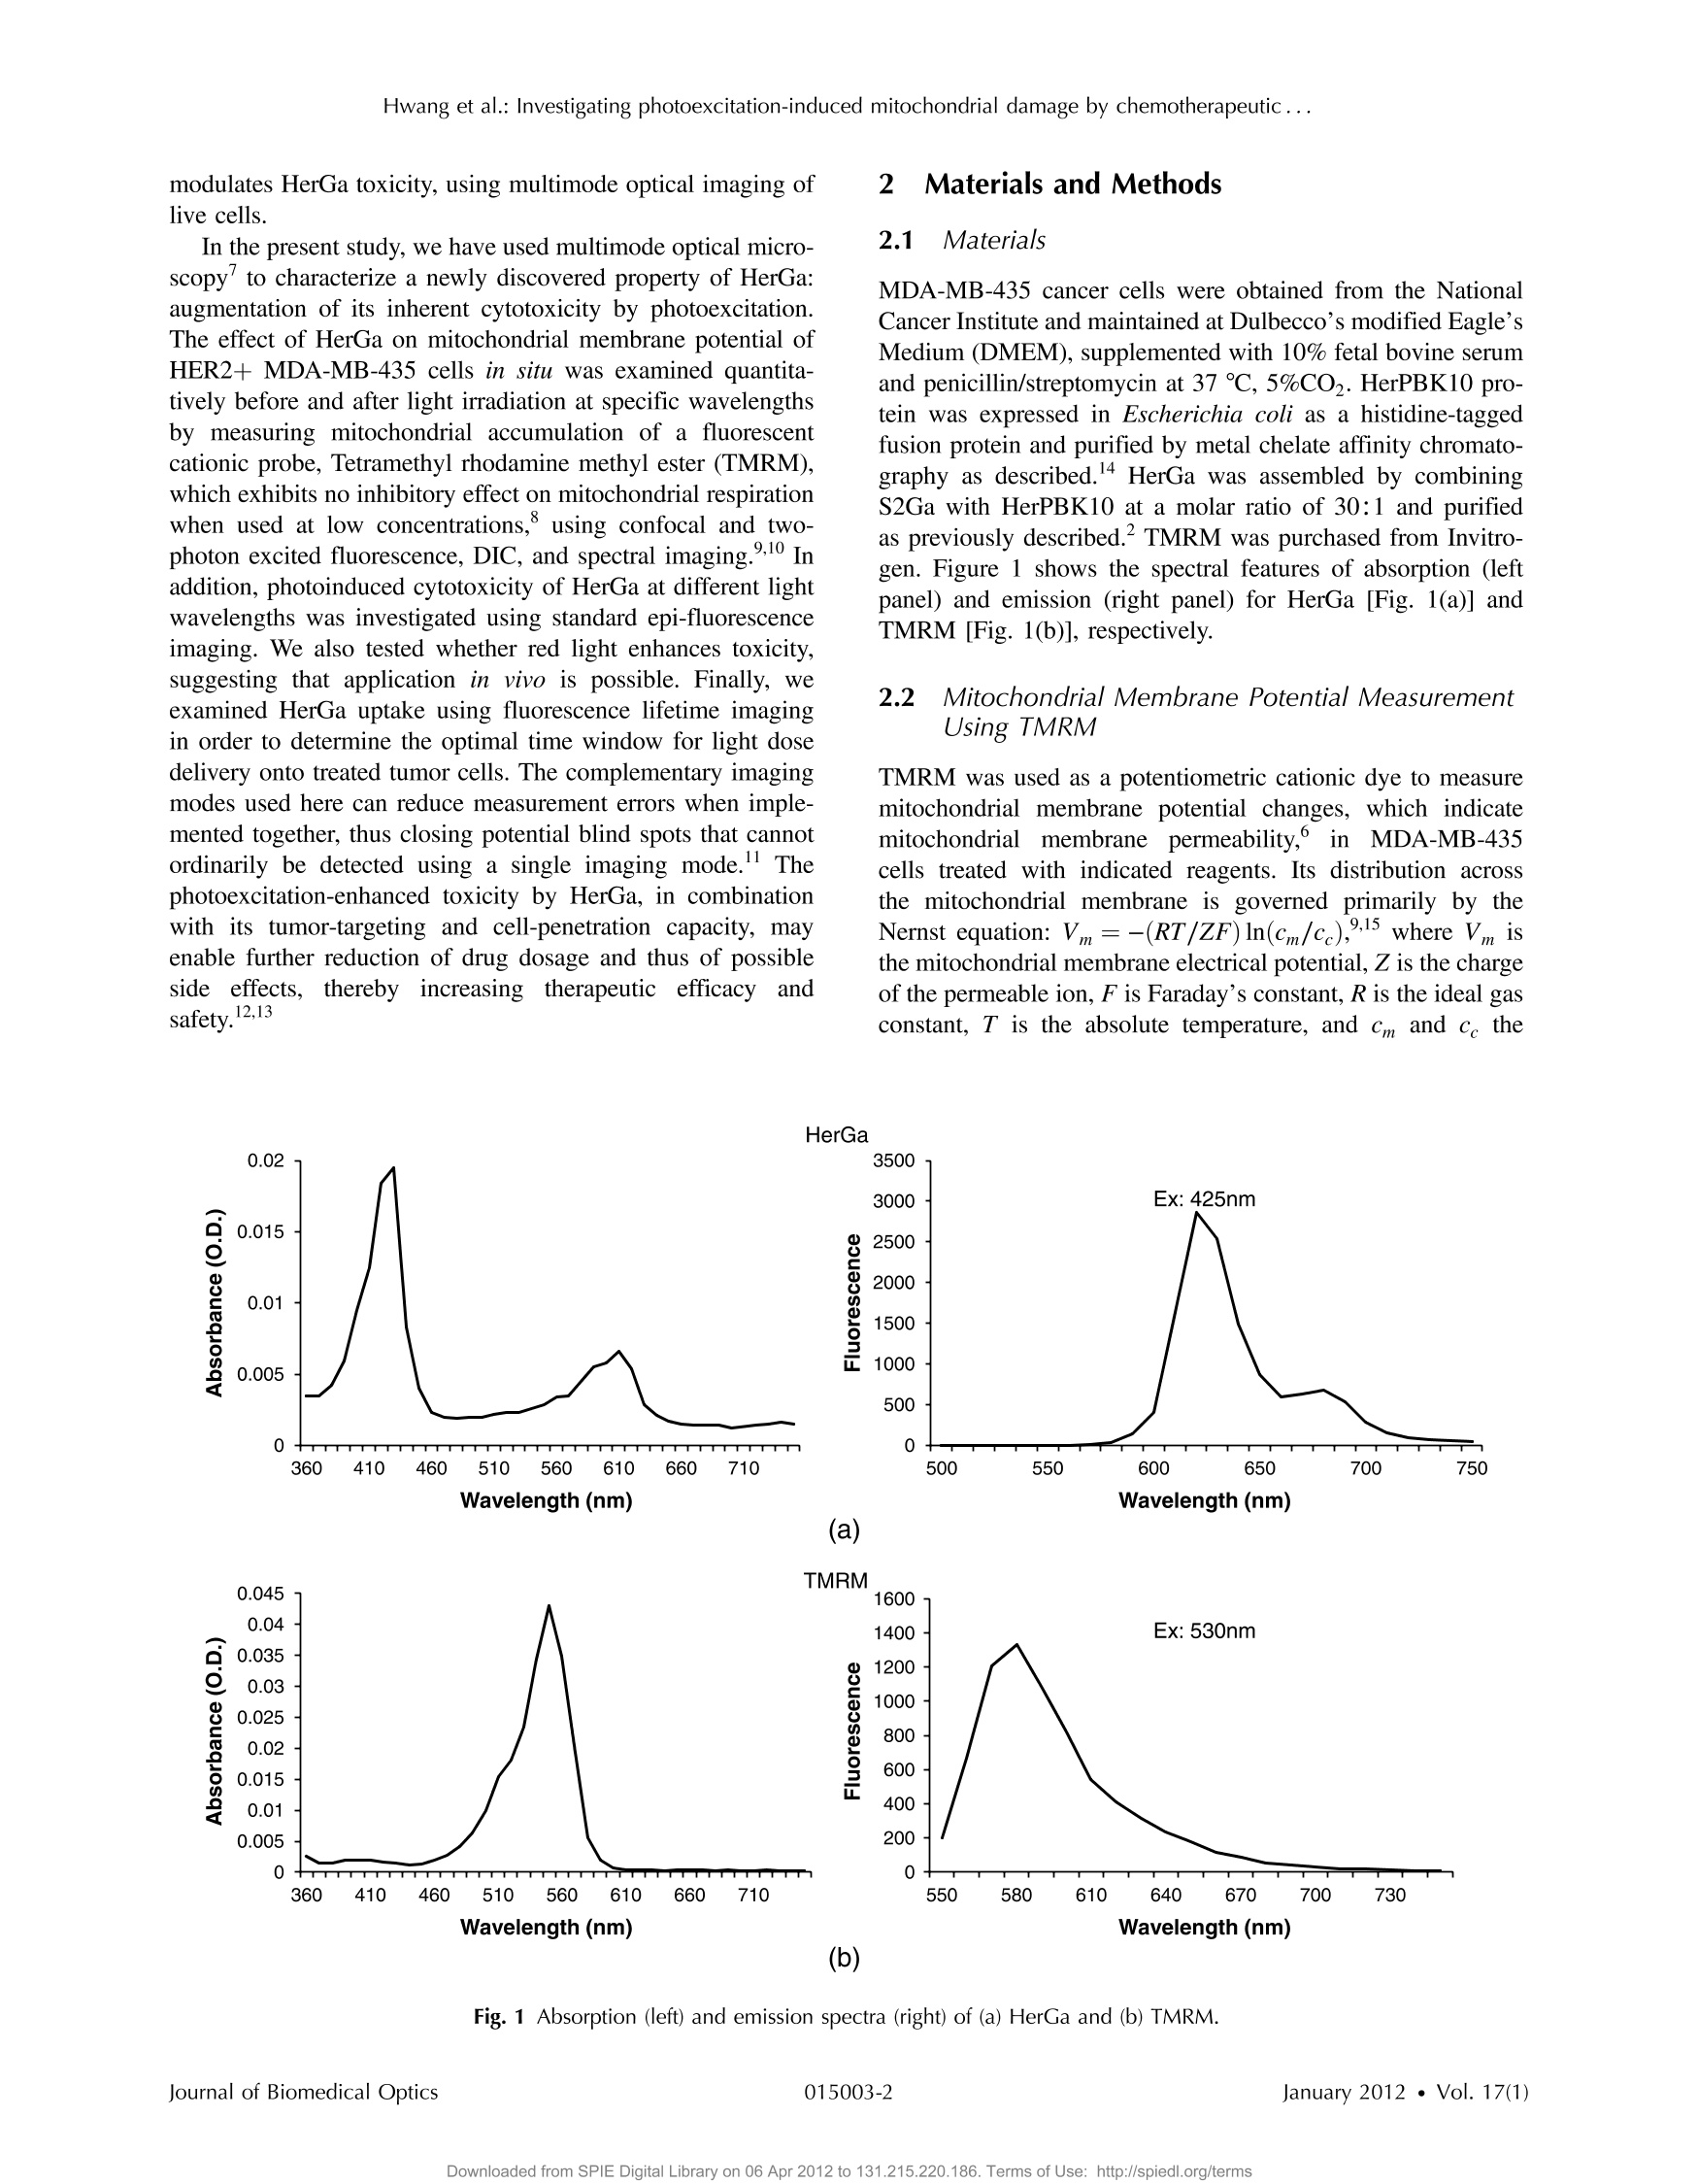
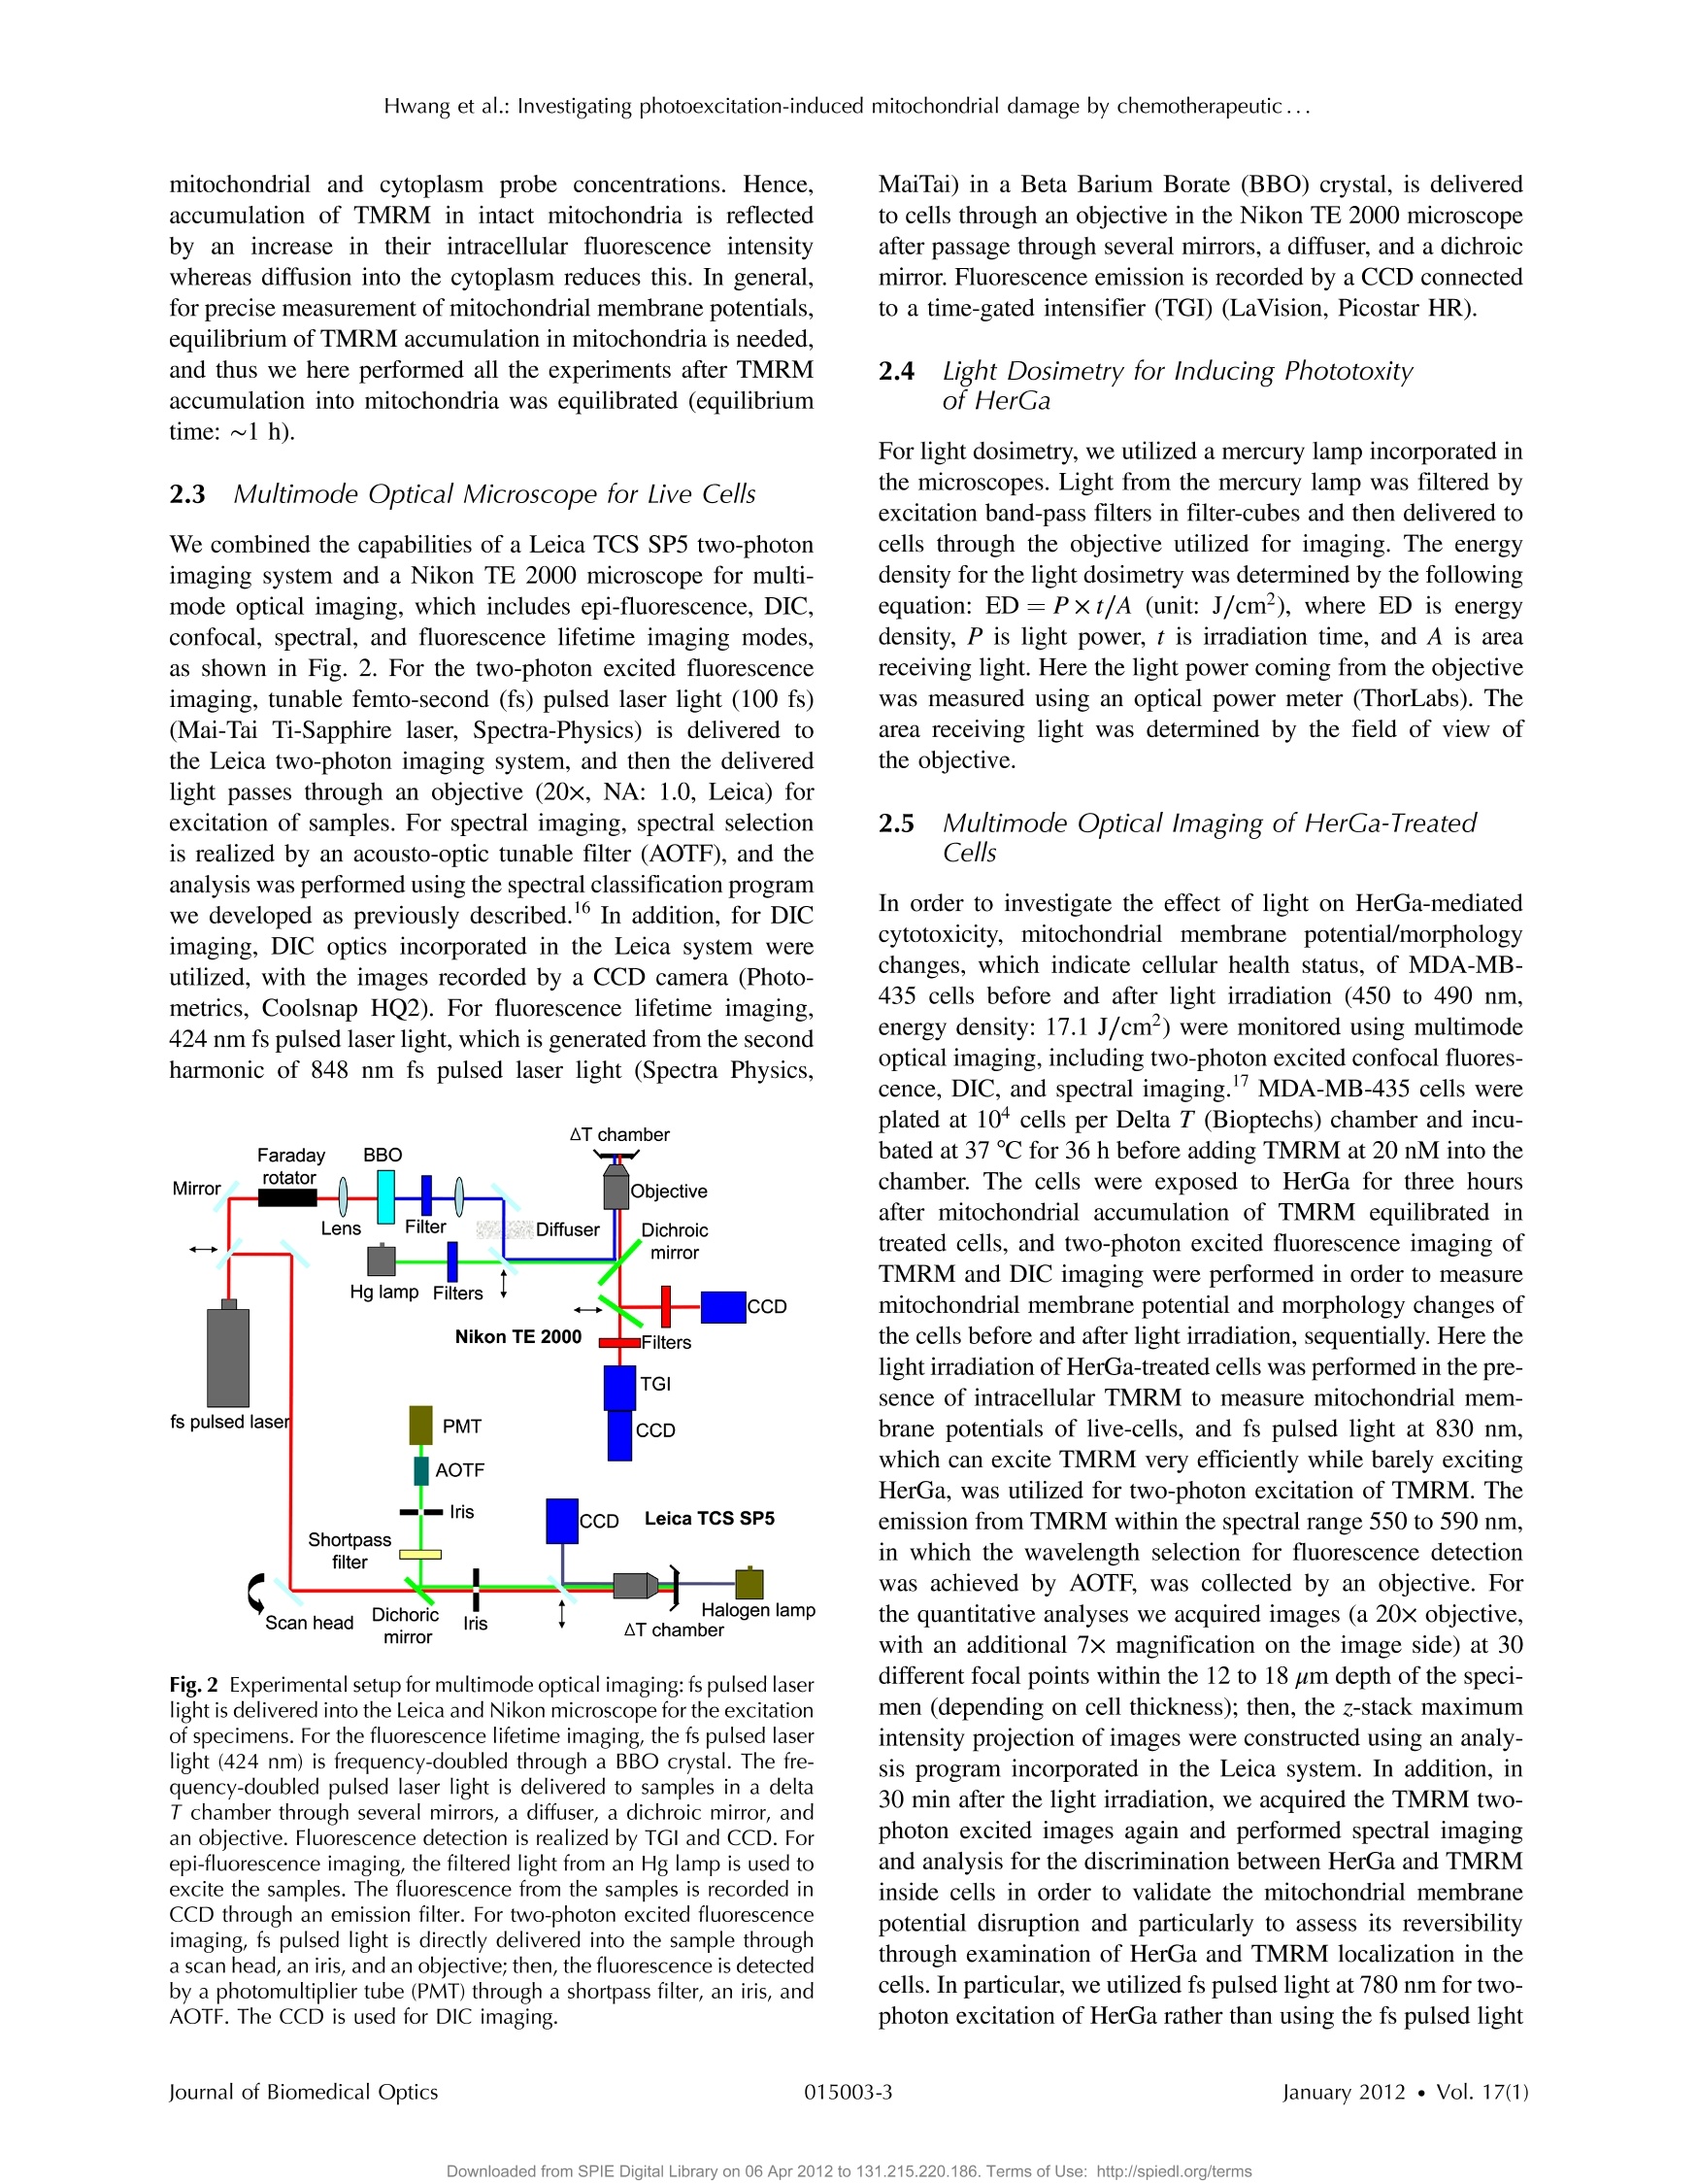
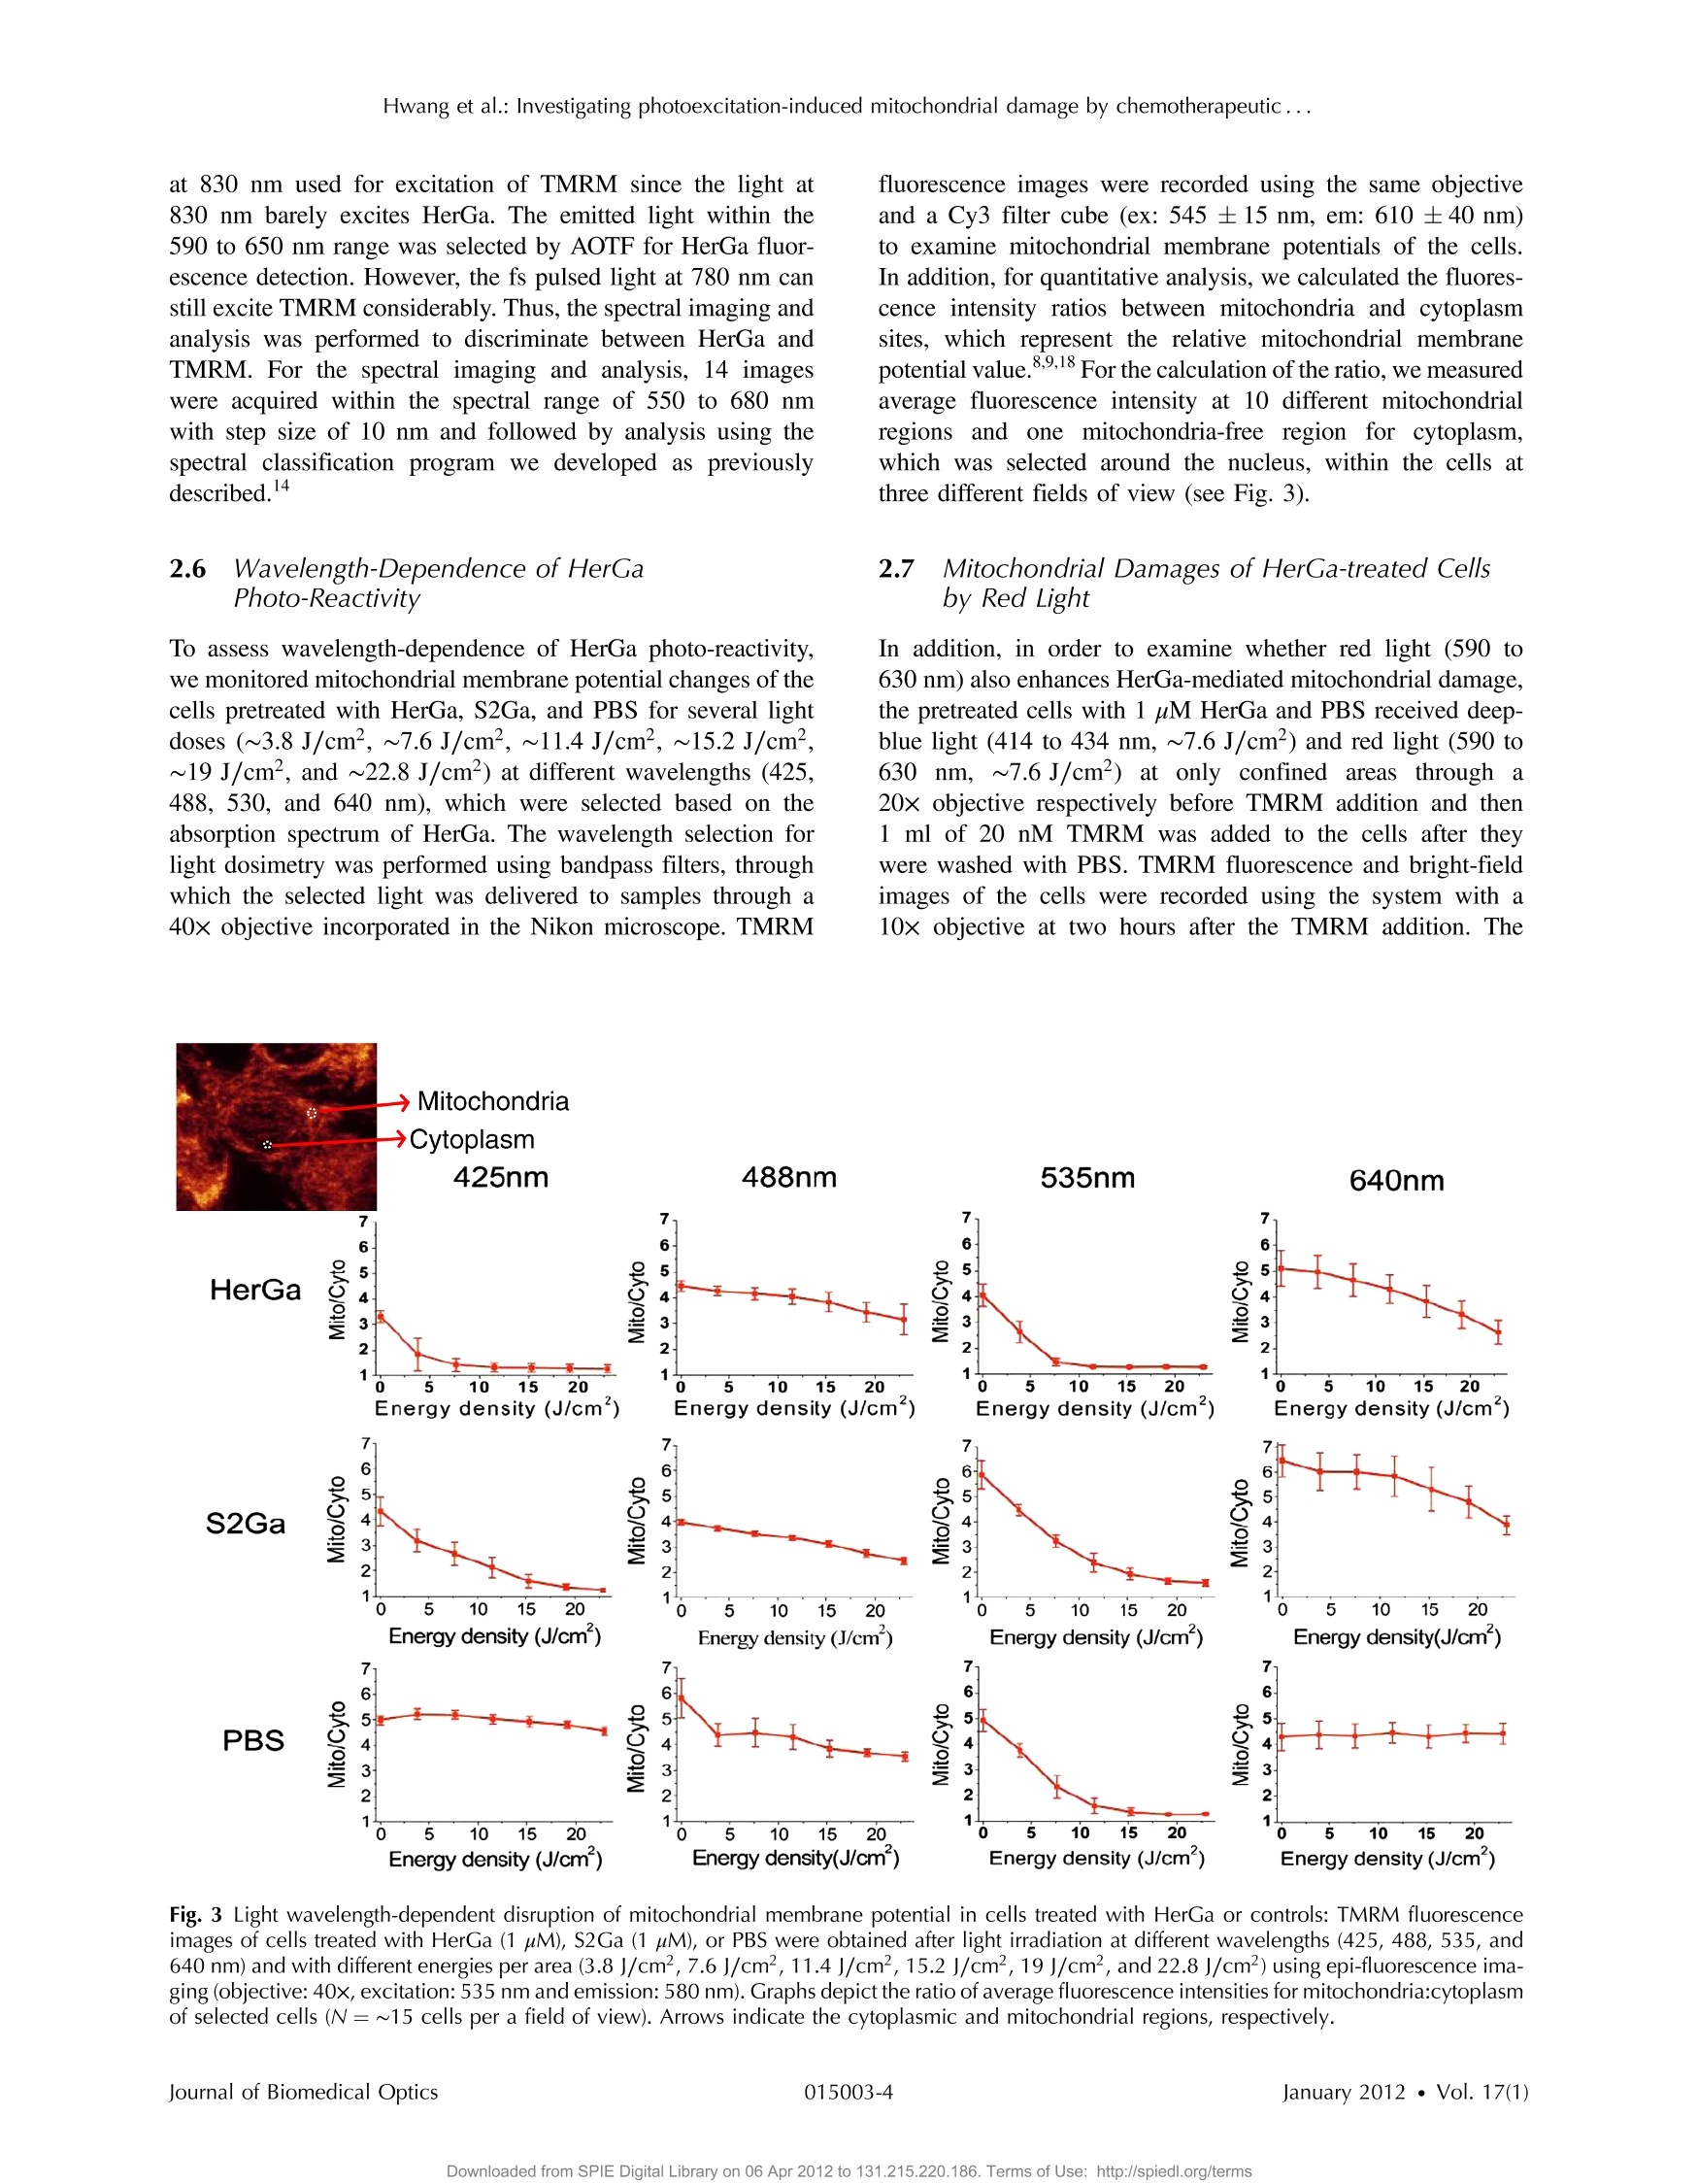
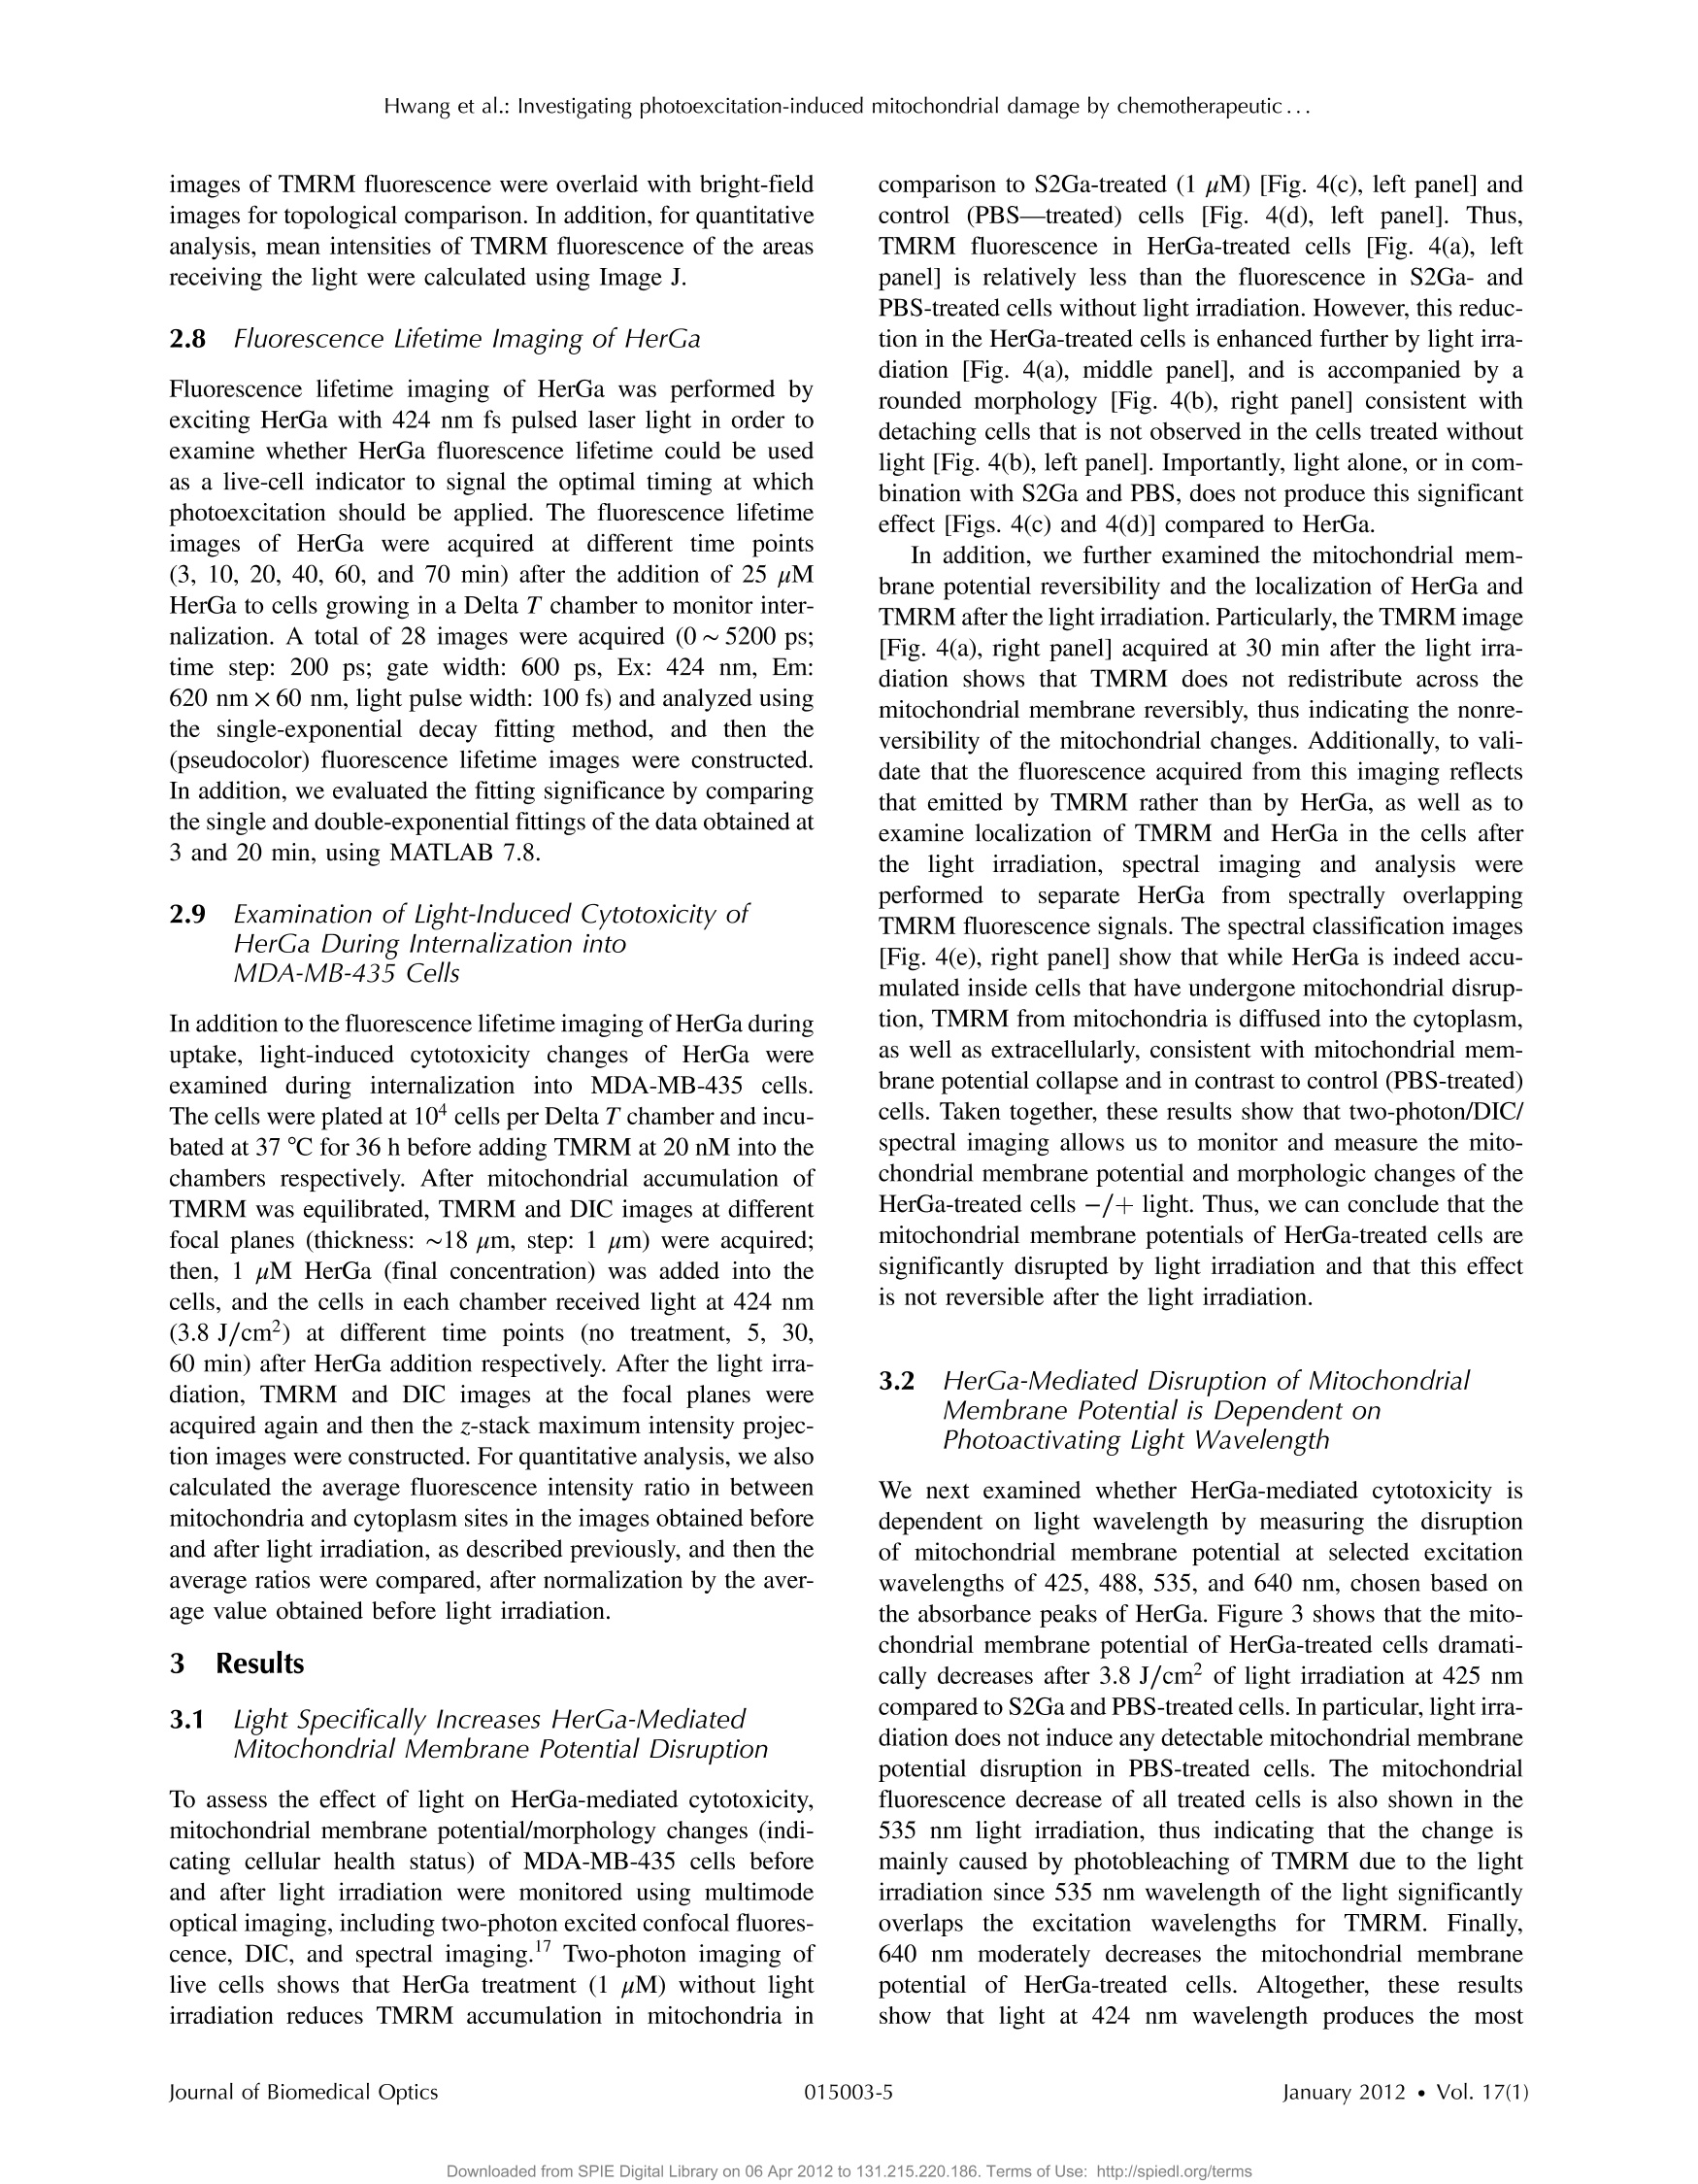
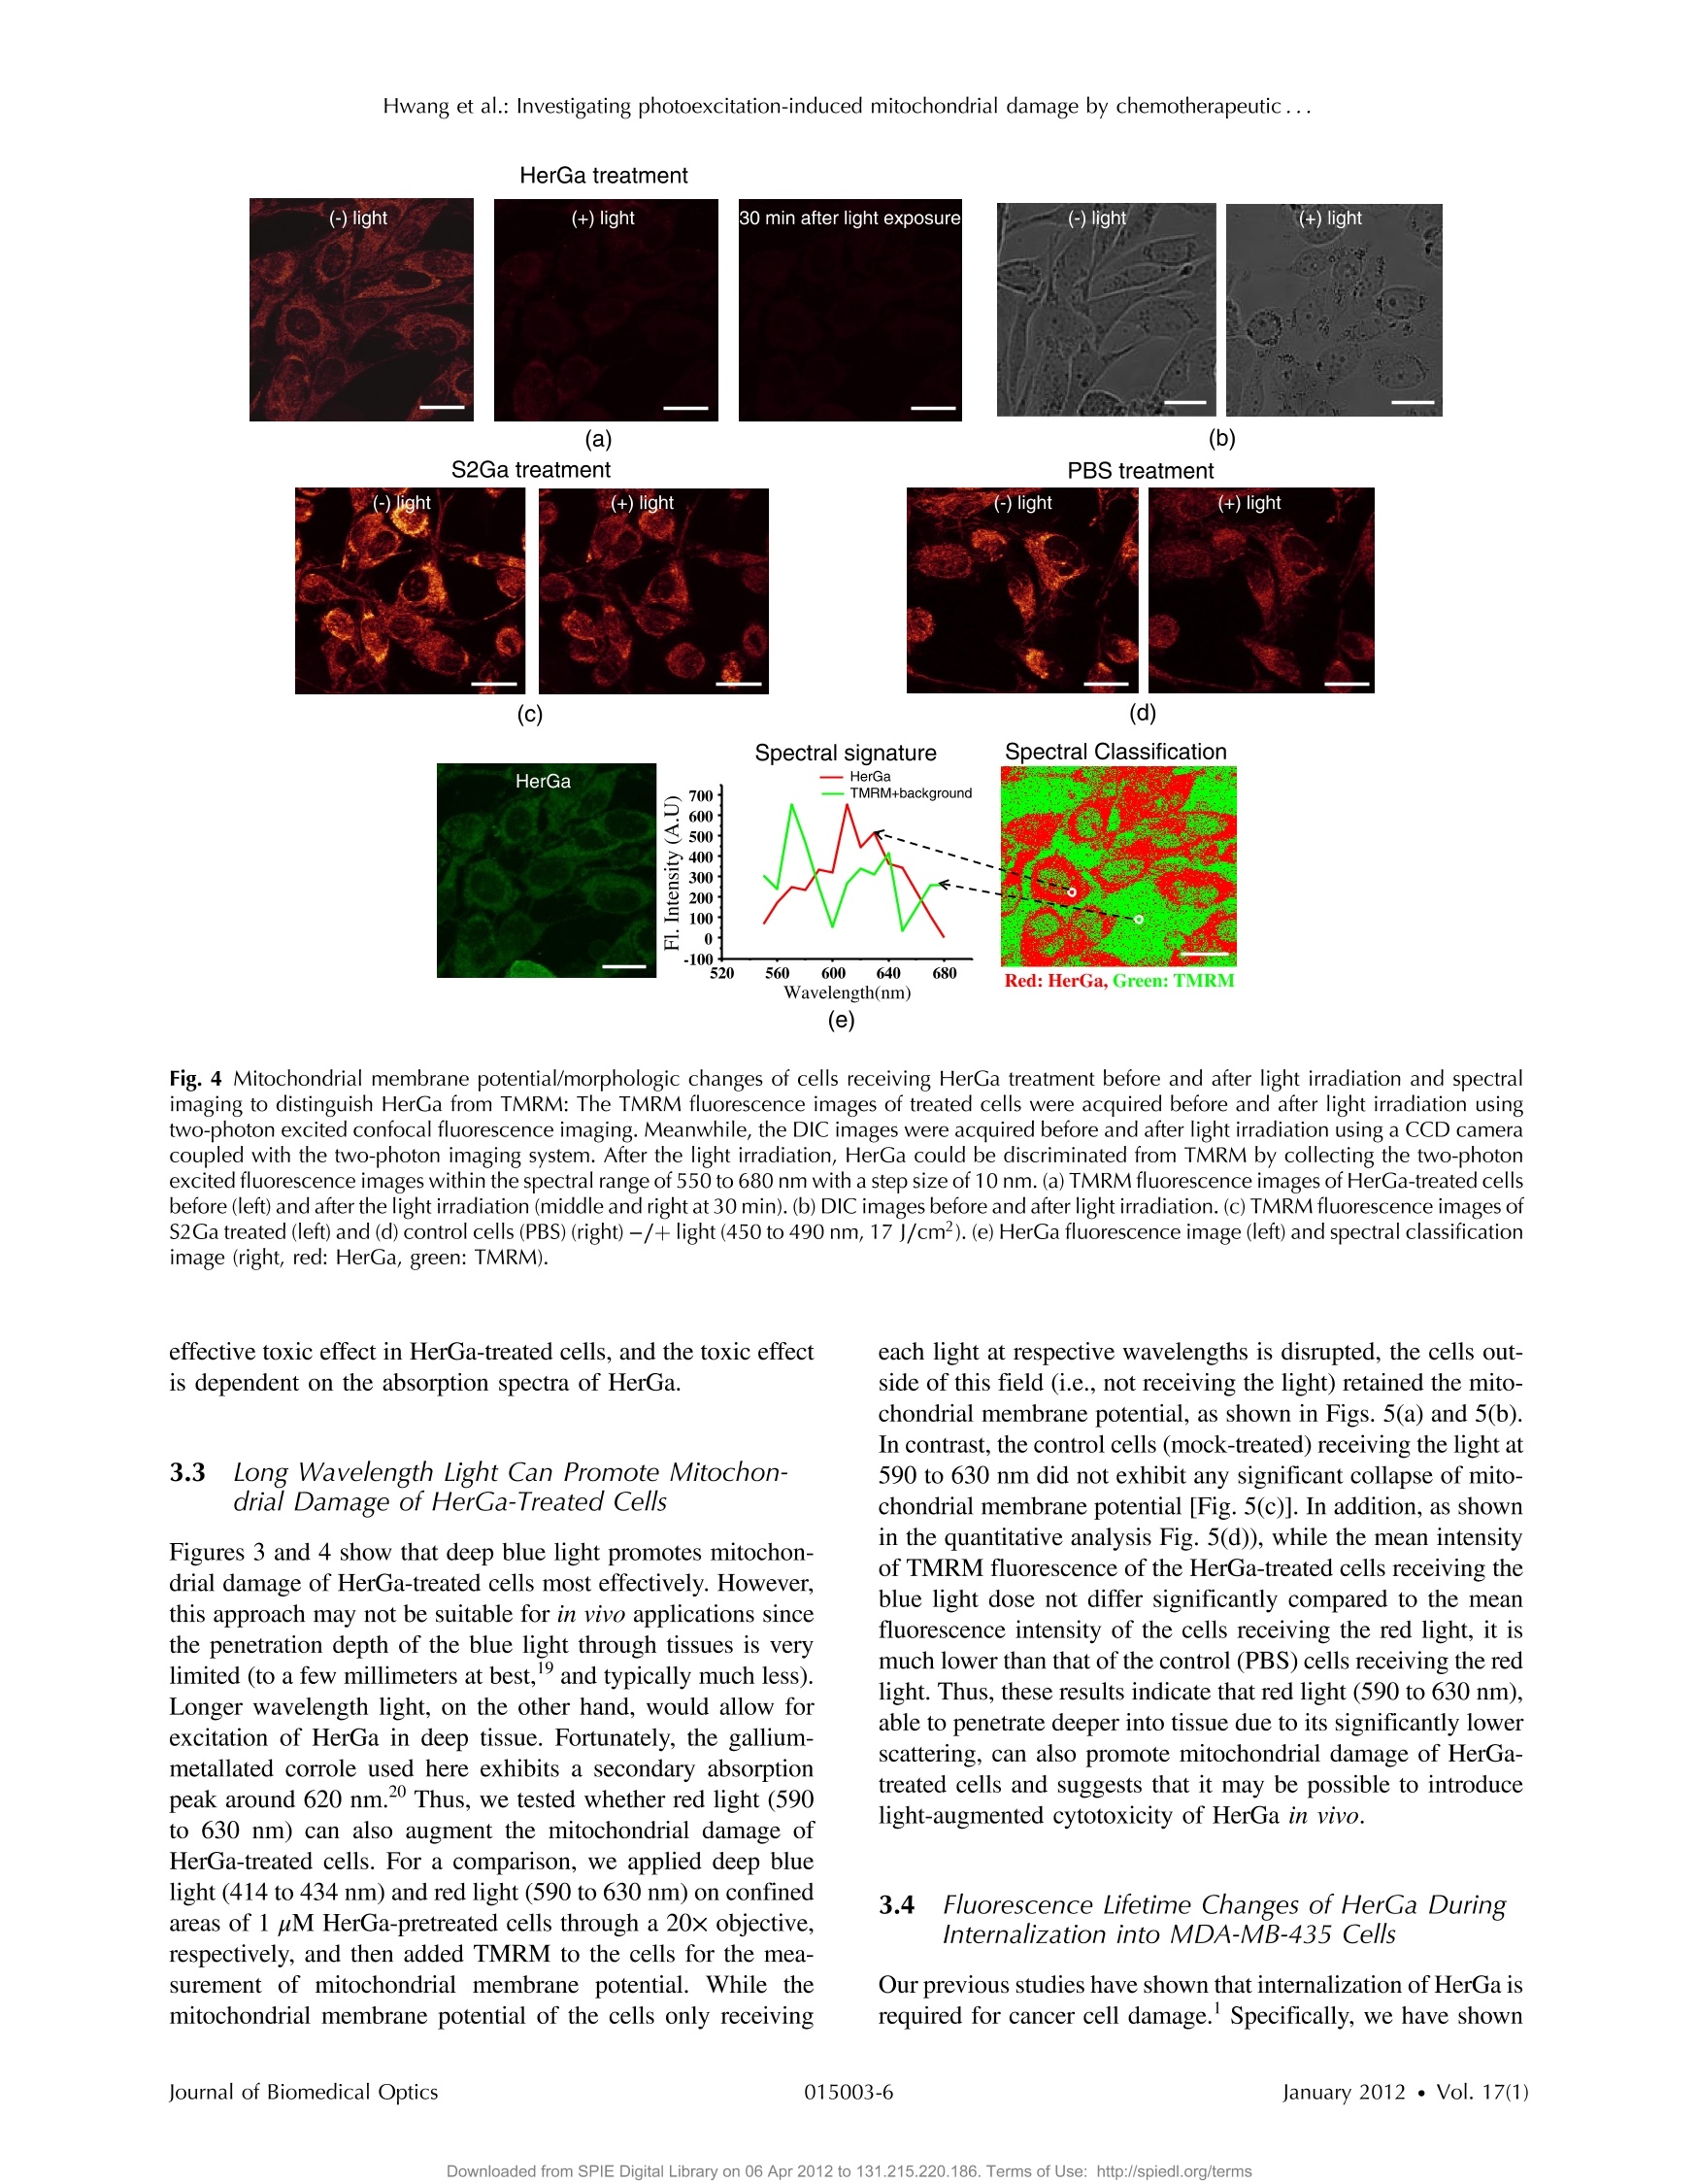
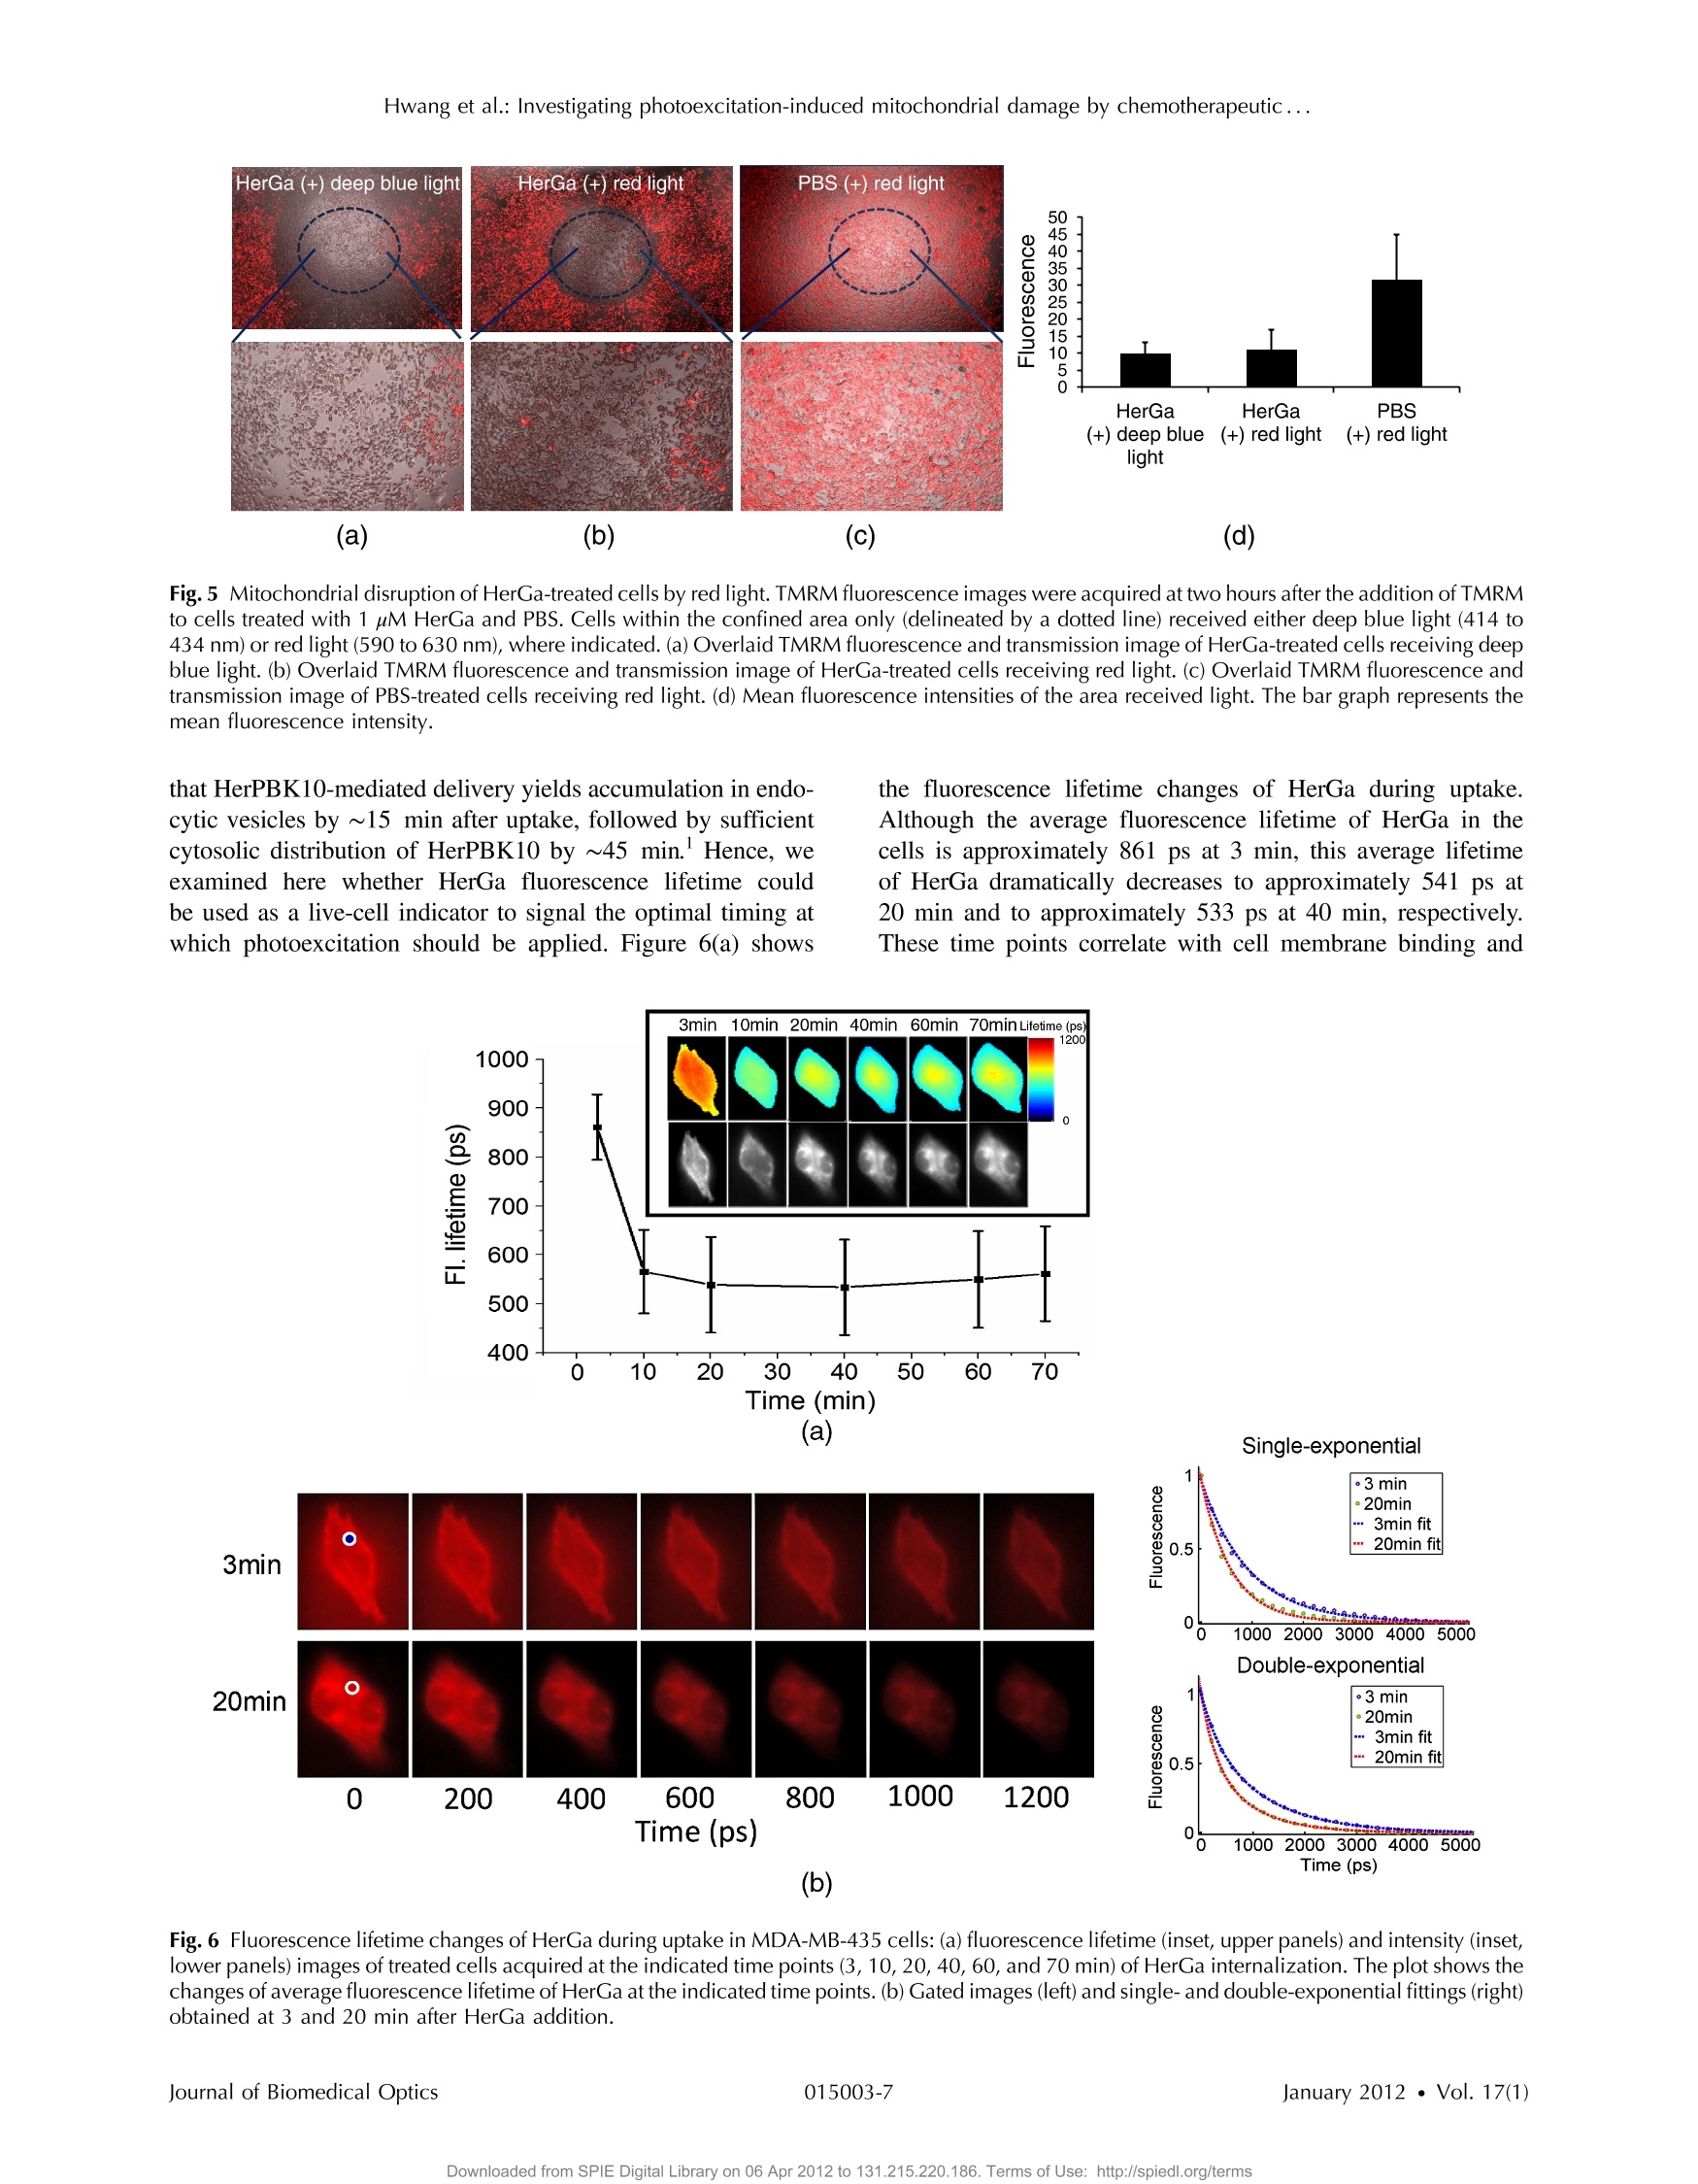
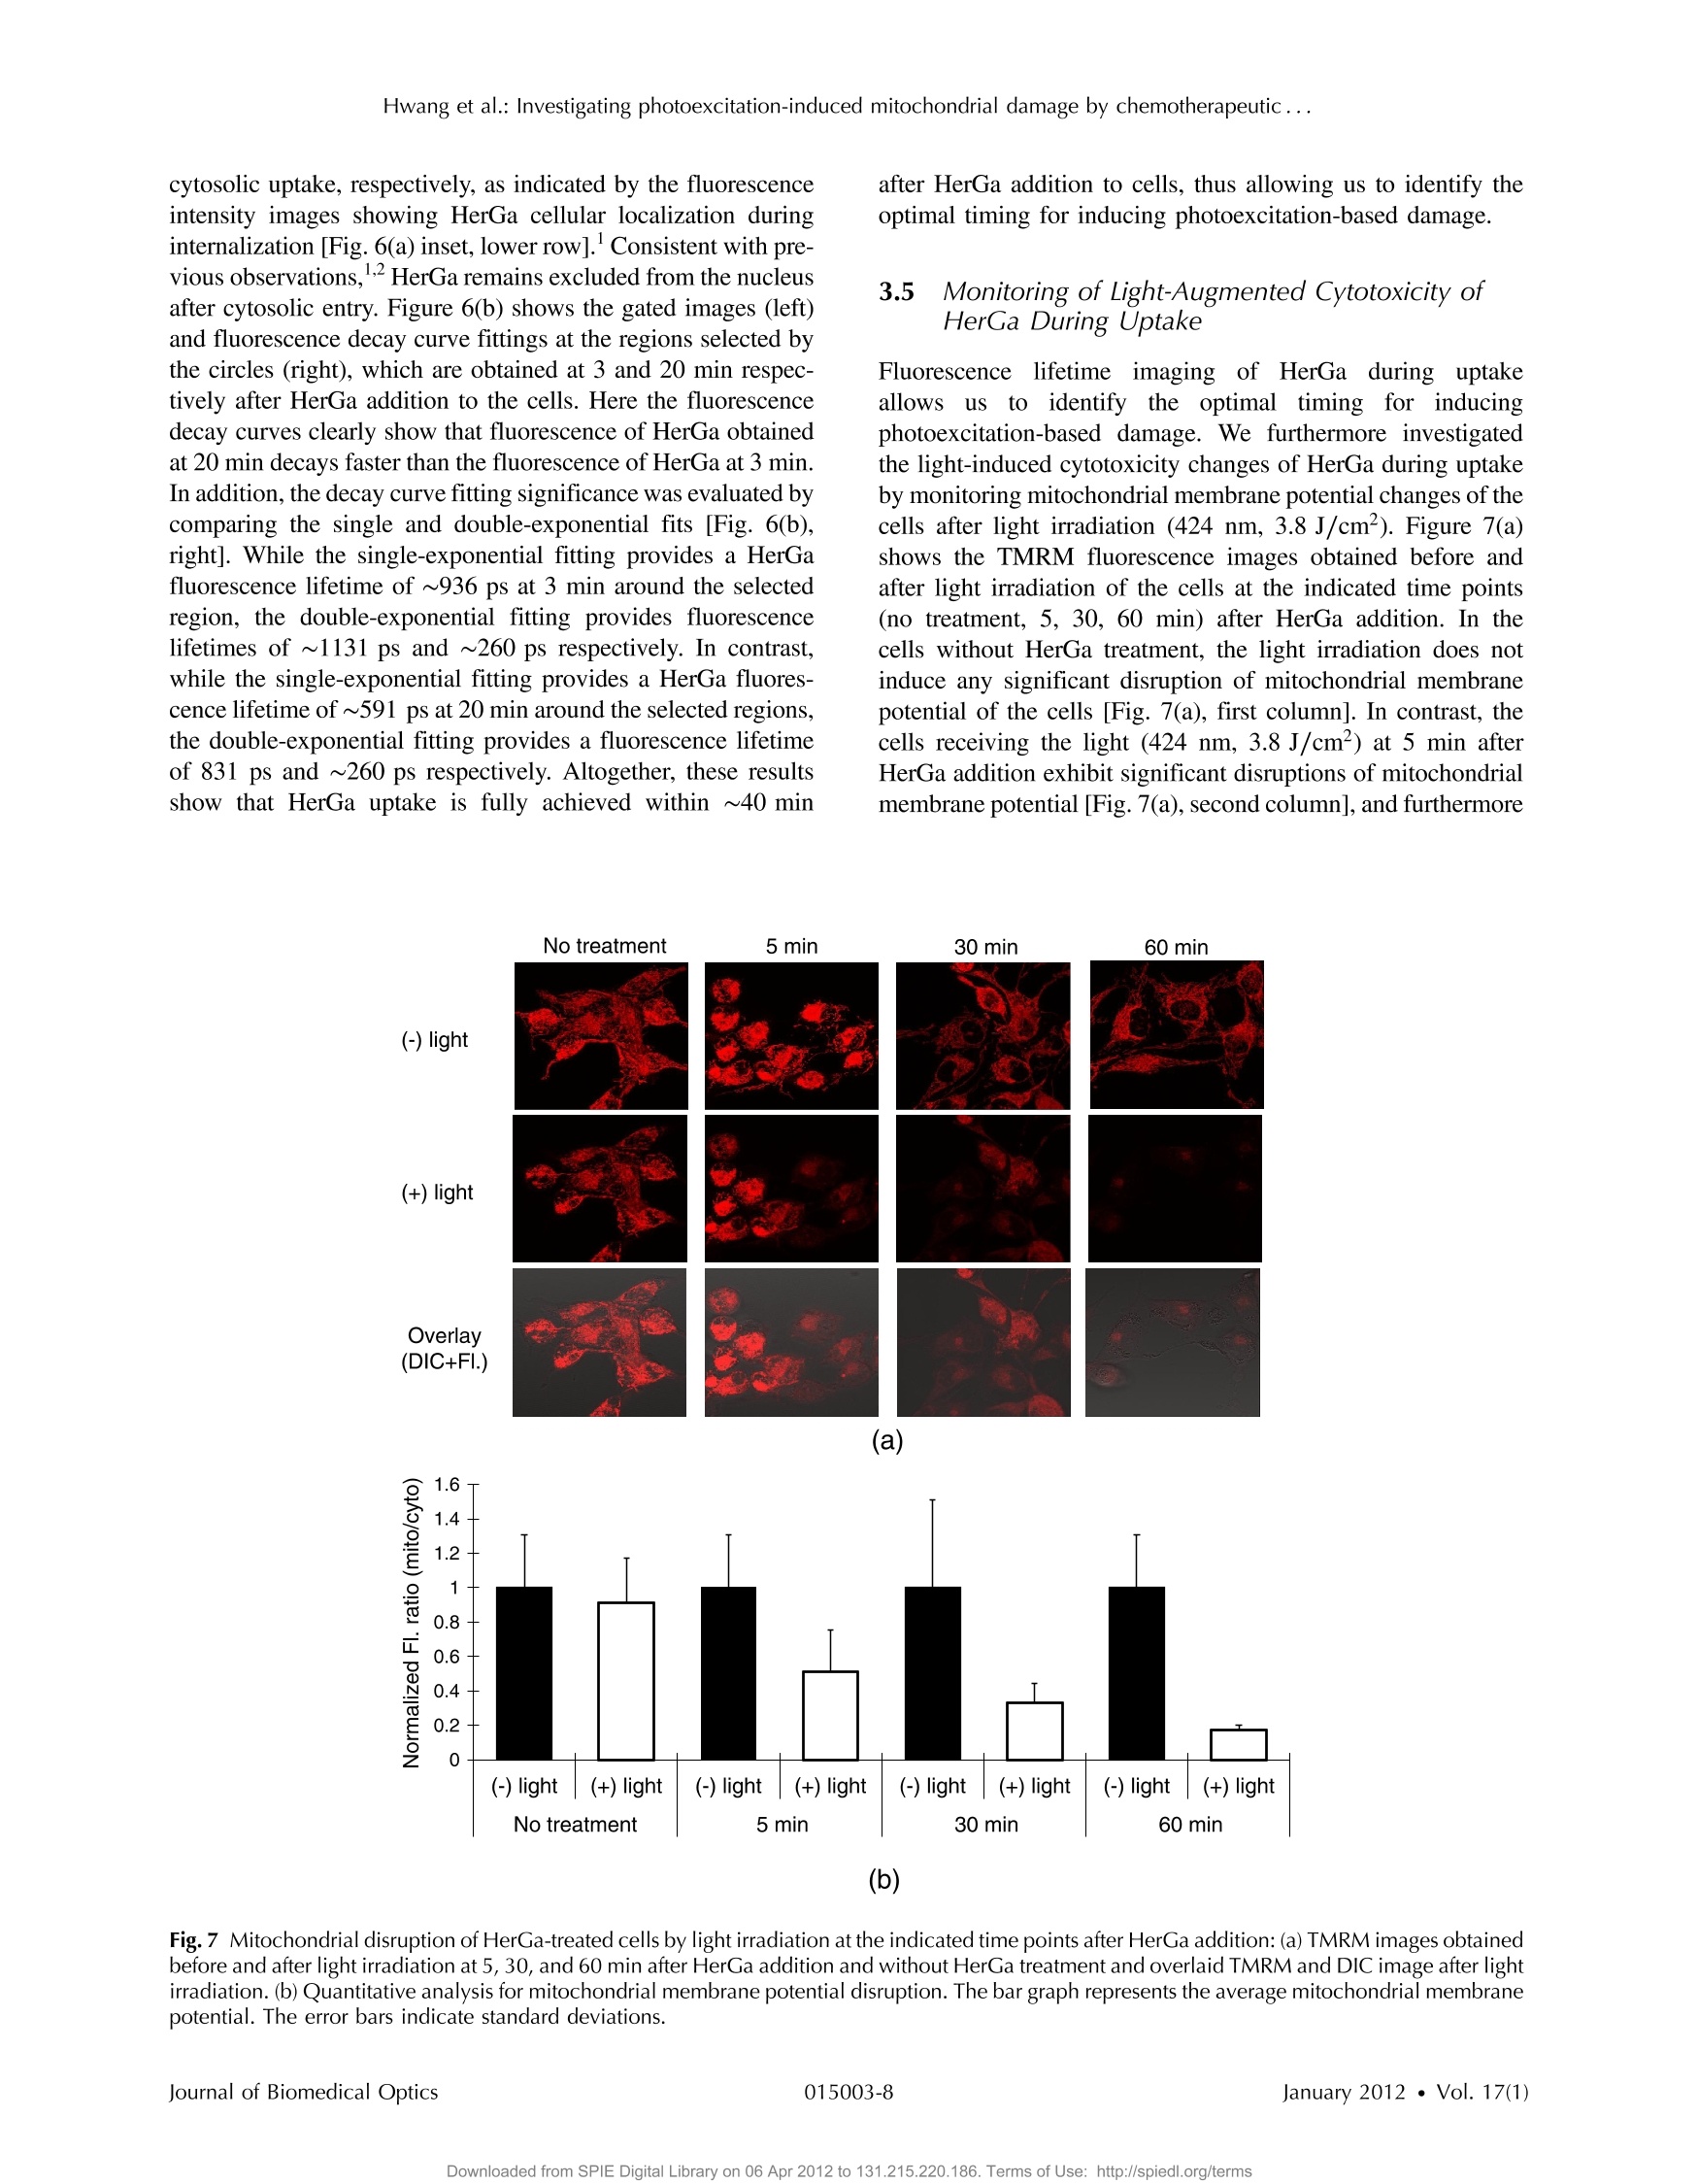
Journal of Biomedical Optics 17(1), 015003 (January 2012) Hwang et al.: Investigating photoexcitation-induced mitochondrial damage by chemotherapeutic ... Biomedical Optic SPIEDigitalLibrary.org/jbo oogo goo 。 。 Investigating photoexcitation-inducedmitochondrial damage bychemotherapeutic corroles usingmultimode optical imaging Jae Youn Hwang David J. Lubow Jessica D. Sims Harry B. Gray Atif Mahammed Zeev Gross Lali K. Medina-Kauwe Daniel L. Farkas Investigating photoexcitation-induced mitochondrialdamage by chemotherapeutic corroles usingmultimode optical imaging Jae Youn Hwanga David j. Lubow, Jessica D. Sims, Harry B. Gray, Atif Mahammed, Zeev Gross,d Lali K. Medina-Kauwe,e and Daniel L. Farkasa,bfg aMinimally Invasive Surgical Technologies Institute, Cedars-Sinai Medical Center, 8700 Beverly Boulevard D6061, Los Angeles, California 90048"Department of Biomedical Sciences, Cedars-Sinai Medical Center, 8700 Beverly Boulevard D3059, Los Angeles, California 90048Beckman Institute, California Institute of Technology, Pasadena, California 91125 Technion-Israel Institute of Technology, Schulish Faculty of Chemistry, Haifa 32000, Israel University of California Los Angeles Geffen School of Medicine, Department of Medicine, Los Angeles, California 90048 University of Southern California, Department of Biomedical Engineering, , Los Angeles, California 90089 8Spectral Molecular Imaging, Inc., Beverly Hills, California 90211 Abstract. We recently reported that a targeted, brightly fluorescent gallium corrole (HerGa) is highly effective forbreast tumor detection and treatment. Unlike structurally similar porphryins, HerGa exhibits tumor-targeted toxicitywithout the need for photoexcitation. We have now examined whether photoexcitation further modulates HerGatoxicity, using multimode optical imaging of live cells, including two-photon excited fluorescence, differential inter-ference contrast (DIC), spectral, and lifetime imaging. Using two-photon excited fluorescence imaging, weobserved that light at specific wavelengths augments the HerGa-mediated mitochondrial membrane potentialdisruption of breast cancer cells in situ. In addition, DIC, spectral, and fluorescence lifetime imaging enabledus to both validate cell damage by HerGa photoexcitation and investigate HerGa internalization, thus allowingoptimization of light dose and timing. Our demonstration of HerGa phototoxicity opens the way for developmentof new methods of cancer intervention using tumor-targeted corroles. o 2012 Society of Photo-Optical Instrumentation Engineers(SPIE). [DOI: 10.1117/1.JBO.17.1.015003] Keywords: multimode optical imaging; spectral; FLIM; gallium corrole; two-photon excitation; mitochondrial membrane potential;photoexcitation. Paper 11395P received Jul. 22, 2011; revised manuscript received Nov. 7, 2011; accepted for publication Nov. 8, 2011; published onlineFeb. 6,2012. 1Introduction Nanotherapy is one of the newest and most promisingapproaches for cancer treatment. Currently, significant effortsare focused on development of novel tumor-targeted drugmolecules, capable of simultaneous diagnosis and treatmentby incorporating active molecules, targeting ligands, and ima-ging agents. We have recently developed a novel tumor-targeteddrug molecule, which is a single self-assembled complexbetween a targeted cell penetration protein (HerPBK10) anda sulfonated gallium(III) corrole (S2Ga), for breast cancer treat-ment and detection.-3 This targeted complex (called HerGa)results from spontaneous, noncovalent assembly of S2Ga andHerPBK10 and remains stably intact in serum after assembly.S2Ga, in which gallium(III) is chelated by the amphipolar corrole whose macrocycle is decorated by two sulphonic acid headgroups, has structural similarity to porphyrins. It not only emitsvery intense red fluorescence but also is cytotoxic when allowedto penetrate through a cell membrane.2HerPBK10, used as acarrier protein for the complex, contains moieties for DNAtransport and targeted delivery to human epidermal growth fac-tor receptor 2-positive (HER2+) cancer cells. It binds DNAthrough a polylysine appendage while the EGF-like domain ( Address all correspondence to: Daniel L. F a rkas, S p ectral Molecular Imaging, I nc . , 250 N . R obertson B lvd., Suite 427, Beverly Hills , CA 90211. Tel: 3 10 600 7102; Fax: 31 0 858 1699;E- m a i l: dlfarkas@gmail.com ) of the heregulin-alpha isoform is used as the targeting ligand.Thus, HerPBK10 specifically targets HER2+ tumor cells, par-ticularly MDA-MB-435 cells, in a receptor-specific manner andmediates the entry of targeting molecules in the HER2+ cancercells. Hence, when S2Ga is assembled with our HerPBK10,S2Ga can be targeted to and internalized by HER2+ tumorcells, resulting in tumor-targeted toxicity. Importantly, sinceS2Ga alone, which is negative charged, is less able to breacha cell membrane without the membrane-penetrating HerPBK10protein, HerGa is specifically toxic to target cells at 1 uM con-centration whereas S2Ga is less toxic to target cells at the sameconcentration.Moreover, tumor targeting by HerGa can be read-ily visualized optically, owing to intense corrole fluorescence.Hence, HerGa can be used for both tumor detection andintervention.1,5 Our previous mechanistic study for HerGa showed thatHerGa itself damages mitochondria of MDA-MB-435 cancercells through induction of reactive oxygen species (ROS). Inparticular, HerGa disrupts mitochondrial membrane potentialsin cells, indicating increased mitochondrial membrane perme-ability. In this study we have also observed, for the firsttime, that light at specific wavelengths promotes this disruptionof mitochondrial membrane potential in HerGa-treated cells.Thus, we here tested whether such photoexcitation further modulates HerGa toxicity, using multimode optical imaging oflive cells In the present study, we have used multimode optical micro-scopy’to characterize a newly discovered property of HerGa:augmentation of its inherent cytotoxicity by photoexcitation.The effect of HerGa on mitochondrial membrane potential ofHER2+ MDA-MB-435 cells in situ was examined quantita-tively before and after light irradiation at specific wavelengthsby measuring mitochondrial accumulation of a fluorescentcationic probe, Tetramethyl rhodamine methyl ester (TMRM),which exhibits no inhibitory effect on mitochondrial respirationwhen used at low concentrations, using confocal and two-photon excited fluorescence, DIC, and spectral imaging.910 Inaddition, photoinduced cytotoxicity of HerGa at different lightwavelengths was investigated using standard epi-fluorescenceimaging. We also tested whether red light enhances toxicity,suggesting that application in vivo is possible. Finally, weexamined HerGa uptake using fluorescence lifetime imagingin order to determine the optimal time window for light dosedelivery onto treated tumor cells. The complementary imagingmodes used here can reduce measurement errors when imple-mented together, thus closing potential blind spots that cannotordinarily be detected using a single imaging mode." Thephotoexcitation-enhanced toxicity by HerGa, in combinationwith its tumor-targeting and cell-penetration capacity, mayenable further reduction of drug dosage and thus of possibleside effects, tthereby increasingtherapeutic efficacy andsafety.12.13 2 Materials and Methods 2.1 Materials MDA-MB-435 cancer cells were obtained from the NationalCancer Institute and maintained at Dulbecco’s modified Eagle’sMedium (DMEM), supplemented with 10% fetal bovine serumand penicillin/streptomycin at 37 ℃,5%CO2. HerPBK10 pro-tein was expressed in Escherichia coli as a histidine-taggedfusion protein and purified by metal chelate affinity chromato-graphy as described.4 HerGa was assembled by combiningS2Ga with HerPBK10 at a molar ratio of 30:1 and purifiedas previously described.TMRM was purchased from Invitro-gen. Figure 1 shows the spectral features of absorption (leftpanel) and emission (right panel) for HerGa [Fig. 1(a)] andTMRM [Fig. 1(b)], respectively. 2.2 Mitochondrial Membrane Potential MeasurementUsing TMRM TMRM was used as a potentiometric cationic dye to measuremitochondrial membrane potential changes, which indicatemitochondriall membrane permeability, in ]MDA-MB-435cells treated with indicated reagents. Its distribution acrossthe mitochondrial membrane is governed primarily by theNernst equation: V=-(RT/ZF)In(Cm/cc),9,15 where V isthe mitochondrial membrane electrical potential, Z is the chargeof the permeable ion, F is Faraday’s constant, R is the ideal gasconstant, T is the absolute temperature, and cm and c the HerGa (b) Fig. 1 Absorption (left) and emission spectra (right) of (a) HerGa and (b) TMRM. mitochondrial and cytoplasm probe concentrations. Hence,accumulation of TMRM in intact mitochondria is reflectecby an increase in their intracellular fluorescence intensitywhereas diffusion into the cytoplasm reduces this. In general,for precise measurement of mitochondrial membrane potentials,equilibrium of TMRM accumulation in mitochondria is needed,and thus we here performed all the experiments after TMRMaccumulation into mitochondria was equilibrated (equilibriumtime:~1 h). 2.3 Multimode Optical Microscope for Live Cells We combined the capabilities of a Leica TCS SP5 two-photonimaging system and a Nikon TE 2000 microscope for multi-mode optical imaging, which includes epi-fluorescence, DIC,confocal, spectral, and fluorescence lifetime imaging modes,as shown in Fig. 2. For the two-photon excited fluorescenceimaging, tunable femto-second (fs) pulsed laser light (100 fs)(Mai-Tai Ti-Sapphire laser, Spectra-Physics) is delivered tothe Leica two-photon imaging system, and then the deliveredlight passes through an objective (20x, NA: 1.0, Leica) forexcitation of samples. For spectral imaging, spectral selectionis realized by an acousto-optic tunable filter (AOTF), and theanalysis was performed using the spectral classification programwe developed as previously described.In addition, for DICimaging, DIC optics incorporated in the Leica system wereutilized, with the images recorded by a CCD camera (Photo-metrics, Coolsnap HQ2). For fluorescence lifetime imaging,424 nm fs pulsed laser light, which is generated from the secondharmonic of 848 nm fs pulsed laser light (Spectra Physics. Fig.2 Experimental setup for multimode optical imaging: fs pulsed laserlight is delivered into the Leica and Nikon microscope for the excitationof specimens. For the fluorescence lifetime imaging, the fs pulsed laserlight (424 nm) is frequency-doubled through a BBO crystal. The fre-quency-doubled pulsed laser light is delivered to samples in a deltaT chamber through several mirrors, a diffuser, a dichroic mirror, andan objective. Fluorescence detection is realized by TGl and CCD. Forepi-fluorescence imaging, the filtered light from an Hg lamp is used toexcite the samples. The fluorescence from the samples is recorded inCCD through an emission filter. For two-photon excited fluorescenceimaging, fs pulsed light is directly delivered into the sample throughascan head, an iris, and an objective; then, the fluorescence is detectedby a photomultiplier tube (PMT) through a shortpass filter, an iris, andAOTF. The CCD is used for DIC imaging. MaiTai) in a Beta Barium Borate (BBO) crystal, is deliveredto cells through an objective in the Nikon TE 2000 microscopeafter passage through several mirrors, a diffuser, and a dichroicmirror. Fluorescence emission is recorded by a CCD connectedto a time-gated intensifier (TGI) (LaVision, Picostar HR). 2.4 Light Dosimetry for Inducing Phototoxityof HerGa For light dosimetry, we utilized a mercury lamp incorporated inthe microscopes. Light from the mercury lamp was filtered byexcitation band-pass filters in filter-cubes and then delivered tocells through the objective utilized for imaging. The energydensity for the light dosimetry was determined by the followingequation: ED=P×t/A (unit: J/cm²), where ED is energydensity, P is light power, t is irradiation time, and A is areareceiving light. Here the light power coming from the objectivewas measured using an optical power meter (ThorLabs). Thearea receiving light was determined by the field of view ofthe objective. 2.5 Multimode Optical Imaging of HerGa-TreatedCells In order to investigate the effect of light on HerGa-mediatedcytotoxicity, mitochondrial membrane potential/morphologychanges, which indicate cellular health status, of MDA-MB-435 cells before and after light irradiation (450 to 490 nm,energy density: 17.1 J/cm²) were monitored using multimodeoptical imaging, including two-photon excited confocal fluores-cence, DIC, and spectral imaging."MDA-MB-435 cells wereplated at 104 cells per Delta T (Bioptechs) chamber and incu-bated at 37℃ for 36 h before adding TMRM at 20 nM into thechamber. The cells were exposed to HerGa for three hoursafter mitochondrial accumulation of TMRM equilibrated intreated cells, and two-photon excited fluorescence imaging ofTMRM and DIC imaging were performed in order to measuremitochondrial membrane potential and morphology changes ofthe cells before and after light irradiation, sequentially. Here thelight irradiation of HerGa-treated cells was performed in the pre-sence of intracellular TMRM to measure mitochondrial mem-brane potentials of live-cells, and fs pulsed light at 830 nm,which can excite TMRM very efficiently while barely excitingHerGa, was utilized for two-photon excitation of TMRM. Theemission from TMRM within the spectral range 550 to 590 nm,in which the wavelength selection for fluorescence detectionwas achieved by AOTF, was collected by an objective. Forthe quantitative analyses we acquired images (a 20x objective,with an additional 7x magnification on the image side) at 30different focal points within the 12 to 18 um depth of the speci-men (depending on cell thickness); then, the z-stack maximumintensity projection of images were constructed using an analy-sis program incorporated in the Leica system. In addition, in30 min after the light irradiation, we acquired the TMRM two-photon excited images again and performed spectral imagingand analysis for the discrimination between HerGa and TMRMinside cells in order to validate the mitochondrial membranepotential disruption and particularly to assess its reversibilitythrough examination of HerGa and TMRM localization in thecells. In particular, we utilized fs pulsed light at 780 nm for two-photon excitation of HerGa rather than using the fs pulsed light at 830 nm used for excitation of TMRM since the light at830 nm barely excites HerGa. The emitted light within the590 to 650 nm range was selected by AOTF for HerGa fluor-escence detection. However, the fs pulsed light at 780 nm canstill excite TMRM considerably. Thus, the spectral imaging andanalysis was performed to discriminate between HerGa andTMRM. For the spectral imaging and analysis, 14 imageswere acquired within the spectral range of 550 to 680 nmwith step size of 10 nm and followed by analysis using thespectral classification program we developed as previouslydescribed.14 2.6 Wavelength-Dependence of HerGaPhoto-Reactivity To assess wavelength-dependence of HerGa photo-reactivity,we monitored mitochondrial membrane potential changes of thecells pretreated with HerGa, S2Ga, and PBS for several lightdoses (~3.8 J/cm², ~7.6 J/cm², ~11.4 J/cm², ~15.2 J/cm²~19 J/cm, and ~22.8 J/cm) at different wavelengths (425,488, 530, and 640 nm), which were selected based on theabsorption spectrum of HerGa. The wavelength selection forlight dosimetry was performed using bandpass filters, throughwhich the selected light was delivered to samples through a40x objective incorporated in the Nikon microscope. TMRM fluorescence images were recorded using the same objectiveand a Cy3 filter cube (ex: 545 ±15 nm, em: 610 ±40 nm)to examine mitochondrial membrane potentials of the cells.In addition, for quantitative analysis, we calculated the fluores-cence intensity ratios between mitochondria and cytoplasmsites, which represent the relative mitochondrial membranepotential value.8.9,18 For the calculation of the ratio, we measuredaverage fluorescence intensity at 10 different mitochondrialregions and one mitochondria-free region for cytoplasm,which was selected around the nucleus, within the cells atthree different fields of view (see Fig. 3). 2.7 Mitochondrial Damages of HerGa-treated Cellsby Red Light In addition, in order to examine whether red light (590 to630 nm) also enhances HerGa-mediated mitochondrial damage,the pretreated cells with 1 uM HerGa and PBS received deep-blue light (414 to 434 nm, ~7.6 J/cm²) and red light (590 to630 nm, ~7.6 J/cm²) at only confined areas through a20x objective respectively before TMRM addition and then1 ml of 20 nM TMRM was added to the cells after theywere washed with PBS.TMRM fluorescence and bright-fieldimages of the cells were recorded using the system with a10× objective at two hours after the TMRM addition. The Fig. 3 Light wavelength-dependent disruption of mitochondrial membrane potential in cells treated with HerGa or controls: TMRM fluorescenceimages of cells treated with HerGa (1 pM), S2Ga (1pM), or PBS were obtained after light irradiation at different wavelengths (425, 488, 535, and640 nm) and with different energies per area (3.8 J/cm², 7.6 J/cm², 11.4 J/cm², 15.2 J/cm², 19 J/cm², and 22.8 J/cm²) using epi-fluorescence ima-ging (objective: 40x, excitation: 535 nm and emission: 580 nm).Graphs depict the ratio of average fluorescence intensities for mitochondria:cytoplasmof selected cells (N=~15 cells per a field of view). Arrows indicate the cytoplasmic and mitochondrial regions, respectively. images of TMRM fluorescence were overlaid with bright-fieldimages for topological comparison. In addition, for quantitativeanalysis, mean intensities of TMRM fluorescence of the areasreceiving the light were calculated using Image J. 2.8 Fluorescence Lifetime Imaging of HerGa Fluorescence lifetime imaging of HerGa was performed byexciting HerGa with 424 nm fs pulsed laser light in order toexamine whether HerGa fluorescence lifetime could be usedas a live-cell indicator to signal the optimal timing at whichphotoexcitation should be applied. The fluorescence lifetimeimages of HerGa were acquired at different time points(3, 10, 20, 40, 60, and 70 min) after the addition of 25 pMHerGa to cells growing in a Delta T chamber to monitor inter-nalization. A total of 28 images were acquired(0~5200 ps;time step: 200 ps; gate width: 600 ps, Ex: 424 nm, Em:620 nm×60 nm, light pulse width: 100 fs) and analyzed usingthe single-exponential decay fitting method, and then the(pseudocolor) fluorescence lifetime images were constructedIn addition, we evaluated the fitting significance by comparingthe single and double-exponential fittings of the data obtained at3 and 20 min, using MATLAB 7.8. 2.9 Examination of Light-Induced Cytotoxicity ofHerGa During Internalization intoMDA-MB-435 Cells In addition to the fluorescence lifetime imaging of HerGa duringuptake, light-induced cytotoxicity changes of HerGa wereexamined during internalization into MDA-MB-435 cells.Thecells were plated at 104 cells per Delta T chamber and incu-bated at 37 ℃ for 36 h before adding TMRM at 20 nM into thechambers respectively. After mitochondrial accumulation ofTMRM was equilibrated,TMRM and DIC images at differentfocal planes (thickness: ~18 um, step: 1 um) were acquired;then,1 pM HerGa (final concentration) was added into thecells, and the cells in each chamber received light at 424 nm(3.8 J/cm²) at different time points (no treatment, 5, 30,60 min) after HerGa addition respectively. After the light irra-diation, TMRM and DIC images at the focal planes wereacquired again and then the z-stack maximum intensity projec-tion images were constructed. For quantitative analysis, we alsocalculated the average fluorescence intensity ratio in betweenmitochondria and cytoplasm sites in the images obtained beforeand after light irradiation, as described previously, and then theaverage ratios were compared, after normalization by the aver-age value obtained before light irradiation. 3 Results 3.1 Light Specifically Increases HerGa-MediatedMitochondrial Membrane Potential Disruption To assess the effect of light on HerGa-mediated cytotoxicity,mitochondrial membrane potential/morphology changes (indi-cating cellular health status) of MDA-MB-435 cells beforeand after light irradiation were monitored using multimodeoptical imaging, including two-photon excited confocal fluores-cence, DIC, and spectral imaging.Two-photon imaging oflive cells shows that HerGa treatment (1 pM) without lightirradiation reduces TMRM accumulation in mitochondria in comparison to S2Ga-treated(1 uM) [Fig. 4(c), left panel] andcontrol (PBS-treated) cells [Fig. 4(d), left panel]. Thus,TMRM fluorescence in HerGa-treated cells [Fig. 4(a), leftpanel] is relatively less than the fluorescence in S2Ga- andPBS-treated cells without light irradiation. However, this reduc-tion in the HerGa-treated cells is enhanced further by light irra-diation [Fig. 4(a), middle panel], and is accompanied by arounded morphology [Fig. 4(b), right panel] consistent withdetaching cells that is not observed in the cells treated withoutlight [Fig. 4(b), left panel]. Importantly, light alone, or in com-bination with S2Ga and PBS, does not produce this significanteffect [Figs. 4(c) and 4(d)] compared to HerGa. In addition, we further examined the mitochondrial mem-brane potential reversibility and the localization of HerGa andTMRM after the light irradiation. Particularly, the TMRMimage[Fig.4(a), right panel] acquired at 30 min after the light irra-diation shows that TMRM does not redistribute across themitochondrial membrane reversibly, thus indicating the nonre-versibility of the mitochondrial changes. Additionally, to vali-date that the fluorescence acquired from this imaging reflectsthat emitted by TMRM rather than by HerGa, as well as toexamine localization of TMRM and HerGa in the cells afterthe light irradiation, spectral imaging and analysis wereperformed to separate HerGa from spectrally overlappingTMRM fluorescence signals. The spectral classification images[Fig.4(e), right panel] show that while HerGa is indeed accu-mulated inside cells that have undergone mitochondrial disrup-tion, TMRM from mitochondria is diffused into the cytoplasm,as well as extracellularly, consistent with mitochondrial mem-brane potential collapse and in contrast to control (PBS-treated)cells. Taken together, these results show that two-photon/DIC/spectral imaging allows us to monitor and measure the mito-chondrial membrane potential and morphologic changes of theHerGa-treated cells -/+ light. Thus, we can conclude that themitochondrial membrane potentials of HerGa-treated cells aresignificantly disrupted by light irradiation and that this effectis not reversible after the light irradiation. 3.2 HerGa-Mediated Disruption of MitochondrialMembrane Potential is Dependent onPhotoactivating Light Wavelength We next examined whether HerGa-mediated cytotoxicity isdependent on light wavelength by measuring the disruptionof mitochondrial membrane potential at selected excitationwavelengths of 425,488,535, and 640 nm, chosen based onthe absorbance peaks of HerGa. Figure 3 shows that the mito-chondrial membrane potential of HerGa-treated cells dramati-cally decreases after 3.8 J/cm² of light irradiation at 425 nmcompared to S2Ga and PBS-treated cells. In particular, light irra-diation does not induce any detectable mitochondrial membranepotential disruption in PBS-treated cells. The mitochondrialfluorescence decrease of all treated cells is also shown in the535 nm light irradiation, thus indicating that the change ismainly caused by photobleaching of TMRM due to the lightirradiation since 535 nm wavelength of the light significantlyoverlaps the excitation wavelengths for TMRM. Finally,640 nm moderately decreases the mitochondrial membranepotential of HerGa-treated cells. Altogether, these resultsshow that light at 424 nm wavelength produces the most HerGa treatment (e) Fig. 4 Mitochondrial membrane potential/morphologic changes of cells receiving HerGa treatment before and after light irradiation and spectralimaging to distinguish HerGa from TMRM: The TMRM fluorescence images of treated cells were acquired before and after light irradiation usingtwo-photon excited confocal fluorescence imaging. Meanwhile, the DIC images were acquired before and after light irradiation using a CCD cameracoupled with the two-photon imaging system. After the light irradiation, HerGa could be discriminated from TMRM by collecting the two-photonexcited fluorescence images within the spectral range of 550 to 680 nm with a step size of 10 nm. (a)TMRM fluorescence images of HerGa-treated cellsbefore (left) and after the light irradiation (middle and right at 30 min).(b) DIC images before and after light irradiation. (c) TMRM fluorescence images ofS2Ga treated (left) and (d) control cells (PBS) (right) -/+ light (450 to 490 nm, 17 J/cm). (e) HerGa fluorescence image (left) and spectral classificationimage (right, red: HerGa, green: TMRM). effective toxic effect in HerGa-treated cells, and the toxic effectis dependent on the absorption spectra of HerGa. 3.3 Long Wavelength Light Can Promote Mitochon-drial Damage of HerGa-Treated Cells Figures 3 and 4 show that deep blue light promotes mitochon-drial damage of HerGa-treated cells most effectively. However,this approach may not be suitable for in vivo applications sincethe penetration depth of the blue light through tissues is verylimited (to a few millimeters at best,and typically much less).Longer wavelength light, on the other hand, would allow forexcitation of HerGa in deep tissue. Fortunately, the gallium-metallated corrole used here exhibits a secondary absorptionpeak around 620 nm.2 Thus, we tested whether red light (590to 630 nm) can also augment the mitochondrial damage ofHerGa-treated cells. For a comparison, we applied deep bluelight (414 to 434 nm) and red light (590 to 630 nm) on confinedareas of 1 pM HerGa-pretreated cells through a 20x objective,respectively, and then added TMRM to the cells for the mea-surement of mitochondrial membrane potential. While themitochondrial membrane potential of the cells only receiving each light at respective wavelengths is disrupted, the cells out-side of this field (i.e., not receiving the light) retained the mito-chondrial membrane potential, as shown in Figs. 5(a) and 5(b).In contrast, the control cells (mock-treated) receiving the light at590 to 630 nm did not exhibit any significant collapse of mito-chondrial membrane potential [Fig. 5(c)]. In addition, as shownin the quantitative analysis Fig. 5(d)), while the mean intensityof TMRM fluorescence of the HerGa-treated cells receiving theblue light dose not differ significantly compared to the meanfluorescence intensity of the cells receiving the red light, it ismuch lower than that of the control (PBS) cells receiving the redlight. Thus, these results indicate that red light (590 to 630 nm),able to penetrate deeper into tissue due to its significantly lowerscattering, can also promote mitochondrial damage of HerGa-treated cells and suggests that it may be possible to introducelight-augmented cytotoxicity of HerGa in vivo. 3.4 Fluorescence Lifetime Changes of HerGa DuringInternalization into MDA-MB-435 Cells Our previous studies have shown that internalization of HerGa isrequired for cancer cell damage. Specifically, we have shown (a) (b) (C) (d) Fig.5 Mitochondrial disruption of HerGa-treated cells by red light. TMRM fluorescence images were acquired at two hours after the addition of TMRMto cells treated with 1 uM HerGa and PBS. Cells within the confined area only (delineated by a dotted line) received either deep blue light (414 to434 nm) or red light (590 to 630 nm), where indicated. (a) Overlaid TMRM fluorescence and transmission image of HerGa-treated cel;lAsT AreAcDeAiAvi+ng deepblue light.(b) Overlaid TMRM fluorescence and transmission image of HerGa-treated cells receiving red light. (c) Overlaid TMRM fluorescence andtransmission image of PBS-treated cells receiving red light. (d) Mean fluorescence intensities of the area received light. The bar graph represents themean fluorescence intensity. that HerPBK10-mediated delivery yields accumulation in endo-cytic vesicles by~15 min after uptake, followed by sufficientcytosolic distribution of HerPBK10 by ~45 min. Hence, weexamined here whether HerGa fluorescence lifetime couldbe used as a live-cell indicator to signal the optimal timing atwhich photoexcitation should be applied. Figure 6(a) shows the fluorescence lifetime changes of HerGa during uptake.Although the average fluorescence lifetime of HerGa in thecells is approximately 861 ps at 3 min this average lifetimeof HerGa dramatically decreases to approximately 541 ps at20 min and to approximately 533 ps at 40 min, respectively.These time points correlate with cell membrane binding and (b) Fig.6 Fluorescence lifetime changes of HerGa during uptake in MDA-MB-435 cells:(a) fluorescence lifetime (inset, upper panels) and intensity (inset,lower panels) images of treated cells acquired at the indicated time points (3, 10,20, 40, 60, and 70 min) of HerGa internalization. The plot shows thechanges of average fluorescence lifetime of HerGa at the indicated time points. (b) Gated images (left) and single- and double-exponential fittings (right)obtained at 3 and 20 min after HerGa addition. cytosolic uptake, respectively, as indicated by the fluorescenceintensity images showing HerGa cellular localization duringinternalization [Fig. 6(a) inset, lower row].Consistent with pre-vious observations,1.2 HerGa remains excluded from the nucleusafter cytosolic entry. Figure 6(b) shows the gated images (left)and fluorescence decay curve fittings at the regions selected bythe circles (right), which are obtained at 3 and 20 min respec-tively after HerGa addition to the cells. Here the fluorescencedecay curves clearly show that fluorescence of HerGa obtainedat 20 min decays faster than the fluorescence of HerGa at 3 min.In addition, the decay curve fitting significance was evaluated bycomparing the single and double-exponential fits [Fig. 6(b),right]. While the single-exponential fitting provides a HerGafluorescence lifetime of ~936 ps at 3 min around the selectedregion, the double-exponential fitting provides fluorescencelifetimes of ~1131 ps and ~260 ps respectively. In contrast,while the single-exponential fitting provides a HerGa fluores-cence lifetime of ~591 ps at 20 min around the selected regions,the double-exponential fitting provides a fluorescence lifetimeof 831 ps and ~260 ps respectively. Altogether, these resultsshow that HerGa uptake is fully achieved within ~40 min after HerGa addition to cells, thus allowing us to identify theoptimal timing for inducing photoexcitation-based damage. 3.5 Monitoring of Light-Augmented Cytotoxicity ofHerGa During Uptake Fluorescence lifetime imaging of HerGa during uptakeallowsusto identifyy1the optimall timing for inducingphotoexcitation-based damage. We furthermore investigatedthe light-induced cytotoxicity changes of HerGa during uptakeby monitoring mitochondrial membrane potential changes of thecells after light irradiation (424 nm, 3.8 J/cm²). Figure 7(a)shows the TMRM fluorescence images obtained before andafter light irradiation of the cells at the indicated time points(no treatment, 5, 30, 60 min) after HerGa addition. In thecells without HerGa treatment, the light irradiation does notinduce any significant disruption of mitochondrial membranepotential of the cells [Fig. 7(a), first column]. In contrast, thecells receiving the light (424 nm, 3.8 J/cm²) at 5 min afterHerGa addition exhibit significant disruptions of mitochondrialmembrane potential [Fig. 7(a), second column], and furthermore (a) (b) Fig. 7 Mitochondrial disruption of HerGa-treated cells by light irradiation at the indicated time points after HerGa addition:(a) TMRM images obtainedbefore and after light irradiation at 5, 30, and 60 min after HerGa addition and without HerGa treatment and overlaid TMRM and DIC image after lightirradiation. (b) Quantitative analysis for mitochondrial membrane potential disruption. The bar graph represents the average mitochondrial membranepotential. The error bars indicate standard deviations. in thecells receiving the light at 30 and 60 min after the HerGaaddition, more significant disruptions of mitochondrial mem-brane potential [Fig. 7(a), third and fourth columns] wereobserved than in the cells receiving light at 5 min. As shownin the quantitative analysis [Fig. 7(b)], which exhibits the aver-age mitochondrial membrane potentials, while the averagemitochondrial membrane potential of the cells decreases toapproximately 50% by the light irradiation at 5 min afterHerGa addition, the average mitochondrial membrane potentialsdecrease down to approximately 30% and 15% by the lightirradiation at 30 and 60 min after the HerGa addition, respec-tively [Fig. 7(b)]. Altogether, these results show that the photo-augmented cytotoxicity of HerGa can be realized at about 5 minafter HerGa addition to the cells, but the light-induced cytotoxi-city of HerGa becomes enhanced as the HerGa treatment time1ncreases. 4 Discussion and Conclusions The present studies indicate that whereas HerGa at 1 pMconcentration disrupts mitochondria without photoexcitationadditional light application (at specific wavelengths) augmentsmitochondrial membrane potential disruption even further, thusenhancing HerGa’s inherent cytotoxicity. Although light at424 nm (which correlates with the peak absorption wavelengthofHerGa) is most effective at augmenting this cytotoxicity, lightat 535 nm also significantly lowered the TMRM fluorescencethat reports on the mitochondrial membrane potential. However,the wavelength itself also overlaps with the absorption wave-length of TMRM [Fig. 1], and the apparent disruption observedat 535 nm is likely to be caused mainly by reactive oxygenspecies generated by TMRM although it is somewhat affectedby HerGa photo-reactivity. In addition, light at 424 nm caninduce moderate mitochondrial damage in S2Ga-treated cells,but considerably less compared to HerGa-treated cells [Fig. 3].Whereas S2Ga alone can be endocytosed with serum albumin, itcannot effectively penetrate the plasma membrane and enter thecytosol without a membrane-penetrating agent. As cytosolicentry appears to be a requirement for S2Ga toxicity, S2Gaalone is fairly nontoxic to cancer cells unless used at excessivepharmacological concentrations (>30 pM).2 In addition, lightat 450 to 490 nm, which still excites HerGa but is not perfectlymatched with the absorption peaks of HerGa, can also disruptmitochondrial membrane potential of HerGa-treated cellswith higher energy density (17.1 J/cm²) of light irradiation[Fig. 4(a)] than at 424 nm [. 3]. These results indicate thatall light within wavelengths that can be absorbed by HerGaaugments mitochondrial membrane potential disruption ofHerGa-treated cells, with different light doses. Our previous study showed that HerGa molecules arediffusely localized in the cytoplasm. In this study, both HerGafluorescence [. 4(e), left] and spectral classification imaging[Fig. 4(e), right] show that HerGa is broadly distributed inthe cytoplasm before and after light irradiation. Whereas fluor-escence imaging shows that HerGa overlaps with mitochondria(marked by TMRM fluorescence) [Fig.4(a), left], the localiza-tion of HerGa is not exclusive to mitochondria and does notexhibit the punctuate fluorescence that would be suggestiveof mitochondrial accumulation. Therefore, although it is unli-kely that HerGa specifically enters the mitochondrion, it is prob-able that HerGa is in near enough proximity to elicit the results shown in this study. Further studies will help us elucidate thedirect interactions facilitating HerGa-mediated reactive oxygenspecies formation. In Fig. 4(e), the region selected for TMRM +background should contain TMRM since TMRM accumulationin mitochondria and cytoplasm is governed by the Nernst equa-tion; TMRM diffuses into the cytoplasm from mitochondriaafter mitochondrial disruption and subsequently diffuses outof cells. Meanwhile, HerGa, which is not internalized intothe cells, still remains in the region. Therefore, the spectralsignature labeled with TMRM + background [Fig. 4(e), middle]exhibits two peaks around 570 and 620 nm. While the first peakis likely to result from TMRM, the second peak is likely to resultfrom HerGa. However, there are some mismatches in betweenthe chosen spectral signature and the pure spectral signature ofTMRM, which may result from a low fluorescence signallevel. Therefore, it seems reasonable to have this labeledTMRM + background. For more versatile (and translational) in vivo application ofthe light-augmented toxicity of HerGa, the usage of light atlonger wavelengths than the deep blue is required. Figure 5shows that red light (590 to 630 nm) also enhances HerGa-mediated mitochondrial damage [Fig. 5(b)], suggesting thatphotoexcitation of HerGa may be implemented in vivo. Whereasthe optimal wavelength for breast cancer phototreatment isreported to be 730 nm,"? the wavelength used here still liespartially within the red/NIRwindow (626 to 11316 nm)for breast tissue. Additionally, HerGa can be excited by fspulsed light at 780 nm through the two-photon absorptionprocess as shown in Fig.4(b).2 This result indicates that thetwo-photon excitation may also be applicable to the photoexci-tation of HerGa in vivo. Thus, it is possible that photoexcitationcan enhance the inherent toxicity of HerGa and, when combinedwith tumor targeting in vivo, may present an effective alterna-tive breast cancer treatment, especially for resistant diseasestates such as metastasis.24 However, although the red light(590~630 nm) can also effectively yield mitochondrial disrup-tion of HerGa-treated cells, the 640 nm (red) light wavelength asshown in Fig. 3, which is not perfectly matched with the secondpeak absorption wavelength(~620 nm), does not induce a sharpdecrease of Mito/Cyto ratio compared to the 425 nm light wave-length. These results indicate that the wavelength selection is akey factor to induce more effective mitochondrial damage inHerGa-treated cells by light irradiation. Interestingly, inFig. 5(a), the area showing mitochondrial membrane potentialdisruption is not somewhat matched with the irradiation area.The mismatch is likely due to the light scattered from thefocal spot. As shown in Fig. 3, the light-induced cytotoxicityof HerGa is dependent on the absorbance of HerGa. The absor-bance spectra of HerGa have peaks at approximately 424 and620 nm while the absorbance at 424 nm is over twice that at620 nm. Thus, the deep blue light (414 to 434 nm) is more effec-tive than the red light (590 to 630 nm) at the same energy densityfor augmenting the cytotoxicity of HerGa. Thus, the scattereddeep blue light seemed to be capable of disrupting mitochon-drial membrane potentials of cells adjacent to the area mainlyreceiving the light but not the red light at the light dose. Photoactivation of TMRM itself induces singlet oxygenand thus prolonged photoactivation of TMRM-loaded cellsresulted in stronger NAD(P)H oxidation and the rapid onset ofmitochondrial permeability transition. Thus, in the measurement of mitochondrial membrane potential using TMRM, care-ful determination of light dose for excitation of TMRM isneeded. In this study, photoactivation of TMRM at the lighidose utilized for imaging did not induce any significant mito-chondrial membrane potential disruption (fluorescence intensitychanges of TMRM after acquisition of 187 images: 630 to 612).In addition, the TMRM images, shown in Figs. 4 and 5,indicate that the light application augments mitochondrialmembrane potential disruption although they were obtainedthroughttwodifferentprocedures::1. ]TMRM→HerGatreatment → irradiation; 2. HerGa treatment → irradiation →TMRM. Thus, these results suggest that the presence ofTMRM while HerGa irradiation occurs does not have any sig-nificant effects on the light-augmented cytotoxicity of HerGato cells. Therapeutic efficacy of HerGa requires membrane penetra-tion of the therapeutic cargo. The membrane-penetratingsegment of HerPBK10, the adenovirus-derived penton base,plays a critical role for the delivery of genes into cells asshown in our previous studies,14 and our more recent in vitrostudies show that HerPBK10 enables passage of sulfonated cor-roles across the plasma membrane.’Our present studies indicatethat photoexcitation-enhanced mitochondrial disruption canoccur at approximately five minutes after HerGa treatment asshown in Fig. 7. Moreover, the light irradiation at the longertime points after HerGa addition induces augmented mitochon-drial membrane potential disruption of the cells. Concurrentfluorescence lifetime and intensity imaging indicate that inter-nalization of HerGa is realized within approximately 40 min,during which the fluorescence lifetime of HerGa decreases,consistent with our previous observations.22 Altogether, theseresults indicate that the light irradiation at the longer time pointsafter HerGa treatment provides more enhanced light-inducedcytotoxicity of HerGa. Since our previous studies indicate that HerPBK10-mediatedcell entry occurs by receptor-mediated endocytosis and endoso-mal escape,the fluorescence lifetime changes of HerGa duringuptake may reflect intracellular microenvironmental changesencountered during its transit. As the microenviroment of thecytosol of tumor cells is less acidic than outside cells, thismay be indicative of pH changes although this issue remainsto be elucidated. In the fluorescence lifetime imaging ofHerGa (Fig. 6), the fluorescence lifetimes obtained by using asingle-exponential fitting method are shorter than the long.lived components of the double-exponential decay,possiblydue to the constant short-lived component (260 ps) resolvedby the double-exponential fitting method. Here, the short-livedcomponent of the double-exponential decay may result fromautofluorescence. In general, the double-exponential fittingmethod would provide a better fit than the single-exponential fitting method.25 However, it is important to note that the singleexponential fitting still allows us to monitor the internalizationof HerGa since it offers monitoring of the relative fluorescencelifetime changes of HerGa during the uptake with the similartrend to those obtained by the double-exponential fitting method.In conclusion, although we have previously reported that targeted corroles can eliminate tumor growth without photo-activation, we now report that photoexcitation augments cor-role cytotoxicity by enhancing disruption of the mitochondrialmembrane potential. These studies were enabled through multimode optical imaging, which allowed simultaneous exam-ination of mitochondrial membrane potentials, cell morphologychanges, discrimination between molecules with similar emis-sions, and HerGa internalization dynamics, yielding mechanis-tic and practical conclusions. The combination of the inherenttargeted cytotoxicity of HerGa with its newly discovered photo-reactivity may facilitate an even greater potency and specificityfor tumor cell destruction, thus yielding a therapeutic withoptimized efficacy and safety. Acknowledgments We thank Kevin Burton (Cedars-Sinai Medical Center) for pro-viding valuable comments. This work was supported by grantsfrom the U.S. Navy Bureau of Medicine and Surgery, the NIH(R21 CA116014, R01 CA140995, and R01 CA129822), theDoD (BC050662), the Susan G. Komen Breast Cancer founda-tion (BCTR0201194), and the Donna and Jesse Garber Award.Work at Caltech was supported by NIH DK019038 and theArnold and Mabel Beckman Foundation. Work at the Technionwas supported by The Herbert Irving Cancer and Atherosclero-sis Research Fund and The United States-Israel BinationalScience Foundation. ( References ) 1. H. Agadjanian et al., “Tumor detection and elimination by a targeted gal-lium corrole,”Proc. Natl. Acad. Sci. U. S.A. 106(15),6105-6110(2009). 2. H. Agadjanian et al.,“Specific delivery of corroles to cells via noncova-lent conjugates with viral proteins,” Pharm. Res. 23(2), 367-377 (2006). 3. P. Lim et al.,“Differential cytostatic and cytotoxic action of metallocor-roles against human cancer cells: potential platforms for anticancer drugdevelopment,”Chem. Res. Toxicol. (in press). 4. L. K. Medina-Kauwe et al., “Nonviral gene delivery to human breastcancer cells by targeted Ad5 penton proteins," Gene Ther. 8(23),1753-1761(2001). 5. H. Agadjanian et al.,“Corrole Conjugates: A Unique Approach toTumor Targeting,”in The American Association for Cancer Research,San Diego, CA, pp. 2328 (2008). 6. J. Y. Hwang et al., “A mechanistic study of tumor-targeted corrole toxi-city,”Mol. Pharmacol., 8(6), 2233-2243 (2011). 7. D. L. Farkas et al.,“Multimode light microscopy and the dynamics ofmolecules, cells, and tissues,”Ann. Rev. Physiol. 55,785-817(1993). 8. R. C. Scaduto, Jr. et al.,“Measurement of mitochondrial membranepotential using fluorescent rhodamine derivatives,” Biophys. J.76(1),469-477 (1999). 9. D. L. Farkas et al.,“Simultaneous imaging of cell and mitochondrialmembrane potentials,”Biophys. J. 56(6), 1053-1069 (1989). 10. H. Kawai et al., “Simultaneous imaging of initiator/effector caspaseactivity and mitochondrial membrane potential during cell deathin living HeLa cells,”Biochim. Biophys. Acta 1693(2), 101-110(2004). 11. J. Y. Hwang et al.,“Multimodal wide-field two-photon excitation ima-ging: characterization of the technique for in vivo applications,"Biomed. Opt. Express 2(2), 356-364 (2011). 12. T.J.Dougherty et al., “Photodynamic therapy,"J. Natl. Cancer Inst. 90,889-905 (1998). 13. L. D. Via and S. M. Magno,“Photochemotherapy in the treatment ofcancer,” Curr. Med. Chem. 8, 1405-1418 (2001). 14. L. K. Medina-Kauwe et al, “Non-viral gene delivery to human breastcancer cells by targeted Ad5 penton proteins," Gene Ther. 8,1753-1761(2001). 15. M. Zochowski et al.,“Imaging membrane potential with voltage-sensitive dyes,Biol. Bull. 198(1), 1-21 (2000). 16. A. Chung et al., “In vivo cytometry: a spectrum of possibilities,"Cytometry A 69(3), 142-146 (2006). 17. G. Solaini et al.,“Evaluating mitochondrial membrane potential incells,”Biosci. Rep. 27(1-3), 11-21 (2007). 18. C. Fink et al., “Intracellular fluorescent probe concentrations by confo-cal microscopy," Biophys. J. 75(4), 1648-1658 (1998). 19. J. Fuchs et al., “Spectral-spatial electron paramagnetic resonanceimaging (EPRI) in skin biopsies at 9.5 GHz,” Meth. Mol. Biol. 196,221-226(2002). 20. J. Bendix et al., “Structural, electrochemical, and photophysical properties of gallium(ⅢII) 5,10,15-tris(pentafluorophenyl)corrole,” Angew.Chem. Int. Ed. 39(22), 4048-4051 (2000). 21. F. Petrat et al.,“NAD(P)H, a primary target of 102 in mitochondria ofintact cells," J. Biol. Chem. 278(5), 3298-3307(2003). 22. S. Nioka et al., “Simulation study of breast tissue hemodynamics duringpressure perturbation,” Adv. Exp. Med. Biol. 566, 17-22(2005). 23. A. Rebane et al.,“Two-photon absorption properties of meso-substituted A3-corroles,”Chem. Phys. Lett. 462(4), 246-250 (2008). 24. M. Lapes et al.,“Photodynamic therapy of cutaneous metastases of breastcancer after local application of meso-tetra-(para-sulphophenyl)-porphin(TPPS4),”J. Photochem. Photobiol. B 36(2),205-207 (1996). 25. K. C. Lee et al.,“Application of the stretched exponential functionto fluorescence lifetime imaging,” Biophys. J. 81(3), 1265-1274(2001). 26. I. Luobeznova et al.,“Synthesis and full characterization of molybde-num and antimony corroles and utilization of the latter complexes asvery efficient catalysts for highly selective aerobic oxygenation reac-tions,” Inorg Chem. 45(1), 386-394 (2006). Downloaded from SPIE Digital Library on Apr to Terms of Use: http://spiedl.org/terms Journal of Biomedical Opticsanuary · Vol. Downloaded from SPIE Digital Library on Apr to Terms of Use: http://spiedl.org/terms We recently reported that a targeted, brightly fluorescent gallium corrole (HerGa) is highly effective forbreast tumor detection and treatment. Unlike structurally similar porphryins, HerGa exhibits tumor-targeted toxicitywithout the need for photoexcitation. We have now examined whether photoexcitation further modulates HerGatoxicity, using multimode optical imaging of live cells, including two-photon excited fluorescence, differential interferencecontrast (DIC), spectral, and lifetime imaging. Using two-photon excited fluorescence imaging, weobserved that light at specific wavelengths augments the HerGa-mediated mitochondrial membrane potentialdisruption of breast cancer cells in situ. In addition, DIC, spectral, and fluorescence lifetime imaging enabledus to both validate cell damage by HerGa photoexcitation and investigate HerGa internalization, thus allowingoptimization of light dose and timing. Our demonstration of HerGa phototoxicity opens the way for developmentof new methods of cancer intervention using tumor-targeted corroles.
确定
还剩10页未读,是否继续阅读?

北京欧兰科技发展有限公司为您提供《线粒体中多模光学成像检测方案(CCD相机)》,该方案主要用于其他中多模光学成像检测,参考标准--,《线粒体中多模光学成像检测方案(CCD相机)》用到的仪器有
相关方案
更多
该厂商其他方案
更多