


方案详情
文
采用德国LaVision公司独特的皮秒门宽增强型CCD相机对鼠抗体样本进行了增强器快门门宽尺度对基于寿命的福斯特共振能量转移(FRET)参数的估计的研究。
方案详情

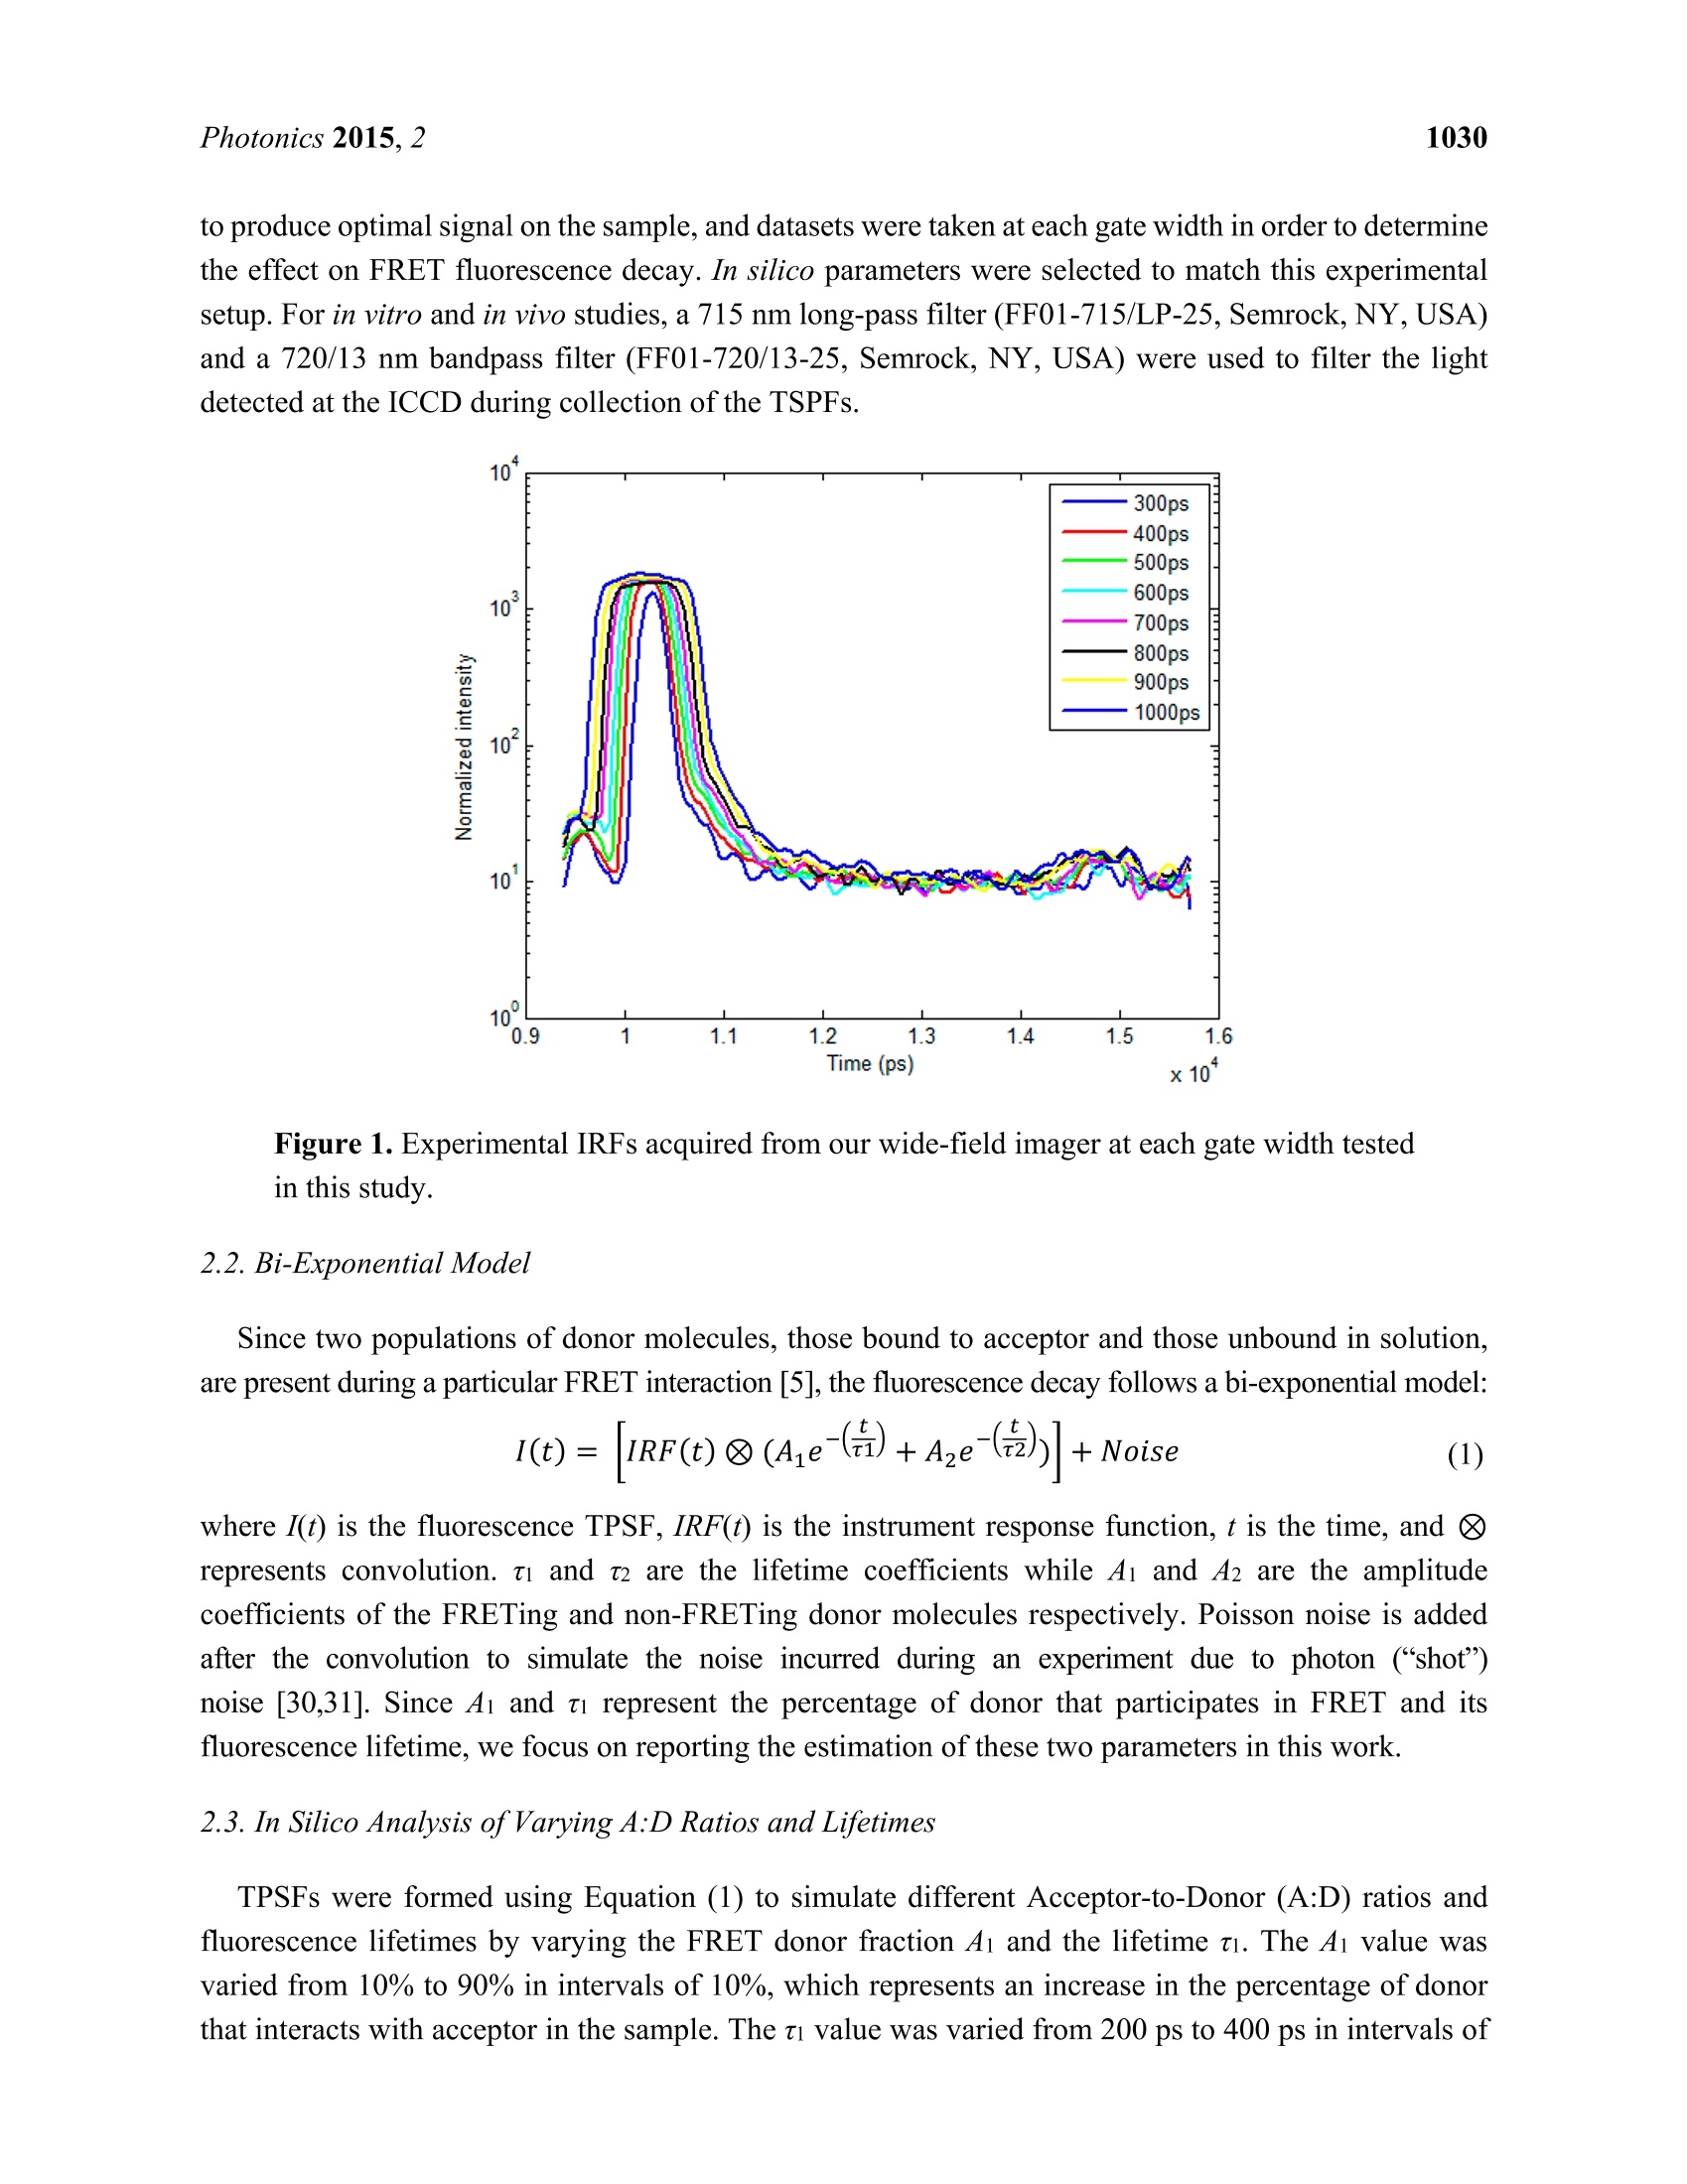
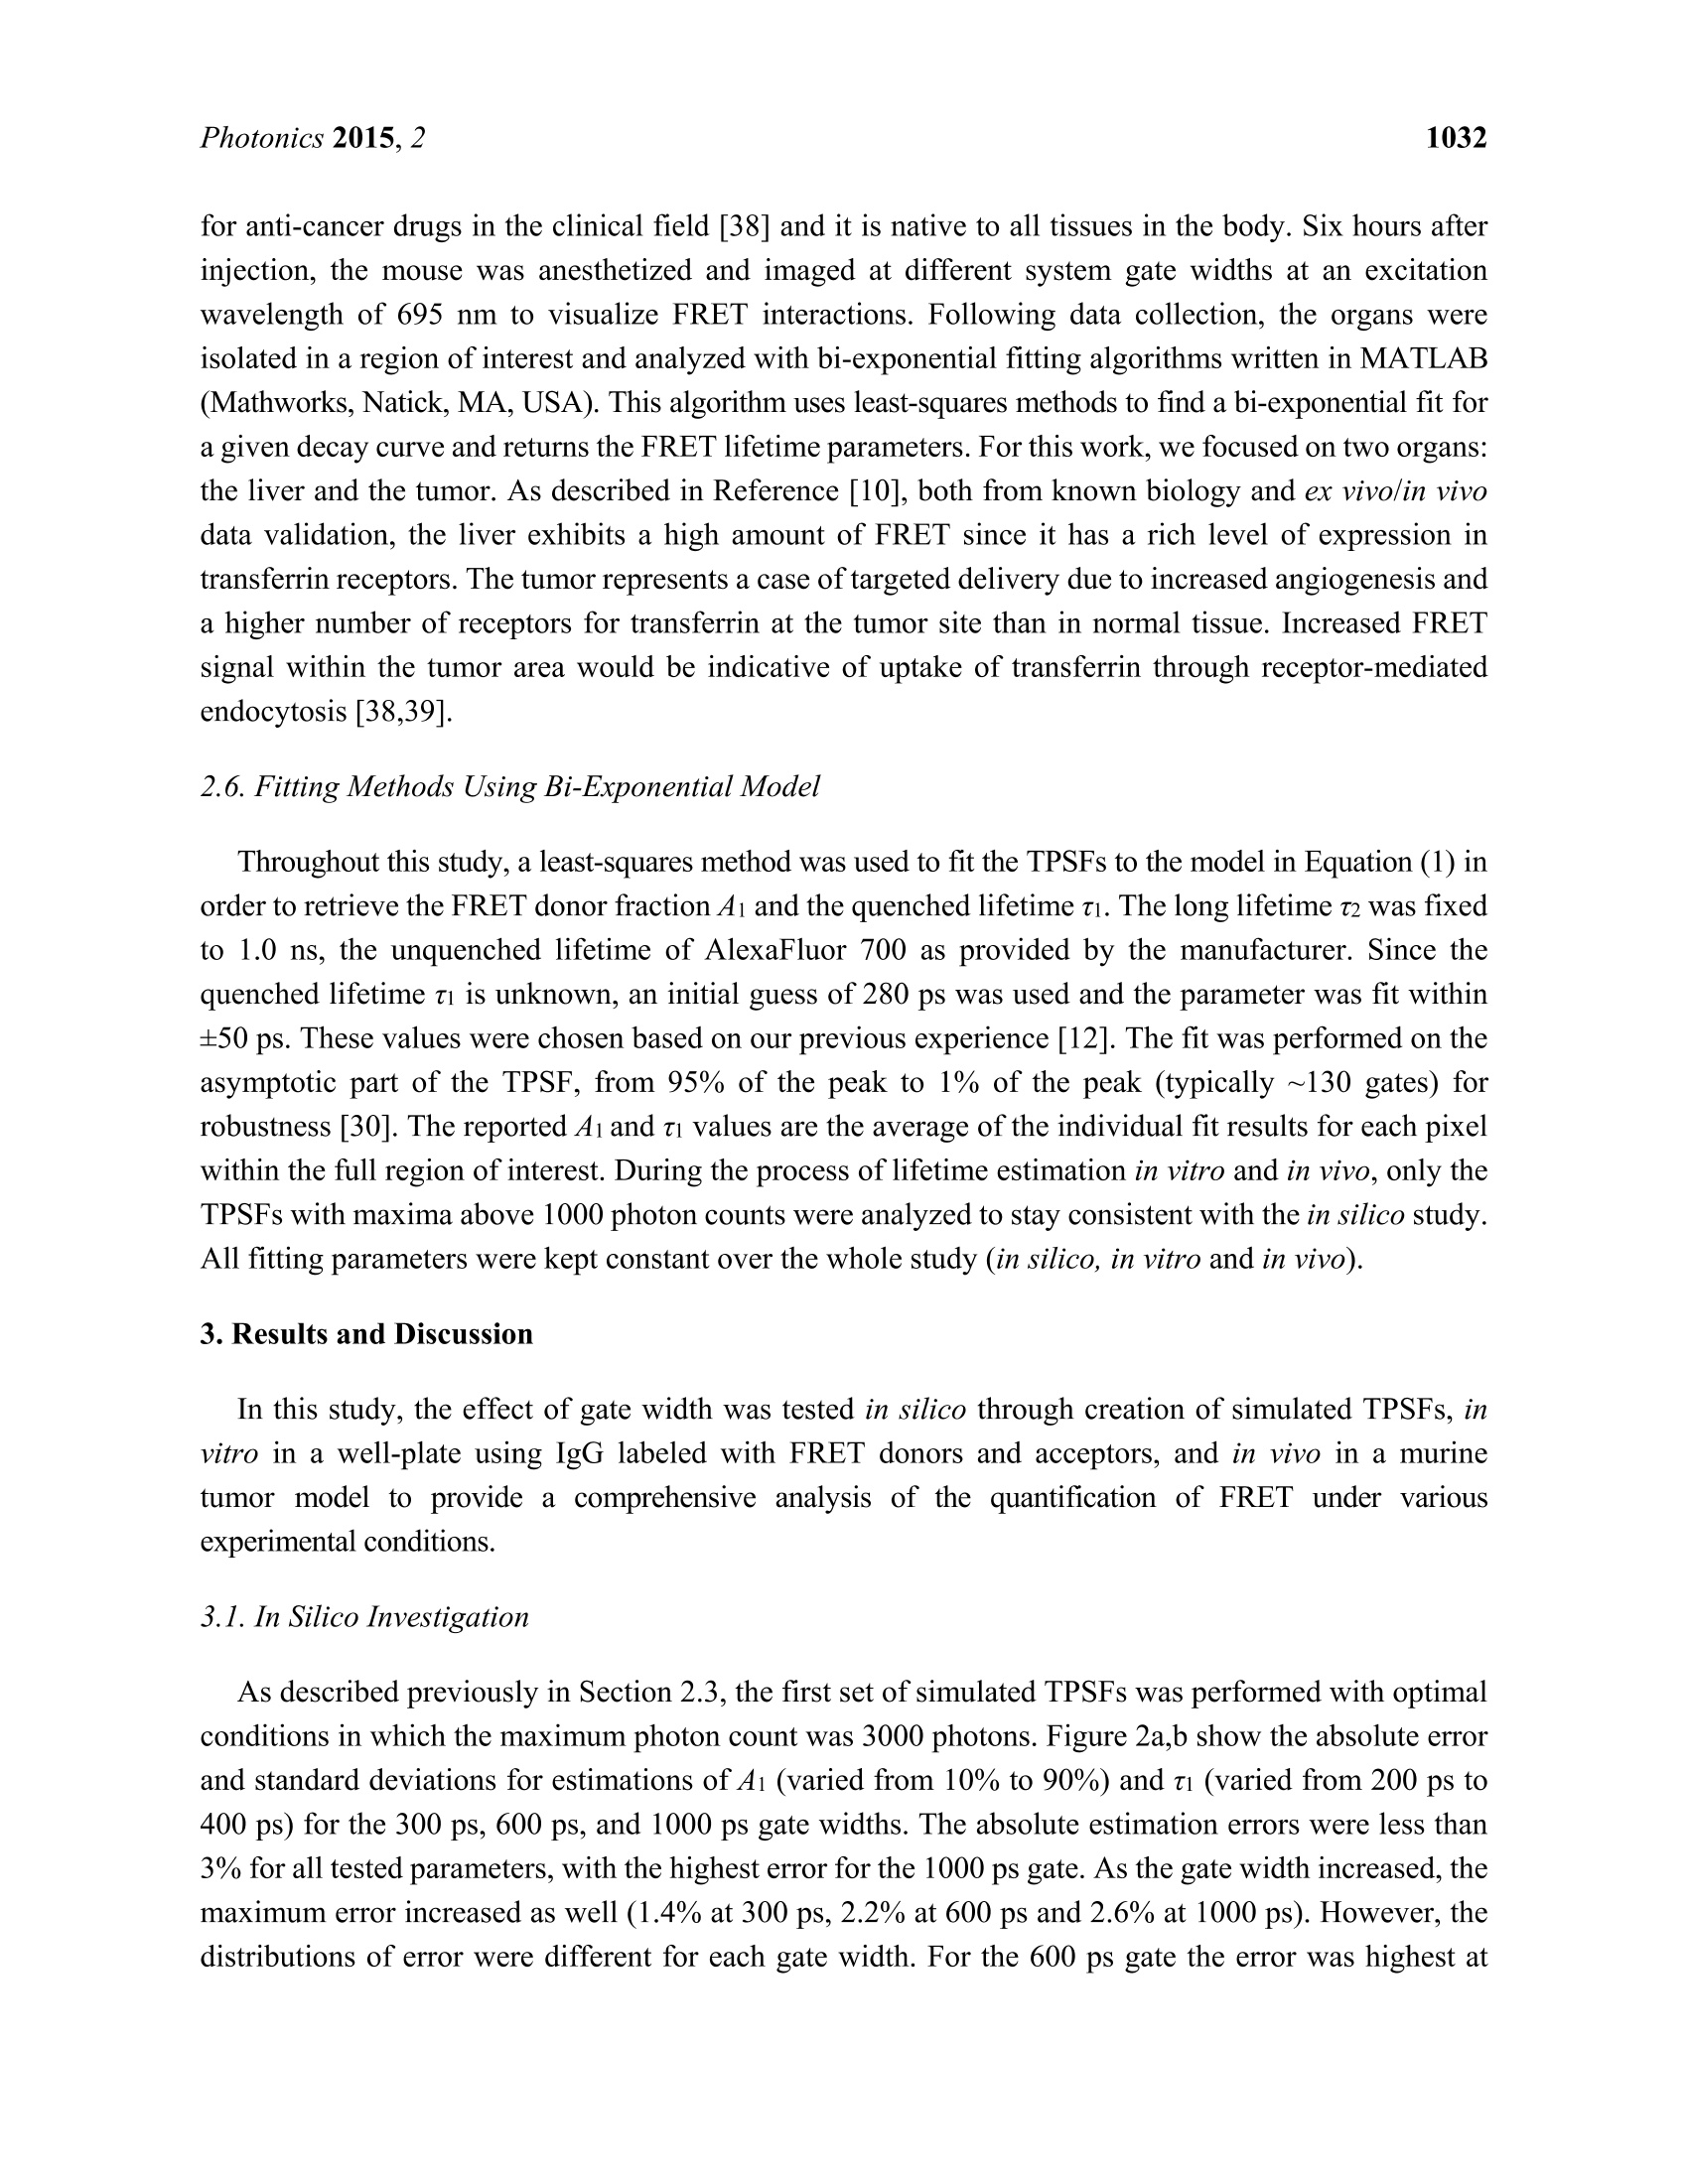
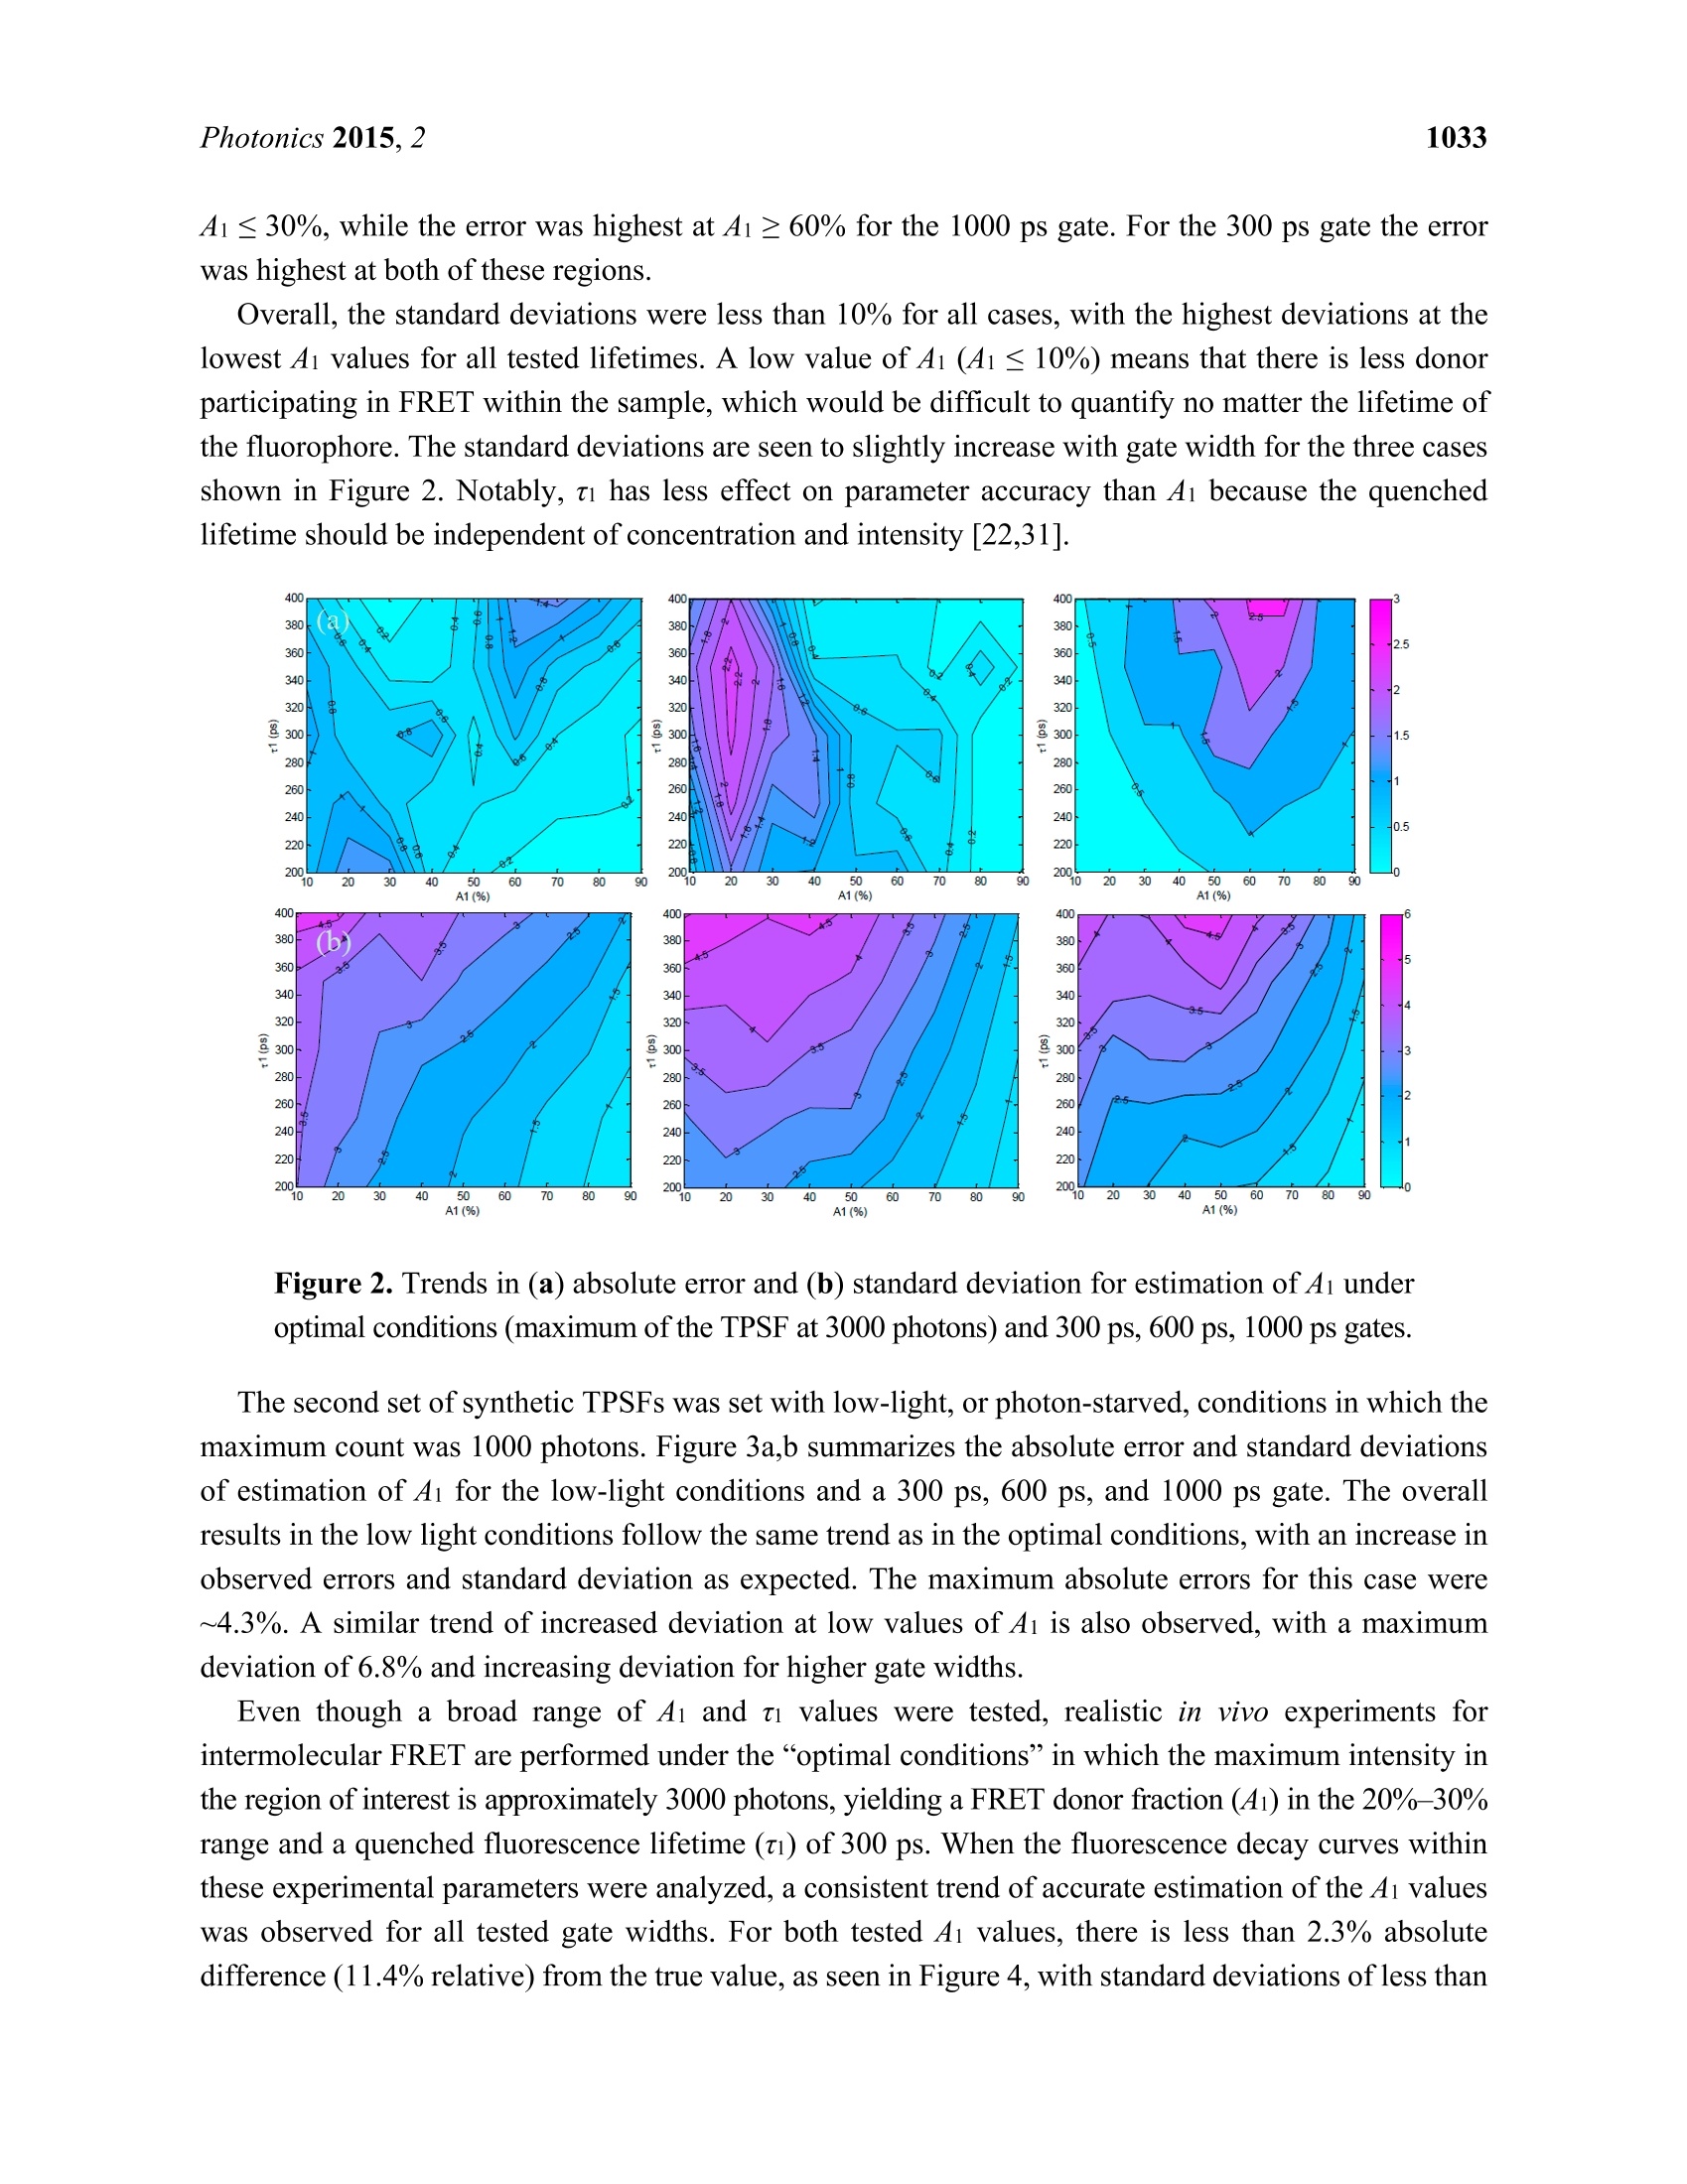
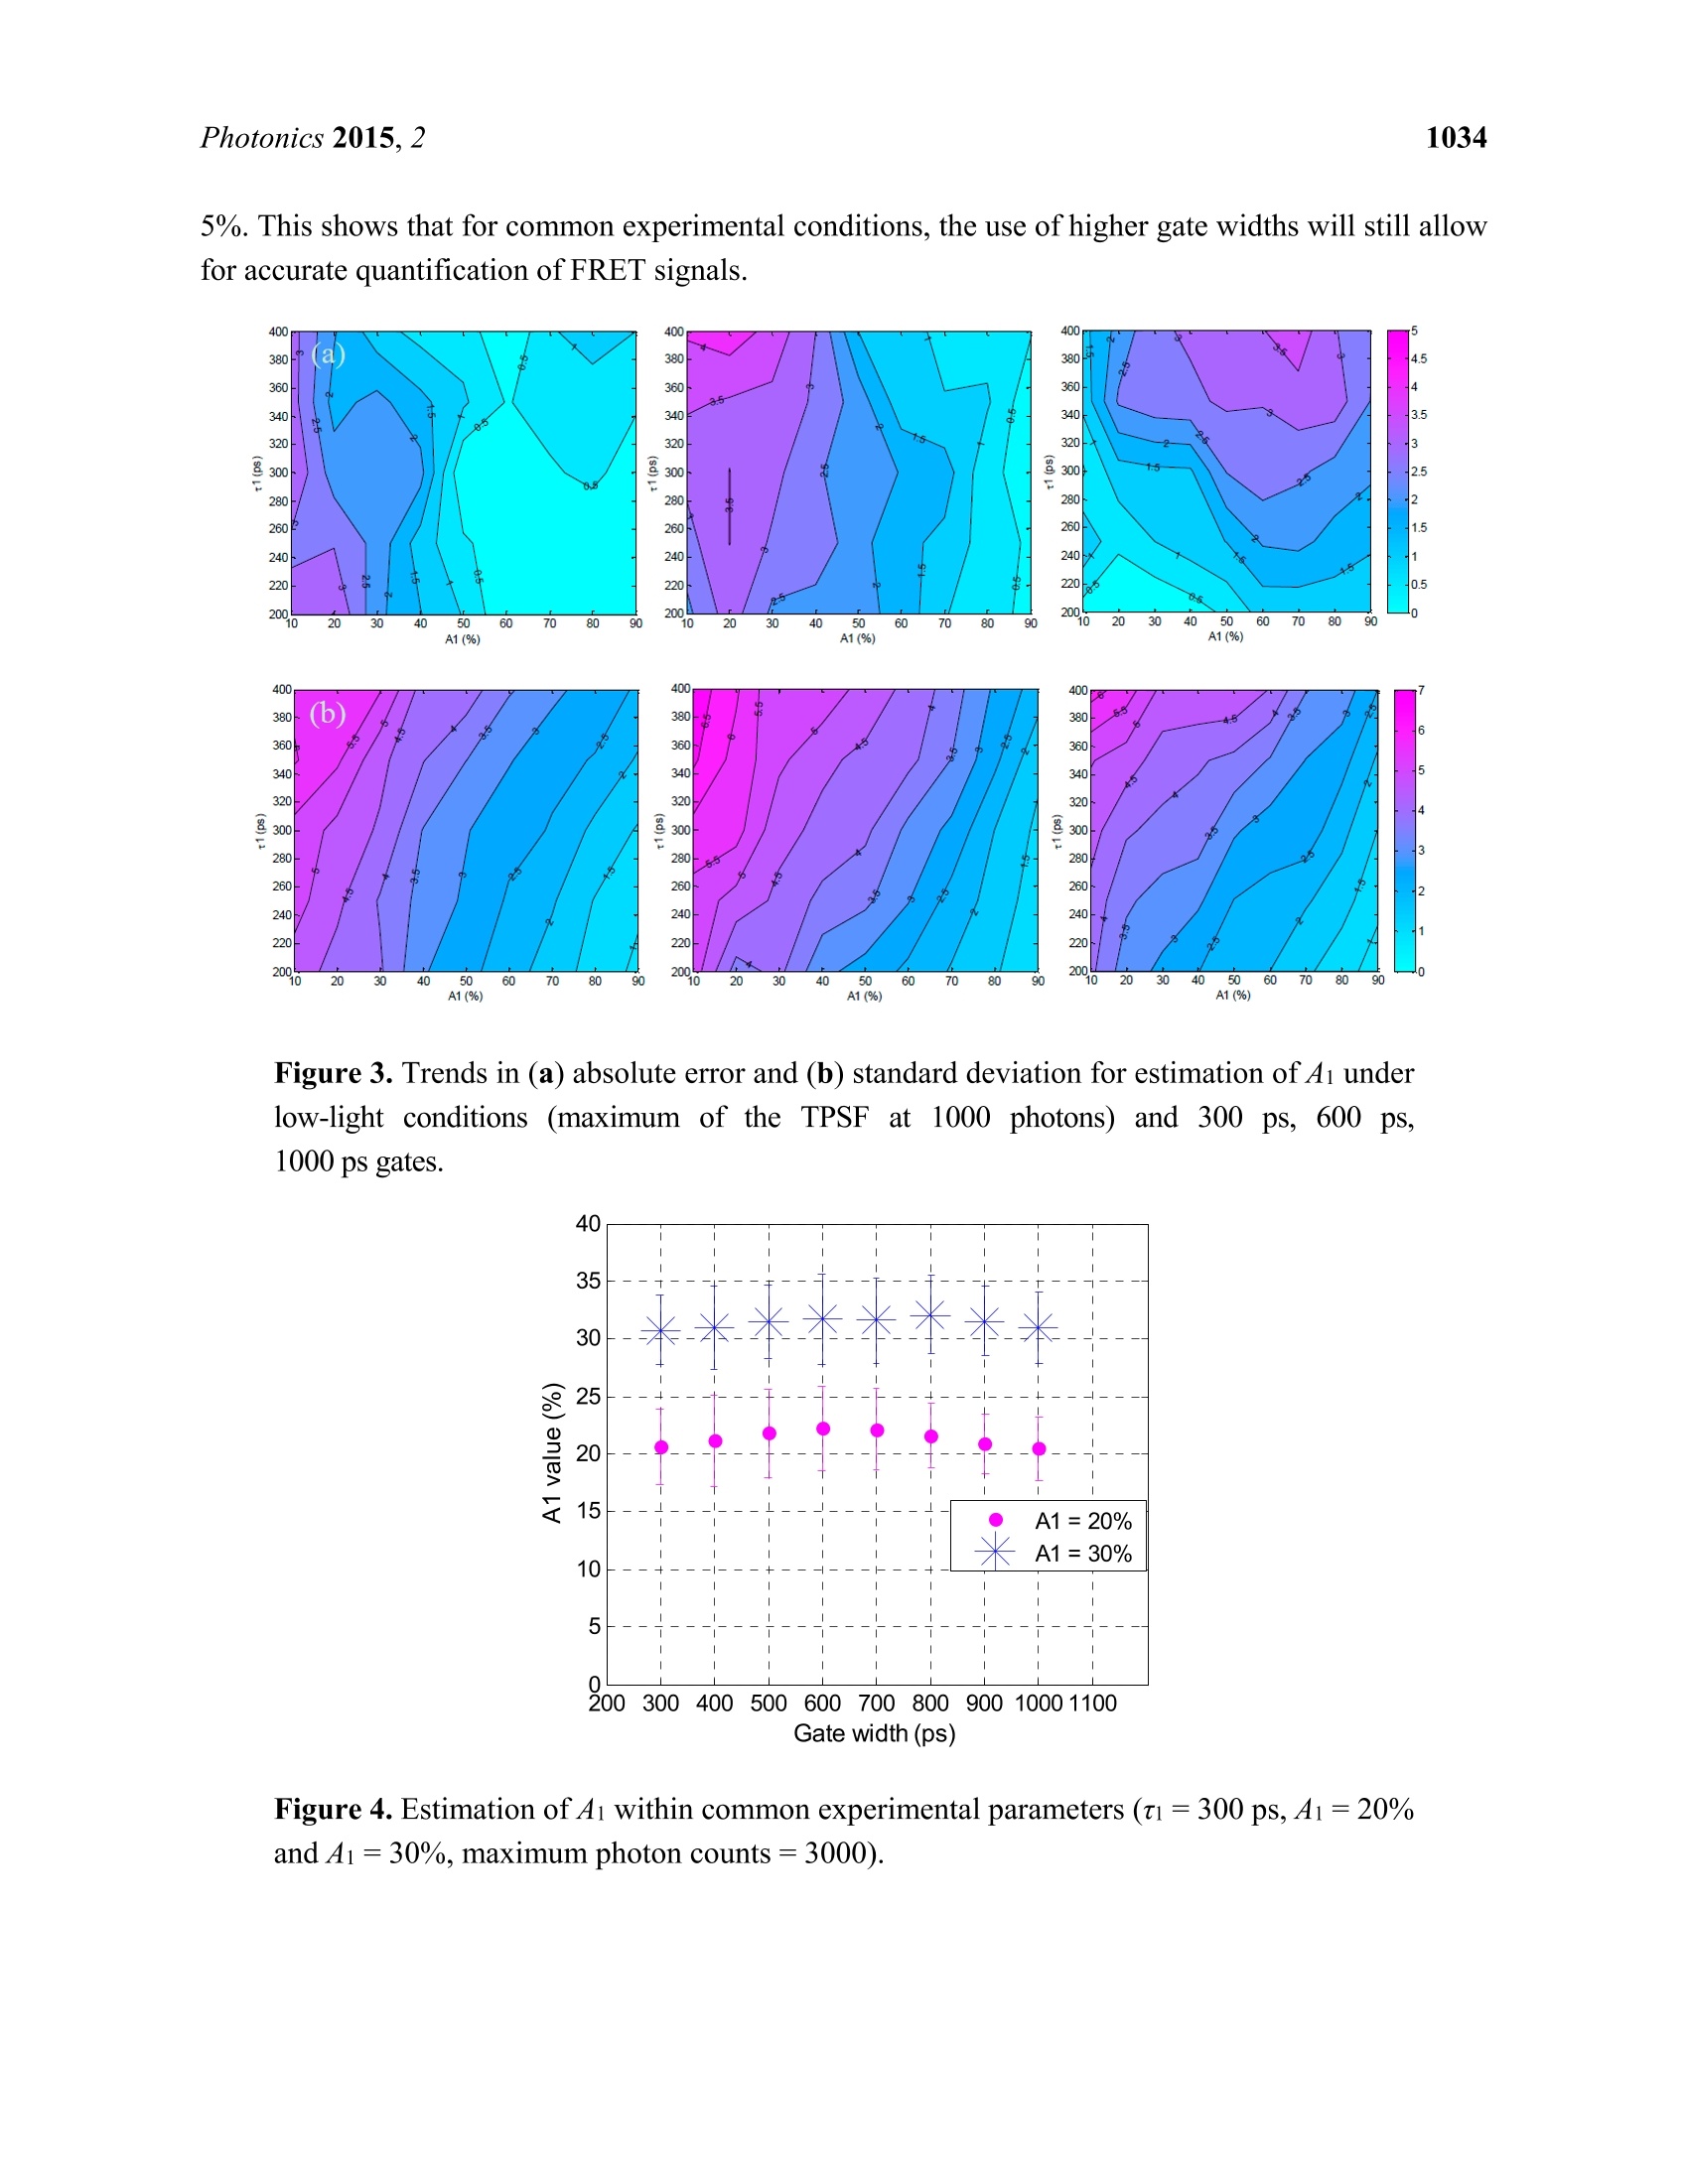
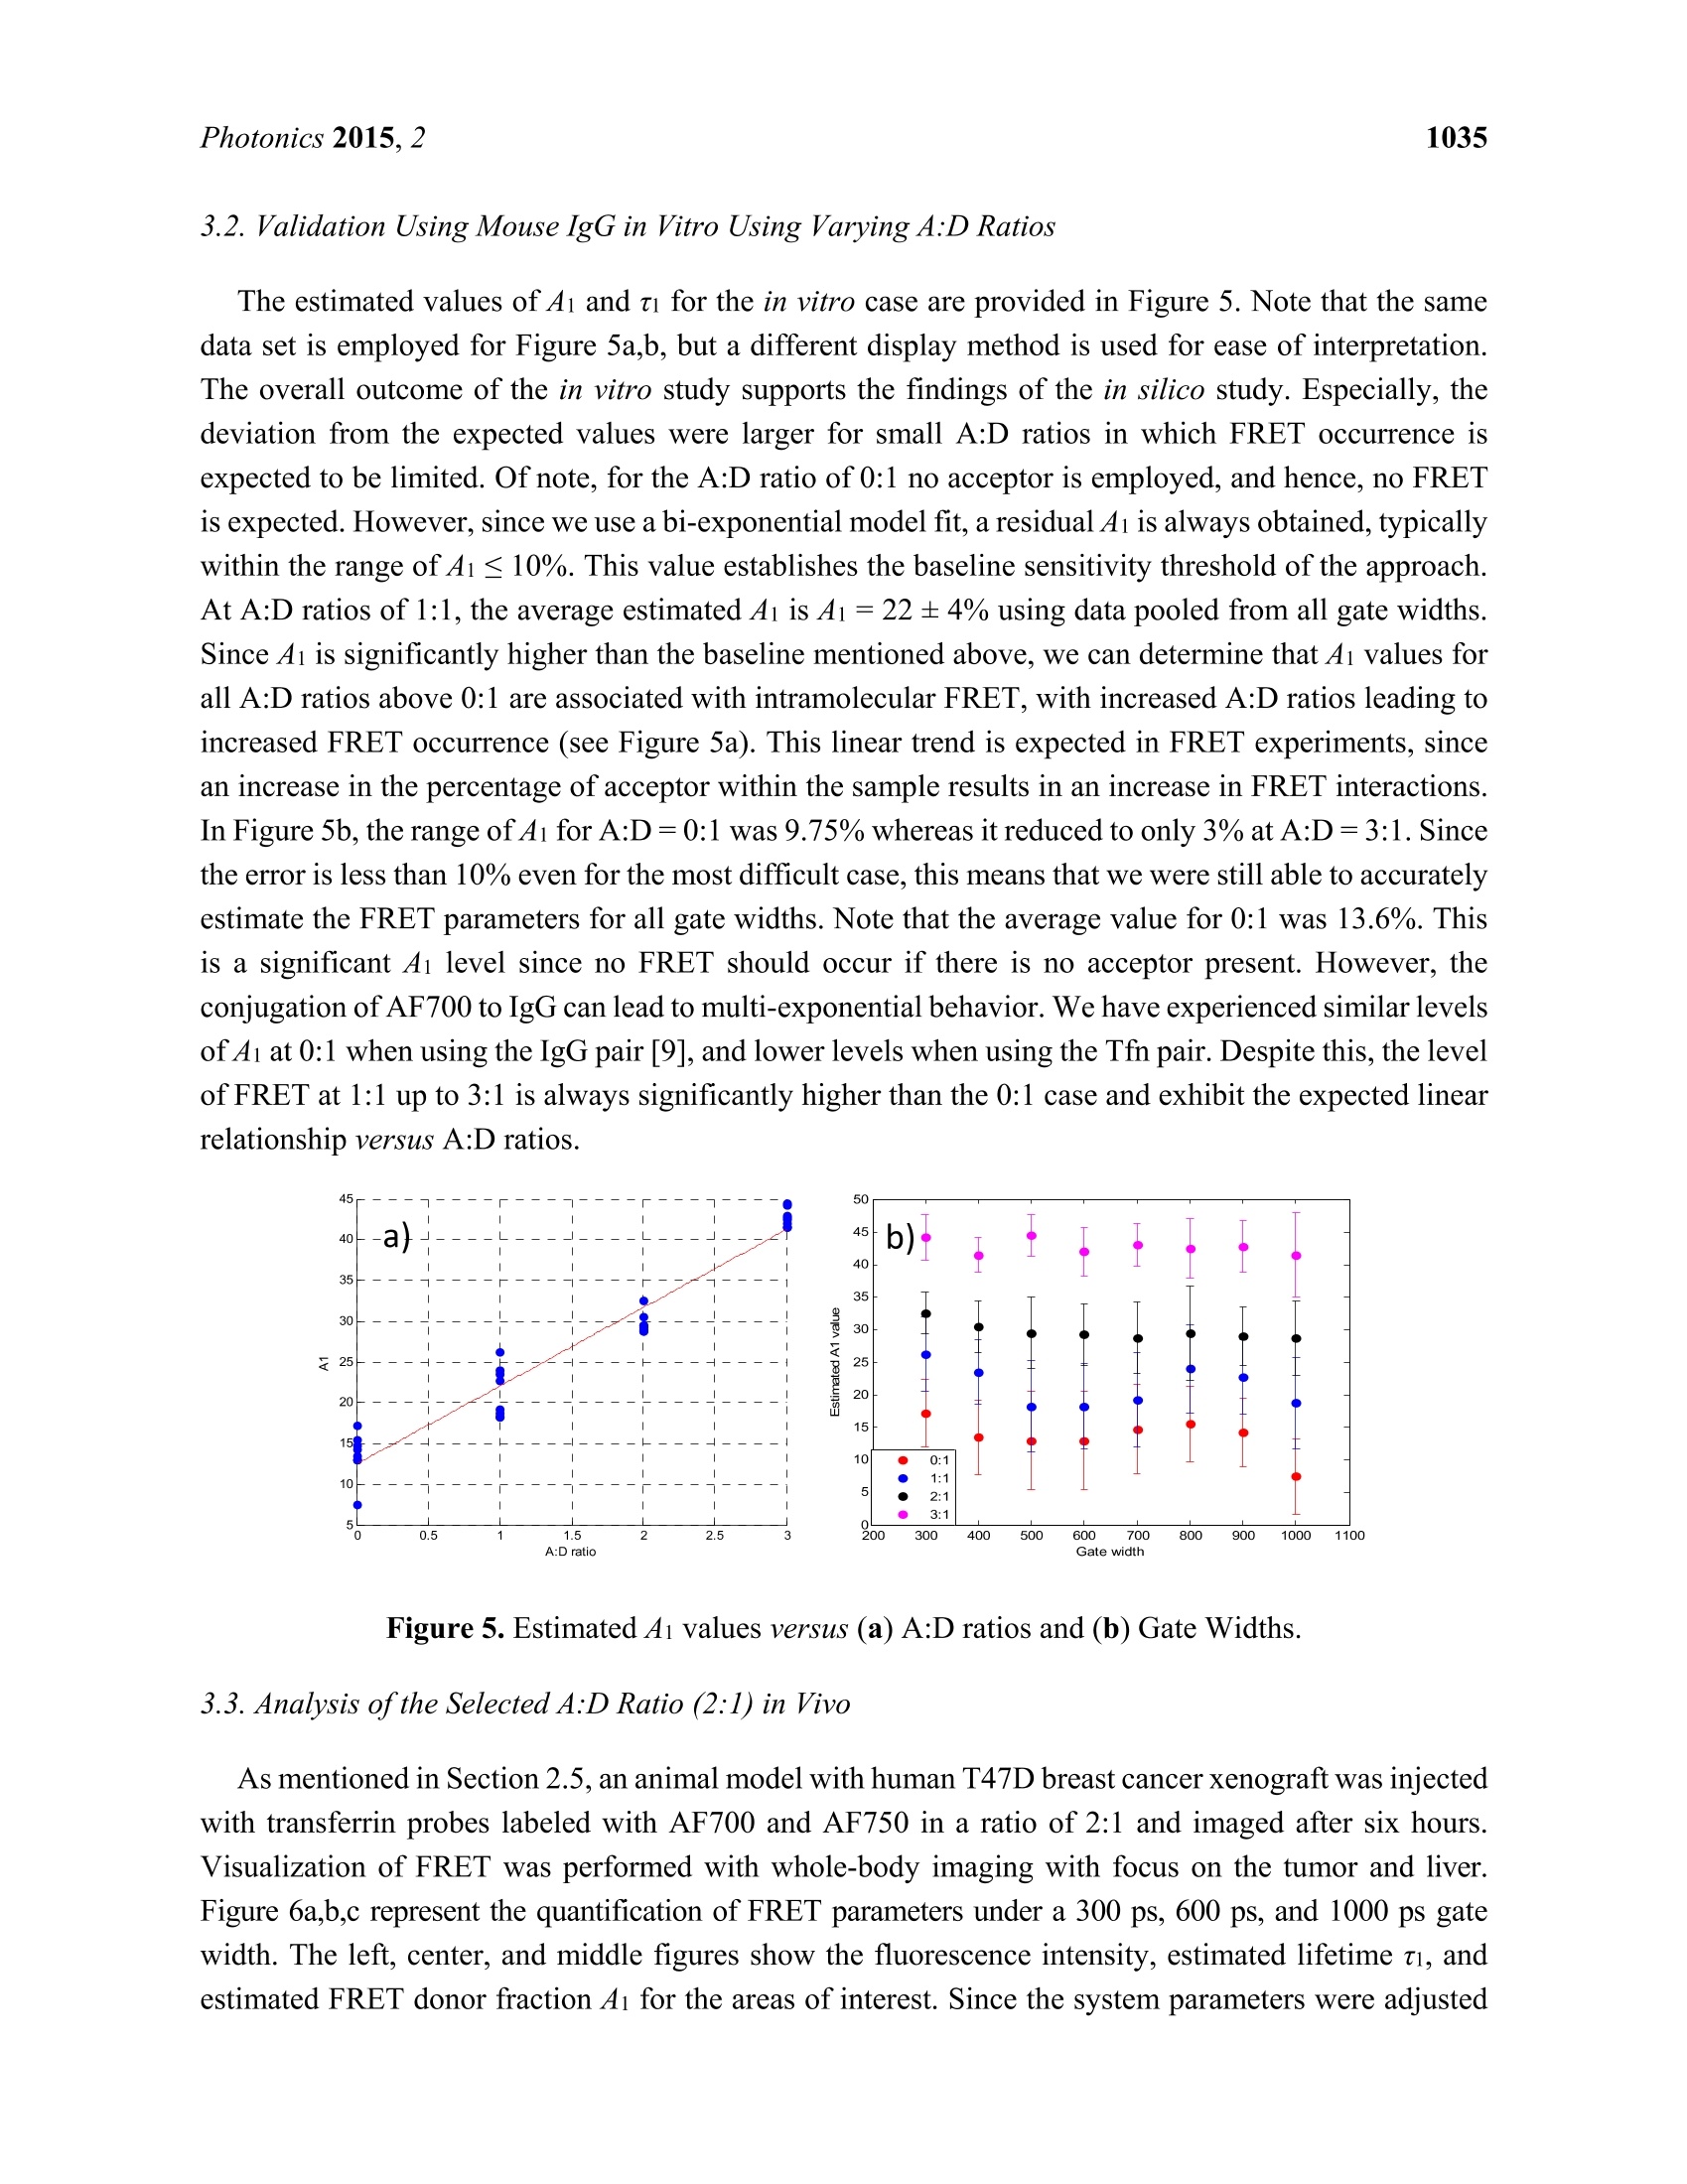
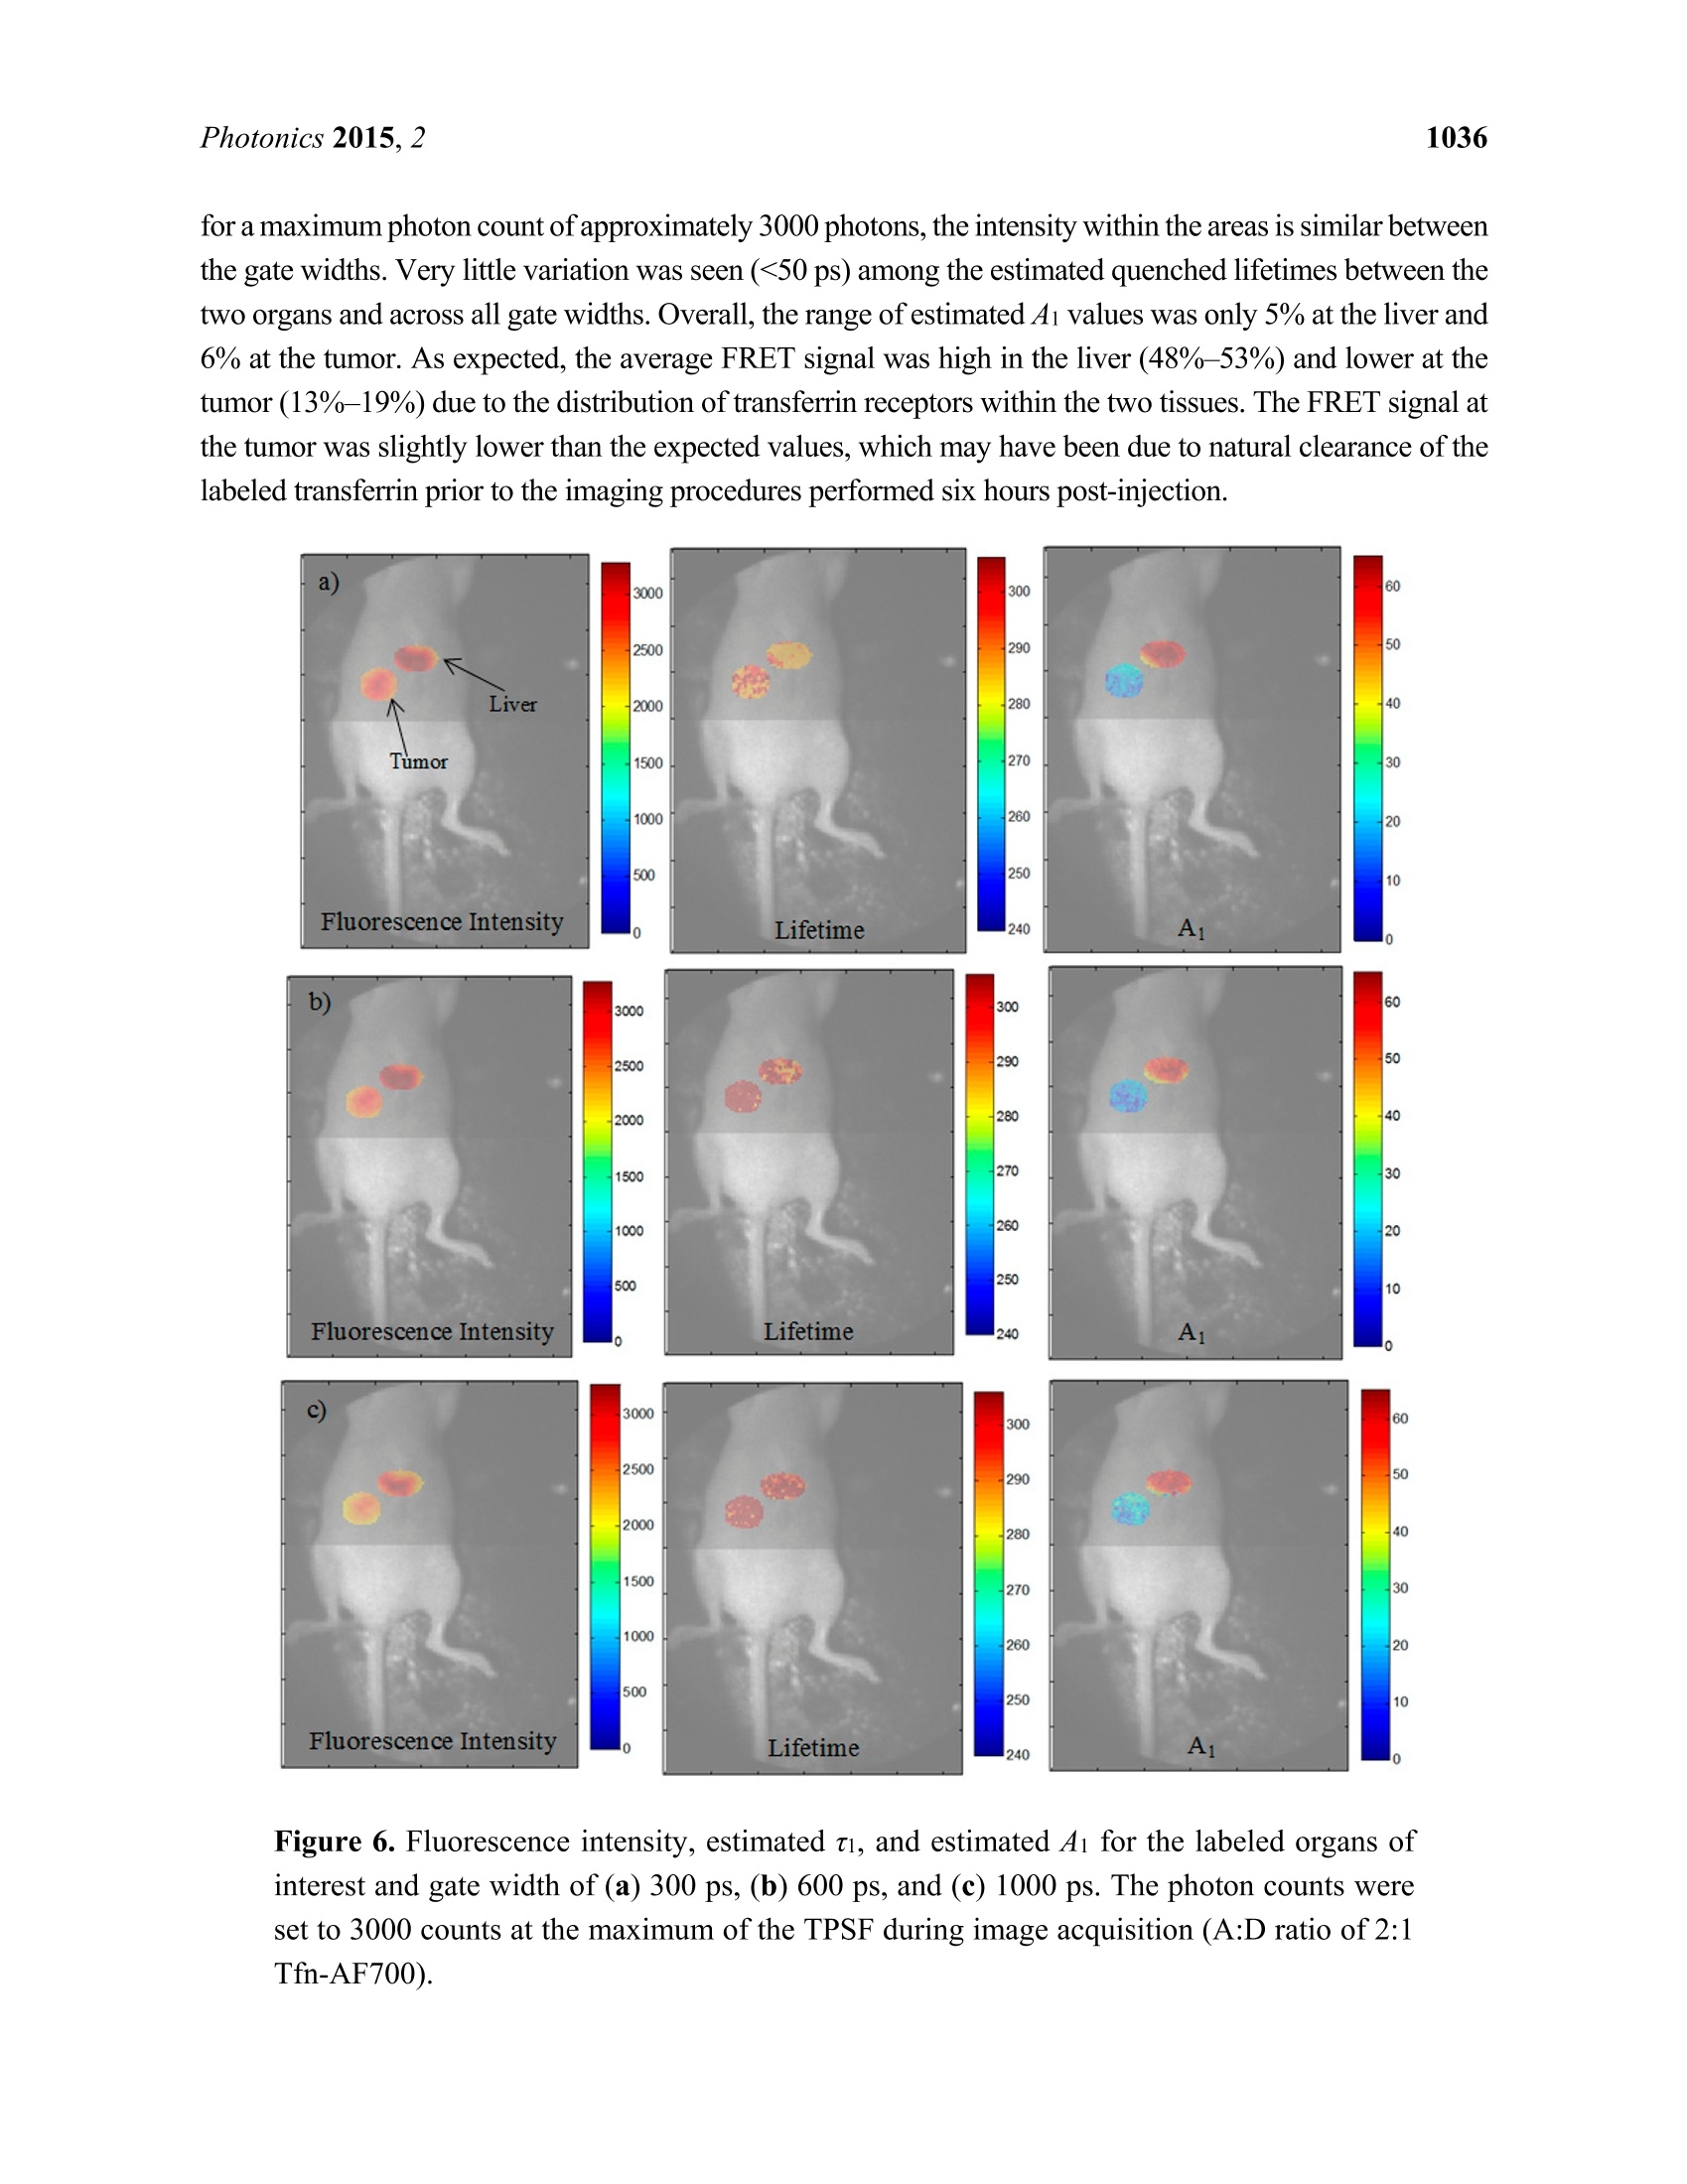
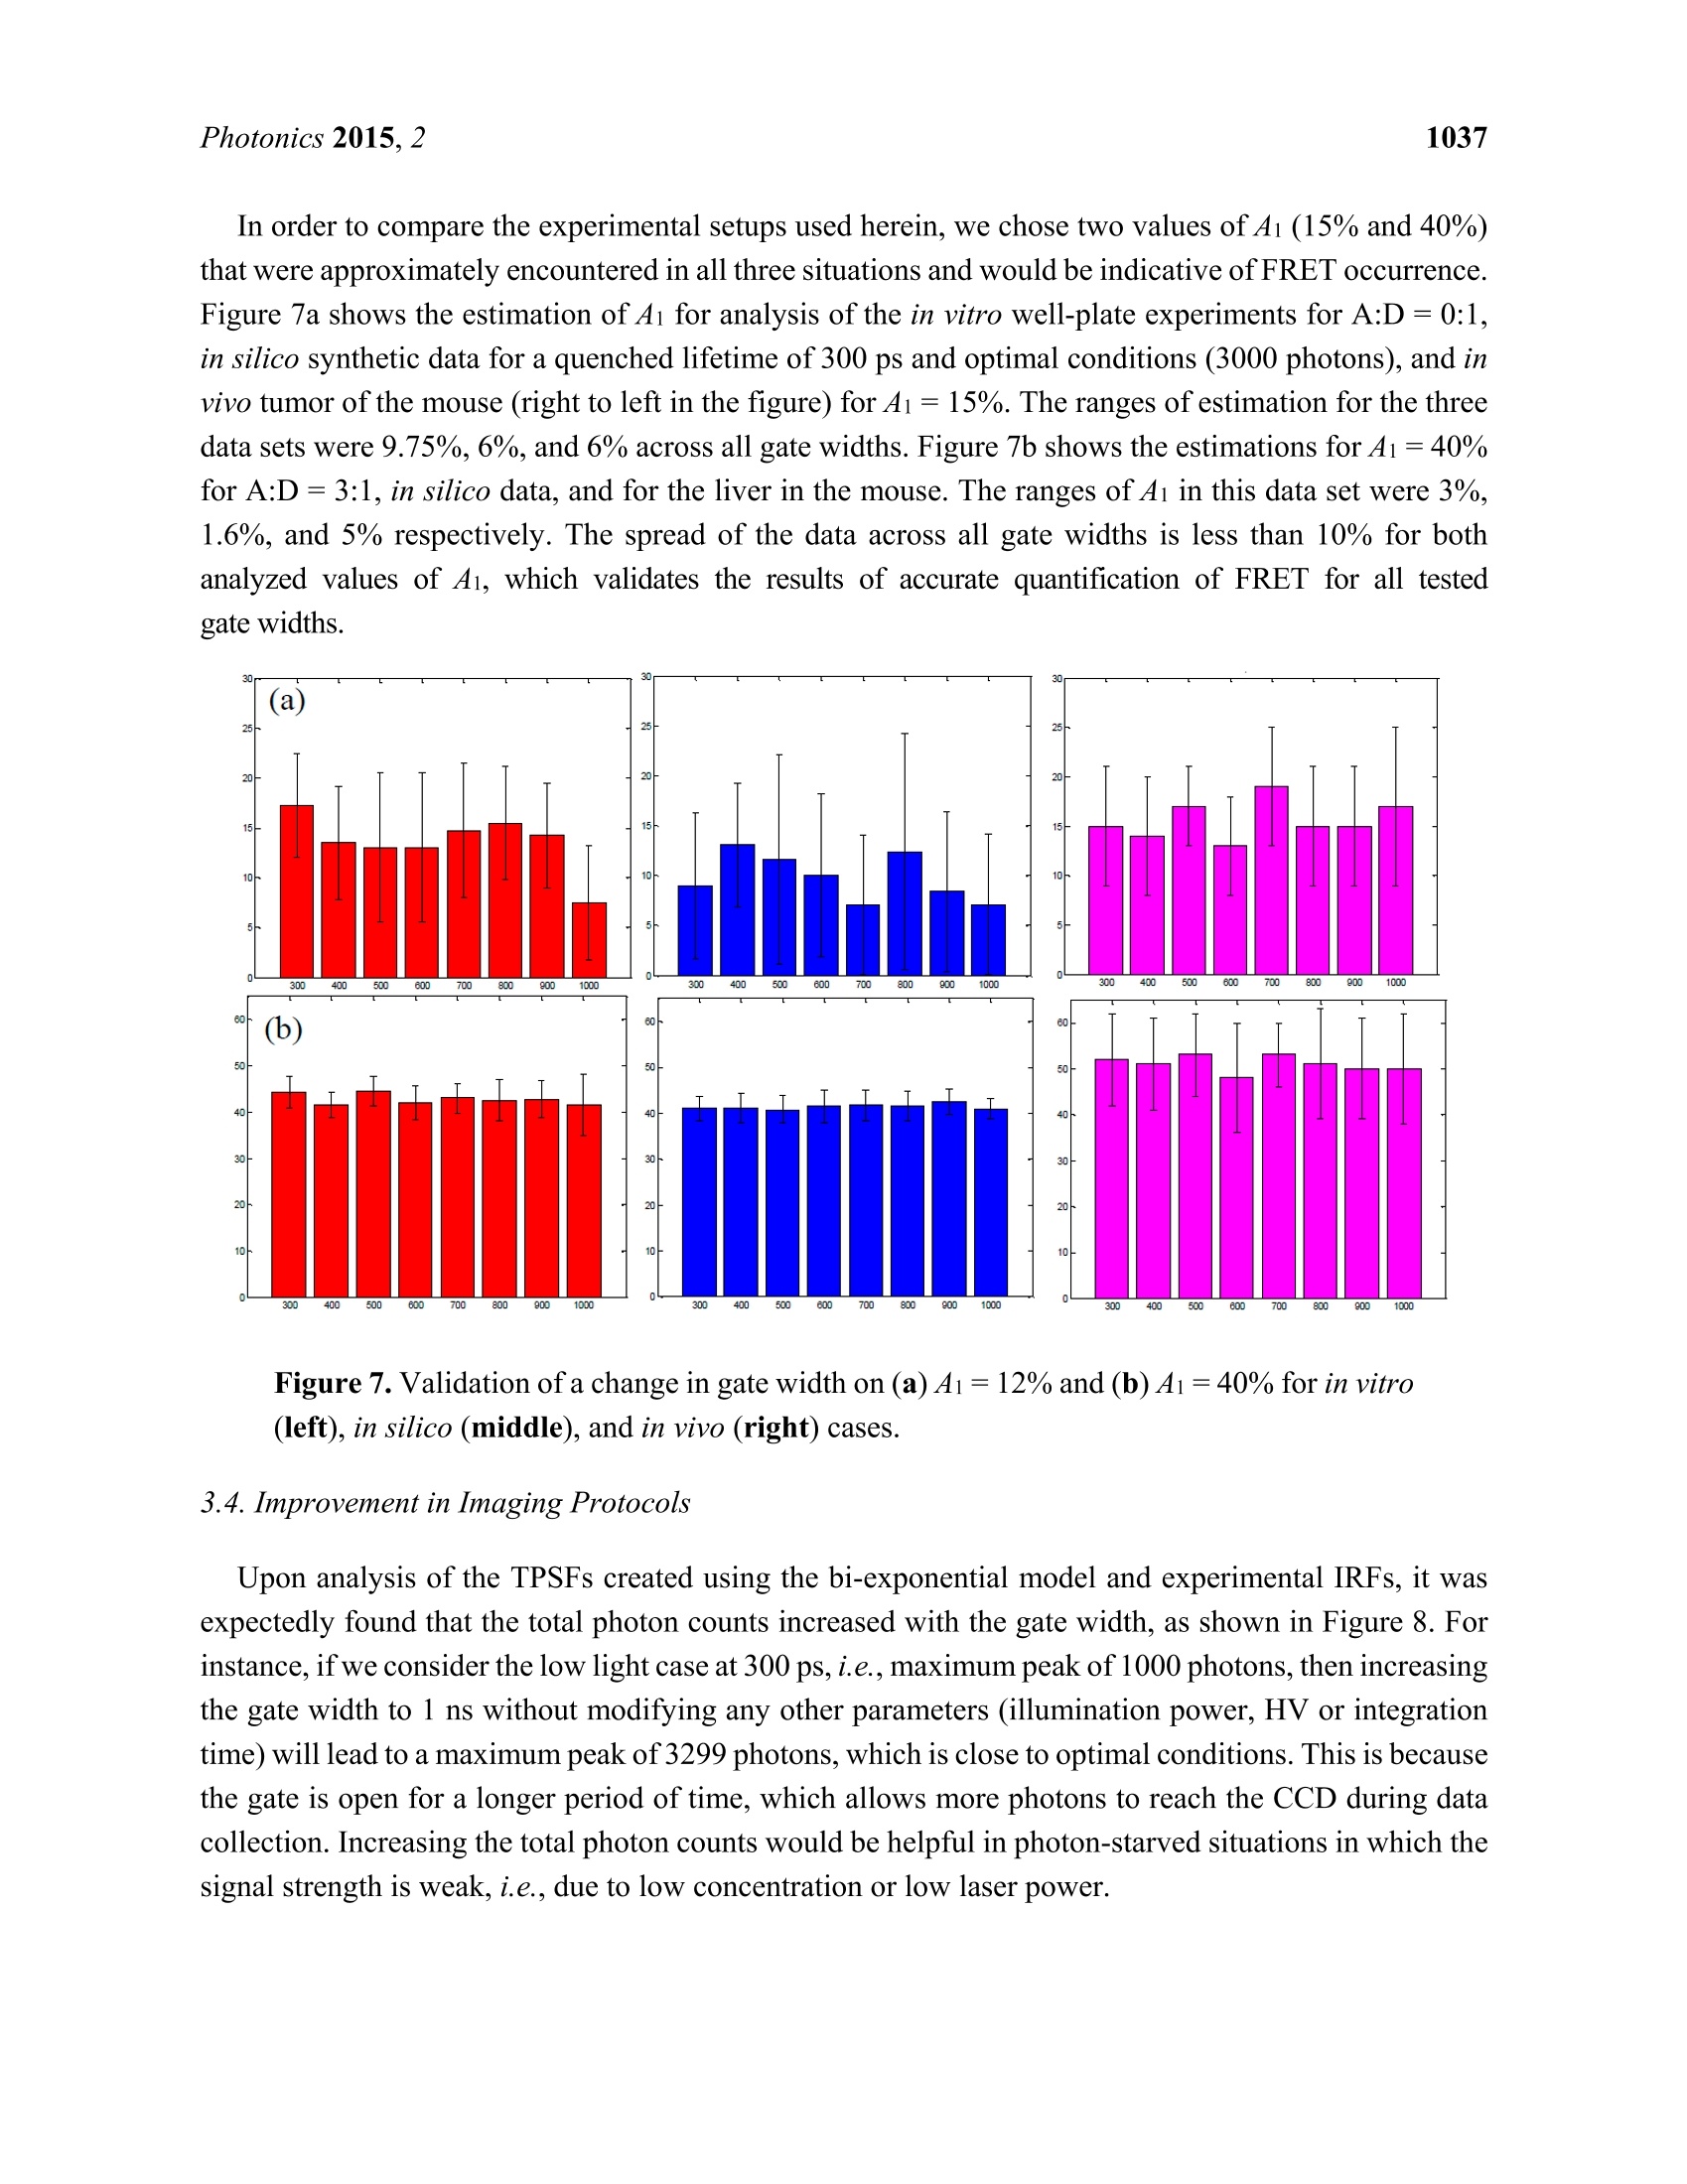
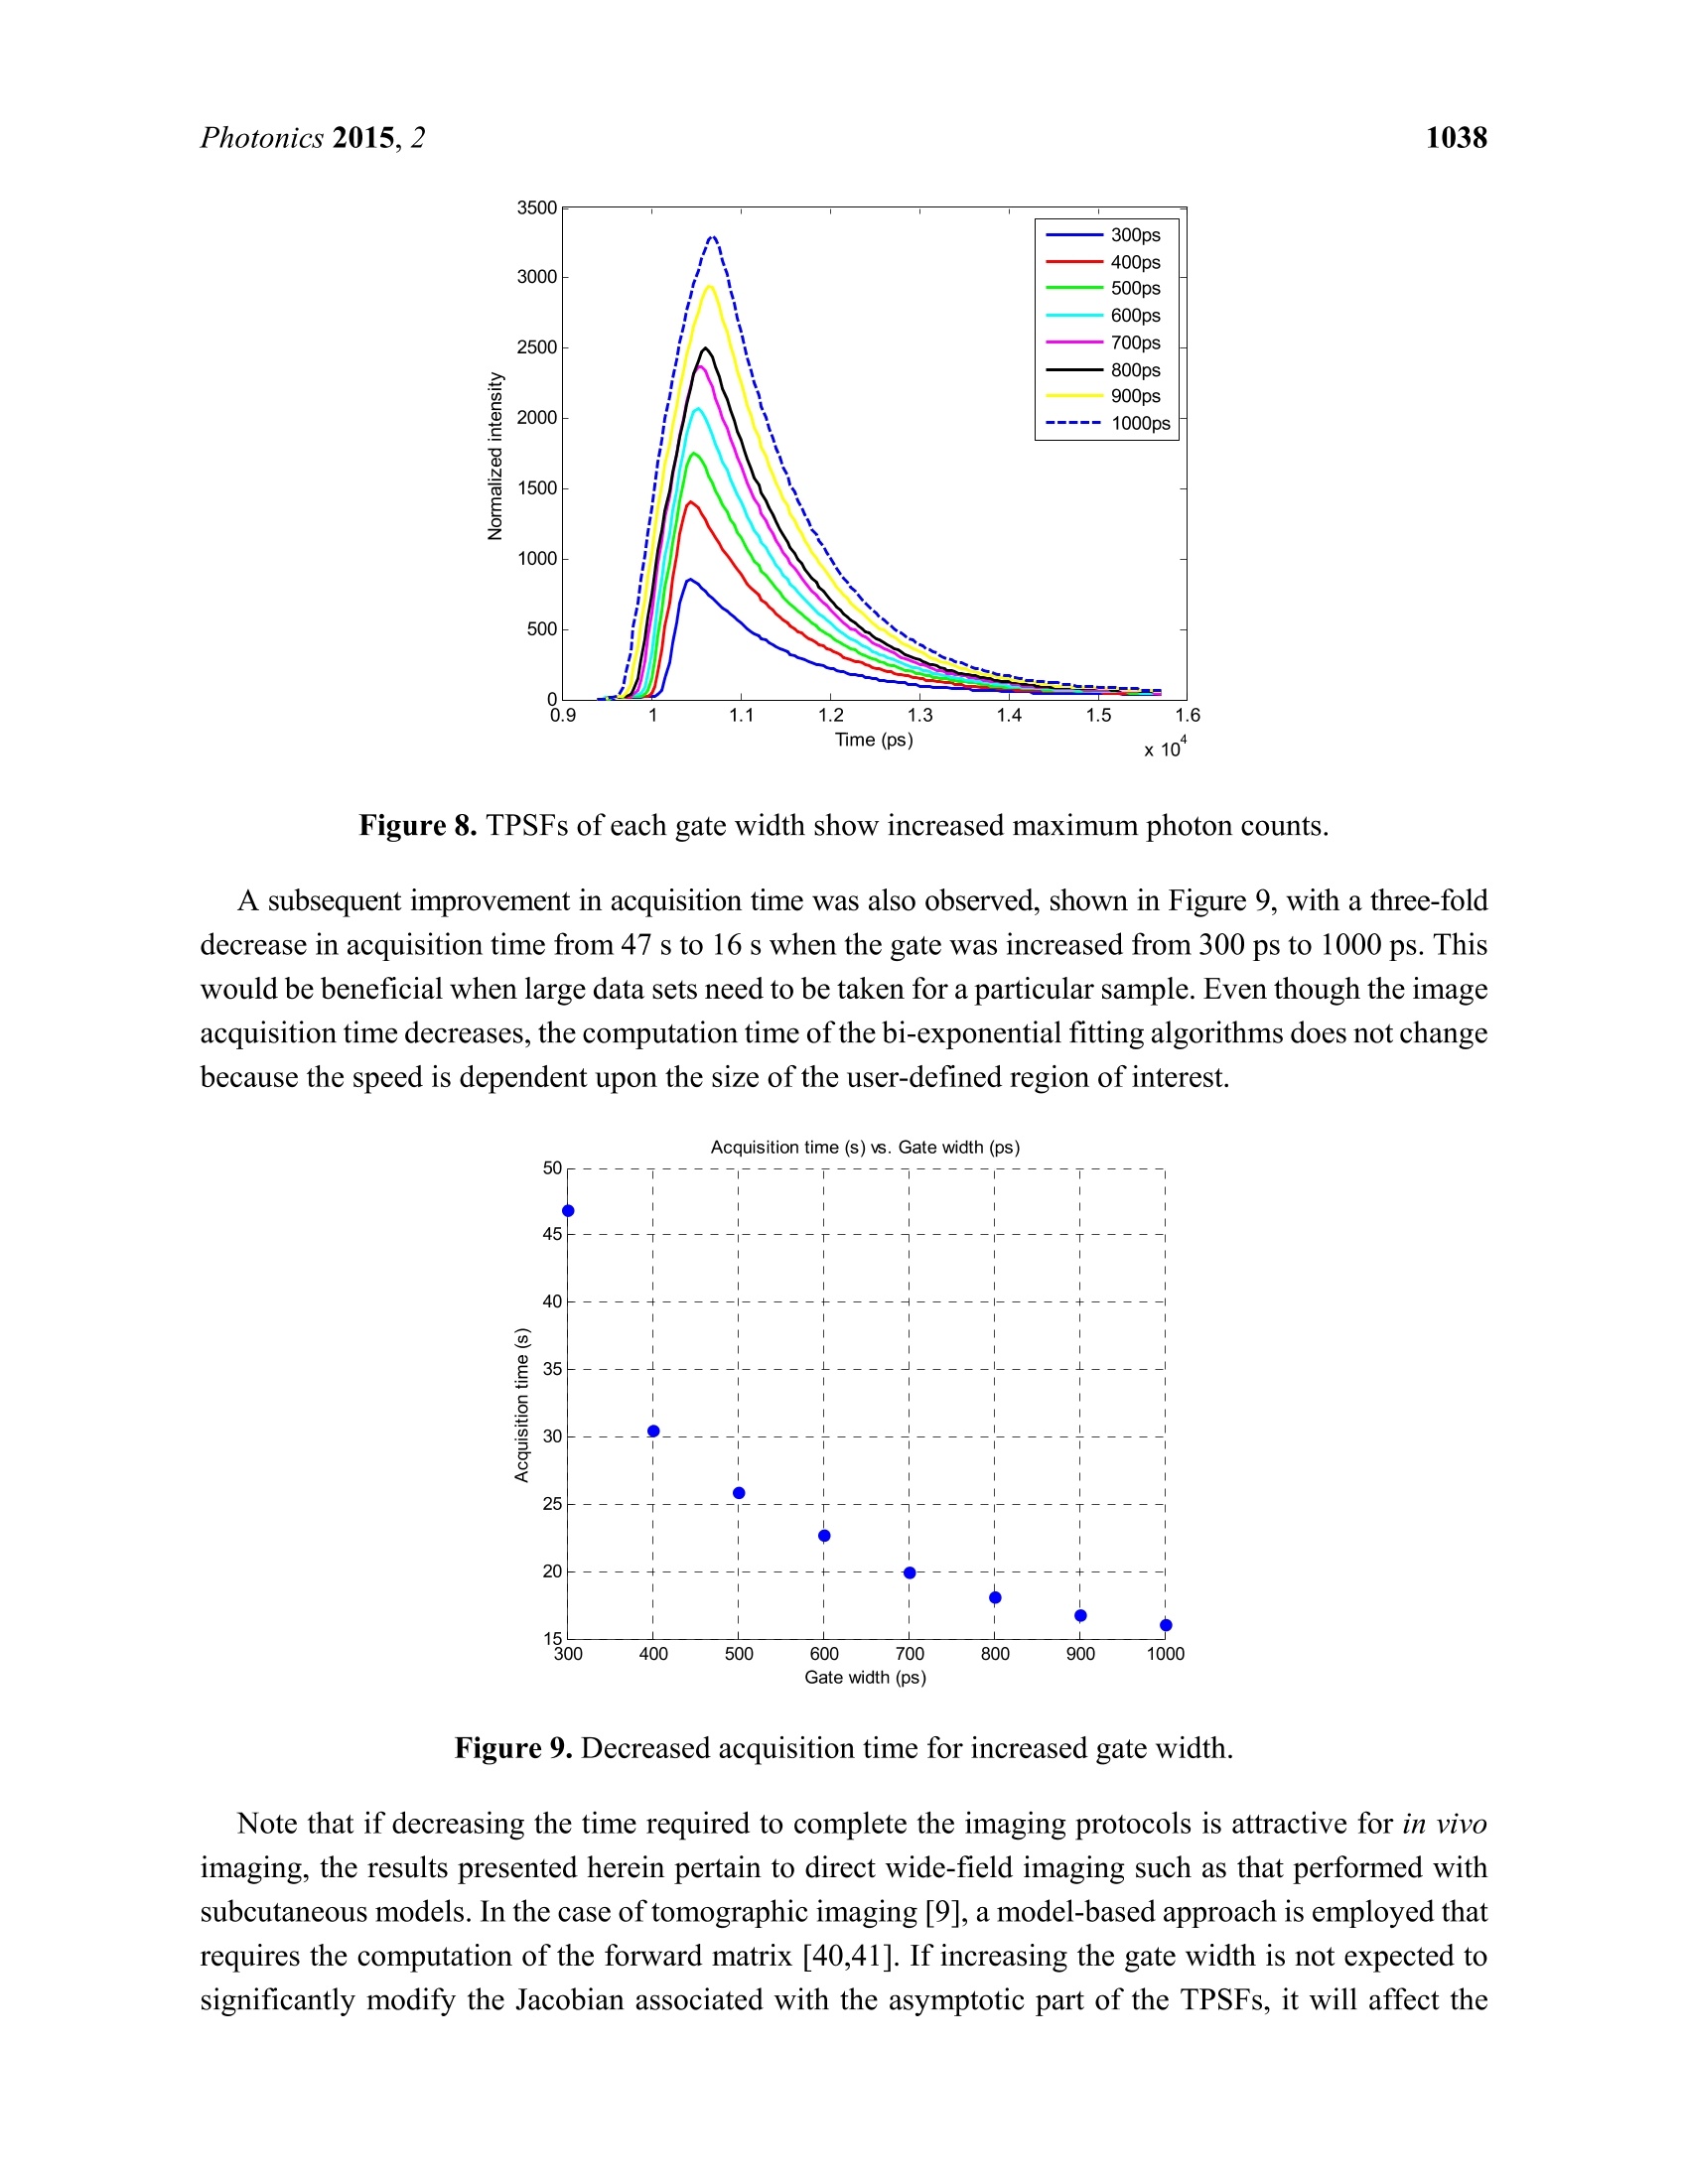
Photonics 2015, 2, 1027-1042; doi:10.3390/photonics2041027OPENACCESS 1028Photonics 2015,2 photonics ISSN 2304-6732 www.mdpi.com/journal/photonics Article Assessment of Gate Width Size on Lifetime-Based ForsterResonance Energy Transfer Parameter Estimation Sez-Jade Chen, Nattawut Sinsuebphon and Xavier Intes * Department of Biomedical Engineering, Rensselaer Polytechnic Institute, 110 8th Street, Troy, NY12180,USA; E-Mails: chens18@rpi.edu (S.-J.C.); sinsun@rpi.edu (N.S.) Author to whom correspondence should be addressed; E-Mail: intesx@rpi.edu;Tel.:+1-518-276-6964. Received: 28 August 2015 /Accepted: 23 September 2015/Published: 28 September 2015 Abstract: Forster Resonance Energy Transfer (FRET) enables the observation ofinteractions at the nanoscale level through the use of fluorescence optical imagingtechniques. In FRET, fluorescence lifetime imaging can be used to quantify the fluorescencelifetime changes of the donor molecule, which are associated with proximity betweenacceptor and donor molecules. Among the FRET parameters derived from fluorescencelifetime imaging, the percentage of donor that interacts with the acceptor (in proximity) canbe estimated via model-based fitting. However, estimation of the lifetime parameters can beaffected by the acquisition parameters such as the temporal characteristics of the imagingsystem. Herein, we investigate the effect of various gate widths on the accuracy ofestimationof FRET parameters with focus on the near-infrared spectral window. Experiments wereperformed in silico, in vitro, and in vivo with gate width sizes ranging from 300 ps to 1000 ps inintervals of 100 ps. For all cases, the FRET parameters were retrieved accurately and theimaging acquisition time was decreased three-fold. These results indicate that increasing thegate width up to 1000 ps still allows for accurate quantification of FRET interactions evenin the case of short lifetimes such as those encountered with near-infrared FRET pairs. Keywords: Forster Resonance Energy Transfer (FRET); time-resolved imaging; gate width;fluorescence lifetime; gated ICCD; near infrared (NIR) dyes; in vivo imaging 1.Introduction Forster Resonance Energy Transfer (FRET) is a phenomenon involving the non-radiative transfer ofenergy between an excited molecule of higher energy (donor) and one of lower energy (acceptor) [1,2].This interaction only occurs when the molecules are approximately 2-10 nm apart, a distance that iscomparable to the scale of biological interactions at the molecular level [3], and when there is overlapbetween the spectra of the two molecules. On transmission of energy to the acceptor, the fluorescencelifetime of the donor is reduced and its fluorescence emission intensity decreases. It is possible to useboth intensity and lifetime imaging to establish the occurrence of FRET, but lifetime imaging benefitsfrom instrumental implementation of single wavelength excitation/detection, independence from localintensity or concentration, and limited effect of background optical properties for in vivo imaging [4].Lifetime imaging allows us to quantitatively retrieve the donor molecule populations that are free andthose that are interacting with the acceptor within the sample [5,6]. The use of FRET for in vitro studiesis already well established [7,8], and researchers have begun to establish the proper techniques for invivo studies [9-12]. However, the ability to visualize fluorescence within an in vivo sample is limited by the absorptionand scattering of the incoming light within the tissue. For intact animal tissues, the absorbance ofbiological substances such as water and hemoglobin is highest for wavelengths between 200 nm and650 nm [13,14], which are within the visible region. Researchers have been using visible fluorescenceas a marker for many years with some variants of GFP [15], such as cyan and yellow FPs (CFP, YFPrespectively) employed for FRET experiments in vitro [16]. These fluorophores are excited and emitenergy in the visible range, which severely limits the depth of interrogation, and also leads to low imageresolution and high background fluorescence due to scattering [17]. In order to enable visualization ofdeep tissues, we instead perform imaging in the near infrared (NIR) region between 600 nm and1000 nm [14,18,19]. The reduced scattering and absorption properties of biological tissues in thisspectral window allow for deeper penetration of light into thick tissues, such as the bodies of smallanimals, without need for invasive methods such as dissection, biopsy, or complex and expensive modelssuch as intravital chambers [19,20]. However, most of the NIR fluorophores produced to date have lowerefficiency and shorter lifetimes (typically less than 1.5 ns) than visible fluorophores (a few nanoseconds),and thus could be more difficult to image with established techniques such as those currently employedin microscopy [5,21]. Fluorescence lifetime imaging microscopy(FLIM) data can be acquired in either the frequencydomain (FD) or the time domain (TD). In FD-FLIM, a sinusoidally modulated source is used, and thephase shift between the excitation light and the emitted fluorescence is used to determine the lifetime.For wide-field imaging in low-light settings, TD-FLIM is preferred over FD-FLIM techniques. Hence,FD-FLIM is not used in this work and the reader is encouraged to refer to [22] for more information. InTD-FLIM, a pulsed light source is used and fast detectors record the build-up of the statistical temporalprofile of fluorescence emission (time point spread function-TPSF). For fast time-resolved detection,one can use either time correlated single-photon counting (TCSPC) or a gated-integration approach.TCSPC is efficient and provides high signal-to-noise ratio (SNR), but has longer acquisition time and istypically associated with a single detector acquisition scheme [22-24]. Conversely, time-gated systems allowfor dense spatial acquisition but are relatively inefficient in photon collection. Time-gated systems are built around a CCD camera coupled with a fast optical gating system that can be opened at specified gatedelays and for specific lengths of time. When the CCD is triggered by a laser pulse, the CCD is “gated-on"and photons are collected at the CCD. The amount of time that the CCD is in this “gated-on"state isreferred to as the gate width. Scanning of the gate delays allows for acquisition of the entire TPSF ateach pixel of the camera. Selecting a proper gate width is of importance for all biomedical optics applications. For instance,Sharman et al. [25] demonstrated that larger gate width led to increased photon counts and improvedaccuracy of lifetime estimation in mono-exponential cases. Conversely, Venugopal previouslydemonstrated that increasing the size of the gate results in a broadening of the instrument responsefunction (IRF) characteristic of the system and increased difficulty in estimation of optical properties(ua, us’) of a sample [26]. For model based fitting, Ma et al. [27] demonstrated that if the lifetime is ~1.5times larger than the IRF, accurate lifetime fitting can be obtained without convolution of the IRF.However, in the case of FRET, a double exponential behavior is expected with a short lifetimecomponent. Zhong et al. [28] showed that picosecond-gating is a useful approach for imaging FRETvisible fluorophores with lifetimes in the nanosecond-range. To the best of our knowledge, the effect ofgate width on estimation of the FRET lifetime parameters in the NIR region has not yet been reported.Herein, a systematic investigation of the impact of gate width size upon the accuracy of the lifetimemodel-based FRET quantification is investigated within fluorophore parameters relevant to the NIRspectral range. Simulations were performed over a wide range of reduced lifetimes associated with theFRETing donor population, as well as different FRETing donor population percentages. These syntheticdata were computed for gate widths ranging from 300 ps to 1000 ps, which are the typical valuesencountered in the literature and associated with commercially available gated ICCD systems. Model-basedfitting was performed to estimate the FRETing parameters and to assess the impact of gate-width onfitting accuracy. In vitro and in vivo experimental validation was performed using an NIR donor andacceptor FRET pair at different ratios. 2. Materials and Methods 2.1. Time-Resolved Optical Tomography System The setup of the time-resolved optical tomography system used in this study was described in detailby Venugopal et al. [26,29]. Briefly, a Ti-Sapphire MaiTai HP laser (Newport Spectra-Physics, Irvine,CA, USA) is used to provide 100 fs pulses at a repetition rate of 80 MHz, and a digital micromirrordevice (DMD) is used to modulate the light entering the sample. A portion of the light is then used totrigger a gated intensified charge coupled device (ICCD) camera (PicoStar HR, LaVision GmbH,Goettingen, Germany) for collection of fluorescence images in both reflectance and transmittancegeometries. In this study, the gate width of the ICCD is increased from 300 ps to 1000 ps in 100 psintervals through control of the ICCD using the DaVis software (LaVision GmbH, Goettingen,Germany). The IRF was acquired by putting a slightly diffusing white paper in the imaging plane. Thetemporal profiles ofeach gate width, normalized to have the same maximum value, are shown in Figure 1(log-scale). For all experiments and for collection of the IRFs, the step size between gates was set at 40 psand the laser excitation wavelength was set to 695 nm. The exposure time and laser power were changed to produce optimal signal on the sample, and datasets were taken at each gate width in order to determinethe effect on FRET fluorescence decay. In silico parameters were selected to match this experimentalsetup. For in vitro and in vivo studies, a 715 nm long-pass filter (FF01-715/LP-25,Semrock,NY, USA)and a 720/13 nm bandpass filter (FF01-720/13-25, Semrock,NY,USA) were used to filter the lightdetected at the ICCD during collection of the TSPFs. Figure 1. Experimental IRFs acquired from our wide-field imager at each gate width testedin this study. 2.2. Bi-Exponential Model Since two populations of donor molecules, those bound to acceptor and those unbound in solution,are present during a particular FRET interaction [5], the fluorescence decay follows a bi-exponential model: where I(t) is the fluorescence TPSF, IRF(t) is the instrument response function, t is the time, and represents convolution. ti and t2 are the lifetime coefficients while Ai and A2 are the amplitudecoefficients of the FRETing and non-FRETing donor molecules respectively. Poisson noise is addedafter the convolution to simulate the noise incurred during an experiment due to photon (“shot")noise [30,31]. Since Ai and ti represent the percentage of donor that participates in FRET and itsfluorescence lifetime, we focus on reporting the estimation of these two parameters in this work. 2.3. In Silico Analysis ofVarying A:D Ratios and Lifetimes TPSFs were formed using Equation (1) to simulate different Acceptor-to-Donor (A:D) ratios andfluorescence lifetimes by varying the FRET donor fraction Ai and the lifetime ti. The Ai value wasvaried from 10% to 90% in intervals of 10%, which represents an increase in the percentage of donorthat interacts with acceptor in the sample. The ti value was varied from 200 ps to 400 ps in intervals of 50 ps to simulate various fluorescence lifetimes that are common for NIR fluorophores in the quenchedstate. The lifetime of the unquenched donor was set to t =1 ns over the whole study. This lifetimematches that of AlexaFluor 700 (LifeTechnologies, NY, USA) in vivo, the donor used in the experimentalvalidation. These decay curves were then convolved with the IRFs collected experimentally at the givenset of gate widths, after which random Poisson noise was added. During the creation of the models, two experimental conditions were simulated: “optimal" and“low-light.”Under optimal experimental conditions, the exposure time and laser power within theimaging system are adjusted to provide the maximal amount of photons in the region of interest withoutsaturation of the CCD. The maximum photon count in this case is approximately 3000 photons for thesystem mentioned in this work (12-bits). In this condition, the SNR is optimal for all data acquired overthe field-of-view. This approach is experimentally achieved by using active wide-field illumination asdescribed in References [10,32,33]. In low-light conditions, the signal was normalized to a maximum of1000 photons at the CCD. Two hundred TPSFs were simulated for each gate width with the maximumintensity of the TPSF at either 3000 photons or 1000 photons. This threshold was set as double-exponentialfitting is notoriously difficult below such photon counts [34]. To retrieve the lifetime and fractional abundance of the quenched donor population, the asymptoticportions of the TPSF were fit with the bi-exponential model. Techniques such as rapid lifetimedetermination (RLD) are commonly employed with visible fluorophores, but they are not accurate whenthe IRF temporal width is not negligible compared to the considered lifetime [35].In the NIR, the IRFtemporal width is on the same order as the quenched donor lifetime or even larger. Hence, we employ aclassical model-based fit of the TPSF using the linear least-squares (LSQR) method [30]. 2.4. In Vitro Experiments Using an NIR FRET Pair Conjugated with Mouse Antibodies AlexaFluor 700 and AlexaFluor 750, conjugated to mouse immunoglobin G (IgG) were purchaseddirectly from LifeTechnologies. Solutions with various mixture ratios of FRET donor-acceptor pairswere prepared in a 96-well plate and imaged at the specified gate widths. These two dyes were chosenbecause they provided the best lifetime-based FRET measurements in the NIR range among variousother potential FRET pairs [36]. Both labels were first diluted to a concentration of 50 ug/mL using PBSbuffer and then pipetted into the wells in A:D ratios of 0:1, 1:1,2:1, and 3:1. As shown previously,intermolecular FRET (or FRET fraction of FRETing donor) is linearly dependent on the A:D ratios [9,37].After 30 minutes, images were taken at each gate width while varying the exposure time and laser powerto produce optimal signal. For data processing, a region of interest (ROI) defined as a 14×14 pixel areawas employed for each well, leading to 196 pixels (TPSFs) for every condition tested. 2.5. In Vivo Experiments with Murine Models All in vivo procedures were performed according to the protocols of the Institutional Animal Careand Use Committee (IACUC) atRensselaer Polytechnic Institute. T47D breast cancer cells were injectedsubcutaneously into the mammary fat pads of a mouse to create a tumor model that developed for a fewweeks, as in the protocol described by Abe and colleagues [12]. After substantial tumor growth(~3×3×3 mm), the animal was injected through the tail-vein with a mixture of transferrin (Tfn) probeslabeled with AF700 or AF750 in an A:D ratio of2:1. Transferrin was used because it is a common carrier for anti-cancer drugs in the clinical field [38] and it is native to all tissues in the body. Six hours afterinjection, the mouse was anesthetized and imaged at different system gate widths at an excitationwavelength of 695 nm to visualize FRET interactions. Following data collection, the organs wereisolated in a region of interest and analyzed with bi-exponential fitting algorithms written in MATLAB(Mathworks, Natick, MA, USA). This algorithm uses least-squares methods to find a bi-exponential fit fora given decay curve and returns the FRET lifetime parameters. For this work, we focused on two organs:the liver and the tumor. As described in Reference [10], both from known biology and ex vivolin vivodata validation, the liver exhibits a high amount of FRET since it has a rich level of expression intransferrin receptors. The tumor represents a case of targeted delivery due to increased angiogenesis anda higher number of receptors for transferrin at the tumor site than in normal tissue. Increased FRETsignal within the tumor area would be indicative of uptake of transferrin through receptor-mediatedendocytosis [38,39]. 2.6. Fitting Methods Using Bi-Exponential Model Throughout this study, a least-squares method was used to fit the TPSFs to the model in Equation (1) inorder to retrieve the FRET donor fraction Ai and the quenched lifetime t. The long lifetime t2 was fixedto 1.0 ns, the unquenched lifetime of AlexaFluor 700 as provided by the manufacturer. Since thequenched lifetime ti is unknown, an initial guess of 280 ps was used and the parameter was fit within±50 ps. These values were chosen based on our previous experience [12]. The fit was performed on theasymptotic part of the TPSF, from 95% of the peak to 1% of the peak (typically ~130 gates) forrobustness [30]. The reported Ai and ti values are the average of the individual fit results for each pixelwithin the full region of interest. During the process of lifetime estimation in vitro and in vivo, only theTPSFs with maxima above 1000 photon counts were analyzed to stay consistent with the in silico study.All fitting parameters were kept constant over the whole study (in silico, in vitro and in vivo). 3. Results and Discussion In this study, the effect of gate width was tested in silico through creation of simulated TPSFs, invitro in a well-plate using IgG labeled with FRET donors and acceptors, and in vivo in a murinetumor model to provide a comprehensive analysis of the quantification of FRET under variousexperimental conditions. 3.1. In Silico Investigation As described previously in Section 2.3, the first set of simulated TPSFs was performed with optimalconditions in which the maximum photon count was 3000 photons. Figure 2a,b show the absolute errorand standard deviations for estimations of Ai (varied from 10% to 90%) and ti (varied from 200 ps to400 ps) for the 300 ps, 600 ps, and 1000 ps gate widths. The absolute estimation errors were less than3% for all tested parameters, with the highest error for the 1000 ps gate. As the gate width increased, themaximum error increased as well (1.4% at 300 ps, 2.2% at 600 ps and 2.6% at 1000 ps). However, thedistributions of error were different for each gate width. For the 600 ps gate the error was highest at A1 ≤30%, while the error was highest at A1≥60% for the 1000 ps gate. For the 300 ps gate the errorwas highest at both of these regions. Overall, the standard deviations were less than 10% for all cases, with the highest deviations at thelowest Ai values for all tested lifetimes. A low value of A1 (4i ≤ 10%) means that there is less donorparticipating in FRET within the sample, which would be difficult to quantify no matter the lifetime ofthe fluorophore. The standard deviations are seen to slightly increase with gate width for the three casesshown in Figure 2. Notably, ti has less effect on parameter accuracy than Ai because the quenchedlifetime should be independent of concentration and intensity [22,31]. Figure 2. Trends in (a) absolute error and (b) standard deviation for estimation of Ai underoptimal conditions (maximum of the TPSF at 3000 photons) and 300 ps, 600 ps, 1000 ps gates. The second set of synthetic TPSFs was set with low-light, or photon-starved, conditions in which themaximum count was 1000 photons. Figure 3a,b summarizes the absolute error and standard deviationsof estimation of Ai for the low-light conditions and a 300 ps, 600 ps, and 1000 ps gate. The overallresults in the low light conditions follow the same trend as in the optimal conditions, with an increase inobserved errors and standard deviation as expected. The maximum absolute errors for this case were~4.3%. A similar trend of increased deviation at low values of Ai is also observed, with a maximumdeviation of 6.8% and increasing deviation for higher gate widths. Even though a broad range of Ai and ti values were tested, realistic in vivo experiments forintermolecular FRET are performed under the“optimal conditions”in which the maximum intensity inthe region of interest is approximately 3000 photons, yielding a FRET donor fraction (4i) in the 20%-30%range and a quenched fluorescence lifetime(ti) of 300 ps. When the fluorescence decay curves withinthese experimental parameters were analyzed, a consistent trend of accurate estimation of the Ai valueswas observed for all tested gate widths. For both tested Ai values, there is less than 2.3% absolutedifference (11.4% relative) from the true value, as seen in Figure 4, with standard deviations of less than 5%. This shows that for common experimental conditions, the use of higher gate widths will still allowfor accurate quantification of FRET signals. Figure 3. Trends in (a) absolute error and (b) standard deviation for estimation ofAi underlow-light conditions (maximum of the TPSF at 1000 photons) and 300 ps, 600 ps,1000 ps gates. Figure 4. Estimation of Ai within common experimental parameters (ti=300 ps,A1=20%and A1=30%, maximum photon counts=3000). 3.2. Validation Using Mouse IgG in Vitro Using Varying A:D Ratios The estimated values of Ai and t for the in vitro case are provided in Figure 5. Note that the samedata set is employed for Figure 5a,b, but a different display method is used for ease of interpretation.The overall outcome of the in vitro study supports the findings of the in silico study. Especially, thedeviation from the expected values were larger for small A:D ratios in which FRET occurrence isexpected to be limited. Of note, for the A:D ratio of 0:1 no acceptor is employed, and hence, no FRETis expected. However, since we use a bi-exponential model fit, a residual Ai is always obtained, typicallywithin the range of Ai ≤10%. This value establishes the baseline sensitivity threshold of the approach.At A:D ratios of 1:1, the average estimated Ai is A1=22±4% using data pooled from all gate widths.Since Ai is significantly higher than the baseline mentioned above, we can determine that A1 values forall A:D ratios above 0:1 are associated with intramolecular FRET, with increased A:D ratios leading toincreased FRET occurrence (see Figure 5a). This linear trend is expected in FRET experiments, sincean increase in the percentage of acceptor within the sample results in an increase in FRET interactions.In Figure 5b,the range of Ai for A:D=0:1 was 9.75% whereas it reduced to only 3% at A:D=3:1. Sincethe error is less than 10% even for the most difficult case, this means that we were still able to accuratelyestimate the FRET parameters for all gate widths. Note that the average value for 0:1 was 13.6%. Thisis a significant Ai level since no FRET should occur if there is no acceptor present. However, theconjugation of AF700 to IgG can lead to multi-exponential behavior. We have experienced similar levelsof Ai at 0:1 when using the IgG pair [9], and lower levels when using the Tfn pair. Despite this, the levelof FRET at 1:1 up to 3:1 is always significantly higher than the 0:1 case and exhibit the expected linearrelationship versus A:D ratios. Figure 5. Estimated A1 values versus (a) A:D ratios and (b) Gate Widths. 3.3. Analysis of the Selected A:D Ratio (2:1) in Vivo As mentioned in Section 2.5, an animal model with human T47D breast cancer xenograft was injectedwith transferrin probes labeled with AF700 and AF750 in a ratio of 2:1 and imaged after six hours.Visualization of FRET was performed with whole-body imaging with focus on the tumor and liver.Figure 6a,b,c represent the quantification of FRET parameters under a 300 ps, 600 ps, and 1000 ps gatewidth. The left, center, and middle figures show the fluorescence intensity, estimated lifetime ti, andestimated FRET donor fraction Ai for the areas of interest. Since the system parameters were adjusted for a maximum photon count of approximately 3000 photons, the intensity within the areas is similar betweenthe gate widths. Very little variation was seen (<50 ps) among the estimated quenched lifetimes between thetwo organs and across all gate widths. Overall, the range ofestimated A1 values was only 5% at the liver and6% at the tumor. As expected, the average FRET signal was high in the liver (48%-53%) and lower at thetumor (13%-19%) due to the distribution of transferrin receptors within the two tissues. The FRET signal atthe tumor was slightly lower than the expected values, which may have been due to natural clearance of thelabeled transferrin prior to the imaging procedures performed six hours post-injection. Figure 6. Fluorescence intensity, estimated ti, and estimated Ai for the labeled organs ofinterest and gate width of (a) 300 ps, (b) 600 ps, and (c) 1000 ps. The photon counts wereset to 3000 counts at the maximum of the TPSF during image acquisition (A:D ratio of 2:1Tfn-AF700). In order to compare the experimental setups used herein, we chose two values of Ai (15% and 40%)that were approximately encountered in all three situations and would be indicative of FRET occurrence.Figure 7a shows the estimation of Ai for analysis of the in vitro well-plate experiments for A:D=0:1,in silico synthetic data for a quenched lifetime of 300 ps and optimal conditions (3000 photons), and invivo tumor of the mouse (right to left in the figure) for A1=15%. The ranges of estimation for the threedata sets were 9.75%, 6%, and 6% across all gate widths. Figure 7b shows the estimations for A1=40%for A:D=3:1, in silico data, and for the liver in the mouse. The ranges of Ai in this data set were 3%,1.6%, and 5% respectively. The spread of the data across all gate widths is less than 10% for bothanalyzed values of Ai, which validates the results of accurate quantification of FRET for all testedgate widths. Figure 7. Validation of a change in gate width on(a) Ai=12%and (b) A1=40% for in vitro(left), in silico (middle), and in vivo (right) cases. 3.4. Improvement in Imaging Protocols Upon analysis of the TPSFs created using the bi-exponential model and experimental IRFs, it wasexpectedly found that the total photon counts increased with the gate width, as shown in Figure 8. Forinstance, if we consider the low light case at 300 ps, i.e., maximum peak of 1000 photons, then increasingthe gate width to 1 ns without modifying any other parameters (illumination power, HV or integrationtime) will lead to a maximum peak of 3299 photons, which is close to optimal conditions. This is becausethe gate is open for a longer period of time, which allows more photons to reach the CCD during datacollection. Increasing the total photon counts would be helpful in photon-starved situations in which thesignal strength is weak, i.e., due to low concentration or low laser power. Figure 8. TPSFs of each gate width show increased maximum photon counts. A subsequent improvement in acquisition time was also observed, shown in Figure 9, with a three-folddecrease in acquisition time from 47 s to 16 s when the gate was increased from 300 ps to 1000 ps. Thiswould be beneficial when large data sets need to be taken for a particular sample. Even though the imageacquisition time decreases, the computation time of the bi-exponential fitting algorithms does not changebecause the speed is dependent upon the size of the user-defined region of interest. Figure 9. Decreased acquisition time for increased gate width. Note that if decreasing the time required to complete the imaging protocols is attractive for in vivoimaging, the results presented herein pertain to direct wide-field imaging such as that performed withsubcutaneous models. In the case of tomographic imaging [9], a model-based approach is employed thatrequires the computation of the forward matrix [40,41]. If increasing the gate width is not expected tosignificantly modify the Jacobian associated with the asymptotic part of the TPSFs, it will affect the rising portion (known as the early gates). This rising part is employed in tomography to impart resolutionon the reconstructions [42-44]. As seen in Figure 8, higher gate width leads to less steep rising TPSFs,which indicates the collection of more scattered photons. Accordingly, as described by Valim et al. [45], itis expected that larger gate widths will increase the spatial extent of the early gate Jacobians, leading toa reduced improvement in resolution. 4. Conclusion To our knowledge, this is the first work to analyze the effect of gate width on quantification of FRETin the NIR region. Lifetime-based FRET parameters were retrieved within less than 15% error in allcases investigated. The increase from 300 ps gate width to 1000 ps gate width did not lead to significantincrease in errors. However, it did provide substantial increase in photon counts and reduced acquisitiontimes. Hence, larger gate widths could improve the sensitivity of in vivo NIR FRET imaging, as well asreducing imaging protocol acquisition times. Acknowledgements The authors are grateful to Alena Rudkouskaya and Margarida Barroso for their collaborative efforton in vivo FRET imaging. This work was partly funded by the National Science Foundation throughCAREER award CBET 1149407 and National Institute of Health (NIH) R01 EB19443. Author Contributions Sez-Jade Chen performed all experimental validation and analysis, and wrote the paper. NattawutSinsuebphon assisted with the in vivo experiments. Xavier Intes devised the project and supervisedthe implementation. Conflicts of Interest The authors declare no conflict of interest. References 1. Sun, Y.; Wallrabe, H.; Seo, S.A.; Periasamy,A. FRET microscopy in 2010: The legacy of TheodorForster on the 100th anniversary of his birth. Chem. Phys. Chem. 2011, 12, 462-474. 2. Jares-Erijman, E.A.; Jovin, T.M. FRET imaging. Nat. Biotechnol.2003,21,1387-1395. 3. Warren, S.; Kimberley, C.; Margineanu, A.; Laine, R.; Dunsby, C.; Katan, M.; French, P. FLIM-FRETof Cell Signalling in Chemotaxis. Opt. Mol. Probes Imaging Drug Deliv. 2013, 9, doi:10.1364/OMP.2013.MTh1C.5. 4. Wallrabe, H.; Periasamy, A. Imaging protein molecules using FRET and FLIM microscopy. Curr.Opin. Biotechnol. 2005, 16,19-27. 5. Biskup, C.; Zimmer, T.; Kelbauskas, L.; Hoffmann, B.; Klocker, N.; Becker, W.; Bergmann, A.;Benndorf, K. Multi-dimensional fluorescence lifetime and FRET measurements. Microsc. Res.Tech.2007,70,442-451. 6. Pelet, S; Previte, M.J.R.; So, P.T.C. Comparing the quantification of Forster resonance energytransfer measurement accuracies based on intensity, spectral, and lifetime imaging. J. Biomed. Opt.2006, 11, doi:10.1117/1.2203664. 7. Kelly, D.J.;Warren, S.C.; Alibhai, D.; Kumar, S.; Alexandrov, Y.; Munro, I.; Margineanu, A.;McCormack, J.; Welsh, N.J.; Serwa, R.A.; et al. Automated multiwell fluorescence lifetime imagingfor Forster resonance energy transfer assays and high content analysis. Anal. Methods 2015, 7,4071-4089. 8. Kumar, S.; Alibhai, D.; Margineanu, A.; Laine, R.; Kennedy, G.; McGinty, J.; Warren, S.; Kelly, D.;Alexandrov, Y.; Munro, I.; et al. FLIM FRET technology for drug discovery: Automatedmultiwell-plate high-content analysis, multiplexed readouts and application in situ. Chem. Phys.Chem. 2011,12,609-626. 9. Venugopal,V.; Chen,J.; Barroso,M.; Intes, X. Quantitative tomographic imaging of intermolecularFRET in small animals. Biomed. Opt. Express 2012,3,3161-3175. ( 0. Z hao, L . ; Abe, K.; Rajoria, S.; Pian,Q.; Barroso, M.; Intes, X. Spatial ligh t modulator based activewide-field illuminatio n for e x vivo an d in vivo quantitative N I R FRET imaging. Biomed. Opt.Express 2014, 5,944-960. ) ( 1 1 . McGinty, J.; Stuckey, D.W.; S oloviev,V.Y.; Laine, R.; Wylezinska-Arridge, M.; Wells, D.J.;Arridge, S.R.; French,P.M.W.; Hajnal, J.V; Sardini, A. In vivo fluorescence lifetime tomographyof a FRET p robe expressed in mouse. Biomed. Opt. Express 2011,2,19 0 7-1917. ) ( 12. Abe, K.; Zhao, L.; Periasamy, A . ; I n tes, X.; Barroso, M . Non-invasive in vivo imaging of nearinfrared-labeled transferrin in breast cancer cells and tumors using fluorescence l i fetime FRET.PLoS ONE 2013, 8, doi:10.1371/journal.pone.0080269. ) ( 13. J acques, S.L. Optical Properties of Biological Tissues: A Review. Phys. Med. Biol. 2013,58,37-61. ) ( 14. .1 Pansare, V .J.; Hejazi, S.; Faenza, W.J.; Prud'Homme,R.K. Review of long-wavelength optical andNIR imaging materials: Contrast agents, fluorophores, and multifunctional nano carriers . Chem. Mater. 2012,24,812-827. ) 15.Sarder, P.; Maji, D.; Achilefu, S. Molecular Probes for Fluorescence Lifetime Imaging. Bioconjug.Chem. 2015, 26,963-974. 16. Isherwood, B.; Timpson,P.; Mcghee, E.J.; Anderson, K.I.; Canel, M.; Serrels, A.; Brunton, V.G.;Carragher, N.O. Live cell in vitro and in vivo imaging applications: Accelerating drug discovery.Pharmaceutics 2011, 3,141-170. ( 17. Nolting,D.D.; Gore, C.J.; Pham, W . Near-Infrared Dyes: Probe Development and Applications inOptical Mole-cular I maging. Curr. Org. S ynth. 2011,8, 521-534. ) ( 18 . . Zheng, G .; Chen, Y.; Intes, X.; Chance, B.; Glickson, J.D. Contrast-enhanced near-infrared (NIR) o ptical i maging for subsurface cancer detection. J. Porphyr. Phthalocya. 2004,8,1106-1117. ) 19.Stockholm, D.; Bartoli, M.; Sillon,G.; Bourg, N.; Davoust, J.; Richard, I. Imaging calpain proteaseactivity by multiphoton FRET in living mice. J. Mol. Biol. 2005, 346, 215-222. 20. Nobis, M.; McGhee, E.J.; Morton, J.P.; Schwarz, J.P.; Karim, S.A.; Quinn, J.; Edward, M.;Campbell, A.D.; McGarry, L.C.; Evans, T.R.J.; et al. Intravital FLIM-FRET imaging revealsdasatinib-induced spatial control of Src in pancreatic cancer. Cancer Res. 2013, 73,4674 4686. 21. Berezin, M.Y.; Achilefu, S. Fluorescence lifetime measurements and biological imaging. Chem.Rev. 2010,110,2641-2684. ( 22. C hang, C.-W.; Sud, D.; M y cek, M.-A. Flu o rescence lifetime imaging microscopy. Methods CellBiol . 2007,81,495-524. ) 23. Padilla-Parra, S.; Tramier, M. FRET microscopy in the living cell: Different approaches, strengthsand weaknesses. Bioessays 2012, 34, 369-376. 24.Pian, Q.; Yao, R.; Zhao, L.; Intes, X. Hyperspectral time-resolved wide-field fluorescencemolecular tomography based on structured light and single-pixel detection. Opt. Lett. 2015, 40,431-434. ( 25. S harman, K . K.; P e riasamy, A.; Ashworth, H.; De m as, J.N. Err o r analysis of the rapid lifetimedetermination method for double-exponential decays and new w indowing schemes. Anal. C h em.1999,71,947-952. ) ( 26. Venugopal, V. A Small Animal Ti m e-Resolved Optical Tomography Platform Using Wide-FieldExcitation. Ph.D. Thesis, Rensselaer Polytechnic Institute, T roy, NY, USA, 2011. ) ( 27. M a, G.; M i ncu, N.; Lesage, F. ; G a llant, P . ; McIntosh, L . S y stem IR F imp a ct on fluorescencelifetime fitting in turbid medium. Proc.SPIE 2005, 5699, 263-273. ) ( 28. Zhong, W.: Wu,M.; Chang, 3, C.-W.: M errick. K .A:Merajver, S .D.: Mycek, M.-A Picosecond-resolution fluorescenc e lifeti m e imagin g microscopy: A useful tool for sensingmolecular interactions in vivo via FRET. Opt. Express 2007,15 , 18220-18235. ) ( 29. Venugopal, V.; Chen, J.; Intes, X. D evelopment of an op t ical imaging platform for fu n ctional i maging of small animals using wide-field excitation. Biomed. Opt. Express 2010, 1, 143-156. ) ( 30. O mer, T.; Zhao, L . ; Intes, X.; Hahn, J. Reduced t emporal sampling effect on accuracy of time-domain fluorescence lifetime Forster resonance energy transfer. J. Biomed. Opt . 2014, 19, doi:10.1117/1.JBO.19.8.086023. ) ( 31. Gerritsen, H.C.; Asselbergs , M.A.H.; Agronskaia, A.V.; Van Sark, W.G.J.H.M. F luorescencelifetime imaging in scanning microscopes: Acquisitio n speed, photo n economy and lifetime resolution. J. Microsc.2002,206,218-224. ) ( 32. Zhao, L.; A be, K.; Barroso, M . ; I n tes, X. A c tive wide-field i l lumination for high-throughputfluorescence lifetime imaging. Opt.Lett. 2013, 38,3976-3979. ) ( 33. Venugopal, V.; Intes, X. A daptive w ide-field o ptical tomography. J . Biomed. Opt. 2013, 18, doi:10.1117/1.JBO.18.3.036006. ) ( 34. Kollner, M.; Wolfrum, J. Howw m any p hotons are necessary 1 for fluorescence-lifetime measurements? C hem.Phys. Lett. 1992,200, 199-204. ) ( 35. K eller, S .B.; D udley, J.A.; Binzel, K . ; Jasensky, J.; De Pedro, H.M.; Frey, E.W . ; Uray a ma, P.Calibration a pproach for fluorescence lifetime determination for a ppl i cations using time-gateddetection and finite pulse width excitation. Anal. Chem. 2008 , 80,7876-7881. ) 36. Sinsuebphon, N.; Bevington, T.; Zhao, L.;Ken, A.; Barroso, M.; Intes, X. Comparison ofNIR FRETpairs for quantitative transferrin-based assay. Multimodal Biomedical Imaging IX; Azar, F.S.; Intes,X., Eds.; Proc. SPIE: San Francisco, CA, USA, 2014. 37.Wallrabe, H.; Chen, Y.; Periasamy,A.; Barroso, M. Issues in confocal microscopy for quantitativeFRET analysis. Microsc. Res. Tech. 2006, 69,196-206. 38. Qian, Z.M.; Li, H.; Sun, H.; Ho, K. Targeted drug delivery via the transferrin receptor-mediatedendocytosis pathway. Pharmacol. Rev. 2002,54, 561-587. 39. Danhier,F.; Feron, O.; Preat, V. To exploit the tumor microenvironment: Passive and active tumortargeting of nanocarriers for anti-cancer drug delivery.J. Control. Release 2010,148, 135-146. 40. Chen, J. Mesh-based Monte Carlo method in time-domain widefield fluorescence moleculartomography. J. Biomed.Opt.2012, 17, doi:10.1117/1.JBO.17.10.106009. 41. Chen,J.;Venugopal, V.; Intes, X. Monte Carlo based method for fluorescence tomographic imagingwith lifetime multiplexing using time gates. Biomed.Opt. Express 2011, 2,871-886. 42.Wu, J.; Perelman, L.; Dasari, R.R.; Feld, M.S. Fluorescence tomographic imaging in turbid mediausing early-arriving photons and Laplace transforms. Proc. Natl. Acad. Sci. USA 11997,94,8783-8788. 43. Niedre, M.J.; de Kleine, R.H.; Aikawa, E.; Kirsch, D.G.; Weissleder, R.; Ntziachristos, V. Earlyphoton tomography allows fluorescence detection of lung carcinomas and disease progression inmice in vivo. Proc. Natl. Acad. Sci. USA 2008,105,19126-19131. ( 44.Zhao, L.; Y ang, H.; Cong, W.; Wa n g, G.; Intes, X. Lp r egularization for early gate fluorescencemolecular tomography. Opt. Lett. 2014,39,4156-4159. ) 45.Valim, N.; Brock, J.; Leeser, M.; Niedre, M. The effect of temporal impulse response onexperimental reduction of photon scatter in time-resolved diffuse optical tomography. Phys. Med.Biol. 2013,58,335-349. @ 2015 by the authors; licensee MDPI, Basel, Switzerland. This article is an open access articledistributed under the termsSand conditions(of the Creative CommonsAttributionlicense(http://creativecommons.org/licenses/by/4.0/). Förster Resonance Energy Transfer (FRET) enables the observation ofinteractions at the nanoscale level through the use of fluorescence optical imagingtechniques. In FRET, fluorescence lifetime imaging can be used to quantify the fluorescencelifetime changes of the donor molecule, which are associated with proximity betweenacceptor and donor molecules. Among the FRET parameters derived from fluorescencelifetime imaging, the percentage of donor that interacts with the acceptor (in proximity) canbe estimated via model-based fitting. However, estimation of the lifetime parameters can beaffected by the acquisition parameters such as the temporal characteristics of the imagingsystem. Herein, we investigate the effect of various gate widths on the accuracy of estimationof FRET parameters with focus on the near-infrared spectral window. Experiments wereperformed in silico, in vitro, and in vivo with gate width sizes ranging from 300 ps to 1000 ps inintervals of 100 ps. For all cases, the FRET parameters were retrieved accurately and theimaging acquisition time was decreased three-fold. These results indicate that increasing thegate width up to 1000 ps still allows for accurate quantification of FRET interactions evenin the case of short lifetimes such as those encountered with near-infrared FRET pairs.
确定
还剩14页未读,是否继续阅读?

北京欧兰科技发展有限公司为您提供《鼠抗体中基于寿命的福斯特共振能量转移(FRET)参数检测方案(CCD相机)》,该方案主要用于其他中基于寿命的福斯特共振能量转移(FRET)参数检测,参考标准--,《鼠抗体中基于寿命的福斯特共振能量转移(FRET)参数检测方案(CCD相机)》用到的仪器有
相关方案
更多
该厂商其他方案
更多