


方案详情
文
利用德国LaVision公司门宽达到皮秒量级的超快门宽增强型CCD相机PicoStar研究二氧化钛微粒聚集体的局域化行为。
方案详情

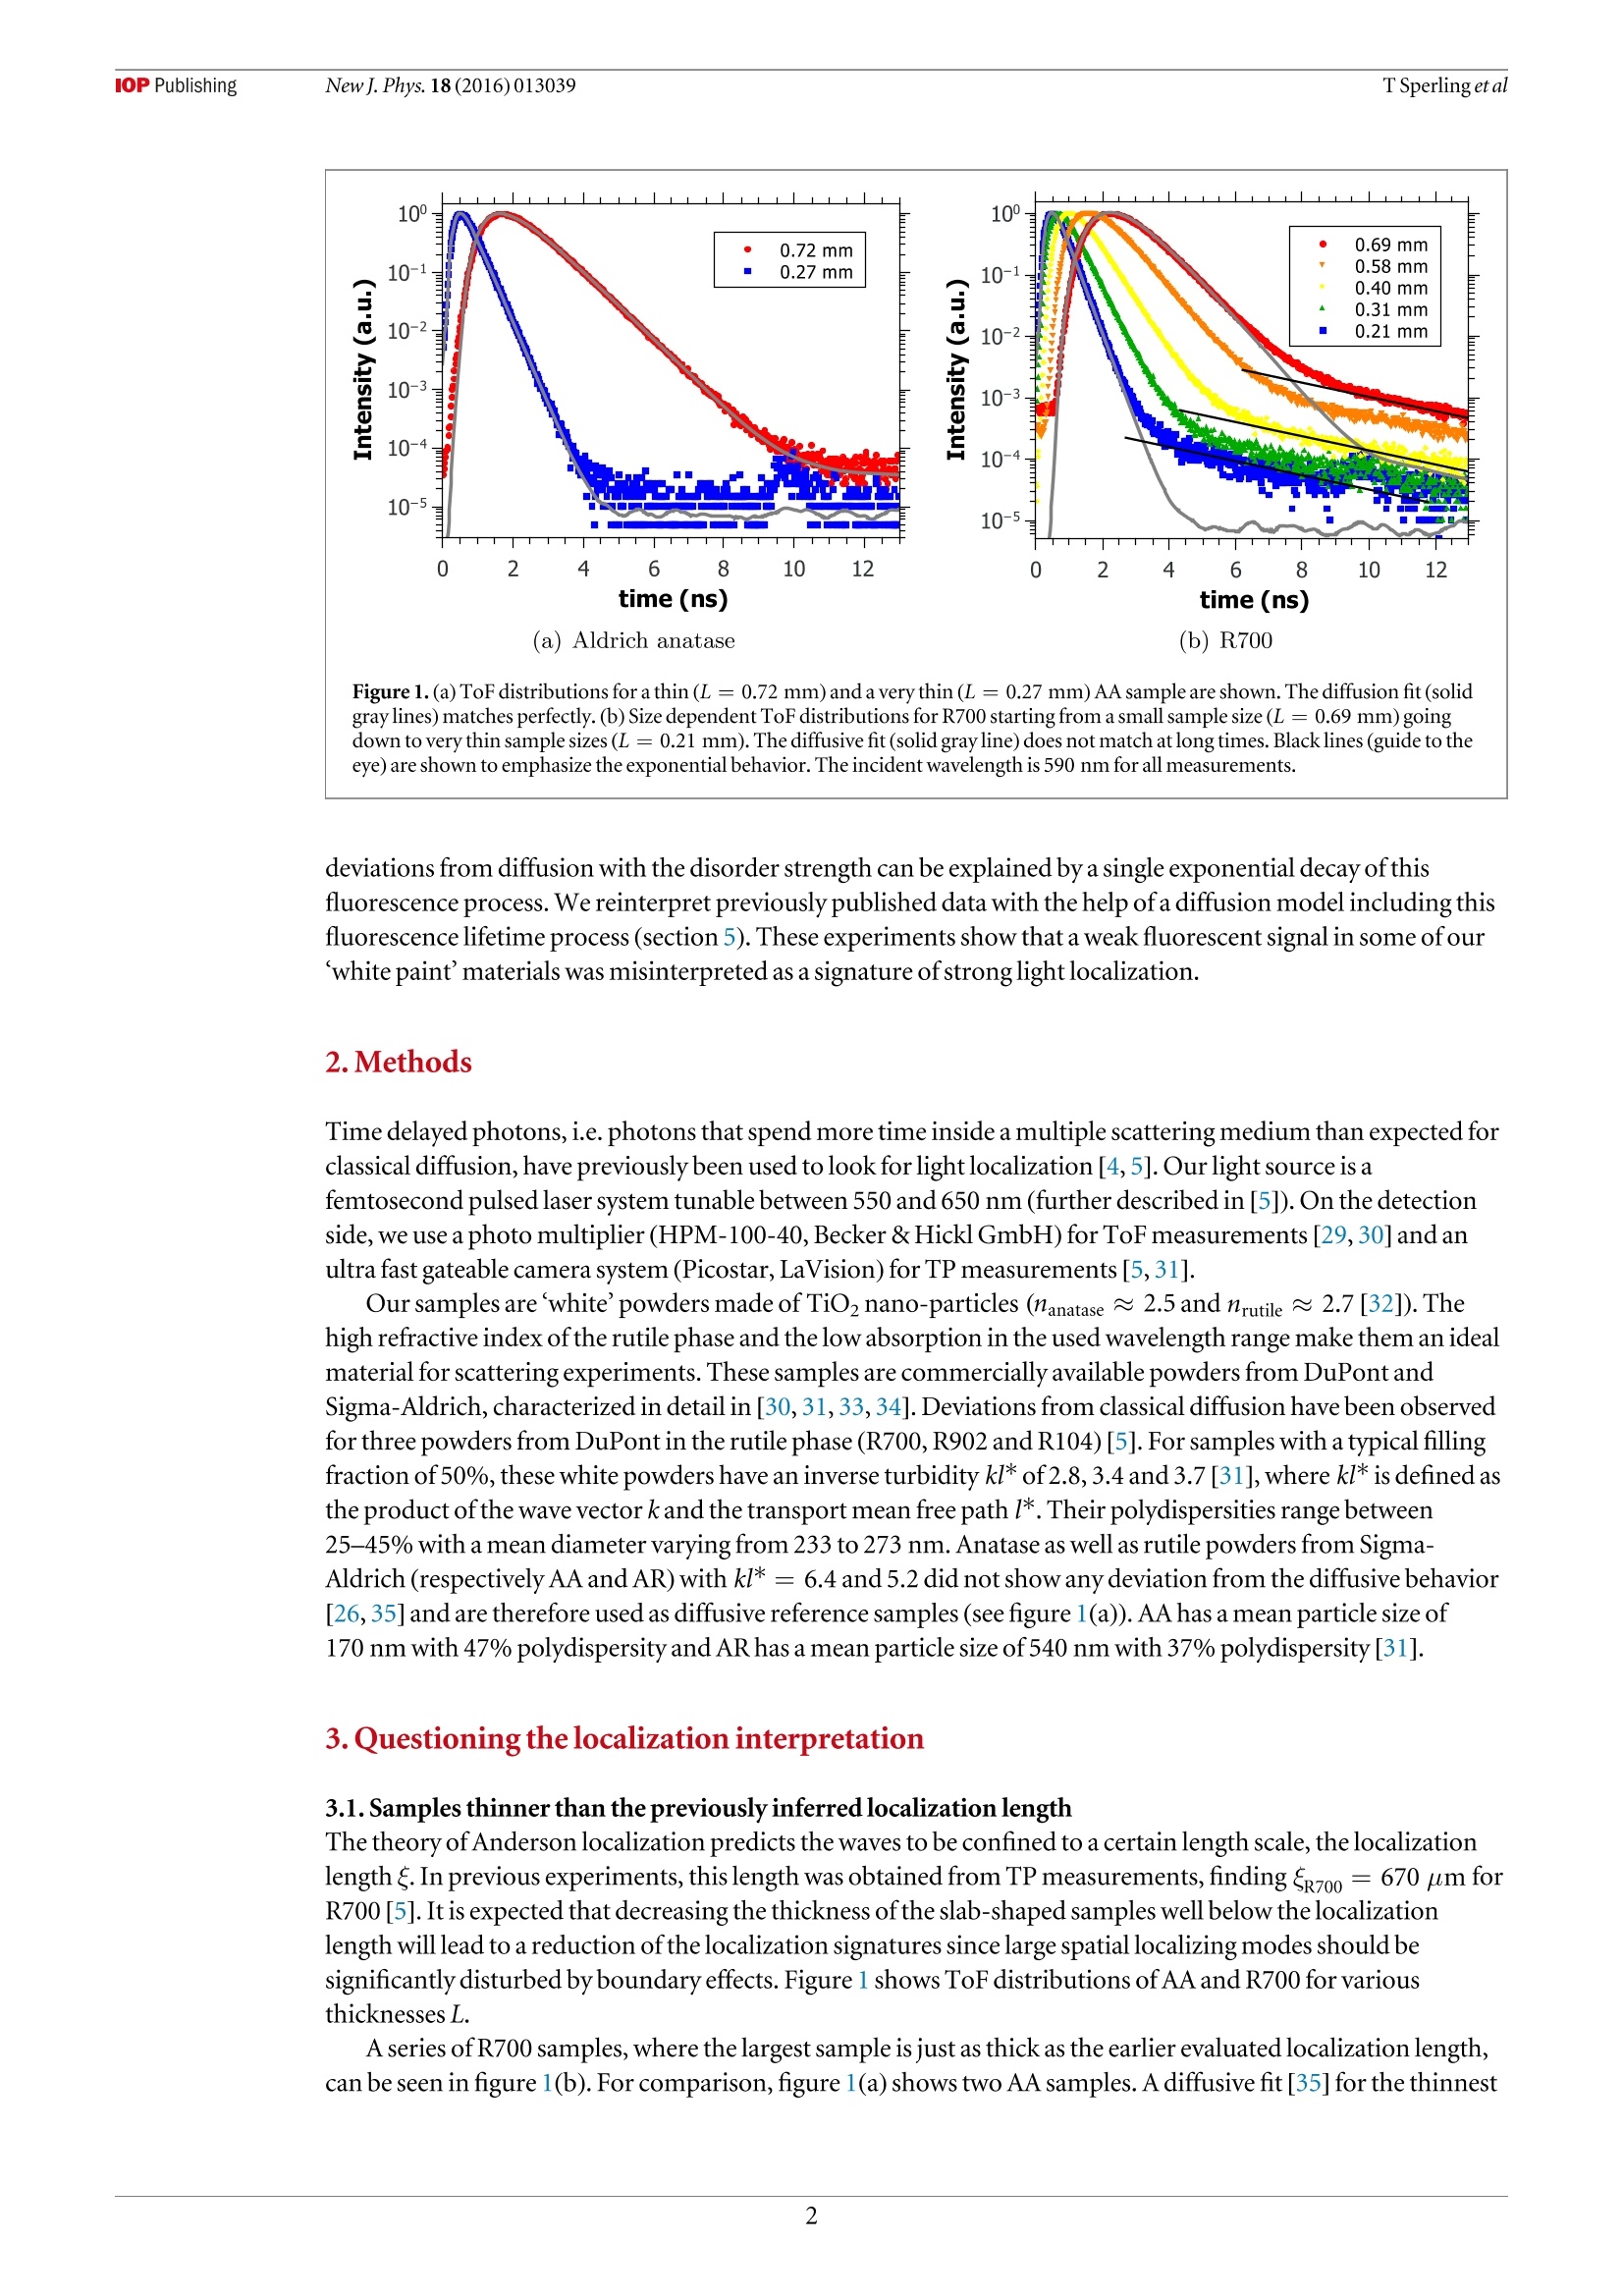
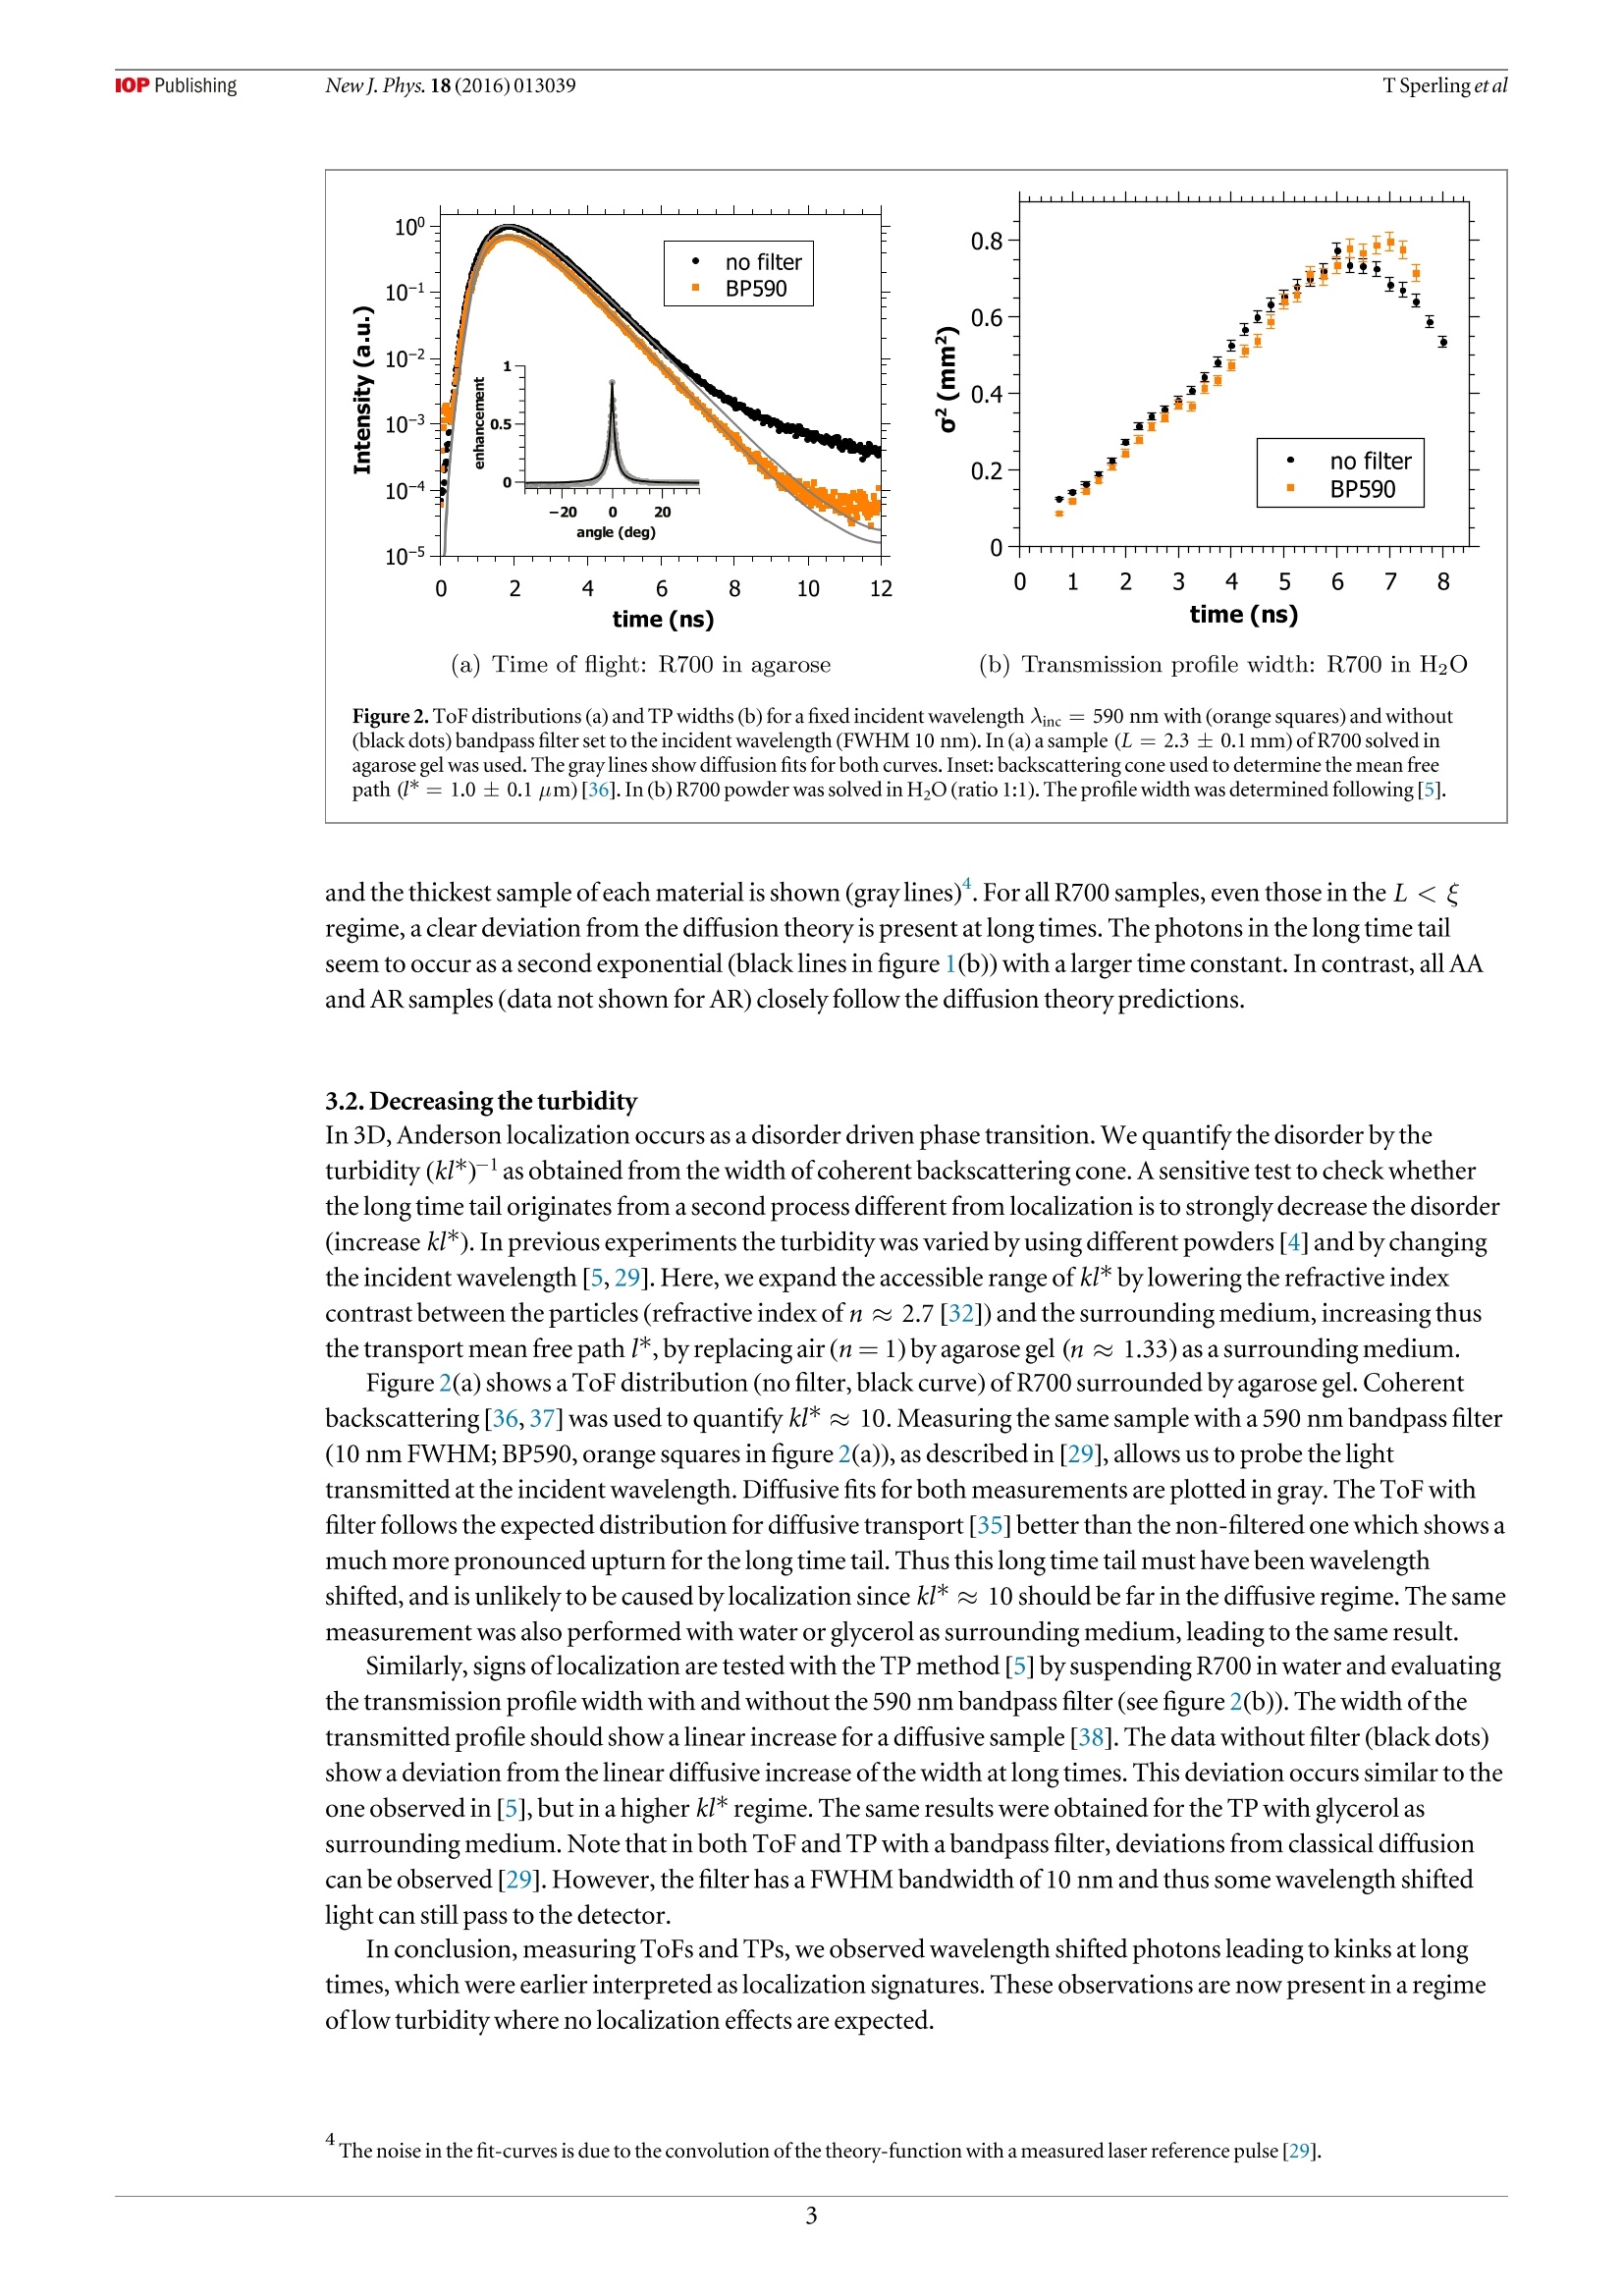
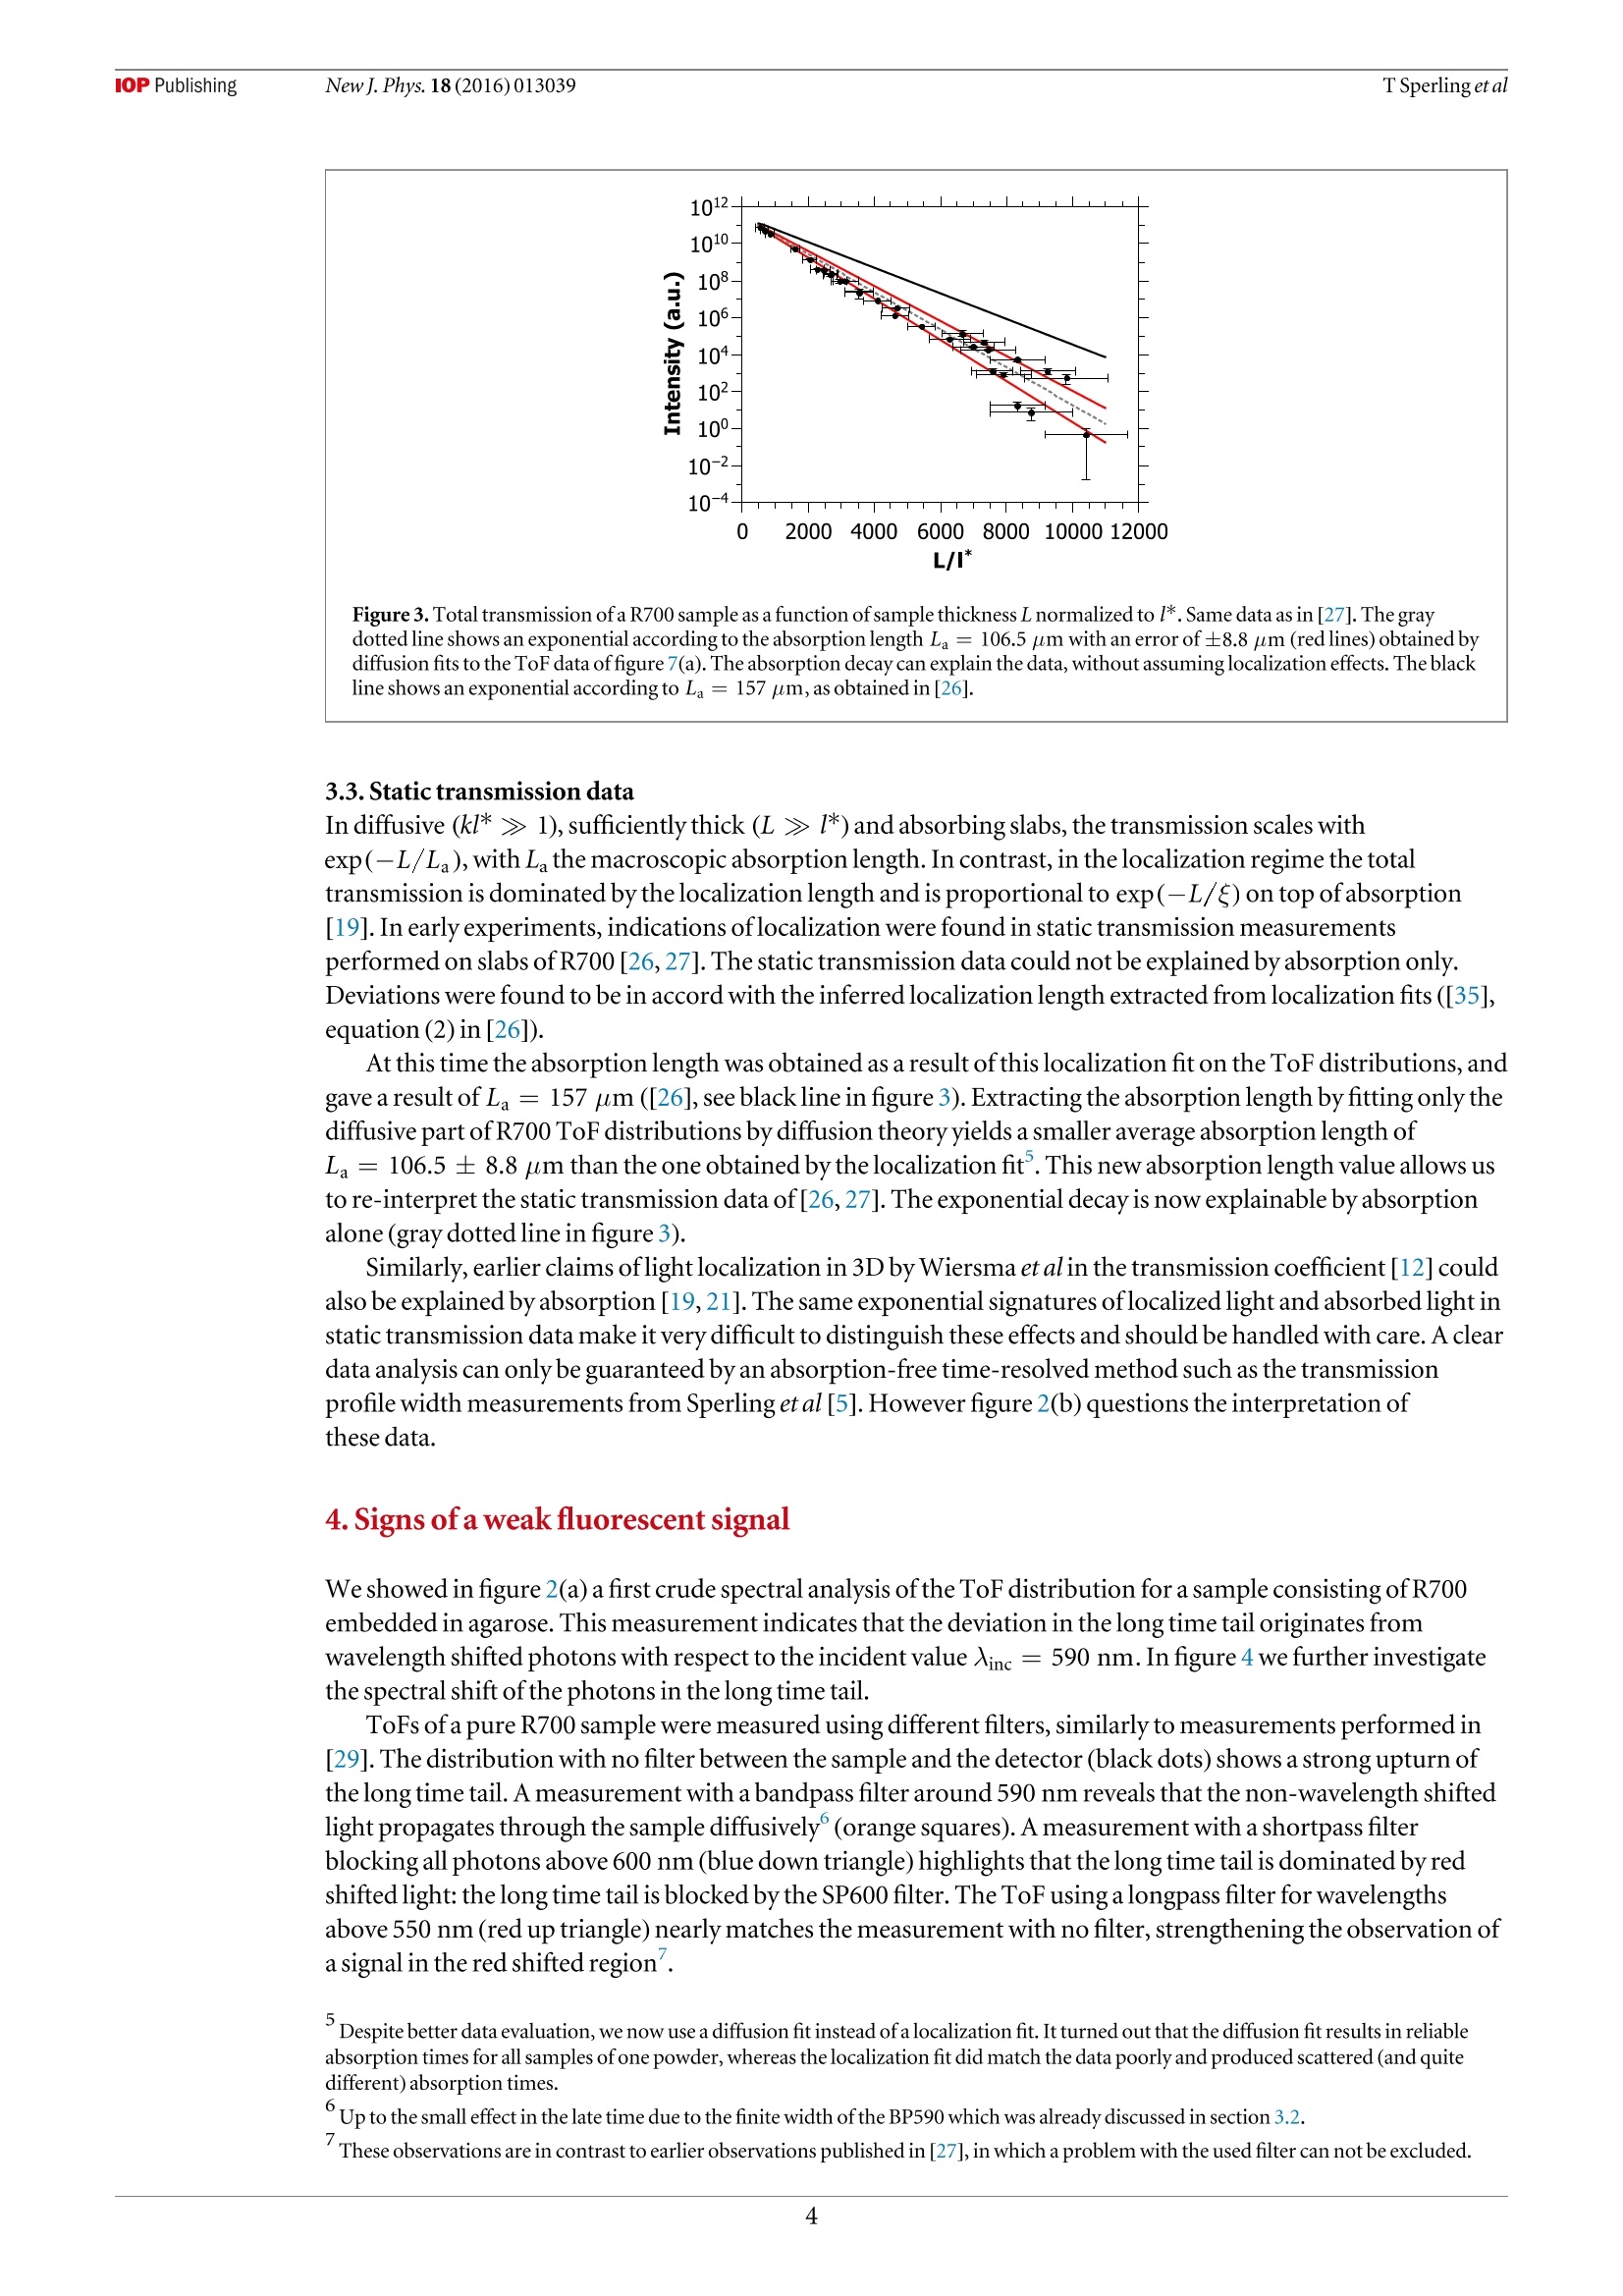
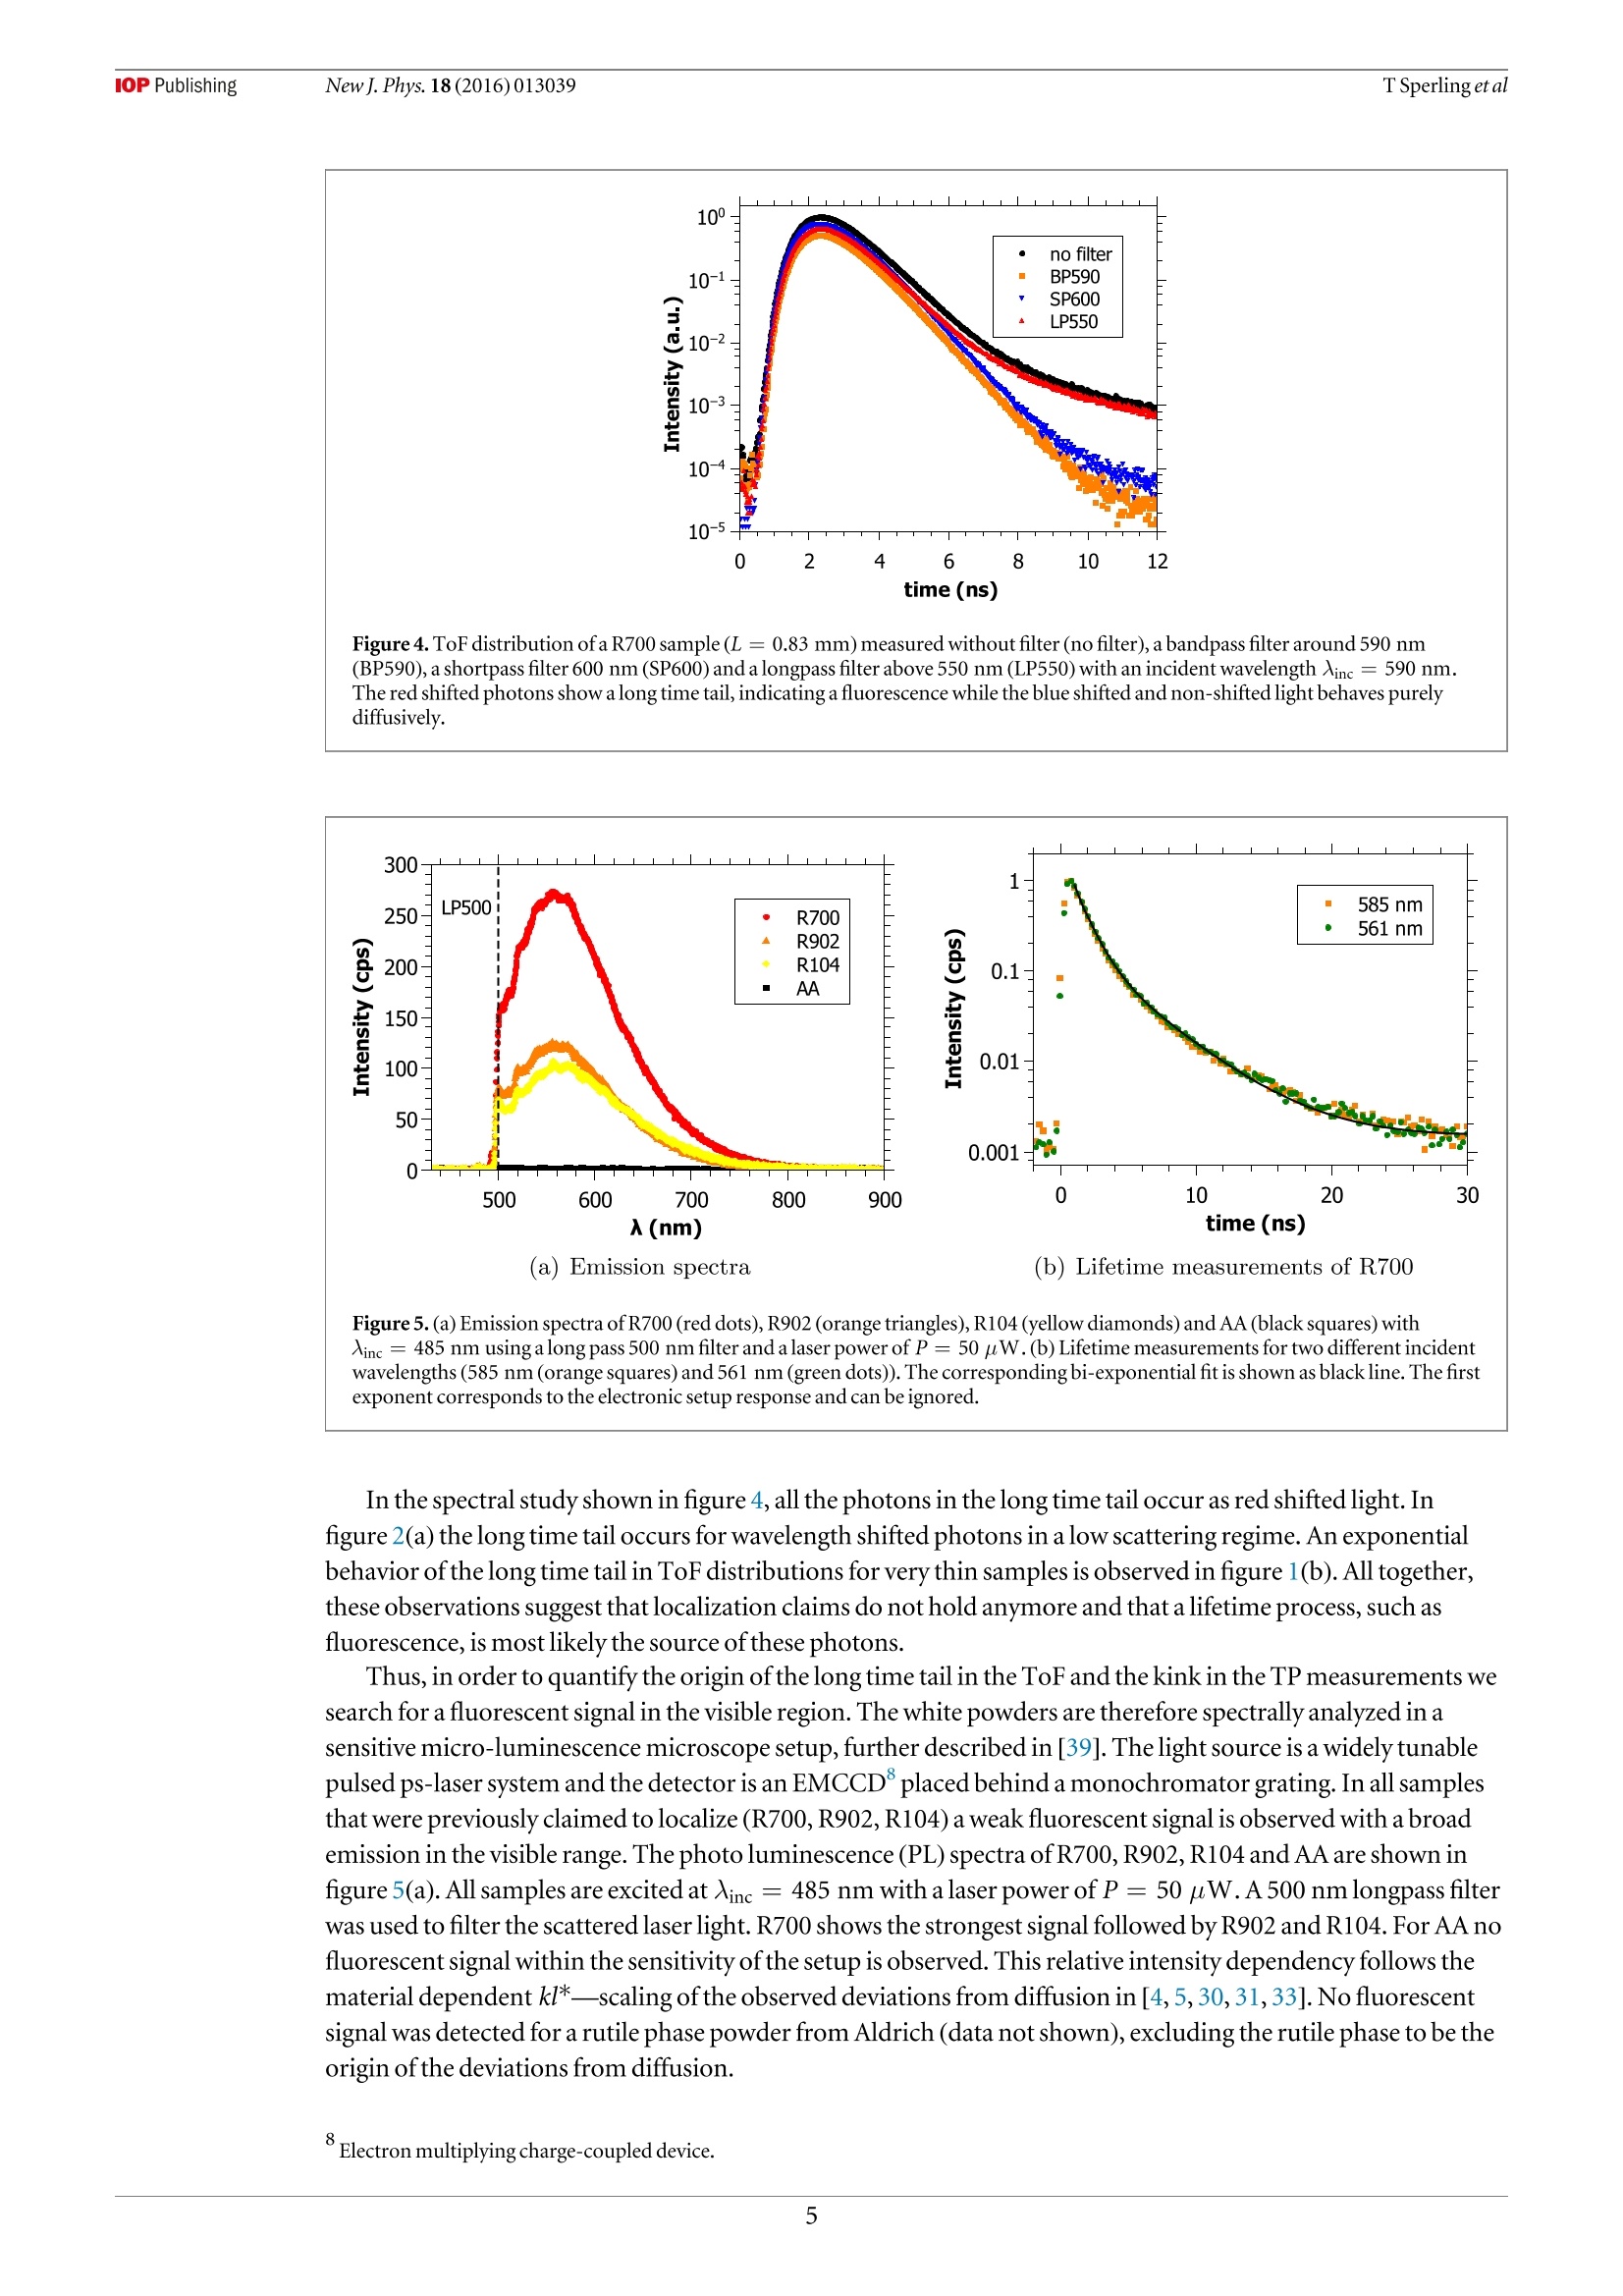
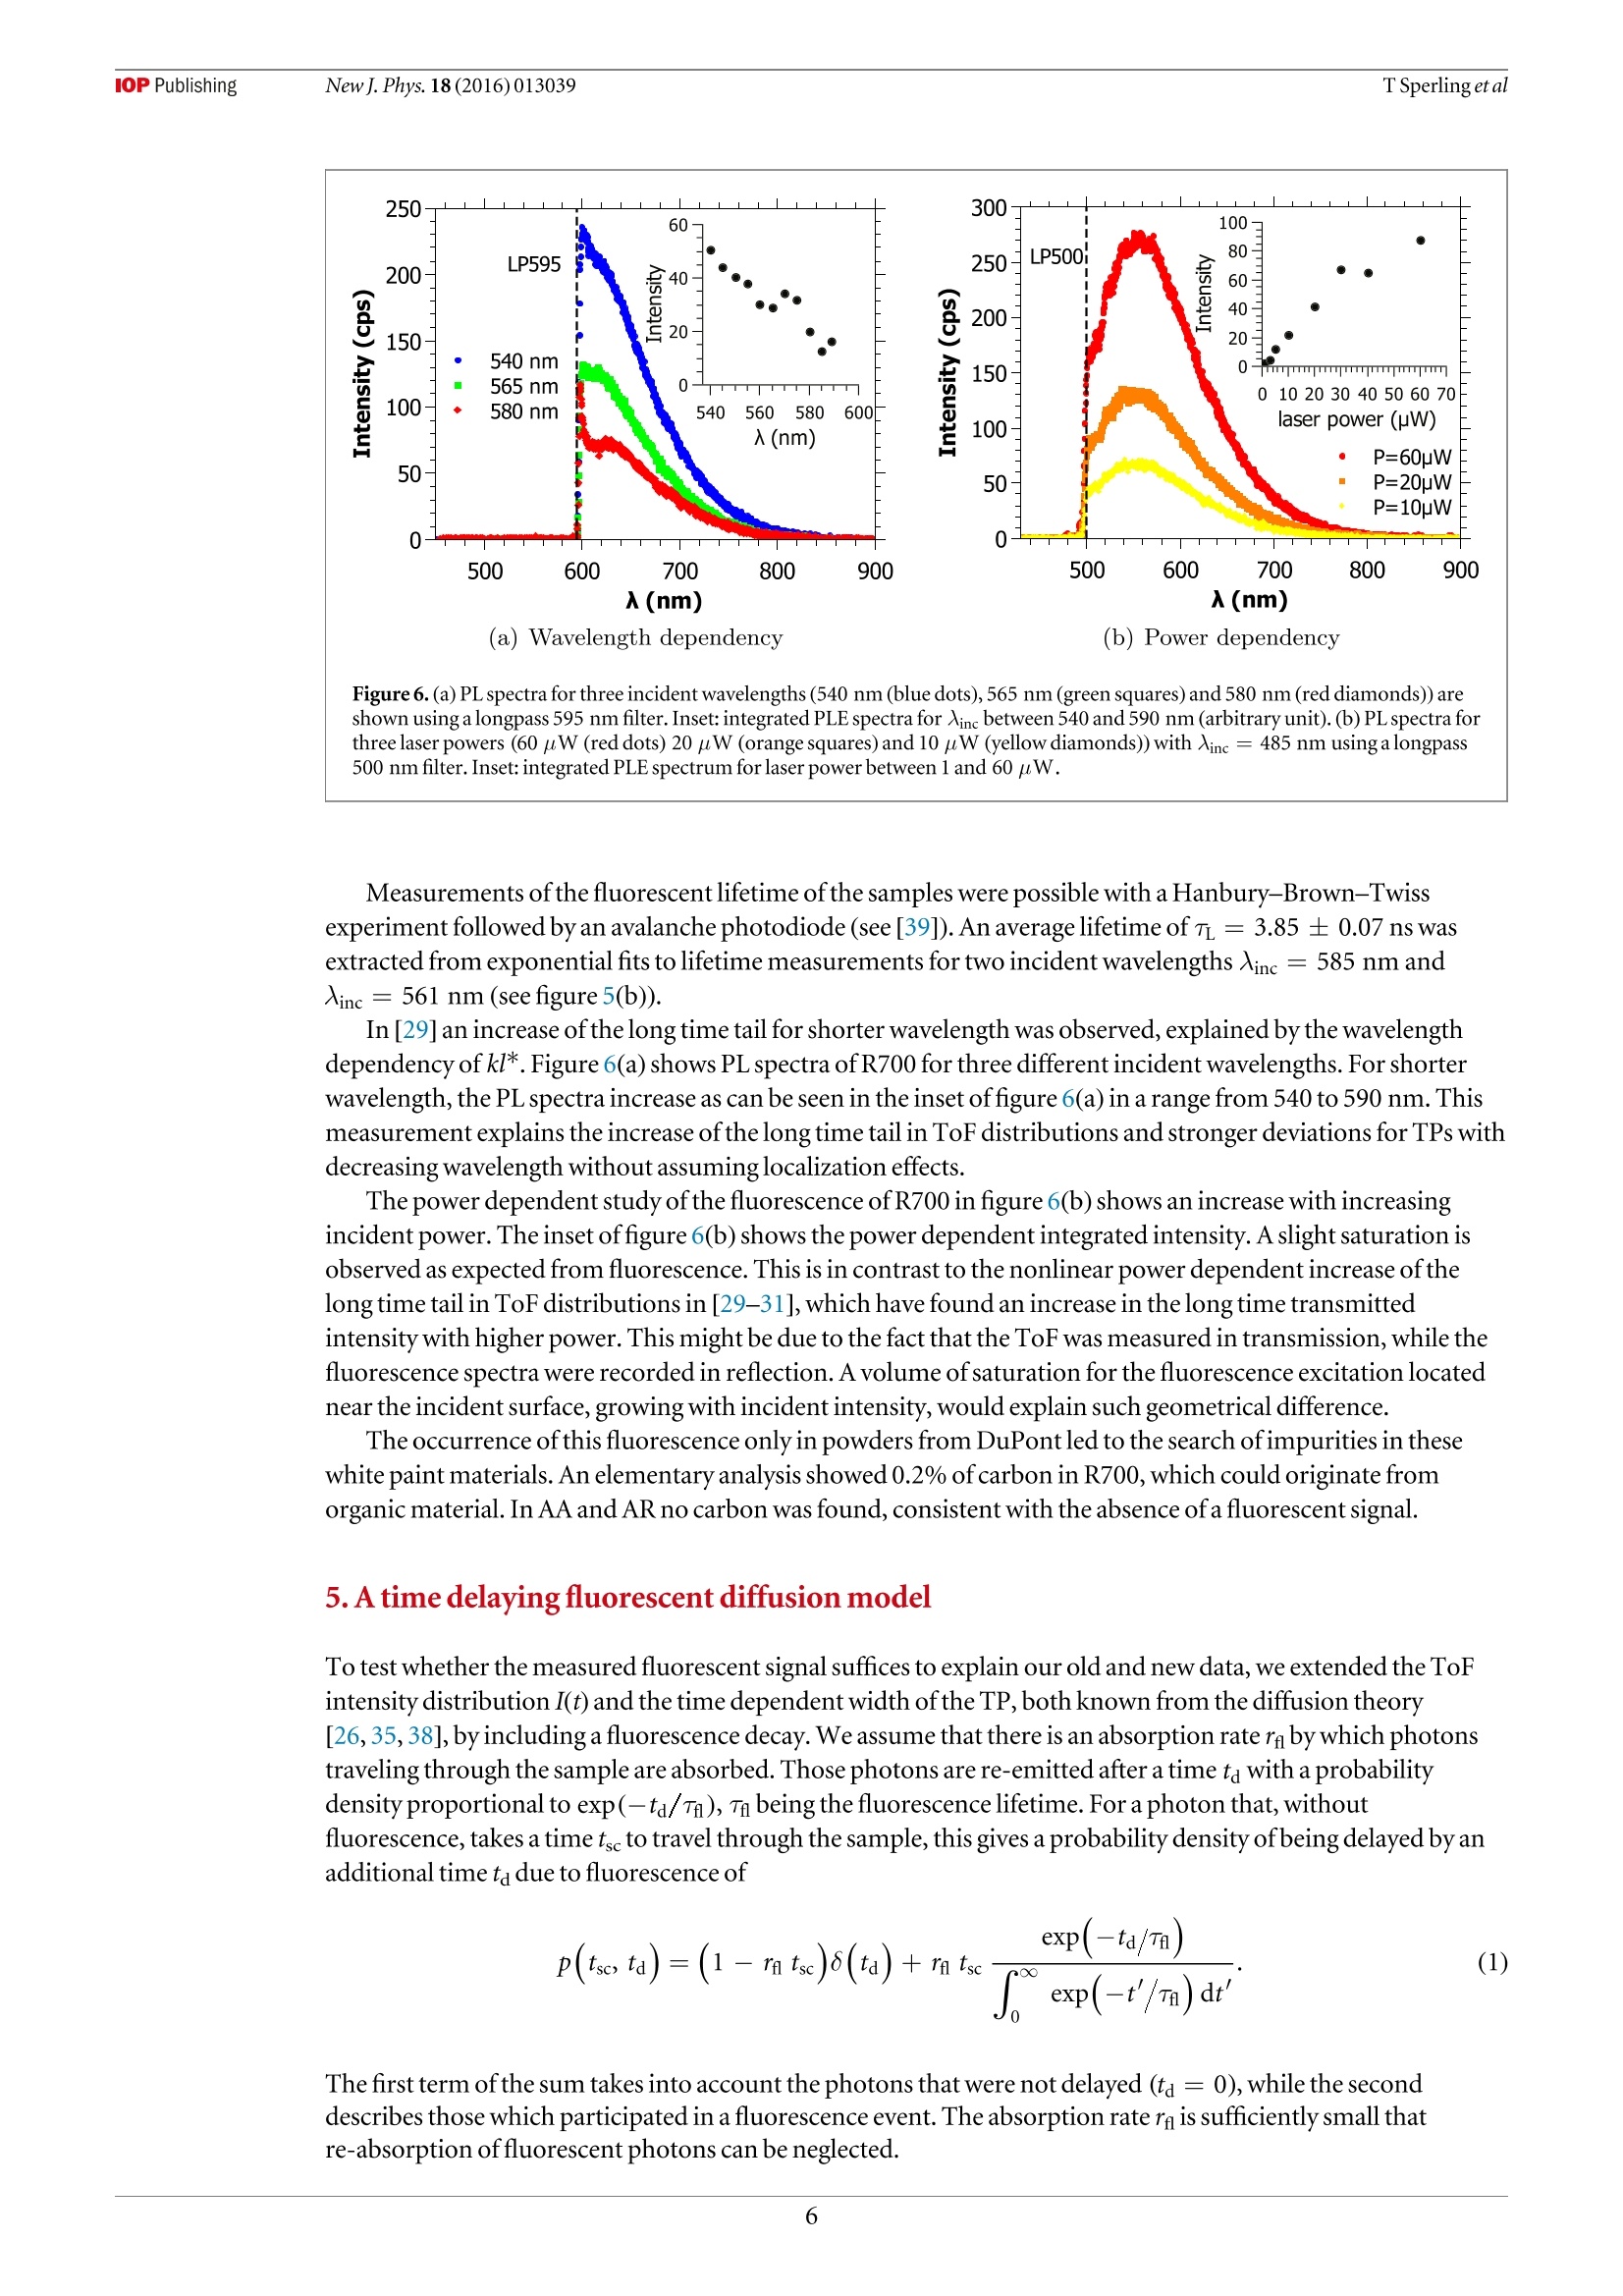
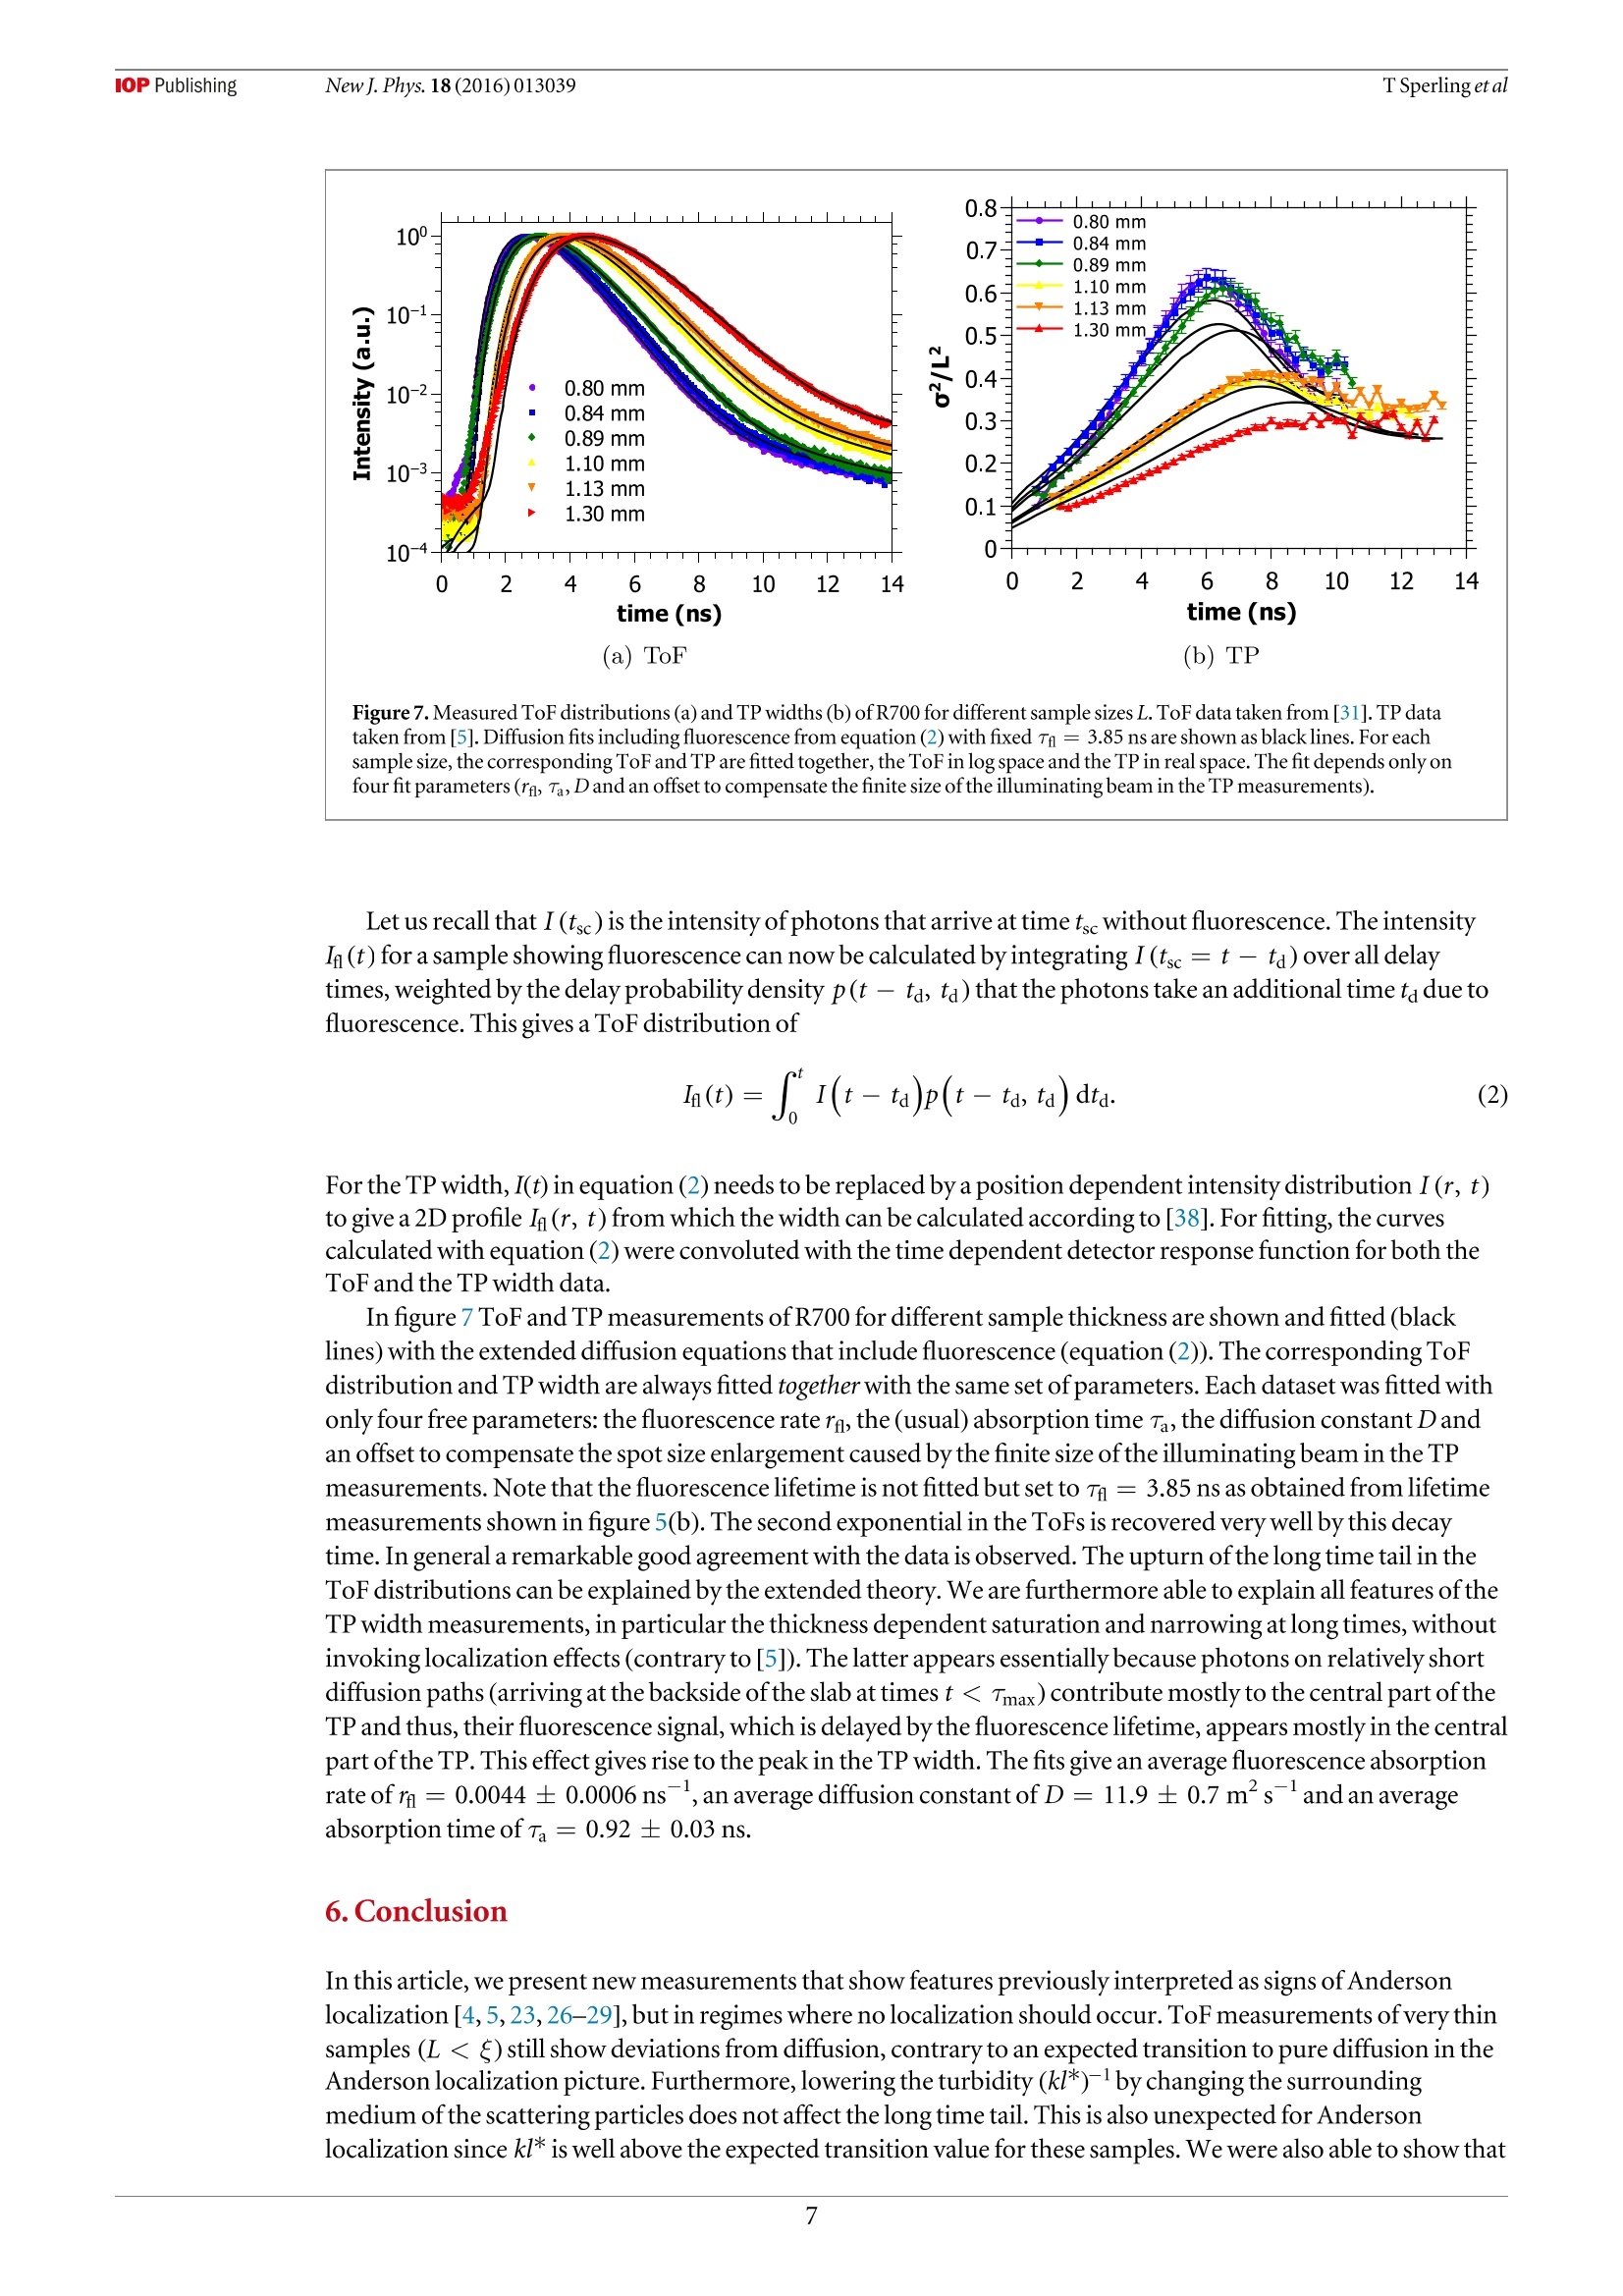
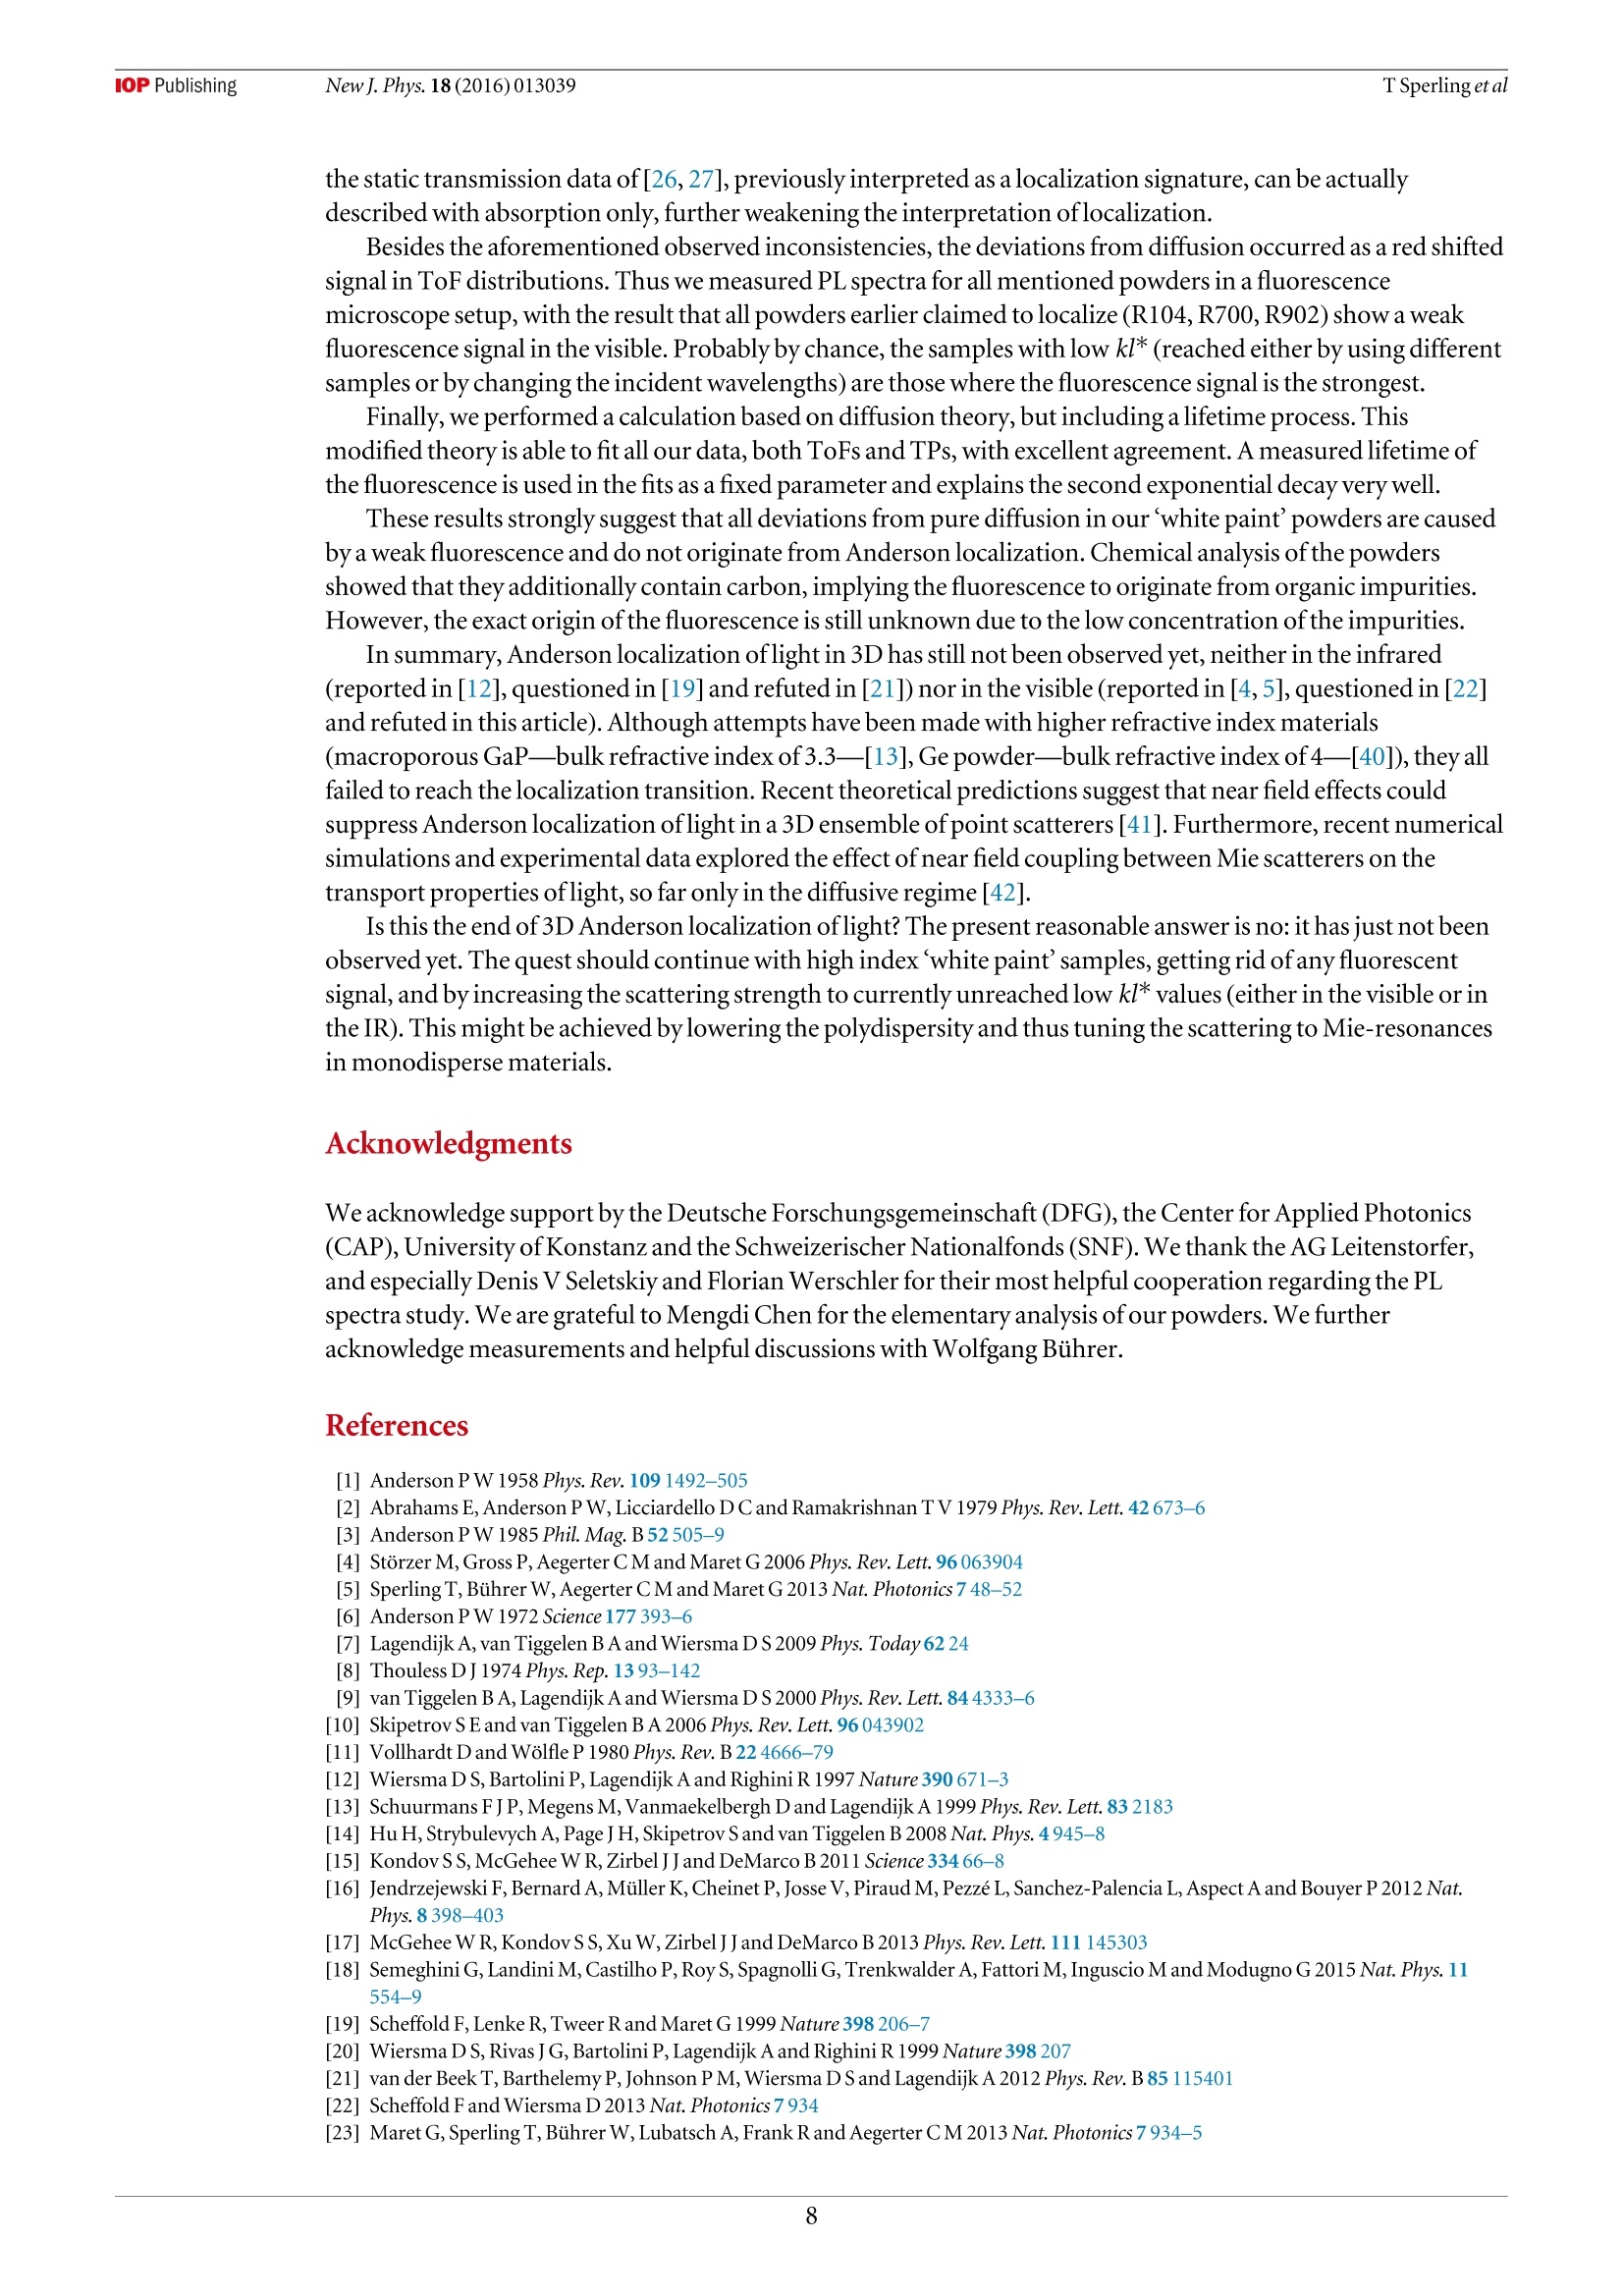
iopscience.iop.org IOP Publishingdoi:10.1088/1367-2630/18/1/013039New J. Phys. 18 (2016)013039Deutsche Physikalische Gesellchat DDPGIOP Institute of Physics Home Search Collections Journals AbouttContact usMy lOPscience Can 3D light localization be reached in ‘white paint’? This content has been downloaded from IOPscience. Please scroll down to see the full text.2016 New J. Phys.18 013039 (http://iopscience.iop.org/1367-2630/18/1/013039) View the table of contents for this issue, or go to the journal homepage for more Download details: IP Address: 182.18.120.136 This content was downloaded on 30/03/2017 at 04:35 Please note that terms and conditions apply. You may also be interested in: Probing Anderson localization of light by weak non-linear effects T Sperling, W Buhrer, M Ackermann et al. Signatures of photon localization A Z Genack and A A Chabanov Time-resolved fluorescence and photon migration studies in biomedical and model random media B B Das, Feng Liu and R R Alfano Conservation of energy in coherent backscattering of light S. Fiebig, C. M. Aegerter, W. Buhrer et al. Observation of coherent backscattering of light by coldatoms G Labeyrie, C A Muller, D S Wiersma et al. Statistics of resonances and delay times in random media Tsampikos Kottos Numerical study of Anderson localization of terahertz waves in disordered waveguides C. P. Lapointe, P. Zakharov, F. Enderli et al. Optical transmission through strong scattering and highly polydisperse media J. Gomez Rivas, R.Sprik, C. M. Soukoulis et al. Coherent phenomena in light scattering from disordered systems VL Kuz'min and Vadim P Romanov New Journal of Physics The open access journal at the forefront of physics Published in partnershipwith: Deutsche PhysikalischeGesellschaft and the Instituteof Physics PAPER Can 3D light localization be reached in ‘white paint'? OPEN ACCESS TSperling , L Schertell2.3,M Ackermann²,GJAubry',CMAegerterand G Maret RECEIVED 24 September 2015 1 Fachbereich Physik, Universitat Konstanz,D-78457 Konstanz, Germany 2 Physik-Institut, Universitat Zurich, Winterthurerstr 190,8057 Zurich, Switzerland REVISED19 November2015ACCEPTED FOR PUBLICATION These authors contributed equally. E-mail: Georg.Maret@uni-konstanz.de Keywords:Anderson localization oflight, fluorescence, titania powder PUBLISHED 18January2016 Content from this work Abstract may be usedunder the and DOI. When waves scatter multiple times in 3D random media, a disorder driven phase transition fromdiffusion to localization may occur (Anderson 1958 Phys. Rev. 109 1492-505; Abrahams et al 1979Phys. Rev. Lett. 42 673-6). In The question ofclassical localization: a theory ofwhite paint?Andersonsuggested the possibility to observe light localization in TiOz samples (Anderson 1985 Phil. Mag. B 52505-9). We recently claimed the observation of localization effects measuring photon time of flight(ToF) distributions (Storzer et al 2006 Phys. Rev. Lett. 96 063904) and evaluating transmission profiles(TPs) (Sperling et al 2013 Nat. Photonics 7 48-52) in such TiOz samples. Here we present a carefulstudy of the long time tail of ToF distributions and the long time behavior ofthe TP width for very thinsamples and different turbidities that questions the localization interpretation. We further show newdata that allow an alternative consistent explanation ofthese previous data by a fluorescence process.An adapted diffusion model including an appropriate exponential fluorescence decay accounts for theshape ofthe ToF distributions and the TP width. These observations question whether the stronglocalization regime can be reached with visible light scattering in polydisperse TiO2 samples, since thedisorder parameter can hardly be increased any further in such awhite paint'material. 1.Introduction The prediction ofa disorder induced metal-insulator phase transition made by Anderson [1] and thegeneralization as a wave phenomenon [6] stimulated many theoretical and experimental studies over more than50 years [7]. Scaling theory predicts a phase transition from classical diffusion to localization to occur above two-dimensions only [2, 8]. Furthermore, advances [9, 10] in the self-consistent theory [11] predict a position andtime dependent diffusion coefficient in the localized regime. Experimental verifications ofthis phase transitionin three-dimensional highly scattering media has been a challenging task ever since. There are experimentalreports with light [4,5, 12,13], ultrasound [14] and ultra cold atoms [15-18], but doubts have been raisedconcerning the interpretation of some ofthese results in terms oflocalization oflight waves ([19-21] and[22,23]) and for ultra cold atoms [24,25]. This controversial discussion illustrates the difficulty to carry out sufficiently complete and accurate sets ofexperiments, to fabricate appropriate samples and, finally, to reach a consistent interpretation of all results. Inprevious publications [4, 5, 23, 26-29] we interpreted our measurements on strongly scattering TiO2 powders asevidence for strong localization oflight in three-dimensions, as suggested by Anderson [3]. However,inconsistencies ofrecent data with the interpretation of Anderson localization led us to perform additionalsensitive experimental tests. In this article, after presenting our experimental setups (section 2), we will show (in section 3) new multiplelight scattering measurements, where deviations from the diffusion theory are observed. While these deviationswere previously interpreted as Anderson localization, we now observe similar deviations in regimes of weakmultiple scattering where Anderson localization should not occur. In section 4, we characterize a weakfluorescent signal we find in all powders that were supposed to localize and show that the scaling of the Figure 1.(a) ToF distributions for a thin (L= 0.72 mm) and a very thin (L = 0.27 mm) AA sample are shown. The diffusion fit (solidgray lines) matches perfectly. (b) Size dependent ToF distributions for R700 starting from a small sample size (L= 0.69 mm)goingdown to very thin sample sizes (L= 0.21 mm). The diffusive fit (solid gray line) does not match at long times. Black lines (guide to theeye)are shown to emphasize the exponential behavior.The incident wavelength is 590 nm for all measurements. deviations from diffusion with the disorder strength can be explained by a single exponential decay ofthisfluorescence process. We reinterpret previously published data with the help ofa diffusion model including thisfluorescence lifetime process (section 5). These experiments show that a weak fluorescent signal in some ofourwhite paint' materials was misinterpreted as a signature of strong light localization. 2. Methods Time delayed photons, i.e. photons that spend more time inside a multiple scattering medium than expected forclassical diffusion, have previously been used to look for light localization [4, 5]. Our light source is afemtosecond pulsed laser system tunable between 550 and 650 nm (further described in [5]). On the detectionside, we use a photo multiplier (HPM-100-40, Becker & Hickl GmbH) for ToF measurements [29, 30] and anultra fast gateable camera system (Picostar, LaVision) for TP measurements [5, 31]. Our samples are whitepowders made of TiO2 nano-particles (nanatase ~2.5 and nrutile≈2.7[32]). Thehigh refractive index ofthe rutile phase and the low absorption in the used wavelength range make them an idealmaterial for scattering experiments. These samples are commercially available powders fromDuPont andSigma-Aldrich, characterized in detail in [30, 31, 33, 34]. Deviations from classical diffusion have been observedfor three powders from DuPont in the rutile phase (R700, R902 and R104)[5]. For samples with a typical fillingfraction of 50%, these white powders have an inverse turbidity kl* of2.8,3.4 and 3.7[31], where kl* is defined asthe product ofthe wave vector k and the transport mean free path l*. Their polydispersities range between25-45%with a mean diameter varying from 233 to 273 nm. Anatase as well as rutile powders from Sigma-Aldrich (respectively AA and AR) with kl* = 6.4 and 5.2 did not show any deviation from the diffusive behavior[26, 35] and are therefore used as diffusive reference samples (see figure 1(a)). AA has a mean particle size of170 nm with 47% polydispersity and AR has a mean particle size of 540 nm with 37% polydispersity[31]. 3. Questioning the localization interpretation 3.1. Samples thinner than the previously inferred localization length The theory of Anderson localization predicts the waves to be confined to a certain length scale, thelocalizationlength f. In previous experiments, this length was obtained from TP measurements, finding SR700= 670 um forR700 [5]. It is expected that decreasing the thickness ofthe slab-shaped samples well below the localizationlength will lead to a reduction ofthe localization signatures since large spatial localizing modes should besignificantly disturbed by boundary effects. Figure 1 shows ToF distributions of AA and R700 for variousthicknesses L. A series of R700 samples, where the largest sample is just as thick as the earlier evaluated localizationlength,can be seen in figure 1(b). For comparison, figure 1(a) shows two AA samples. A diffusive fit [35] for the thinnest Figure 2. ToF distributions (a) and TP widths (b) for a fixed incident wavelength Ainc =590 nm with (orange squares) and without(black dots) bandpass filter set to the incident wavelength (FWHM10 nm). In (a) a sample (L= 2.3±0.1 mm) of R700 solved inagarose gel was used. The gray lines show diffusion fits for both curves. Inset:backscattering cone used to determine the mean freepath (1*=1.0±0.1 _m) [36]. In (b) R700 powder was solved in HzO (ratio 1:1). The profile width was determined following [5]. and the thickest sample ofeach material is shown (gray lines). For all R700 samples, even those in the L 1),sufficiently thick (L>l*) and absorbing slabs, the transmission scales withexp(-L/La), with L the macroscopic absorption length. In contrast, in the localization regime the totaltransmission is dominated by thelocalization length and is proportional to exp(-L/) on top ofabsorption[19]. In early experiments, indications oflocalization were found in static transmission measurementsperformed on slabs ofR700 [26, 27]. The static transmission data could not be explained by absorption only.Deviations were found to be in accord with the inferred localization length extracted from localization fits ([35],equation(2) in [26]). At this time the absorption length was obtained as a result ofthis localization fit on the ToF distributions, andgave a result of La = 157 um ([26],see black line in figure 3). Extracting the absorption length by fitting only thediffusive part of R700 ToF distributions by diffusion theory yields a smaller average absorption length ofLa=106.5±8.8 pm than the one obtained by thelocalization fit. This new absorption length value allows usto re-interpret the static transmission data of [26, 27]. The exponential decay is now explainable by absorptionalone (gray dotted line in figure 3). Similarly, earlier claims oflight localization in 3D by Wiersma et al in the transmission coefficient [12] couldalso be explained by absorption [19, 21]. The same exponential signatures oflocalized light and absorbed light instatic transmission data make it very difficult to distinguish these effects and should be handled with care. A cleardata analysis can only be guaranteed by an absorption-free time-resolved method such as the transmissionprofile width measurements from Sperling et al [5]. However figure 2(b) questions the interpretation ofthese data. 4. Signs of a weak fluorescent signal We showed in figure 2(a) a first crude spectral analysis ofthe ToF distribution for a sample consisting ofR700embedded in agarose. This measurement indicates that the deviation in the long time tail originates fromwavelength shifted photons with respect to the incident value 入inc = 590 nm. In figure 4 we further investigatethe spectral shift ofthe photons in the long time tail. ToFs of a pure R700 sample were measured using different filters, similarly to measurements performed in[29]. The distribution with no filter between the sample and the detector (black dots) shows a strong upturn ofthelong time tail. A measurement with a bandpass filter around 590 nm reveals that the non-wavelength shiftedlight propagates through the sample diffusively(orange squares). A measurement with a shortpass filterblocking all photons above 600 nm (blue down triangle) highlights that the long time tail is dominated by redshifted light: the long time tail is blocked by the SP600 filter. The ToF using alongpass filter for wavelengthsabove 550 nm (redup triangle) nearly matches the measurement with no filter, strengthening the observation ofa signal in the red shifted region'. ( Despite better data evaluation, we now use a d iffusion fit instead ofalocalization fit. It turned out that the diffusion fit results in reliab l e absorption times for all samples of one powder, whereas thelocalization fit did match the data poorly and produced scattered (and quite different) absorption times. ) ( Upto the small effect in t h e late time due to the finite width of the BP590 which was already discussed in section 3 . 2 . ) These observations are in contrast to earlier observations published in [27], in which a problem with the used filter can not be excluded. Figure 4. ToF distribution ofa R700 sample(L= 0.83 mm)measured without filter (no filter), a bandpass filter around 590 nm(BP590), a shortpass filter 600 nm (SP600)and alongpass filter above 550 nm (LP550) with an incident wavelength Ainc = 590 nm.The red shifted photons show a long time tail, indicating a fluorescence while the blue shifted and non-shifted lightbehaves purelydiffusively. (a) Emission spectra (b) Lifetime measurements of R700 Figure5. (a) Emission spectra of R700 (red dots), R902 (orange triangles), R104 (yellow diamonds) and AA (black squares) with入inc = 485 nm using along pass 500 nm filter and a laser power of P= 50 pW.(b) Lifetime measurements for two different incidentwavelengths (585 nm (orange squares) and 561 nm (green dots)). The corresponding bi-exponential fit is shown as black line. The firstexponent corresponds to the electronic setup response and can beignored. In the spectral study shown in figure 4, all the photons in the long time tail occur as red shiftedlight. Infigure 2(a) thelong time tail occurs for wavelength shifted photons in a low scattering regime. An exponentialbehavior ofthe long time tail in ToF distributions for very thin samples is observed in figure 1(b). All together,these observations suggest that localization claims do not hold anymore and that a lifetime process, such asfluorescence, is most likely the source ofthese photons. Thus, in order to quantify the origin ofthe long time tail in the ToF and the kink in the TP measurements wesearch for a fluorescent signal in the visible region. The white powders are therefore spectrally analyzed in asensitive micro-luminescence microscope setup, further described in [39]. Thelight source is a widely tunablepulsed ps-laser system and the detector is an EMCCDplaced behind a monochromator grating. In all samplesthat were previously claimed to localize (R700, R902,R104) a weak fluorescent signal is observed with a broademission in the visible range. The photo luminescence (PL) spectra of R700,R902, R104 andAA are shown infigure 5(a). All samples are excited at 入inc = 485 nm with a laser power of P= 50 pW.A500 nmlongpass filterwas used to filter the scattered laser light. R700 shows the strongest signal followed by R902 andR104. For AA nofluorescent signal within the sensitivity ofthe setup is observed. This relative intensity dependency follows thematerial dependent kl*—scaling ofthe observed deviations from diffusion in [4,5, 30, 31,33].No fluorescentsignal was detected for a rutile phase powder from Aldrich (data not shown), excluding the rutile phase to be theorigin ofthe deviations from diffusion. Figure 6. (a) PL spectra for three incident wavelengths (540 nm (blue dots), 565 nm (green squares) and 580 nm (red diamonds)) areshown using a longpass 595 nm filter. Inset: integrated PLE spectra for 入inc between 540 and 590 nm (arbitrary unit). (b) PL spectra forthree laser powers (60 uW (reddots) 20 uW (orange squares) and 10 uW (yellow diamonds)) with Ainc = 485 nm usingalongpass500 nm filter. Inset: integrated PLE spectrum for laser power between 1 and 60 pW. Measurements ofthe fluorescent lifetime ofthe samples were possible with a Hanbury-Brown-Twissexperiment followed by an avalanche photodiode (see [39]). An average lifetime ofT_= 3.85 ±0.07 ns wasextracted from exponential fits to lifetime measurements for two incident wavelengths Xinc = 585 nm andAinc = 561 nm (see figure 5(b)). In [29] an increase ofthe long time tail for shorter wavelength was observed, explained by the wavelengthdependency of kl*. Figure6(a) shows PL spectra of R700 for three different incident wavelengths. For shorterwavelength, the PL spectra increase as can be seen in the inset of figure 6(a) in a range from 540 to 590 nm. Thismeasurement explains the increase ofthe long time tail in ToF distributions and stronger deviations for TPs withdecreasing wavelength without assuming localization effects. The power dependent study ofthe fluorescence ofR700 in figure 6(b) shows an increase with increasingincident power. The inset offigure 6(b) shows the power dependent integrated intensity. A slight saturation isobserved as expected from fluorescence. This is in contrast to the nonlinear power dependent increase ofthelong time tail in ToF distributions in [29-31], which have found an increase in the long time transmittedintensity with higher power. This might be due to the fact that the ToF was measured in transmission, while thefluorescence spectra were recorded in reflection.A volume of saturation for the fluorescence excitation locatednear the incident surface, growing with incident intensity, would explain such geometrical difference. Theoccurrence ofthis fluorescence only in powders from DuPont led to the search of impurities in thesewhite paint materials. An elementary analysis showed 0.2% of carbon in R700, which could originate fromorganic material. In AA and AR no carbon was found, consistent with the absence ofa fluorescent signal. 5. A time delaying fluorescent diffusion model To test whether the measured fluorescent signal suffices to explain our old and new data, we extended the ToFintensity distribution I(t) and the time dependent width ofthe TP, both known from the diffusion theory[26, 35, 38], by including a fluorescence decay. We assume that there is an absorption rate ra by which photonstraveling through the sample are absorbed. Those photons are re-emitted after a time ta with a probabilitydensity proportional to exp(-ta/Ta), Ta being the fluorescencelifetime. For a photon that, withoutfluorescence, takes a time tsc to travel through the sample, this gives a probability density of being delayed by anadditional time ta due to fluorescence of The first term ofthe sum takes into account the photons that were not delayed (ta=0), while the seconddescribes those which participated in a fluorescence event. The absorption rate rn is sufficiently small thatre-absorption of fluorescent photons can be neglected. (a) ToF (b) TP Figure 7.Measured ToF distributions (a) and TP widths (b) of R700 for different sample sizes L. ToF data taken from[31]. TP datataken from [5]. Diffusion fits including fluorescence from equation (2) with fixed Tn=3.85 ns are shown as black lines. For eachsample size, the corresponding ToF and TP are fitted together, the ToF in log space and the TP in real space. The fit depends only onfour fit parameters (Ta, Ta, Dand an offset to compensate the finite size ofthe illuminating beam in the TP measurements). Let us recall that I (tsc) is the intensity of photons that arrive at time tse without fluorescence. The intensityIn (t) for a sample showing fluorescence can now be calculated by integrating I (tsc =t-ta) over all delaytimes, weighted by the delay probability density p(t- tas ta) that the photons take an additional time ta due tofluorescence. This gives a ToF distribution of For the TP width, I(t) in equation (2) needs to be replaced by a position dependent intensity distribution I (r, t)to give a 2D profile In(r, t) from which the width can be calculated according to [38]. For fitting, the curvescalculated with equation (2) were convoluted with the time dependent detector response function for both theToF and the TP width data. In figure 7 ToF and TP measurements ofR700 for different sample thickness are shown and fitted (blacklines) with the extended diffusion equations that include fluorescence(equation (2)). The corresponding ToFdistribution and TP width are always fitted together with the same set of parameters. Each dataset was fitted withonly four free parameters: the fluorescence rate rn, the (usual) absorption time Ta, the diffusion constant Dandan offset to compensate the spot size enlargement caused by the finite size ofthe illuminating beam in the TPmeasurements. Note that the fluorescence lifetime is not fitted but set to Th=3.85 ns as obtained from lifetimemeasurements shown in figure 5(b). The second exponential in the ToFs is recovered very well by this decaytime. In general a remarkable good agreement with the data is observed. The upturn ofthe long time tail in theToF distributions can be explained by the extended theory. We are furthermore able to explain all features of theTP width measurements, in particular the thickness dependent saturation and narrowing at long times, withoutinvoking localization effects (contrary to [5]). Thelatter appears essentially because photons on relatively shortdiffusion paths (arriving at the backside ofthe slab at times t
确定

还剩8页未读,是否继续阅读?

北京欧兰科技发展有限公司为您提供《TiO2中定位特性检测方案(CCD相机)》,该方案主要用于氧化物中定位特性检测,参考标准--,《TiO2中定位特性检测方案(CCD相机)》用到的仪器有
相关方案
更多
该厂商其他方案
更多