方案详情
文
The resulting synergism between Raman spectroscopy and Chemometrics will provide a powerful tool for monitoring and control of manufacturing of polymeric materials.
方案详情

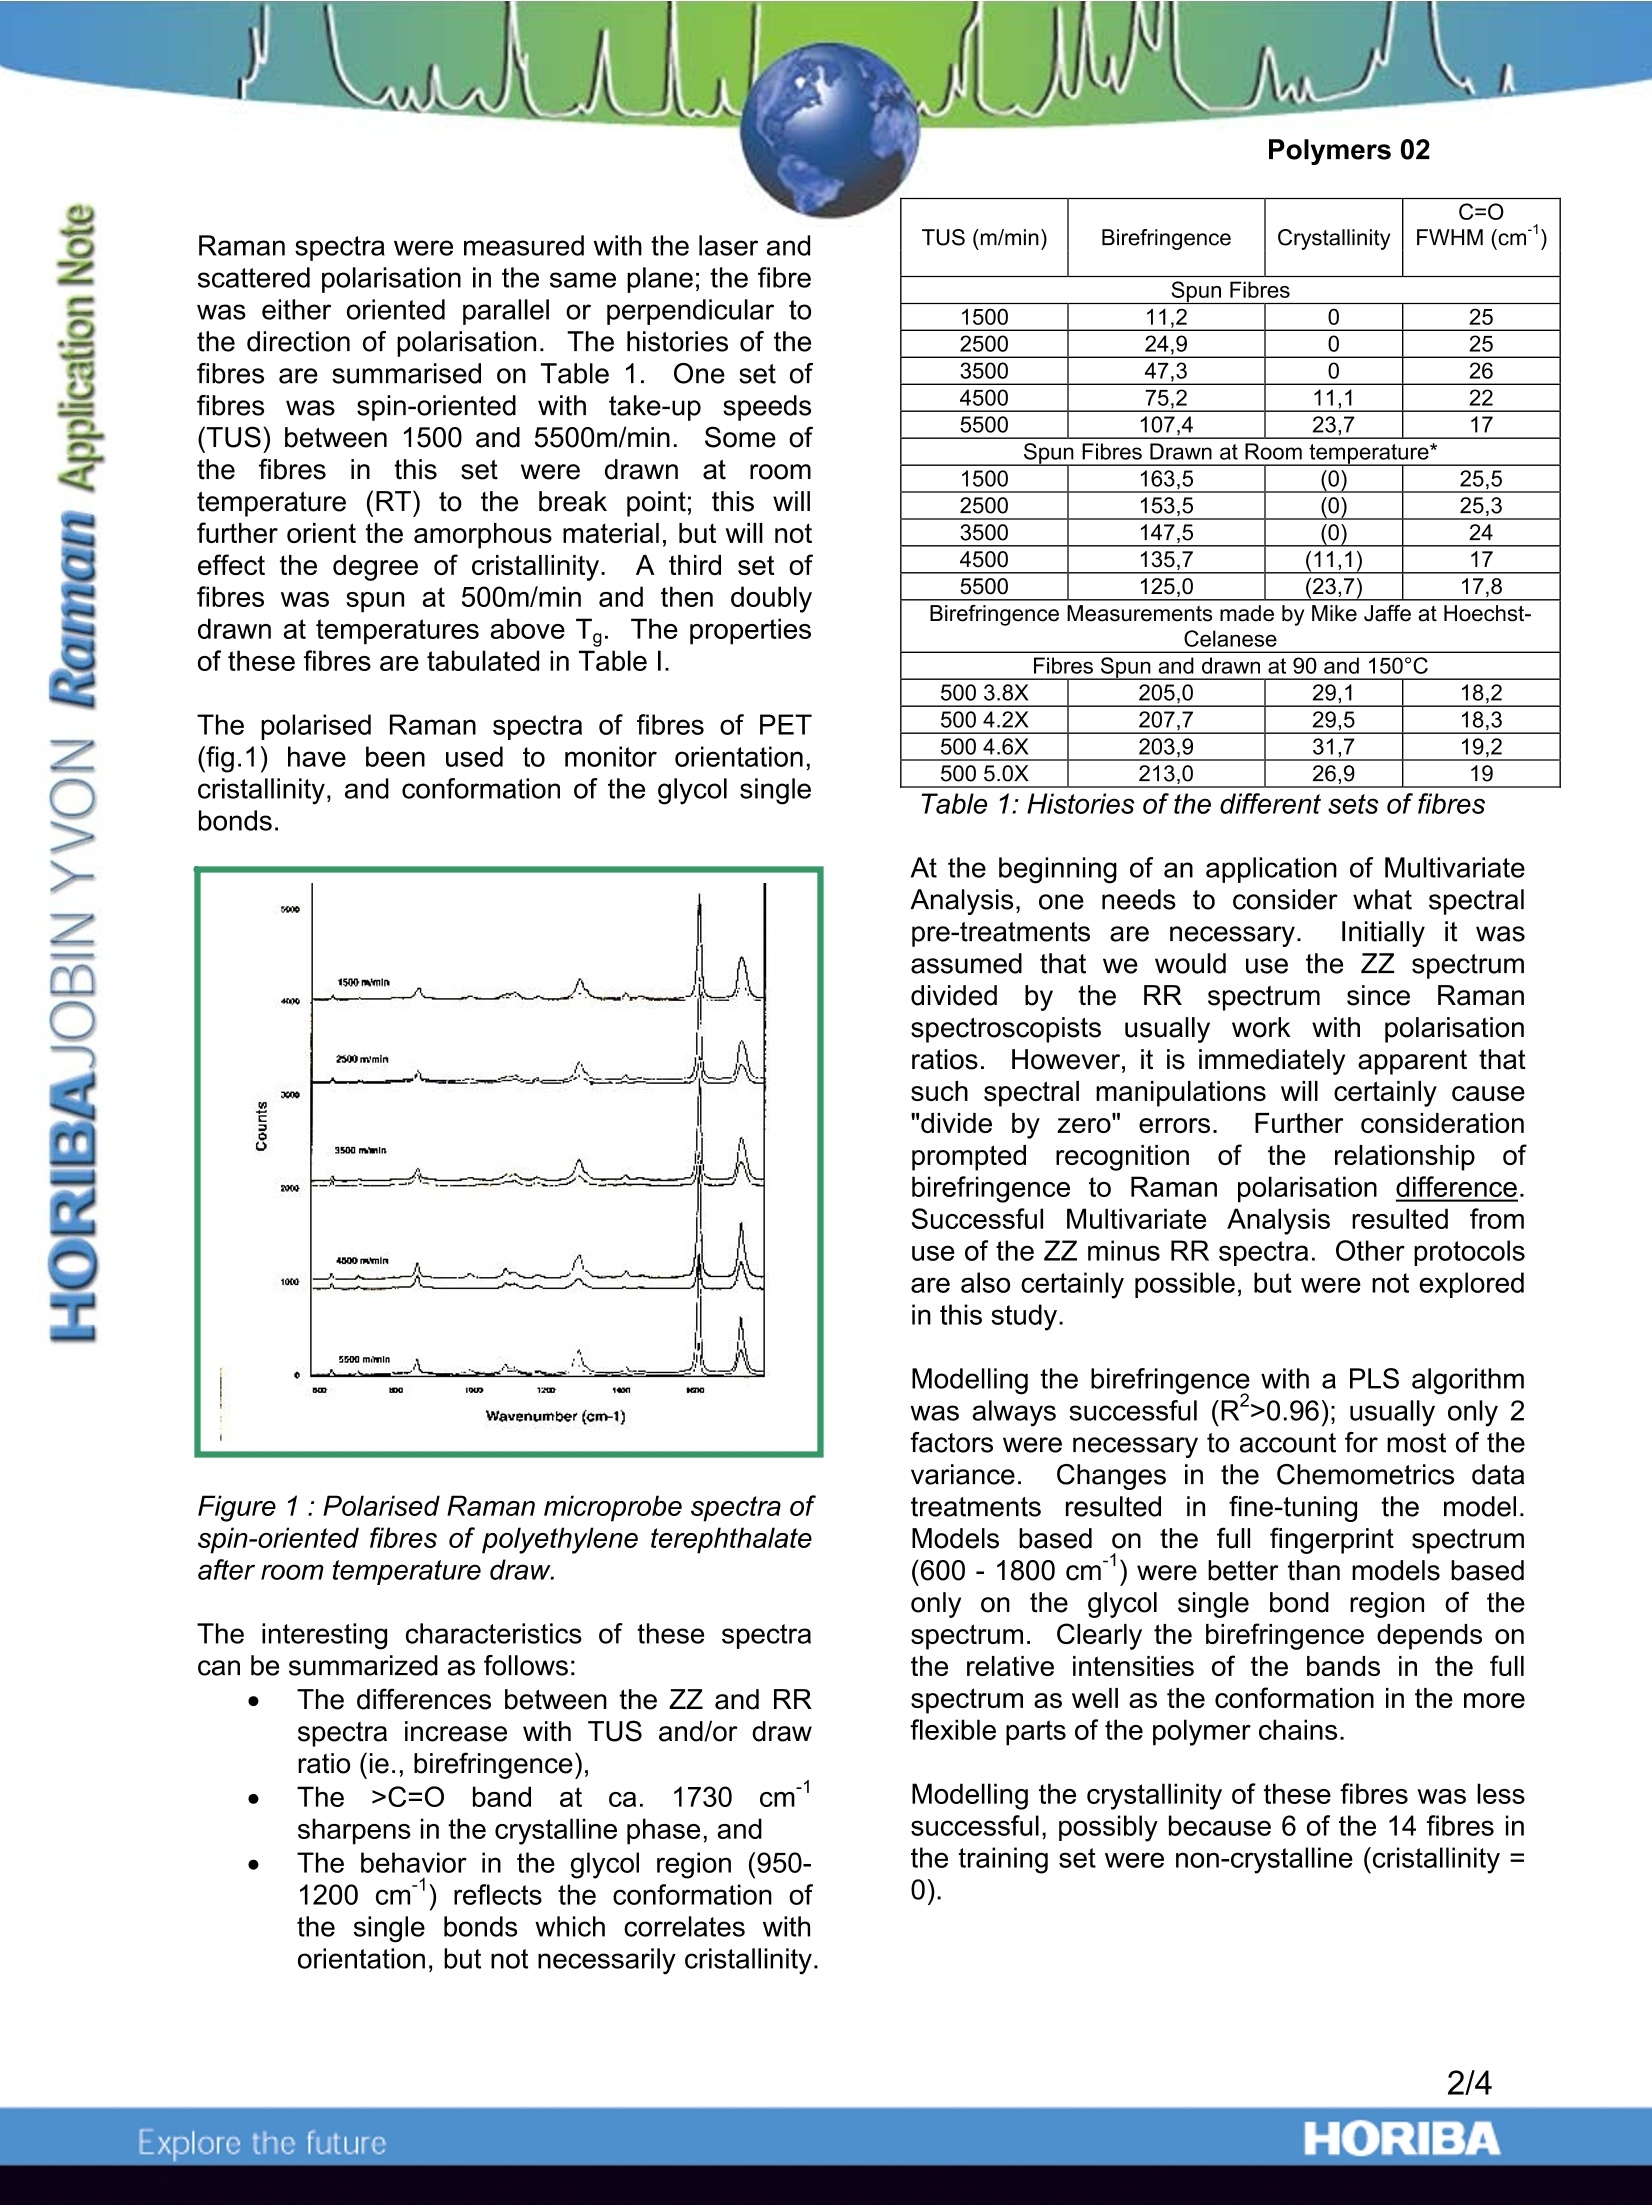
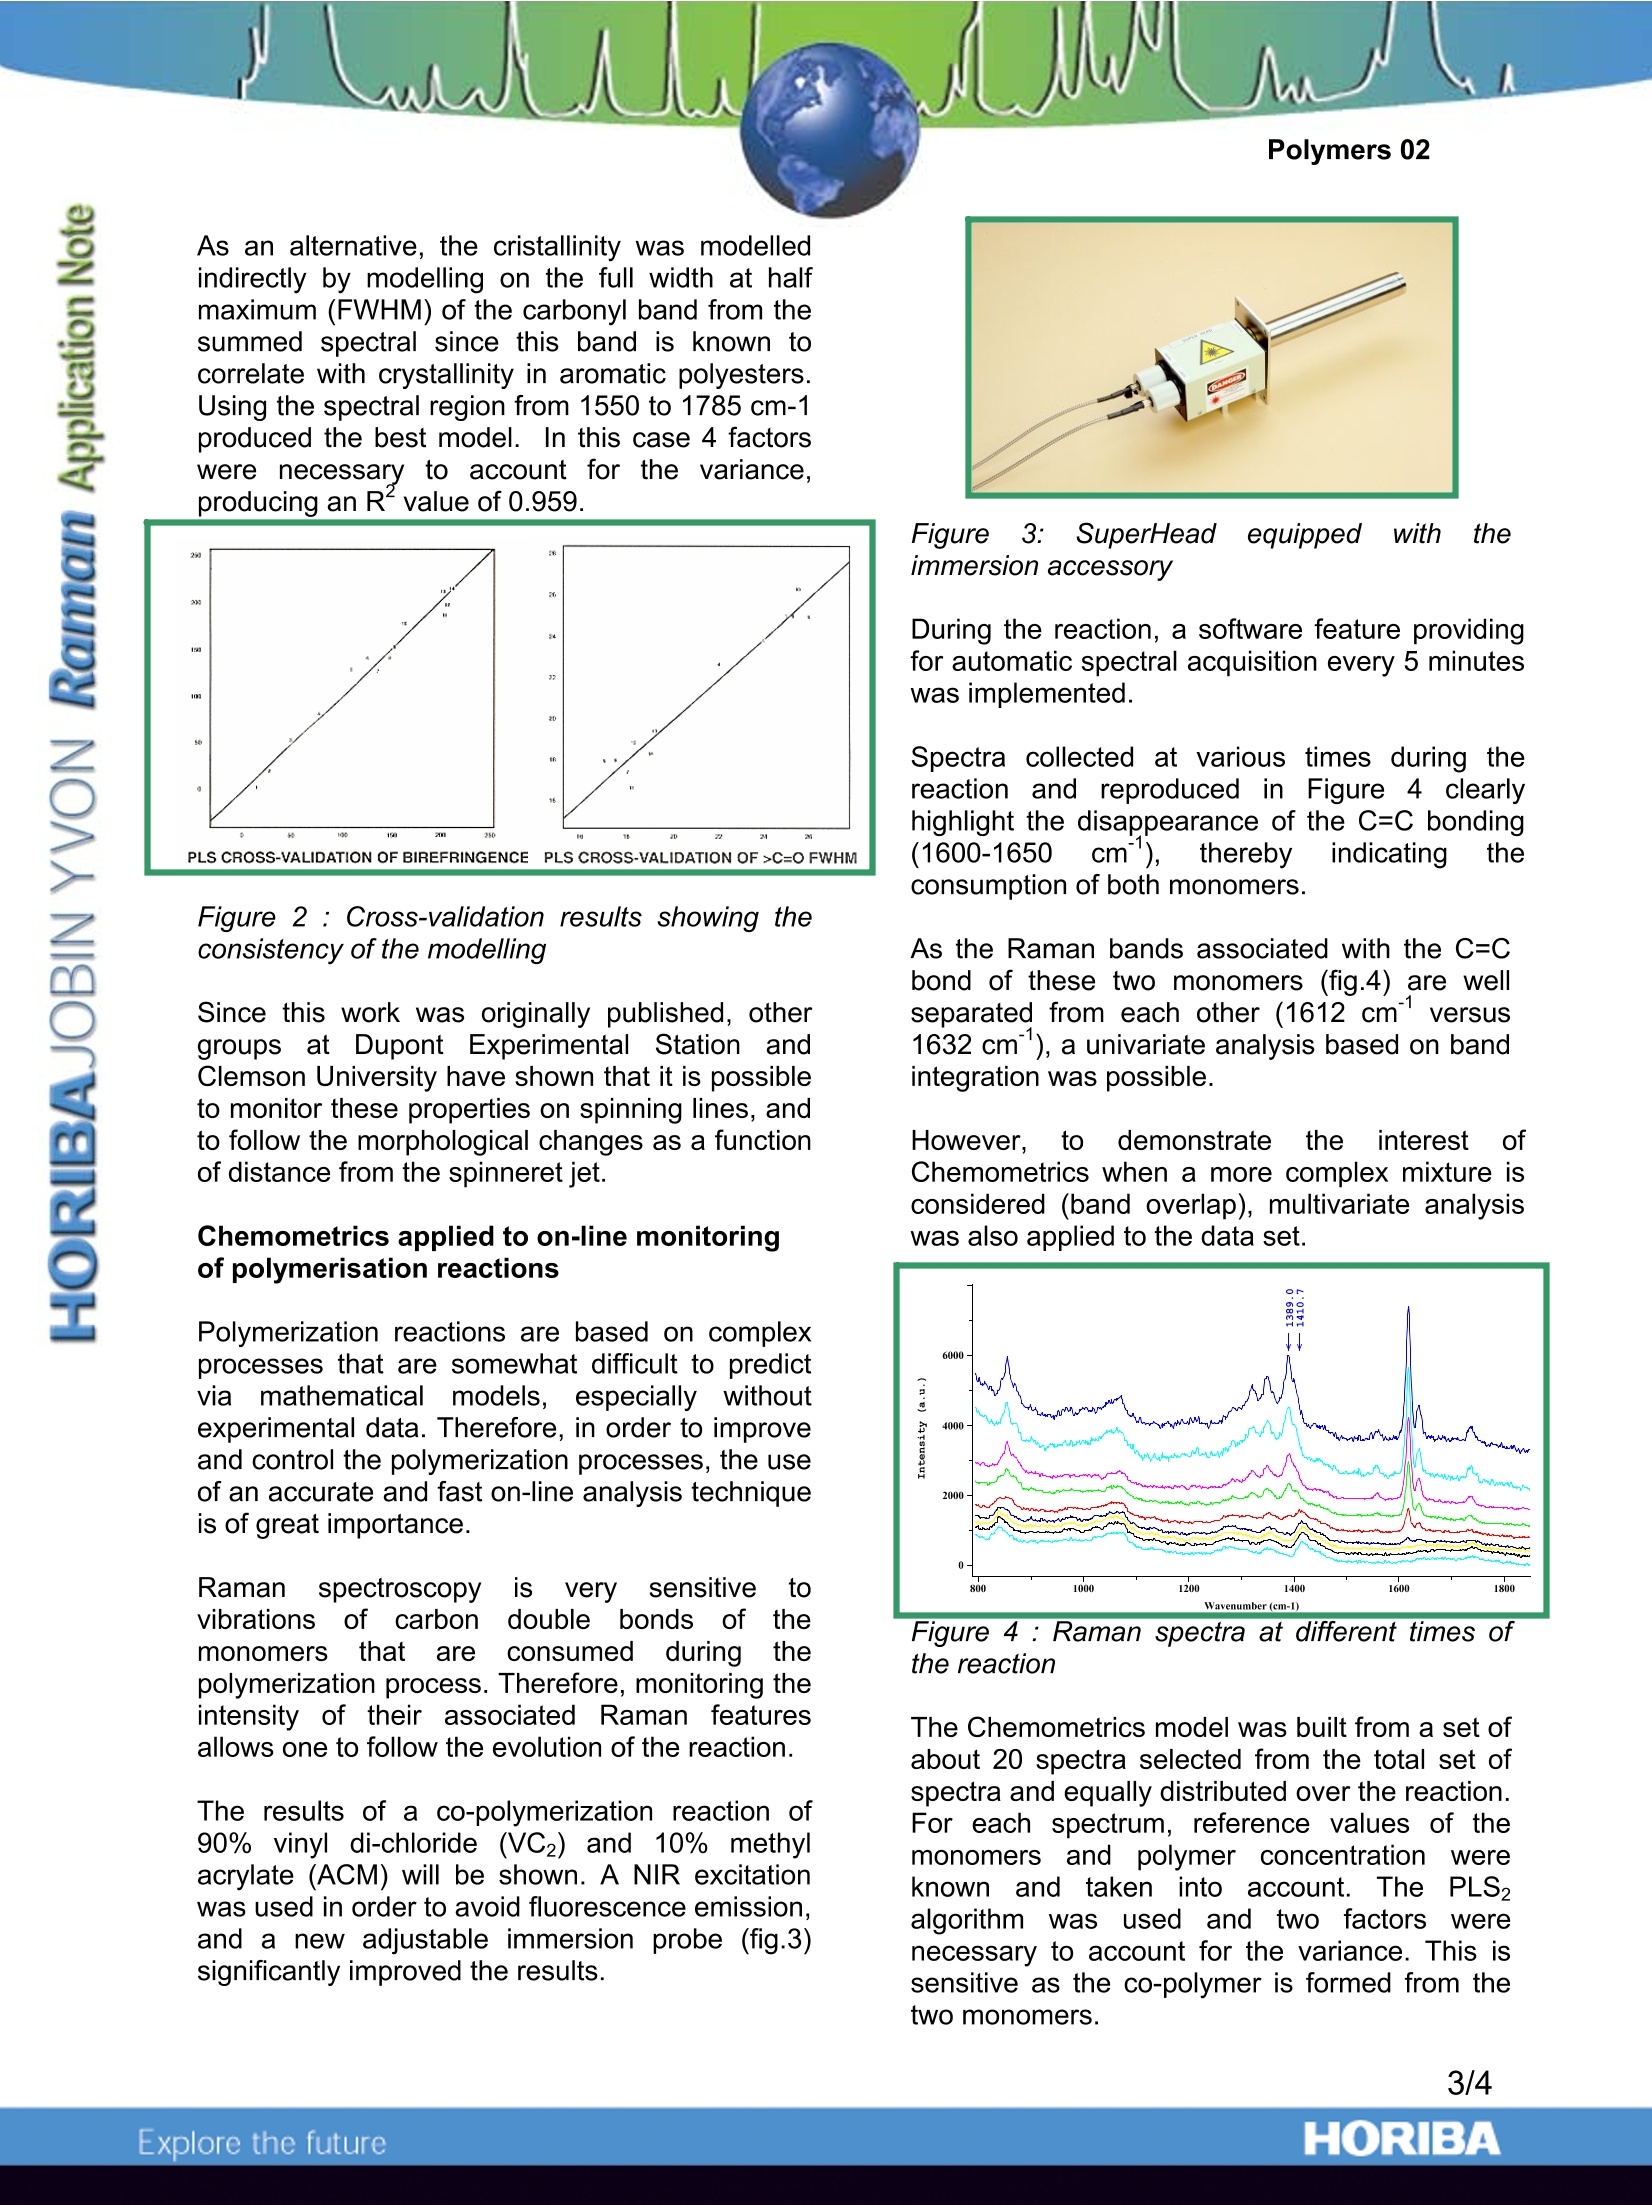
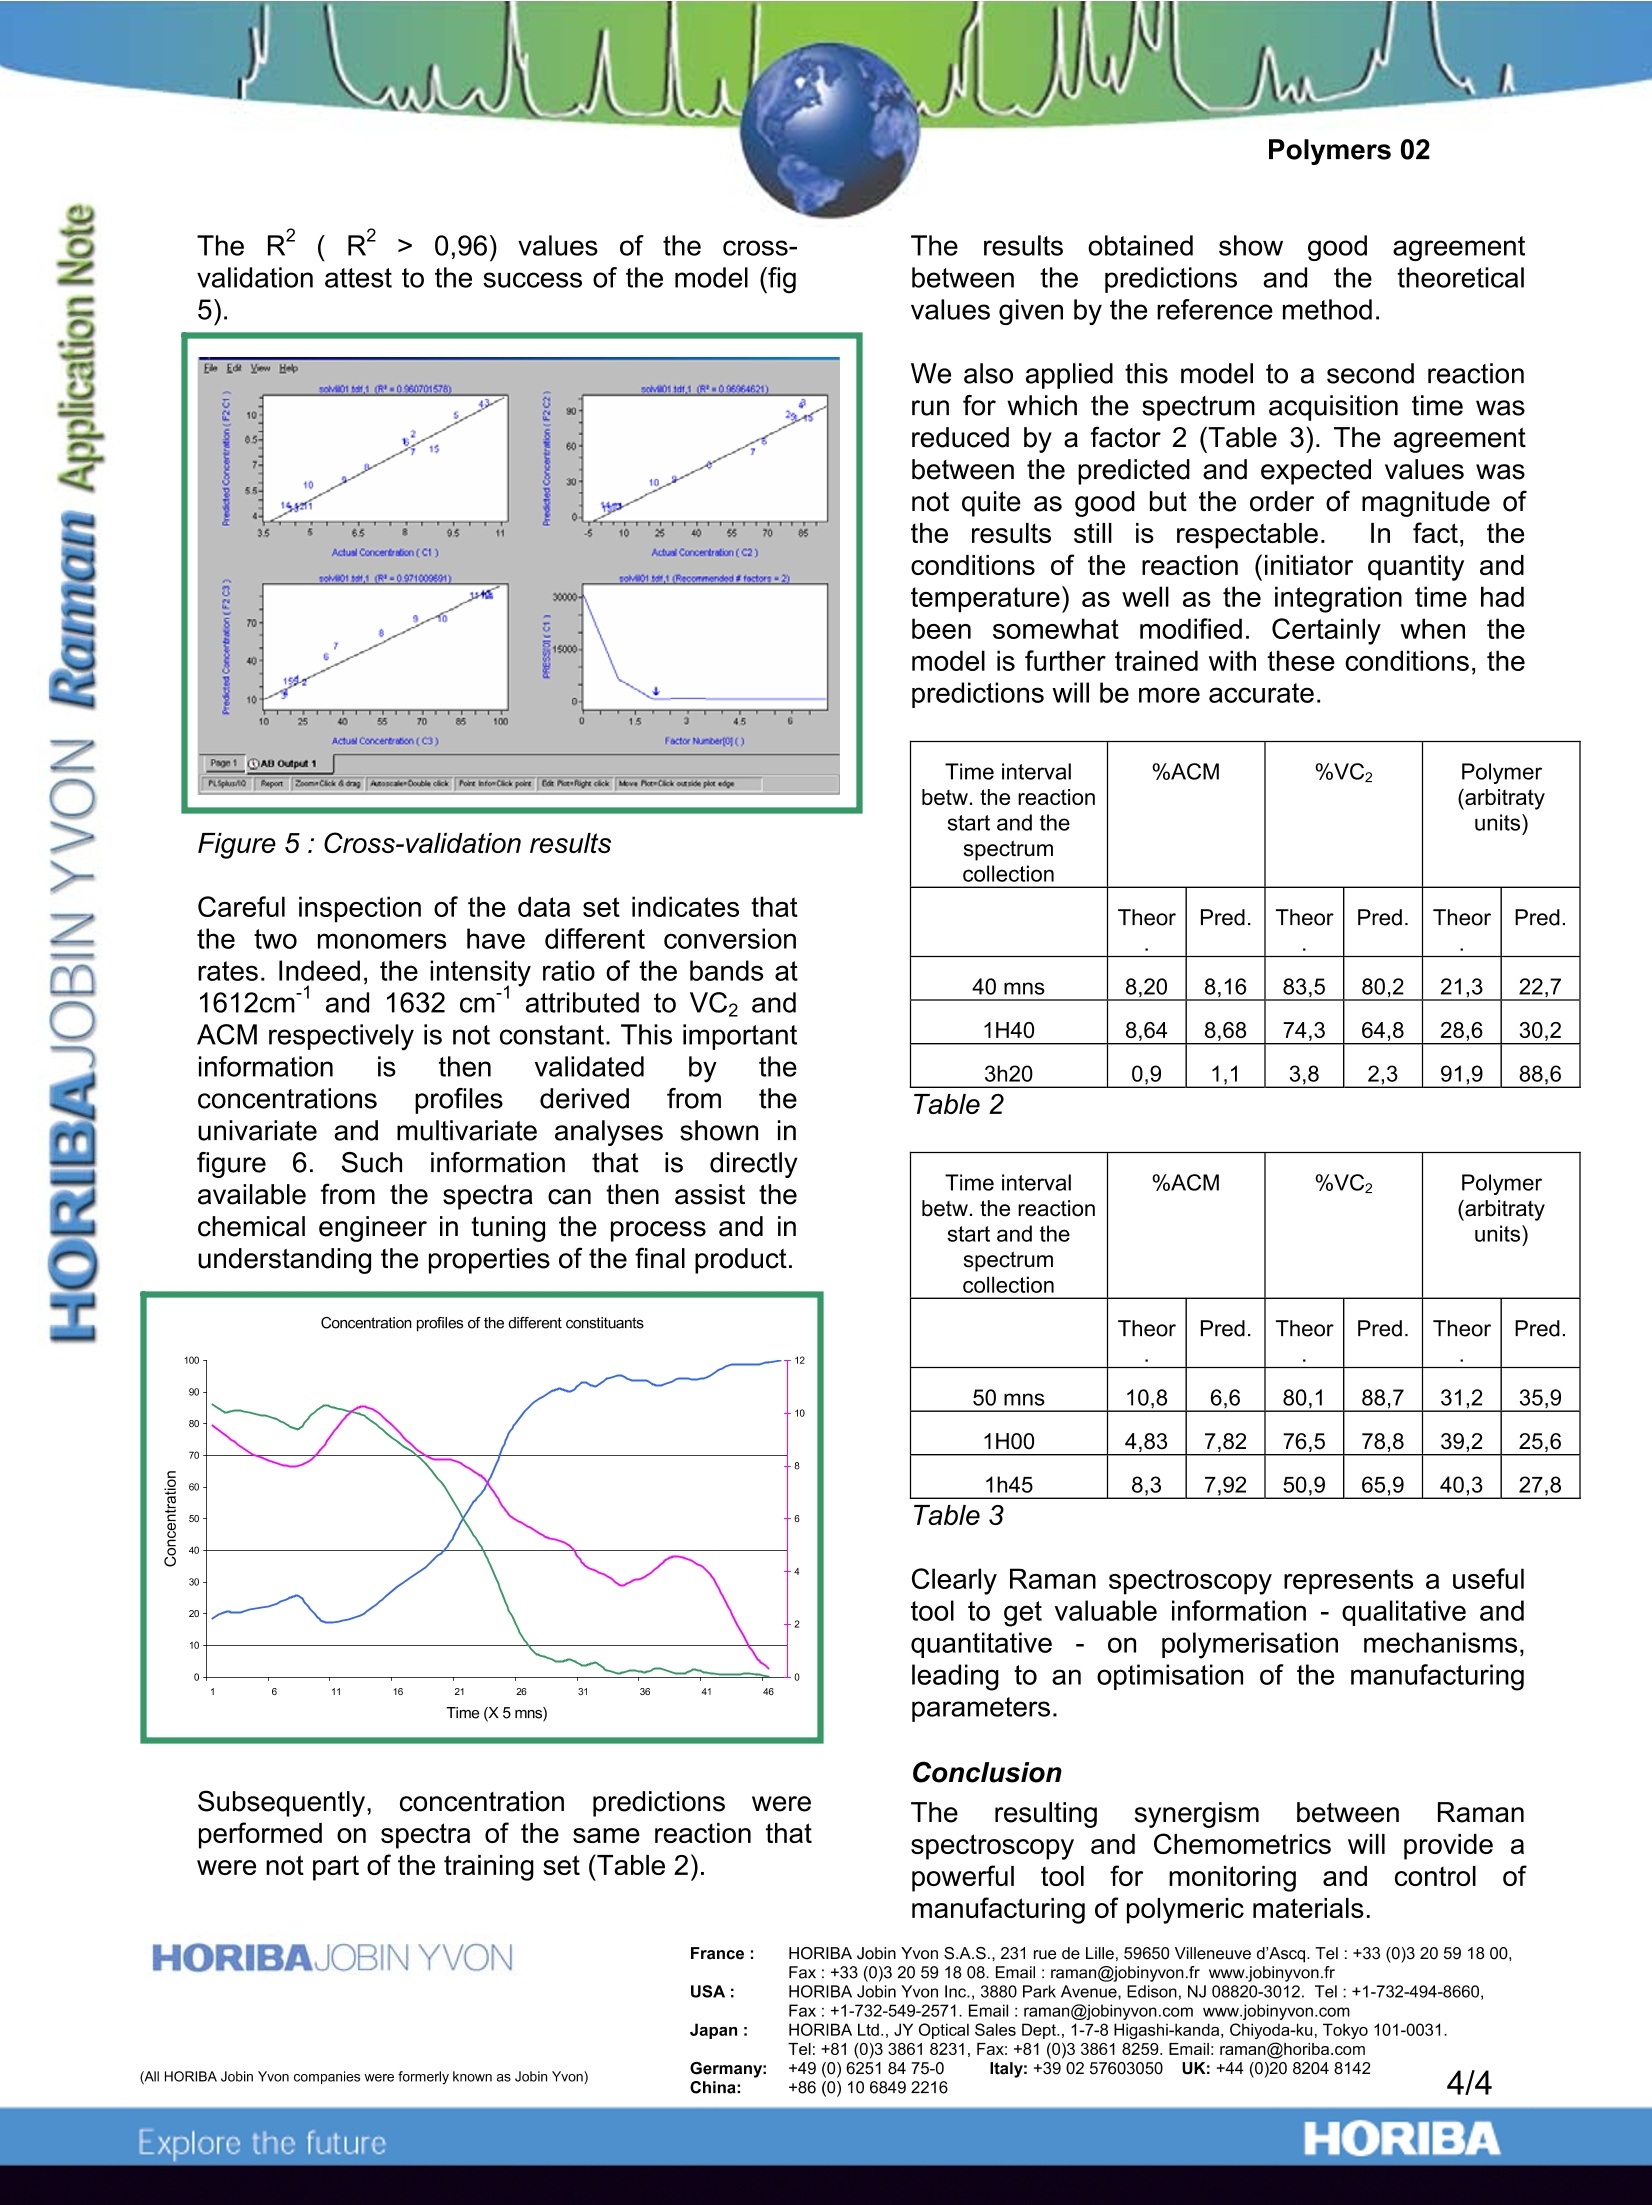
Polymers 02 Using Chemometrics and Raman Spectra forQuantitative Predictions of Physical and ChemicalProperties of Polymers Introduction Multivariate or Chemometrics techniquesaarenormallyapplied to spectra of solutions,i,ormixtures of materials, in an effort to developmethods to“predict”concentrations of the variouschemical species. In fact, the same mathematicaltechniques can be applied to elucidate physicalpropertiesaswell.Actually, these twoapplications of Chemometrics are useful in thepolymer field. Indeed, as far as polymeric fibres are concerned,slight modifications of Raman features are directlyrelated to differences in the molecular orientation.and the degree of crystallinity of the fibres.Toutilizetheseesubtle spectral changesandcorrelate them with physical properties of thepolymer, one is obliged to use Chemometrics onthe Raman spectra. Chemometrics also turns out to be useful whenone wants to monitor polymerisation reactions.During the formation of the polymeric chains,there is almost always the loss of a double bondof the monomer structure. The Raman featuresassociated withh these double bonds areingeneral fairly intense, and do not mix with otherbands. Therefore. by monitoring thedisappearance of these particular bands, one canfollowttheepolymerisation of the monomers.However,although the derivation of quantitativeinformation is rather straightforward when one ortwo monomers are involved, it gets more complexas soon as the reactive medium contains severalmonomers because it becomes likely that thebands of interest from the different monomersoverlap.i.\When analytical bands overlap) itbecomes impossible to utilize univariate analysisof the Raman data. The use of multivariateanalysis becomes then the only way to extract thevaluable information. Chemometricss applied to polarised Ramanspectra of fibres of polyethylene terephtalate Spin-oriented and drawn polymeric fibres haveapplications in the textile industry and in manyengineering applications (such as tire cord). Thephysical and chemical properties of these fibresdepend not only on the chemical composition, butalso on the mode of fabrication.Ultimately, themolecular orientation and % cristallinity can berelated to such properties as dyeability, tenacity(strength), glass transition temperature, meltingtemperature, and other thermal properties suchas possible % shrinkage. lt was the goal of the present study to useMultivariatee1Techniques to predictt physicalproperties of PET fibres that are measured byother, perhaps more time consuming methods.The ability to predict birefringence (whichisdirectly related to molecular orientation) andcrystallinity will be demonstrated. Other physicalproperties that are amenable to such analysiscould be dyeability (which occurs only in theamorphous regions which can solubilize the dyes),theglass transition temperature (Tg),crystallisation temperature (Tm), tenacity, drawpotential before breakage, or shrinkage potentialduring heat treatment. The ability to predict suchproperties is based on the fact that they dependon: e amorphous vs. crystalline composition the orientation of the amorphous materialwhichcan be: monitored with thepolarization dependence, and the conformation of the glycol bondswhich can be monitored by followingdetailss in the single bond fingerprintregion of the spectrum. Raman spectra were measured with the laser andscattered polarisation in the same plane; the fibrewas either oriented parallel or perpendicular tothe direction of polarisation. The histories of thefibres are summarised on Table 1. One set offibres was spin-orientedwith take-up speeds(TUS) between 1500 and 5500m/min. Some ofthe fibresin this set were drawn at roomtemperature (RT) to the break point; this willfurther orient the amorphous material, but will noteffect the degree of cristallinity. A third set offibres was spun at 500m/min and then doublydrawn at temperatures above Tg. The propertiesof these fibres are tabulated in Table l. The polarised Raman spectra of fibres of PET(fig.1) have been used to monitor orientation,cristallinity, and conformation of the glycol singlebonds. Figure 1 : Polarised Raman microprobe spectra ofspin-oriented fibres of polyethylene terephthalateafter room temperature draw. The interesting characteristics of these spectracan be summarized as follows: The differences between the ZZ and RRspectra increase with TUS and/or drawratio (ie., birefringence), The >C=O bandl atca.1.1730cmsharpens in the crystalline phase, and The behavior in the glycol region (950-1200 cm"’) reflects the conformation ofthe single bonds which correlates withorientation, but not necessarily cristallinity. TUS (m/min) Birefringence Crystallinity C=O FWHM (cm) Spun Fibres 1500 11.2 0 25 2500 24,9 0 25 3500 47,3 0 26 4500 75.2 11,1 22 5500 107.4 23,7 17 Spun Fibres Drawn at Room temperature* 1500 163,5 (0) 25,5 2500 153,5 (0) 25,3 3500 147.5 (0) 24 4500 135,7 (11,1) 17 5500 125,0 (23,7) 17,8 Birefringence Measurements made by Mike Jaffe at Hoechst- Celanese Fibres Spun and drawn at 90 and 150℃ 500 3.8X 205,0 29,1 18,2 500 4.2X 207.7 29,5 18,3 500 4.6X 203,9 31.7 19,2 500 5.0X 213,0 26,9 19 At the beginning of an application of MultivariateAnalysis, one needs to consider what spectralpre-treatments are necessary.Initially it wasassumed that we would use the ZZ spectrumdivided by the: RR spectrum since Ramanspectroscopists; usually work( with1 polarisationratios. However, it is immediately apparent thatsuch spectral manipulations will certainly cause"divide by zero" errors. Further considerationprompted recognition of the relationship ofbirefringence to Raman polarisation difference.Successful Multivariate Analysis resulted fromuse of the ZZ minus RR spectra. Other protocolsare also certainly possible, but were not exploredin this study. Modelling the birefringence with a PLS algorithmwas always successful (R*>0.96); usually only 2factors were necessary to account for most of thevariance..Changes in the Chemometrics datatreatments resulteddiinnifine-tuning the model.Models based on the full fingerprint spectrum(600-1800 cm’’) were better than models basedonly on the glycol single bond region of thespectrum. Clearly the birefringence depends onthe relative intensities of the bands in the fullspectrum as well as the conformation in the moreflexible parts of the polymer chains. Modelling the crystallinity of these fibres was lesssuccessful, possibly because 6 of the 14 fibres inthe training set were non-crystalline (cristallinity=0). As an alternative, the cristallinity was modelledindirectly by modelling on the full width at halfmaximum (FWHM) of the carbonyl band from thesummed spectral since this band is known tocorrelate with crystallinity in aromatic polyesters.Using the spectral region from 1550 to 1785 cm-1produced the best model. In this case 4 factorswere necessary to account for the variance,producing an Rvalue of 0.959. PLS CROSS-VALIDATION OF BIREFRINGENCEPLS CROSS-VALIDATION OF>C=O FWHM Figure 2 : Cross-validation results showing theconsistency of the modelling Since this work was originally published, othergroups at Dupont Experimental Station andClemson University have shown that it is possibleto monitor these properties on spinning lines, andto follow the morphological changes as a functionof distance from the spinneret jet. Chemometrics applied to on-line monitoringof polymerisation reactions Polymerization reactions are based on complexprocesses that are somewhat difficult to predictvia mathematicalmodels, especially withoutexperimental data. Therefore, in order to improveand control the polymerization processes, the useof an accurate and fast on-line analysis techniqueis of great importance. Raman spectroscopy isls very sensitive todoubleC themonomers that areconsumed during thepolymerization process. Therefore, monitoring theintensity of their associated Raman 1featuresallows one to follow the evolution of the reaction. The results of a co-polymerization reaction of90% vinyl di-chloride (VC2) and 10% methylacrylate (ACM) will be shown. A NIR excitationwas used in order to avoid fluorescence emission,and a new adjustable immersion probe (fig.3)significantly improved the results. Figure3:SuperHeadequipped with theimmersion accessory During the reaction, a software feature providingfor automatic spectral acquisition every 5 minuteswas implemented. Spectra collected at various times during thereaction and reproduced in Figure 4 clearlyhighlight the disappearance of the C=C bonding(1600-1650 cm), thereby indicating theconsumption of both monomers. As the Raman bands associated with the C=Cbond of these two monomers (fig.4)are wellseparated from each other (1612 cm-lversus1632 cm"), a univariate analysis based on bandintegration was possible. However, to demonstrate theiinterest ofChemometrics when a more complex mixture isconsidered (band overlap), multivariate analysiswas also applied to the data set. Wavenurnber(cm-1) Figure 4: Raman spectra at different times ofthe reaction The Chemometrics model was built from a set ofabout 20 spectra selected from the total set ofspectra and equally distributed over the reaction.For each spectrum, reference values of themonomers and polymer concentration wereknownandtaken11intoaccount. ThePLS,algorithm wasused and two factorsWerenecessary to account for the variance. This issensitive as the co-polymer is formed from thetwo monomers. The R²( R²> 0,96) values of the cross-validation attest to the success of the model (fig5). Figure 5 : Cross-validation results Careful inspection of the data set indicates thatthe two monomers have different conversionrates. Indeed, the intensity ratio of the bands at1612cm and 1632 cm attributed to VC2 andACM respectively is not constant. This importantinformation is then validated by theconcentrations profiles derived trom theunivariate and multivariate analyses shown infigure 6. Such information that is directlyavailable from the spectra can then assist thechemical engineer in tuning the process and inunderstanding the properties of the final product. Subsequently, concentrationpredictionss wereperformed on spectra of the same reaction thatwere not part of the training set (Table 2). The results obtained showWgood agreementbetweenthe predictions; and thettheoreticalvalues given by the reference method. We also applied this model to a second reactionrun for which the spectrum acquisition time wasreduced by a factor 2 (Table 3). The agreementbetween the predicted and expected values wasnot quite as good but the order of magnitude ofthe results still is respectable. In fact, theconditions of the reaction (initiator quantity andtemperature) as well as the integration time hadbeen somewhat modified. Certainly when themodel is further trained with these conditions, thepredictions will be more accurate. Time intervalbetw. the reactionstart and thespectrum collection %ACM %VC2 Polymer(arbitratyunits) Theor Pred. Theor Pred. Theor Pred. 40 mns 8,20 8,16 83,5 80,2 21,3 22,7 1H40 8,64 8,68 74.3 64,8 28,6 30,2 3h20 0,9 1,1 3,8 2,3 91,9 88,6 Table 2 Time intervalbetw. the reactionstart and thespectrumcollection %ACM %VC2 Polymer(arbitratyunits) Theor Pred. Theor Pred. Theor Pred. 50 mns 10,8 6,6 80,1 88,7 31,2 35,9 1H00 4,83 7,82 76,5 78,8 39,2 25,6 1h45 8,3 7,92 50,9 65,9 40,3 27,8 Table 3 Clearly Raman spectroscopy represents a usefultool to get valuable information -qualitative andquantitative - on polymerisation mechanisms,leading to an optimisation of the manufacturingparameters. Conclusion The resultingsynergismn lbetween Ramanspectroscopy and Chemometrics will provide apowerful tool for monitoring and control ofmanufacturing of polymeric materials. HORIBA Jobin Yvon S.A.S., 231 rue de Lille, 59650 Villeneuve d'Ascq. Tel:+33 (0)3 20 59 18 00, ( F ax : +33(0)320 59 18 08. Email: raman@jobinyvon.f r w ww.jobinyvon.fr ) ( USA: H ORIBA Jobin Yvon Inc. , 3880 Park Avenue, Edison, NJ 08820-3012. Tel:+1-732-494-8660, Fax: +1 -732-549-2571. Email : raman@jobinyvon.com www.jobinyvon.comJapan: H ORIBA Ltd., J Y Optical Sales Dept., 1-7-8 Higashi-kanda, Chiyoda-ku, Tokyo 101-0031. ) Tel: +81 (0)3 3861 8231, Fax: +81 (0)3 3861 8259. Email: raman@horiba.comGermany: +49 (0)6251 8475-0 lta +399257693959 YKi +44 (9)20 8204 8142China: +86 (0) 10 68492216 4/4 ORIBAExplore the future The resulting synergism between Raman spectroscopy and Chemometrics will provide a powerful tool for monitoring and control of manufacturing of polymeric materials.
确定
还剩2页未读,是否继续阅读?
HORIBA(中国)为您提供《聚对苯二甲酸乙二醇酯、乙二醇高分子化合物中定量预测物理、化学性质检测方案(激光拉曼光谱)》,该方案主要用于聚对苯二甲酸乙二醇酯(PET)中定量预测物理、化学性质检测,参考标准--,《聚对苯二甲酸乙二醇酯、乙二醇高分子化合物中定量预测物理、化学性质检测方案(激光拉曼光谱)》用到的仪器有
相关方案
更多
该厂商其他方案
更多

