方案详情
文
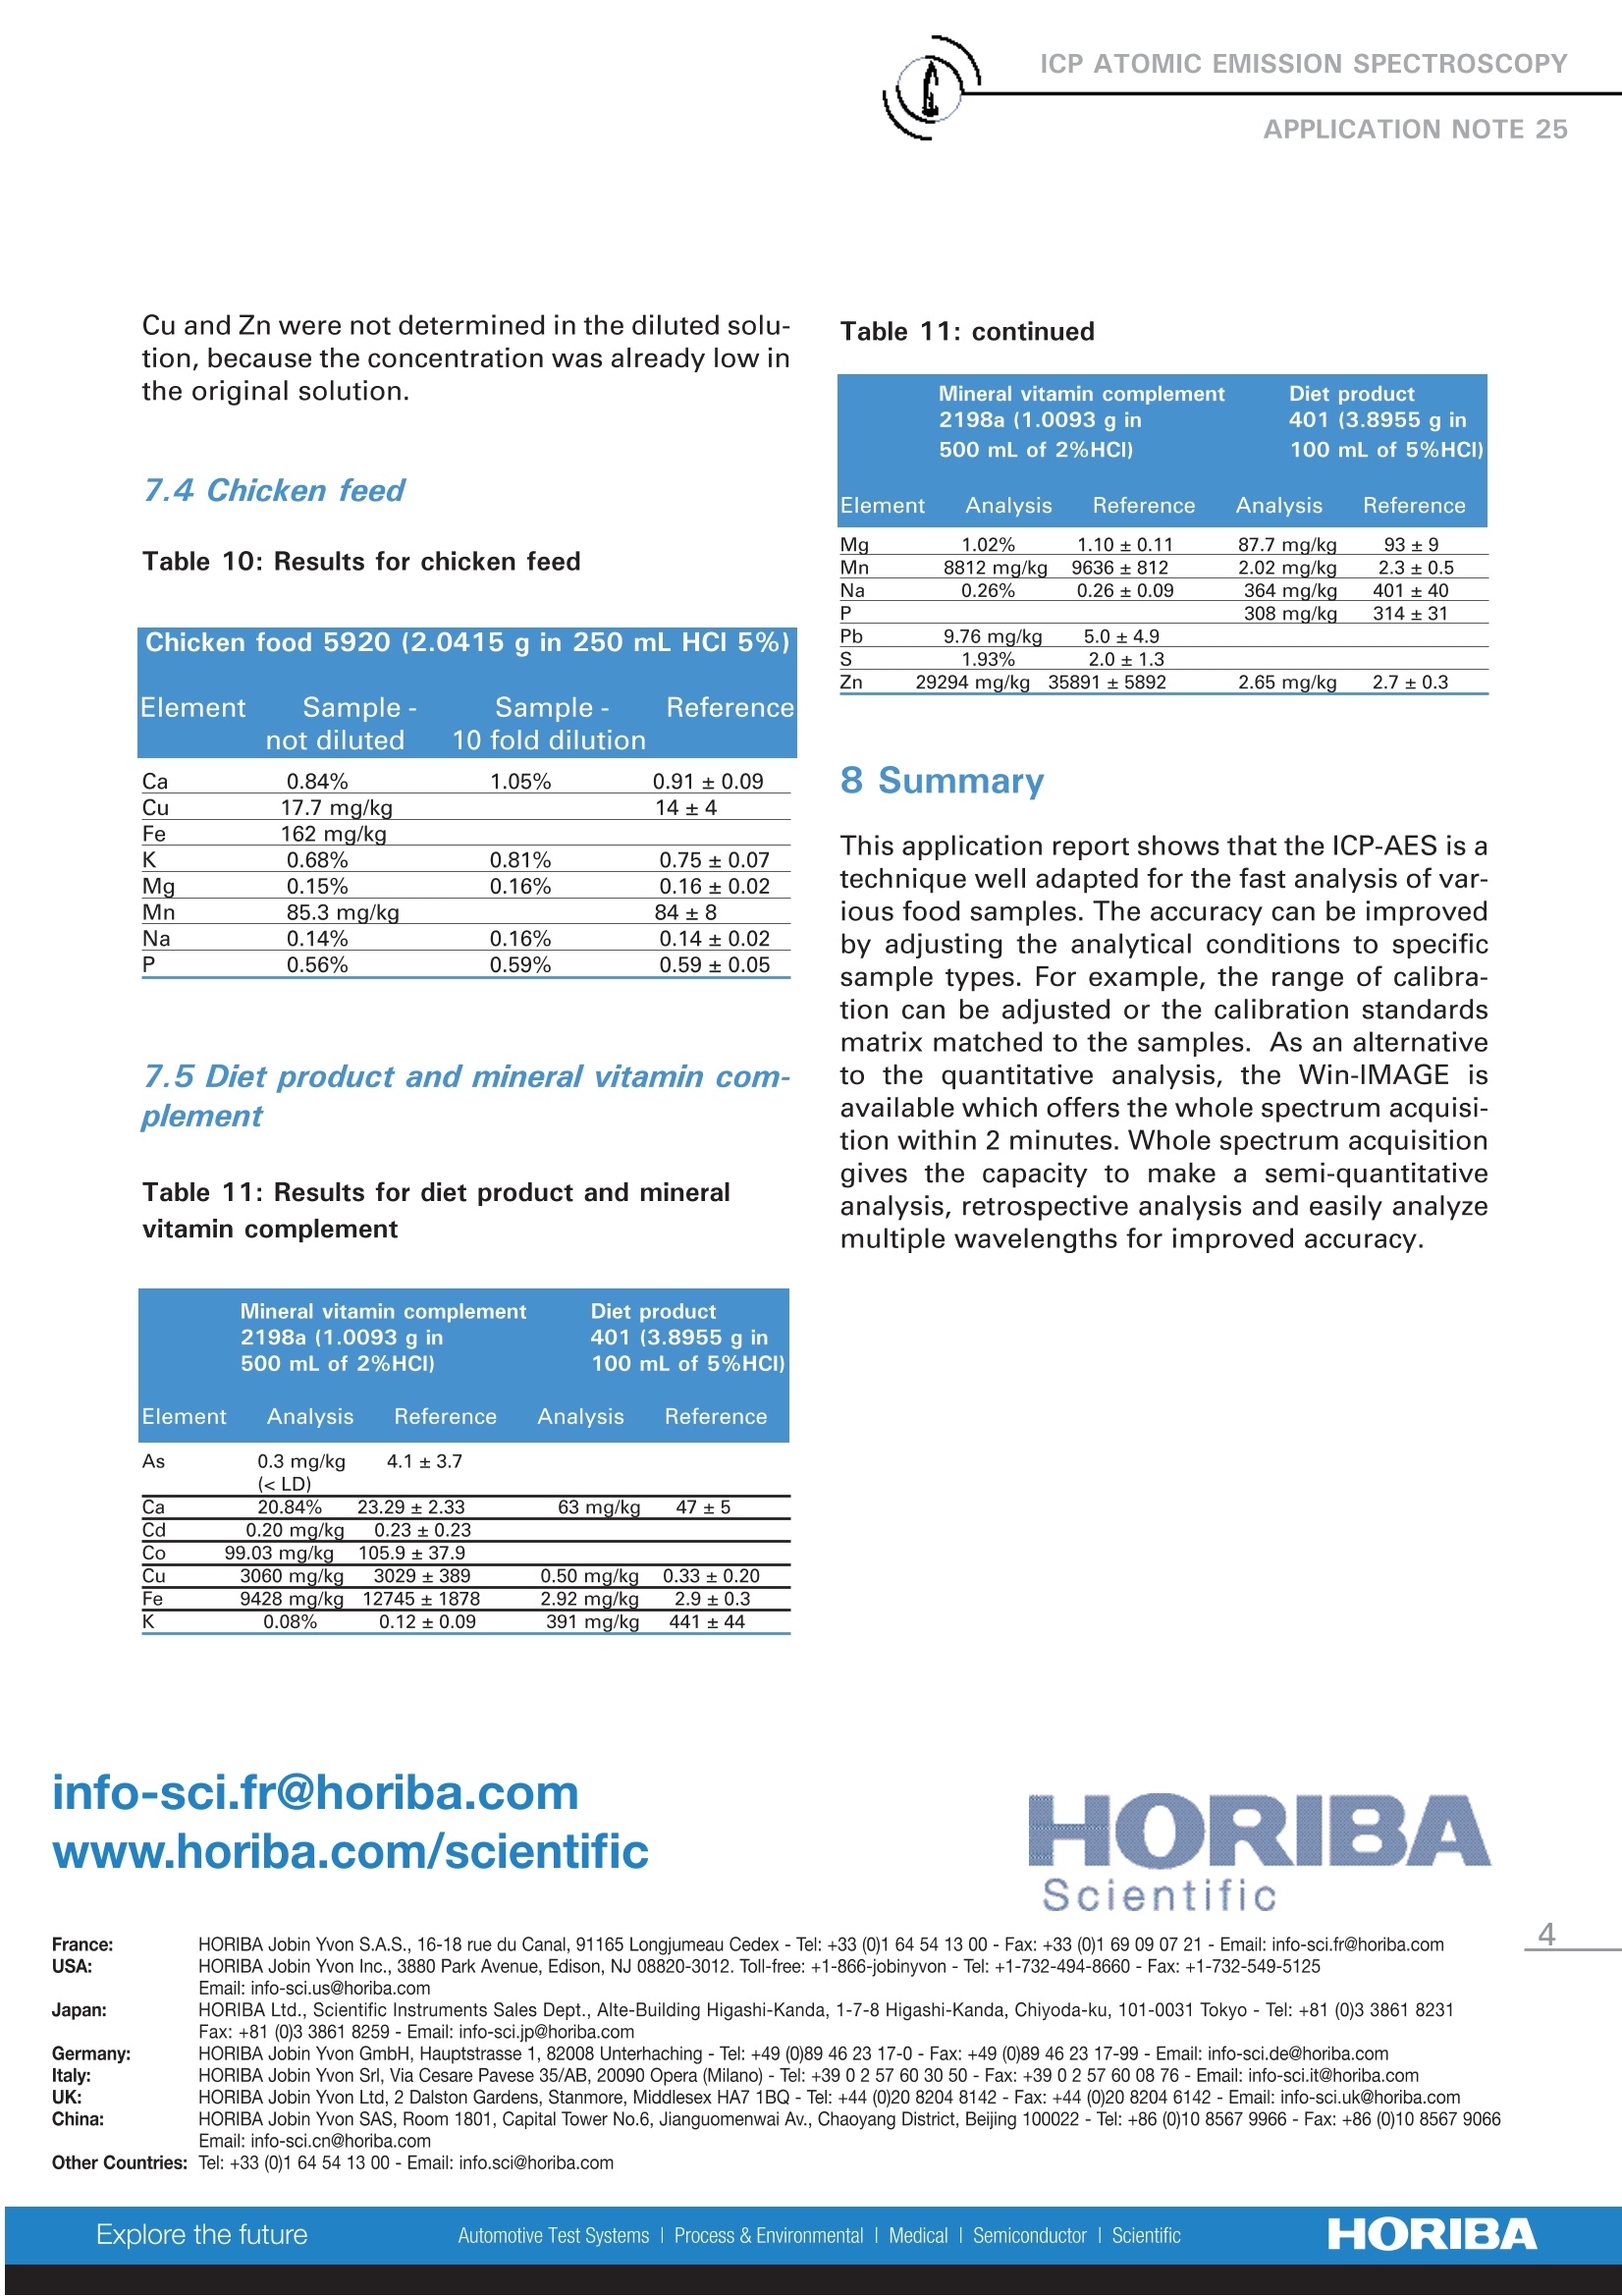
This application report shows that the ICP-AES is a technique well adapted for the fast analysis of various food samples. The accuracy can be improved by adjusting the analytical conditions to specific sample types. For example, the range of calibration can be adjusted or the calibration standards matrix matched to the samples. As an alternative to the quantitative analysis, the Win-IMAGE is available which offers the whole spectrum acquisition within 2 minutes. Whole spectrum acquisition gives the capacity to make a semi-quantitative analysis, retrospective analysis and easily analyze multiple wavelengths for improved accuracy.
方案详情

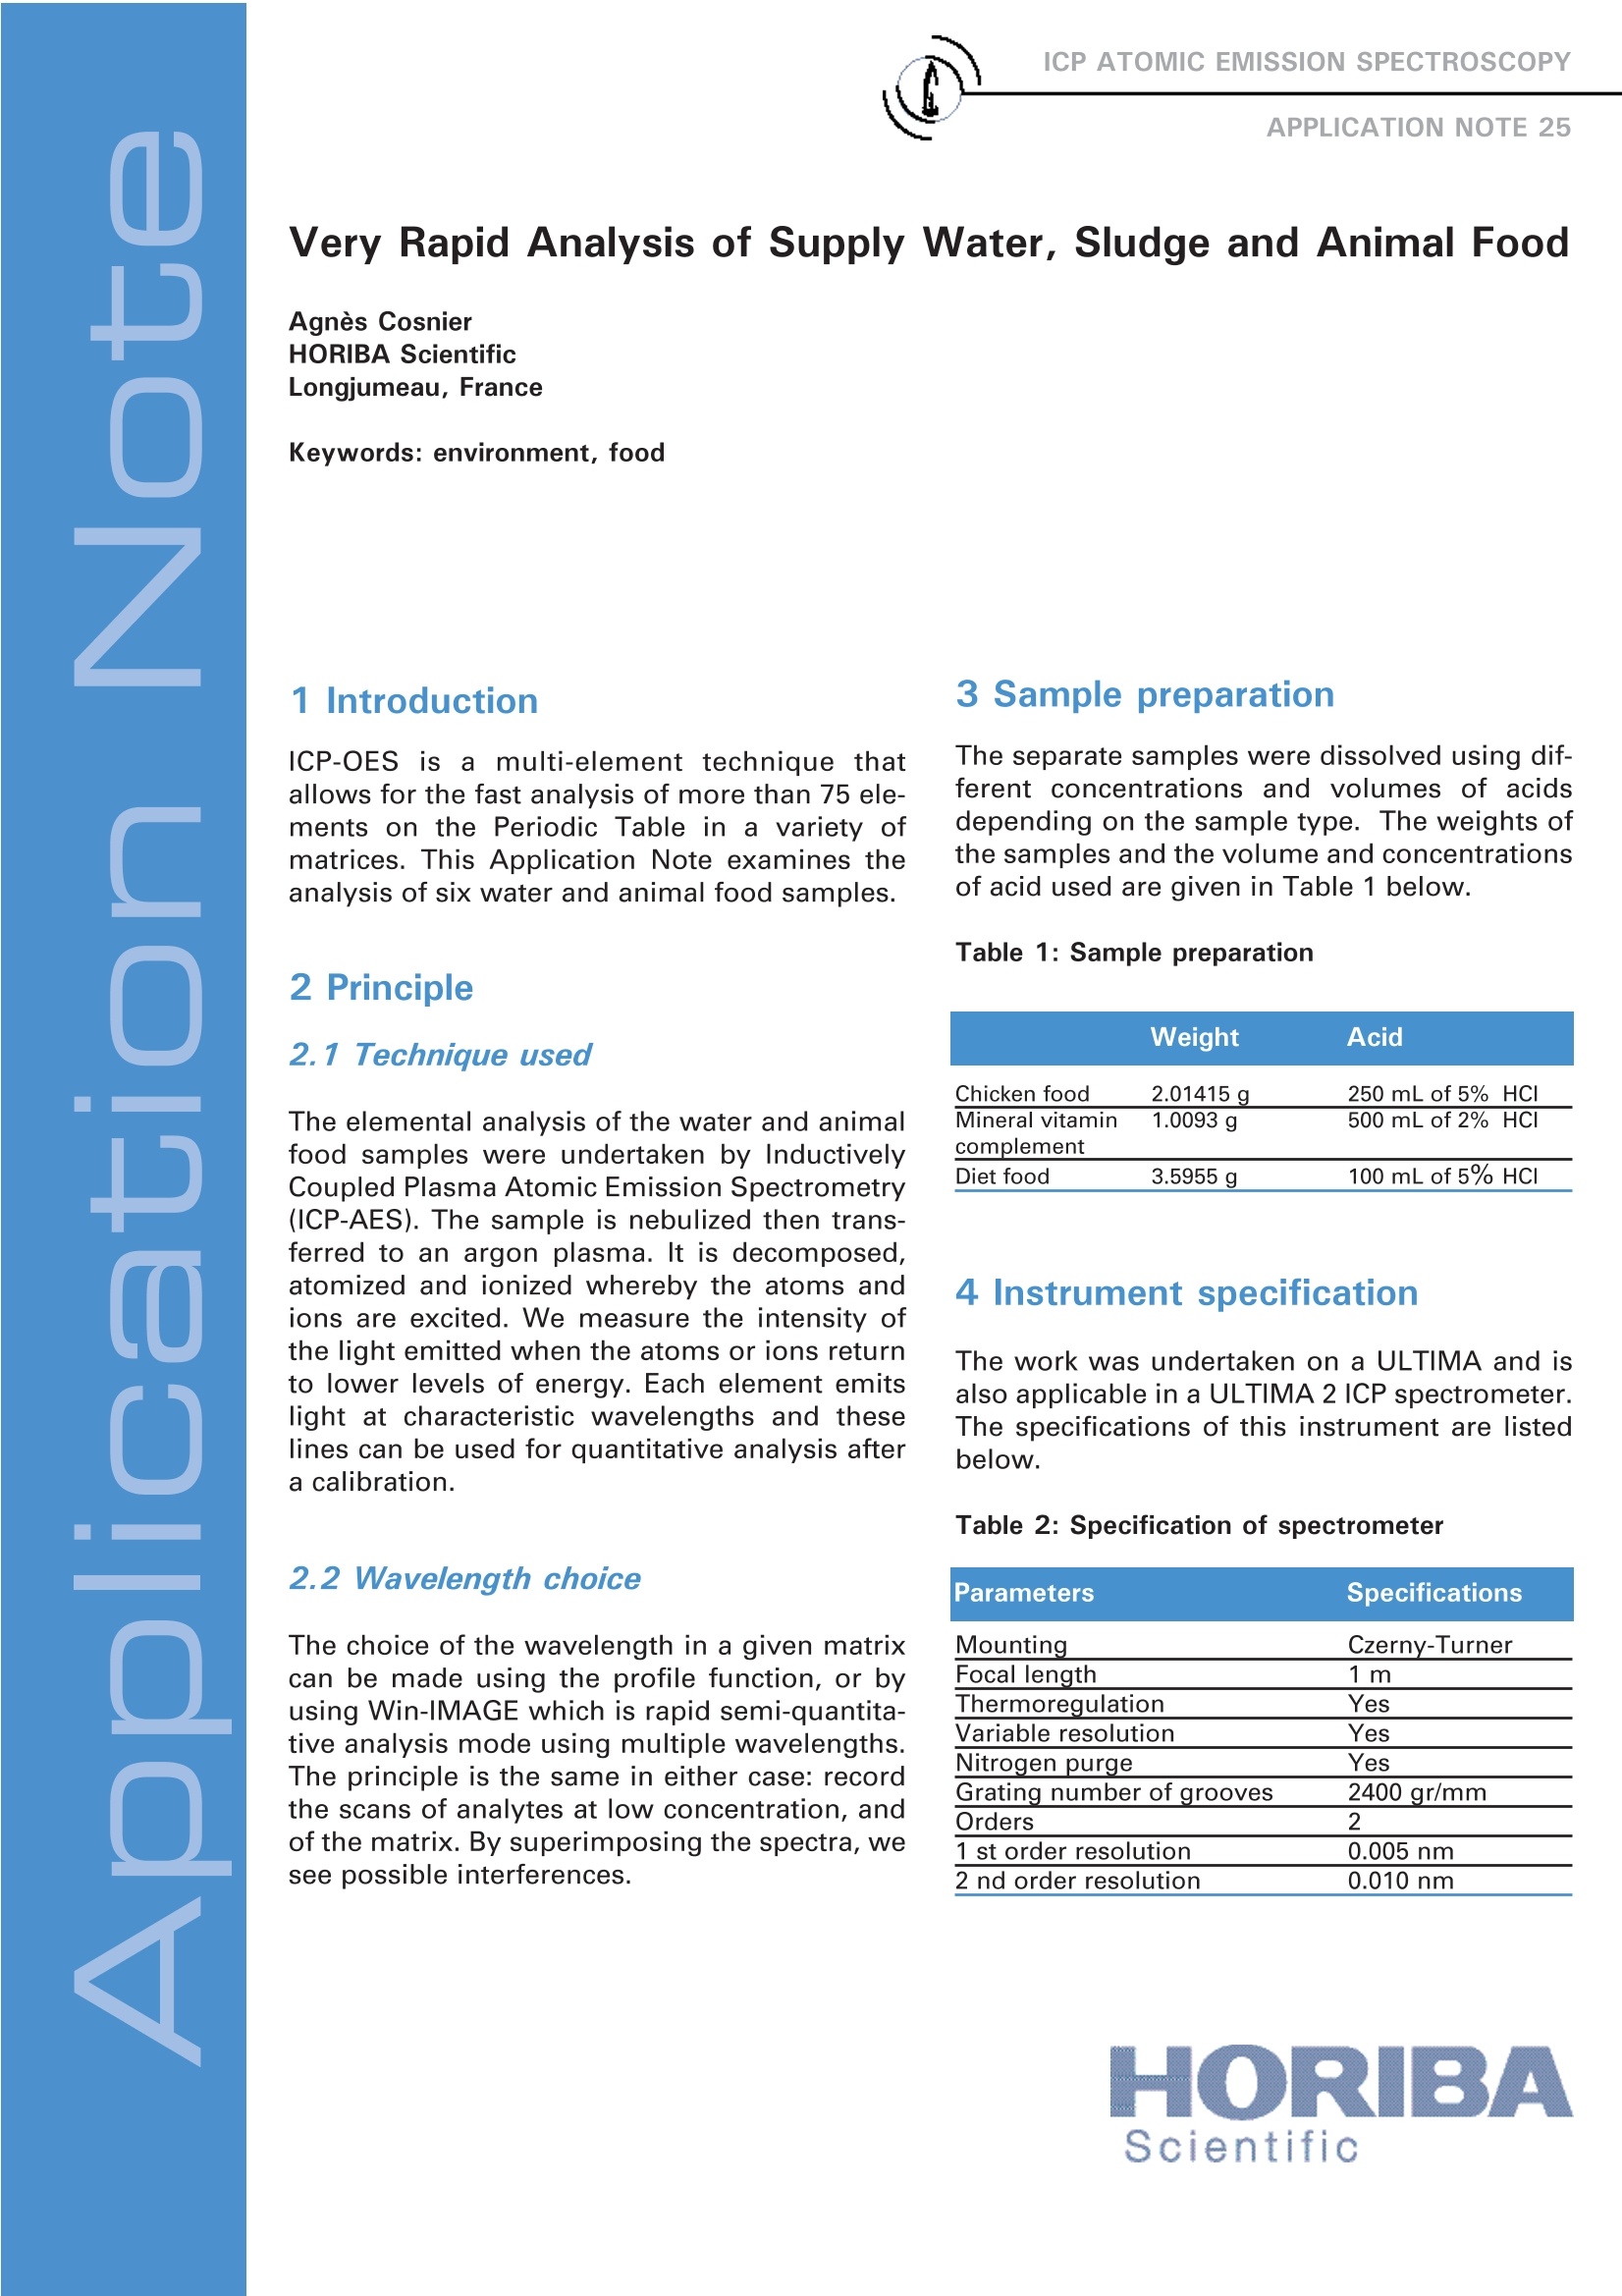
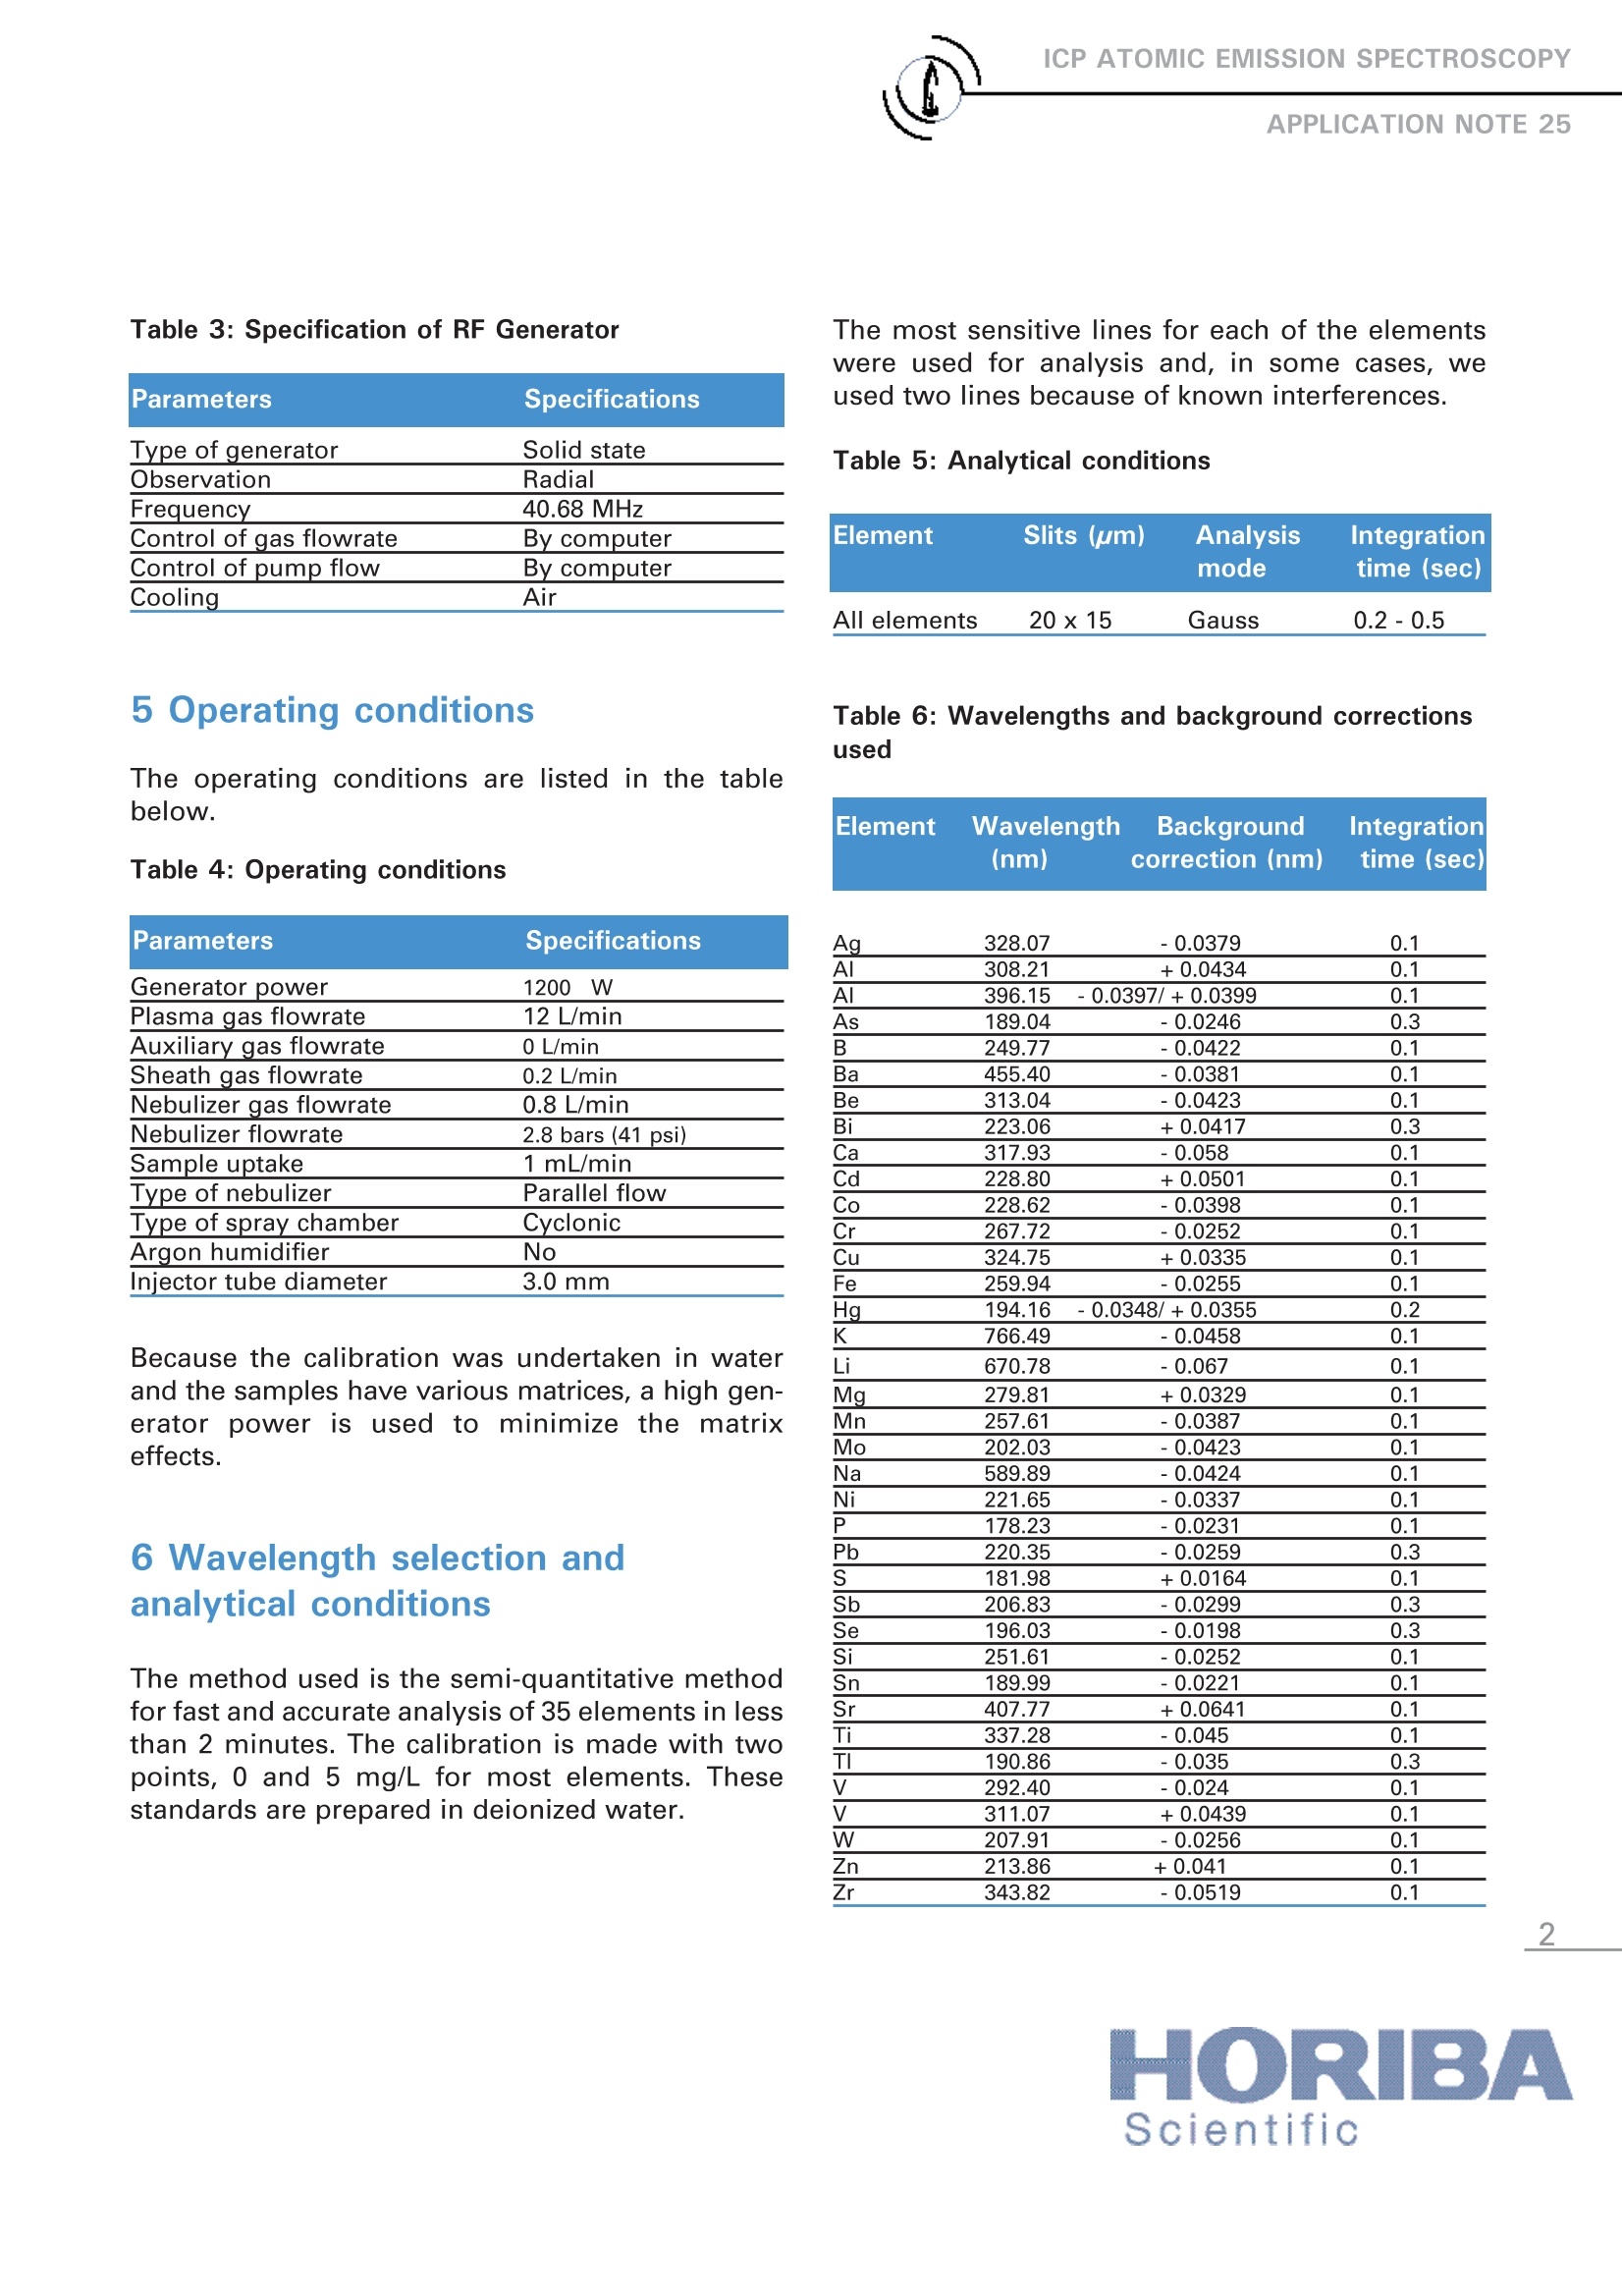
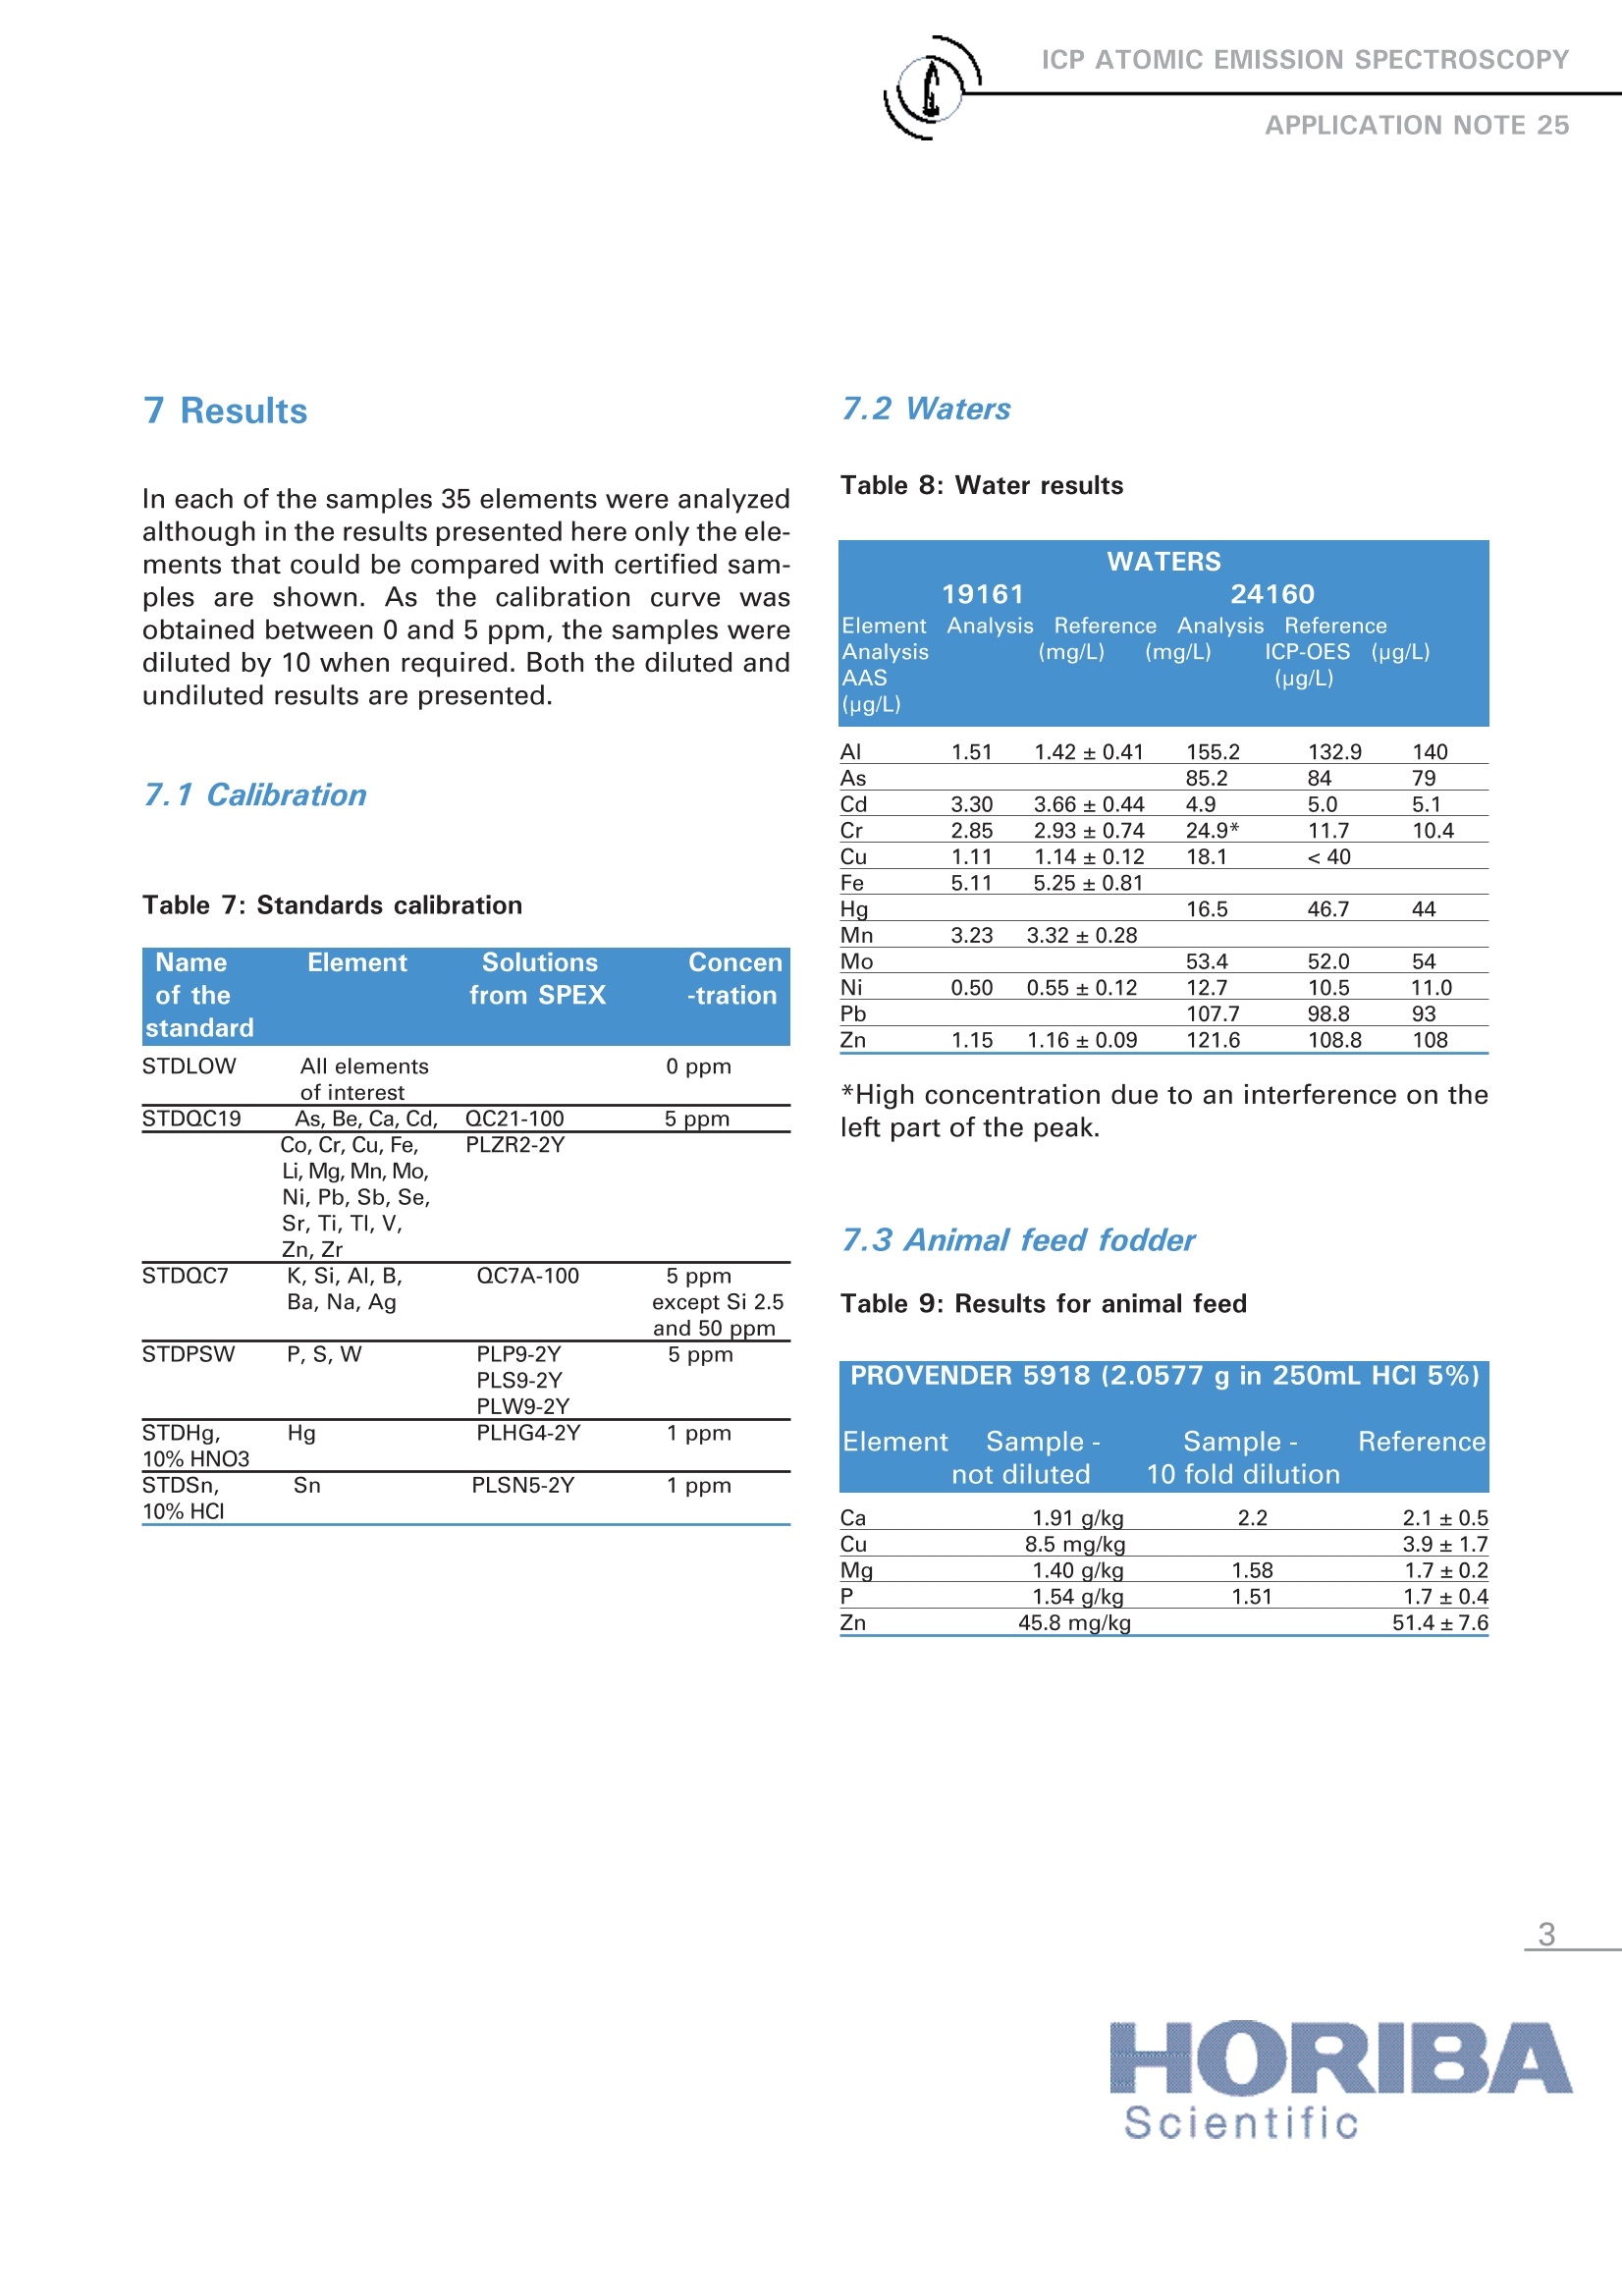
ICP ATOMIC EMISSION SPECTROSCOPYAPPLICATION NOTE 25 Very Rapid Analysis of Supply Water, Sludge and Animal Food Agnes Cosnier HORIBA Scientific Longjumeau, France Keywords: environment, food 1 Introduction ICP-OES isaamulti-element technique thatallows for the fast analysis of more than 75 ele-ments on the Periodic Table in a variety ofmatrices. This Application Note examines theanalysis of six water and animal food samples. 2 Principle 2.1 Technique used The elemental analysis of the water and animalfood samples were undertaken by InductivelyCoupled Plasma Atomic Emission Spectrometry(ICP-AES). The sample is nebulized then trans-ferred to an argon plasma. It is decomposed,atomized and ionized whereby the atoms andions are excited. We measure the intensity ofthe light emitted when the atoms or ions returnto lower levels of energy. Each element emitslight at characteristic wavelengths and theselines can be used for quantitative analysis aftera calibration. 2.2 Wavelength choice The choice of the wavelength in a given matrixcan be made using the profile function, or byusing Win-IMAGE which is rapid semi-quantita-tive analysis mode using multiple wavelengths.The principle is the same in either case: recordthe scans of analytes at low concentration, andof the matrix. By superimposing the spectra, wesee possible interferences. 3 Sample preparation The separate samples were dissolved using dif-ferent concentrations and volumes of acidsdepending on the sample type. The weights ofthe samples and the volume and concentrationsof acid used are given in Table 1 below. Table 1: Sample preparation Weight Acid Chicken food 2.01415 g 250 mL of 5% HCI Mineral vitamin 1.0093 g 500 mL of 2% HCI complement Diet food 3.5955 g 100 mL of 5% HCI 4 Instrument specification The work was undertaken on a ULTIMA and isalso applicable in a ULTIMA 2 ICP spectrometer.The specifications of this instrument are listedbelow. Table 2: Specification of spectrometer Parameters Specifications Mounting Czerny-Turner Focal length 1 m Thermoregulation Yes Variable resolution Yes Nitrogen purge Yes Grating number of grooves 2400 gr/mm Orders 2 1 st order resolution 0.005 nm 2 nd order resolution 0.010 nm Table 3: Specification of RF Generator Parameters Specifications Type of generator Solid state Observation Radial Frequency 40.68 MHz Control of gas flowrate By computer Control of pump flow By computer Cooling Air 5 Operating conditions The operating conditions are listed in the tablebelow. Table 4: Operating conditions Parameters Specifications Generator power 1200 Plasma gas flowrate 12 L/min Auxiliary gas flowrate 0 L/min Sheath gas flowrate 0.2 L/min Nebulizer gas flowrate 0.8 L/min Nebulizer flowrate 2.8 bars (41 psi) Sample uptake 1 mL/min Type of nebulizer Parallel flow Type of spray chamber Cyclonic Argon humidifier No Injector tube diameter 3.0 mm Because the calibration was undertaken in waterand the samples have various matrices, a high gen-erator power is used to minimize the matrixeffects. 6 Wavelength selection andanalytical conditions The method used is the semi-quantitative methodfor fast and accurate analysis of 35 elements in lessthan 2 minutes. The calibration is made with twopoints, 0 and 5 mg/L for most elements. Thesestandards are prepared in deionized water. The most sensitive lines for each of the elementswere used for analysis and, in some cases, weused two lines because of known interferences. Table 5: Analytical conditions Element Slits (um) Analysis mode Integration time (sec) All elements 20x 15 Gauss 0.2-0.5 Table 6: Wavelengths and background correctionsused (nm) correction(nm) time (sec) In each of the samples 35 elements were analyzedalthough in the results presented here only the ele-ments that could be compared with certified sam-ples are shown. As the calibration curve wasobtained between 0 and 5 ppm, the samples werediluted by 10 when required. Both the diluted andundiluted results are presented. 7.1 Calibration Table 7: Standards calibration Name Element Solutions Concen of the from SPEX -tration standard STDLOW All elements 0 ppm STDQC19 of interest As, Be, Ca, Cd,QC21-100 Co, Cr, Cu, Fe, PLZR2-2Y 5 ppm Li, Mg, Mn, Mo, Ni, Pb, Sb, Se, Sr, Ti, TI, V, Zn, Zr STDQC7 K, Si, Al, B, QC7A-100 5 ppm Ba, Na, Ag except Si 2.5 and 50 ppm STDPSW P, S, W PLP9-2Y 5 ppm PLS9-2Y PLW9-2Y STDHg, Hg PLHG4-2Y 1 ppm 10% HNO3 STDSn, Sn PLSN5-2Y 1 ppm 10% HCI Table 8: Water results WATERS 19161 24160 Element Analysis Reference Analysis Reference Analysis (mg/L) (mg/L) ICP-OES (ug/L) (ug/L) AAS (pg/L) Al 1.51 1.42±0.41 155.2 132.9 140 As 85.2 84 79 Cd 3.30 3.66±0.44 4.9 5.0 5.1 Cr 2.85 2.93±0.74 24.9* 11.7 10.4 Cu 1.11 1.14±0.12 18.1 <40 Fe 5.11 5.25±0.81 Hg_ 16.5 46.7 44 Mn 3.23 3.32±0.28 Mo 53.4 52.0 54 Ni 0.50 0.55±0.12 12.7 10.5 11.0 Pb 107.7 98.8 93 Zn 1.15 1.16±0.09 121.6 108.8 108 *High concentration due to an interference on theleft part of the peak. 7.3 Animal feed fodder Table 9: Results for animal feed PROVENDER 5918 (2.0577 g in 250mL HCl 5%) Element Sample-二 Sample- Reference not diluted 10 fold dilution Ca 1.91 g/kg 2.2 2.1±0.5 Cu 8.5 mg/kg 3.9±1.7 Mg_ 1.40 g/kg 1.58 1.7±0.2 P 1.54 g/kg 1.51 1.7±0.4 45.8 mg/kg 51.4±7.6 Cu and Zn were not determined in the diluted solu-tion,because the concentration was already low inthe original solution. 7.4 Chicken feed Table 10: Results for chicken feed Element Sample- Sample- Reference not diluted 10 fold dilution Ca 0.84% 1.05% 0.91±0.09 Cu 17.7 mg/kg 14±4 Fe 162 mg/kg K 0.68% 0.81% 0.75±0.07 Mg 0.15% 0.16% 0.16±0.02 Mn 85.3 mg/kg 84±8 Na 0.14% 0.16% 0.14±0.02 P 0.56% 0.59% 0.59±0.05 7.5 Diet product and mineral vitamin com-plement Table 11: Results for diet product and mineralvitamin complement Ca 20.84% 23.29±2.33 63 mg/kg 47±5 Cd 0.20 mg/kg 0.23±0.23 Co 99.03 mg/kg 105.9±37.9 Cu 3060 mg/kg 3029±389 0.50 mg/kg 0.33±0.20 Fe 9428 mg/kg12745±1878 2.92 mg/kg 2.9±0.3 K 0.08% 0.12±0.09 391 mg/kg 441±44 Table 11: continued Mineral vitamin complement Diet product 2198a (1.0093 g in 401 (3.8955 g in 500 mL of 2%HCI) 100 mL of 5%HCI) Element Analysis Reference Analysis Reference Mg 1.02% 1.10±0.11 87.7 mg/kg 93±9 Mn 8812 mg/kg 9636±812 2.02 mg/kg 2.3±0.5 Na 0.26% 0.26±0.09 364 mg/kg 401±40 P 308 mg/kg 314±31 Pb 9.76 mg/kg 5.0±4.9 S 1.93% 2.0±1.3 Zn 29294 mg/kg 35891±5892 2.65 mg/kg_ 2.7±0.3 8 Summary This application report shows that the ICP-AES is atechnique well adapted for the fast analysis of var-ious food samples. The accuracy can be improvedby adjusting the analytical conditions to specificsample types. For example, the range of calibra-tion can be adjusted or the calibration standardsmatrix matched to the samples. As an alternativeto the quantitative analysis, the Win-IMAGE isavailable which offers the whole spectrum acquisi-tion within 2 minutes. Whole spectrum acquisitiongives the capacity to make a semi-quantitativeanalysis, retrospective analysis and easily analyzemultiple wavelengths for improved accuracy. info-sci.fr@horiba.comwww.horiba.com/scientific France: HORIBA Jobin Yvon S.A.S., 16-18 rue du Canal,91165 Longjumeau Cedex -Tel: +33 (0)1 64 54 13 00-Fax: +33 (0)1 69 09 07 21-Email: info-sci.fr@horiba.com USA: HORIBA Jobin Yvon Inc., 3880 Park Avenue, Edison, NJ 08820-3012. Toll-free: +1-866-jobinyvon-Tel: +1-732-494-8660-Fax:+1-732-549-5125Email: info-sci.us@horiba.comJapan: HORIBA Ltd., Scientific Instruments Sales Dept., Alte-Building Higashi-Kanda, 1-7-8 Higashi-Kanda, Chiyoda-ku, 101-0031 Tokyo-Tel: +81 (0)3 3861 8231 Fax: +81 (0)3 3861 8259-Email: info-sci.jp@horiba.comGermany: HORIBA Jobin Yvon GmbH, Hauptstrasse 1, 82008 Unterhaching - Tel: +49 (0)89 46 23 17-0-Fax: +49 (0)89 46 23 17-99-Email: info-sci.de@horiba.com Italy: HORIBA Jobin Yvon Srl, Via Cesare Pavese 35/AB, 20090 Opera (Milano)-Tel:+39 0 2 57 60 30 50-Fax:+39 02 57 60 08 76-Email: info-sci.it@horiba.com UK: HORIBA Jobin Yvon Ltd, 2 Dalston Gardens, Stanmore, Middlesex HA7 1BQ- Tel: +44 (0)20 8204 8142-Fax:+44 (0)20 8204 6142-Email: info-sci.uk@horiba.com China: HORIBA Jobin Yvon SAS, Room 1801, Capital Tower No.6, Jianguomenwai Av., Chaoyang District, Beijing 100022- Tel: +86 (0)10 8567 9966-Fax: +86 (0)10 8567 9066Email: info-sci.cn@horiba.com Other Countries: Tel:+33 (0)1 64541300-Email: info.sci@horiba.com ORIBAScientific HORIBAScientific This application report shows that the ICP-AES is a technique well adapted for the fast analysis of various food samples. The accuracy can be improved by adjusting the analytical conditions to specific sample types. For example, the range of calibration can be adjusted or the calibration standards matrix matched to the samples. As an alternative to the quantitative analysis, the Win-IMAGE is available which offers the whole spectrum acquisition within 2 minutes. Whole spectrum acquisition gives the capacity to make a semi-quantitative analysis, retrospective analysis and easily analyze multiple wavelengths for improved accuracy.
确定
还剩2页未读,是否继续阅读?
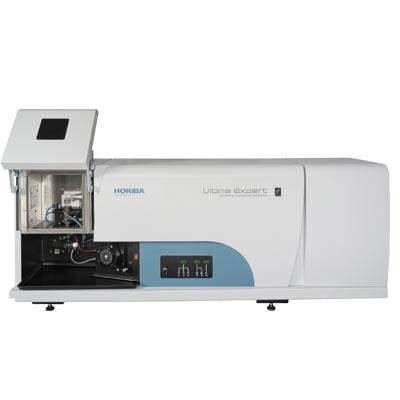
HORIBA(中国)为您提供《水,动物性食物中元素检测方案(ICP-AES)》,该方案主要用于环境水(除海水)中(类)金属及其化合物检测,参考标准--,《水,动物性食物中元素检测方案(ICP-AES)》用到的仪器有HORIBA Ultima Expert高性能ICP光谱仪
相关方案
更多
该厂商其他方案
更多

